GoldMode On (Triple compromise strategy) TF 60-240BINANCE:BTCUSDT
Greetings.
I am publishing this script in order to get feedback for further work on it.
The script combines a compromise between several classic strategies, and each of them uses modifications of classic indicators on specially selected averaging sliding indicators.
1. The script uses an ATR-based filter (it's off by default, as it's better on BTCUSD , but you can enable it in the settings if you want to use it on EURUSD , for example, or on other symbols).
2. A strategy based on crossing the moving.
3. A strategy based on determining the direction of movement of the modified slow and fast RSI .
4. A strategy based on the modified ADX +DI -DI .
The essence of the strategy in finding a compromise decision on the signals coming from each of these three strategies.
=====
Приветствую.
Данный скрипт публикую с целью получить обратную связь для дальнейшей работы над ним.
Скрипт сочетает в себе компромисс между несколькими классическими стратегиями, причём каждая из них использует модификации классических индикаторов на специальным образом подобранные усредняющие скользящие.
1. В скрипте используется фильтр на основе ATR (по умолчанию выключен, т.к. на BTCUSD так лучше, но можно включить в настройках, если хотите использовать его на EURUSD , например, или на других инструментах).
2. Стратегия основанная на пересечении скользящих.
3. Стратегия основанная на определении направления движения модифицированных медленной и быстрой RSI .
4. Стратегия основанная на модифицированном ADX +DI -DI .
Суть стратегии в поиске компромиссного принятия решения по сигналам поступающим от каждой из этих трёх стратегий.
Recherche dans les scripts pour "bitcoin"
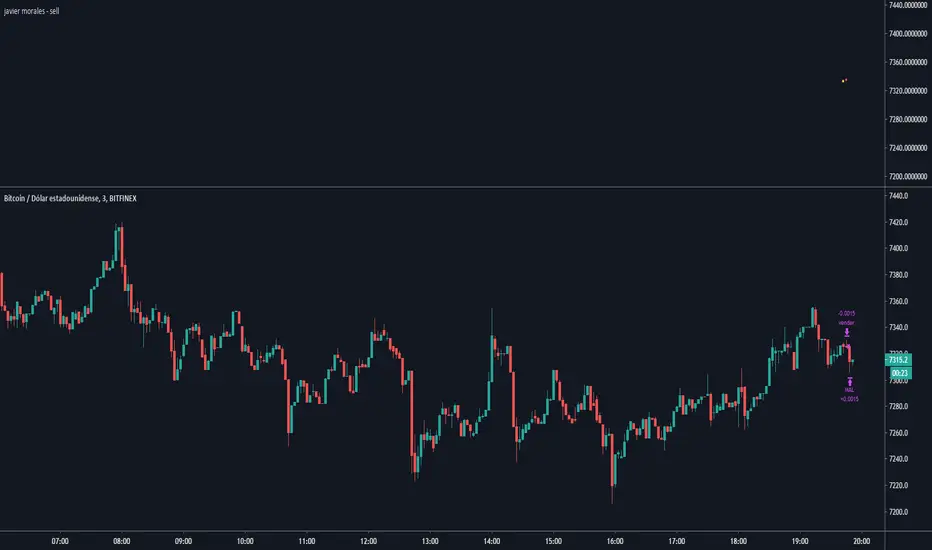
Javier Morales - sellEste script, creado por mi, opera sobre la gráfica BTC/USDT aunque puede ser utilizado en cualquier otra gráfica. Trabaja a la baja, en corto, aplicando una de las técnicas mas simples del trading, siempre que el precio de apertura de la vela anterior sea mayor que el precio de apertura de la vela posterior invierte una cantidad X, al final de la vela actual tanto si el precio ha subido como bajado cerrará la posición, pero si ha subido duplicará la inversión hasta que o bien se acabe el capital inicial o bien obtenga ganancias mayores que cero.
This script, created by me, operates on the BTC / USDT chart although it can be used on any other chart. Work downwards, in short, applying one of the simplest trading techniques, provided that the opening price of the previous candle is greater than the opening price of the subsequent candle invests an amount X, at the end of the current candle both if the price has risen or fallen, it will close the position, but if it has risen, it will double the investment until either the initial capital runs out or it makes profits greater than zero.
Javier Morales.
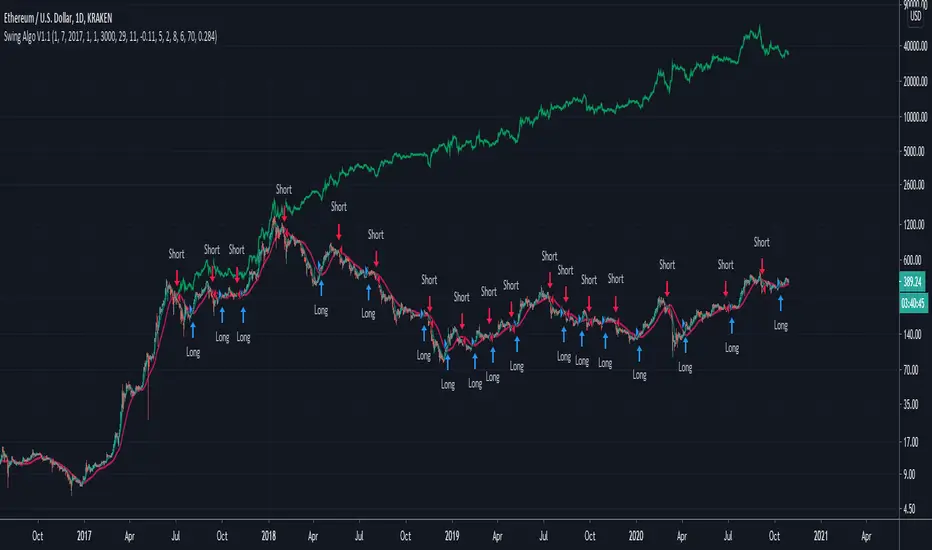
Swing Algo V1.1Here I present an upgrade to 'Swing Algo V1'. For differences to V1, see below.
This indicator can be used for e.g. swing algorithmic trading. It will give Buy/Long and Sell/Short signals on the chart. This algorithm uses a combination of several (custom) functions and rules to find good entry points for trend trading. After many iterations and tests I came up with this particular setup, which is highly optimized for the $ETH/$USD trading pair on the daily (D) timeframe. It is however possible to change algorithmic parameters within the indicator settings to tune this swing algorithm for other assets and timeframes. You don't need any programming skills or similar abilities to navigate this indicator.
Also you can choose the backtest time interval to test the perfomance of this algorithm for different time windows and different trading pairs. Here various backtesting parameters (e.g. trading fees) can be customized. Additionally to the TradingView Strategy Tester you can also plot your equity directly on the chart to get a sense for the performance. For this you can also scale the equity graph to e.g. match the starting point of your equity with some price point on the chart to get a direct comparison to 'Buy & Hold' strategies over time.
Note: In general it seems that cryptocurrencies are rather swing-algorithm-friendly, while I cannot recommend trading classical assets like stock or indices (e.g. S&P 500) with this indicator (although you can of course try to find good setups).
This indicator (and all other content I provide) is no financial advice. If you use this indicator you agree to my Terms and Conditions which can be found on my Twitter profile linked on my TradingView profile or in my signature.
Differences to Swing Algo V1:
- Changed the oscillator part of the algorithm with a better suited one (at least) for the ETH/USD trading pair.
- Improved net profits by roughly 20% in comparison to V1 for ETH/USD on daily timeframe
- Reduced Max. Drawdown by roughly 1/4 in comparison to V1 for ETH/USD on daily timeframe
- However for other assets and timeframes V1 might perform better than V1.1. I leave you with both options to play so that you can find the best solution for a given trading pair.
For access please contact me via DM on TradingView or on Twitter (linked on my TradingView profile and my signature). People who purchased access to any 'Swing Algo 1.x' get access to all other 'Swing Algo V1.x' indicators automatically ('Swing Algo V1' counts as 'Swing Algo V1.0').
ARKADIY V1.0This strategy is made for trading Bitcoin (BTC) using data from BITMEX exchange on 4 hour timeframe.
There is also a special indicator for the strategy to receive alerts on your tradingview platform which is very handful to enter the market as soon as there is a buy/sell signal.
Strategy is based on Pine script v.4 and it uses several indicators and oscillators (modified RSI, CCI, ADX, TRIX and EMA) to generate a buy/sell signal for BTC.
There is no repaint, which means that a signal will not disappear when price goes in wrong direction.
And this is one of the advantages of the strategy over other 90% strategies.
The strategy is a SWING strategy, which means that a signal for opening a position (buy or sell) at the same time closes previous position.
Because of its specificity the strategy doesn’t have take profit/stop loss options and doesn’t use leverage.
The strategy has a backtest statistics on TradingView. 2018 – 1197%, 2019 – 79%, until March 13, 2020 – 88% of net profit.
Max drawdown (the sum of non-profitable trades until receiving a profitable trade) during a year not more than 14%.
To get access to the strategy write in comments and in private messages.
_____________________________________________________________________________________________________________
Данная стратегия работает на инструменте биткоин ( BTC ) по котировкам биржи BITMEX на 4 часовом таймфрейме, а также имеет удобные алерты для сигналов на сделку (будильник).
Это позволит Вам заниматься своими делами, не следя за тем, что происходит на рынке, но в нужное время совершить сделку, получив предупреждение на телефон / компьютер.
Стратегия построена на последней версии Pine Script, в ее основе лежит совокупность множества индикаторов и правил (модифицированные RSI, CCI, ADX, TRIX and EMA), которые в определенный момент дают сигнал на покупку или продажу BTC . Стратегия протестирована с использованием аргумента "Recalculate After Order is Filled" и подразумевает "non-repaint" базис. Другими словами, если стратегия показала вход в сделку (по итогу закрытия свечи) - то сигнал так и остается без изменений. Это выгодно отличает данную стратегию от 90% таковых в Trading View и дает уверенность, что появившийся сигнал не исчезнет в случае, если рынок пойдет в противоположную сторону.
Данная стратегия относится к сегменту SWING стратегий, когда один сигнал является одновременно закрытием одной сделки и открытием противоположной.
В связи со спецификой стратегии она не использует стоп-ордера, поэтому предполагает торговлю без плечей.
Ваш риск ограничен временным интервалом от момента, как цена пошла в противоположную сторону, до момента пока стратегия не дала сигнал на перекладку в новую сделку.
Статистика, подтвержденная бэктестом в Trading View, за последние пару лет: 2018 - 197%, 2019 - 79%, на 13.03.20 - 88%. Это данные по Чистой прибыли на вложенный капитал.
Максимальная длящаяся просадка (совокупность минусовых сделок до момента возникновения плюсовой сделки) в течение года составляет не более 18%
Основные отличия от индикаторов наших коллег:
+ Результаты бэктеста не в excell, а в платформе Trading View – прозрачная статистика по сделкам
+ Построен на принципах non-repaint basis – сигналы не исчезают и не появляются из неоткуда
+ Работает на 4Н таймфрейме. Это значит сделки не могут быть чаще, чем в раз в 4 часа. Занимайтесь своими делами, пока стратегия стоит на страже рыночного анализа. Она сама Вам сообщит, когда нужно открыть / закрыть сделку.
+ Разберется любой! Стратегия построена по принципу one-click setup
+ Поддержка с возможностью организации телефонного звонка.
Для предоставления доступа к данной стратегии - пожалуйста пишите в комментариях запрос с копией в личные сообщения. Мы быстро с Вами свяжемся.

Reticulata Enhanced - StrategyThis script is the backtesting for Reticulata Enhanced.
Building on our core script - Reticulata, the enhanced version features several requested extras to give you more flexibility with your trading style.
What is Reticulata Enhanced?
The Reticulata core leverages a blend of MA/RSI strategies mixed with the Bull Bear Bots optimised logic for risk management. This enhanced version takes it a step further with additional risk management features:
Trailing Stop
Fixed Stop
Fixed Stop, but move at TP
Trend confirmation
Usage
Using the indicator is as simple as:
1. Select the strategy, or combination of strategies you want to use
2. If desired, select one or more of the available trend filters
3. Adjust your stop options
4. Review backtest results
Markets
Like the core, the enhanced algo also supports a range of markets and timeframes, including the majors (EURUSD, etc...) in Forex and a variety of Cryptocurrencies including Bitcoin (BTC/XBT etc...).
All of our scripts are designed for manual traders but are ready to use with automated trading bots.

Volume and Price Moving average StrategyNAME : Volume and Price Moving average Strategy
SUMMARY
Long when Indicator >= BuyandSell
Short when Indicator < BuyandSell
It is an index created by combining the moving average of trading volume and price.
To avoid future reference, you must set the Candle Chart time and Resolution Time equally.
If you set it differently, there is a gap in yield due to future reference.
For MA Type and MA period, it is to select what the moving average of the price will be set to.
For Indicator Value, it is about the set value of this indicator.
Price Type is what to use for price. Market price, low price, closing price, high price, typical price (market price + high price + low price) / 3, center (market price + high price) / 2
There are six types.
BuyandSell is to set the index value to enter and clear. The default is 0.
Although it can be set to 0 or more, there is a risk of over-optimization.
As you can see from the profit curve, Bitcoin is a good strategy that works well when volatility is high.
MDD is too large to operate with this indicator alone, so it would be good to use it with other indicators.
If you leave a good indicator comment, I'll test it. Thank you.
==========================
Korean
거래량과 가격의 이동평균을 조합하여 만든 지표입니다.
미래참조를 피하기 위해서는 반드시 캔들 차트의 시간과, Resolution Time을 똑같이 설정해야 합니다.
다르게 설정할 경우 미래참조로 인한 수익률 괴리가 생기니 꼭 똑같이 설정해주세요.
MA Type, MA period의 경우 가격의 이동평균을 무엇으로 설정할 것인지 선택하는 것 입니다.
Indicator Value의 경우 이 지표의 설정 값에 대한 것입니다.
Price Type은 가격으로 무엇을 사용할 것인지 입니다. 시가, 저가, 종가, 고가, Typical Price (시가+고가+저가)/3, Center(시가+고가)/2
이렇게 6종류가 있습니다.
BuyandSell은 진입, 청산할 지표값을 세팅하는 것입니다. 기본값 0입니다.
0이상, 이하로도 설정할 수 있지만, 그렇게 할 경우 과최적화의 위험이 있습니다.
수익 곡선을 보시면 아시겠지만 비트코인이 변동성이 클 때 잘 먹히는 좋은 전략입니다.
이 지표만으로는 MDD가 너무 커서 운용하기 힘드니 다른 지표와 같이 활용하시면 좋을 것 같습니다.
좋은 지표 코멘트로 남겨주시면 테스트 해보겠습니다. 감사합니다.

The 1h Wick Wicky - Bitcoin BeatsThis script Uses a bunch of different indicators in order to catch wicks.
Included are:
SAR
JME
Range Filter
ADX
RSI
MACD
Automatic Plotted TP
Unconfirmed entries followed by confirmed entries
This is a combination of different indicators therefore the credit shall not go to me but I have changed certain parameters in order to benefit backtesting profitability.
Trade at your own risk!

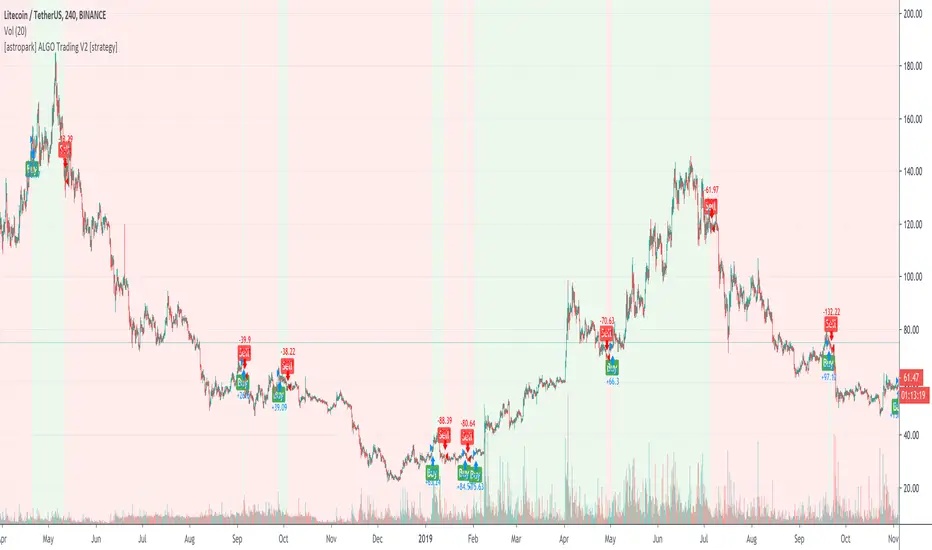
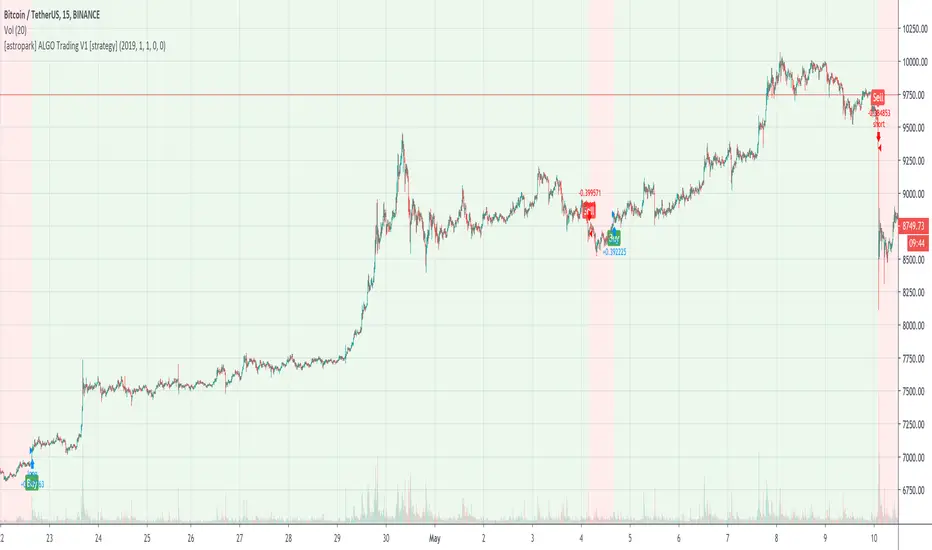
[astropark] ALGO Trading V2 [strategy]Dear Followers,
today another awesome Swing and Scalping Trading Strategy indicator, runnable on a bot , which works great on many timeframes (ones between 1h and 1D are suggested, but just write me in order to help you find correct settings).
It must be said that this strategy works even better on 1m Renko chart!
If you are a scalper or you are a swing trader, you will love suggested entries for fast and long-lasting profit.
Keep in mind that a proper trailing stop strategy and risk management and money management strategies are very important (DM me if you need any clarification on these points).
This is not an evolution of "ALGO Trading V1" or "ALGO Trading V3" , but a twin sister of them. Search them on TradingView to know them better.
Here you can find ALGO Trading V1
This strategy has the following options:
enable/disable signals on chart
enable/disable bars and background coloring based on trend
enable/disable a "filter noise" option , which try to reduce overtrading (you can easily check it on backtesting)
enable/disable a Take Profit / Stop Loss option (you can easily check it on backtesting too)
enable/disable a secret SmartOption which may improve profit on your chart (again, check it on you chart if it helps or not)
This strategy only trigger 1 buy or 1 sell. If you enable Take Profit / Stop Loss option, consider that many TP can be triggered before trend reversal, so take partial profit on every TP an eventually buy/sell back lower/higher to maximize your profit.
In order to get notified when a signal is triggered, you need to use the "alarms" version of this indicator (just search for astropark's "ALGO Trading V2" indicator and choose the one with "alarms" suffix).
Strategy results are calculated on the time window from January 2019 to now, so on more than 1 year, using 1000$ as initial capital and working at 1x leverage (so no leverage at all! If you like to use leverage, be sure to use a safe option, like 3x or 5x at most in order to have liquidation price very far).
This is not the "Holy Grail", so use a proper risk management strategy.
This script will let you backtest how the indicator will perform on any chart and timeframe you may like to test and/or trade. Of course results will be very different depending on the chart and timeframe you will open. I tested a lot of charts and always you can find a combination that keep this strategy in profit on swing trading style (and this means that if you can have a daily look at the chart you can always manage to maximize your profit on each trade!)
This is a premium indicator , so send me a private message in order to get access to this script.
[astropark] ALGO Trading V1 [strategy]Dear Followers,
today another awesome Swing and Scalping Trading Strategy indicator, runnable on a bot , which works great on Low Timeframes (1h is suggested) but also on even lower ones (till 15m) and on higher ones (no further than 1D), just write me in order to help you find correct settings).
It must be said that this strategy works even better on 1m Renko chart!
If you are a scalper or you are a swing trader, you will love suggested entries for fast and long-lasting profit.
Keep in mind that a proper trailing stop strategy and risk management and money management strategies are very important (DM me if you need any clarification on these points).
This is not an evolution of "ALGO Trading V2" or "ALGO Trading V3" , but a twin sister of them. Search them on TradingView to know them better.
This strategy has the following options:
enable/disable signals on chart
enable/disable bars and background coloring based on trend
enable/disable a "filter noise" option, which try to reduce overtrading (you can easily check it on backtesting)
enable/disable a Take Profit / Stop Loss option (you can easily check it on backtesting too)
enable/disable a secret SmartOption which may improve profit on your chart (again, check it on you chart if it helps or not)
This strategy only trigger 1 buy or 1 sell. If you enable Take Profit / Stop Loss option, consider that many TP can be triggered before trend reversal, so take partial profit on every TP an eventually buy/sell back lower/higher to maximize your profit.
In order to get notified when a signal is triggered, you need to use the "alarms" version of this indicator (just search for astropark's "ALGO Trading V1" indicator and choose the one with "alarms" suffix).
Strategy results are calculated on the time window from January 2019 to now, so on more than 1 year, using 1000$ as initial capital and working at 1x leverage (so no leverage at all! If you like to use leverage, be sure to use a safe option, like 3x or 5x at most in order to have liquidation price very far).
This is not the "Holy Grail", so use a proper risk management strategy.
This script will let you backtest how the indicator will perform on any chart and timeframe you may like to test and/or trade. Of course results will be very different depending on the chart and timeframe you will open. I tested a lot of charts and always you can find a combination that keep this strategy in profit on swing trading style (and this means that if you can have a daily look at the chart you can always manage to maximize your profit on each trade!)
This is a premium indicator , so send me a private message in order to get access to this script.
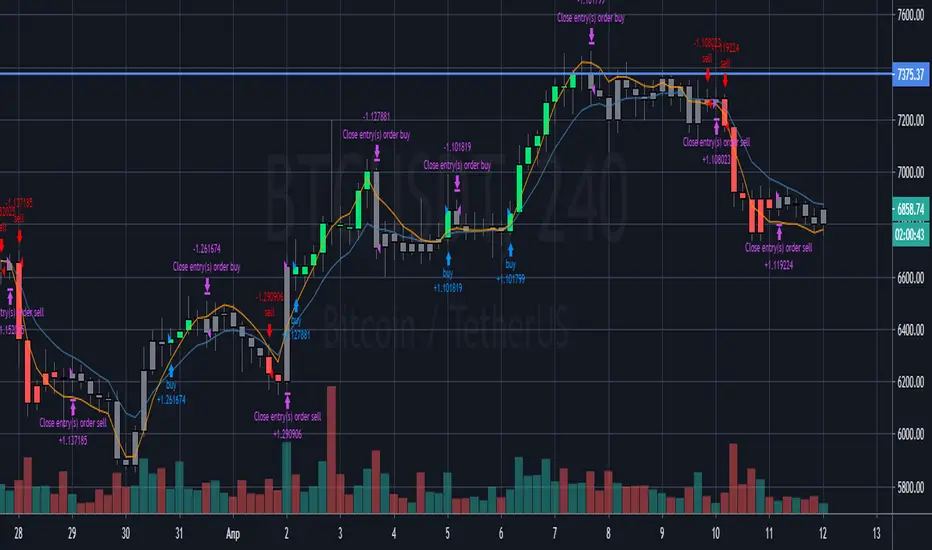
Bithanos 5m Strategy PRO灭霸比特币 5分钟策略 PRO版
Bithanos 5m Strategy PRO 2.0
COINBASE:BTCUSD
price should be coinbase BTCUSD .
1.Cointain price pressures/support band.
"L涨" means long,
"close entry L涨" means close the long order.
"S跌" means short,
"close entry S跌" means close the short order.
Just for bitcoin 5m timeframe .
价格选择:建议COINBASE BTCUSD .
1.包含 价格支撑压力带.
"L涨" 后市看涨,
"close entry L涨" 后市不看涨.
"S跌" 后市看跌,
"close entry S跌" 后市不看跌.
仅适用于比特币5分钟级别。
止损分享:0.25%-1% 幅度酌情根据杠杆止损,或者红色线最终止损。

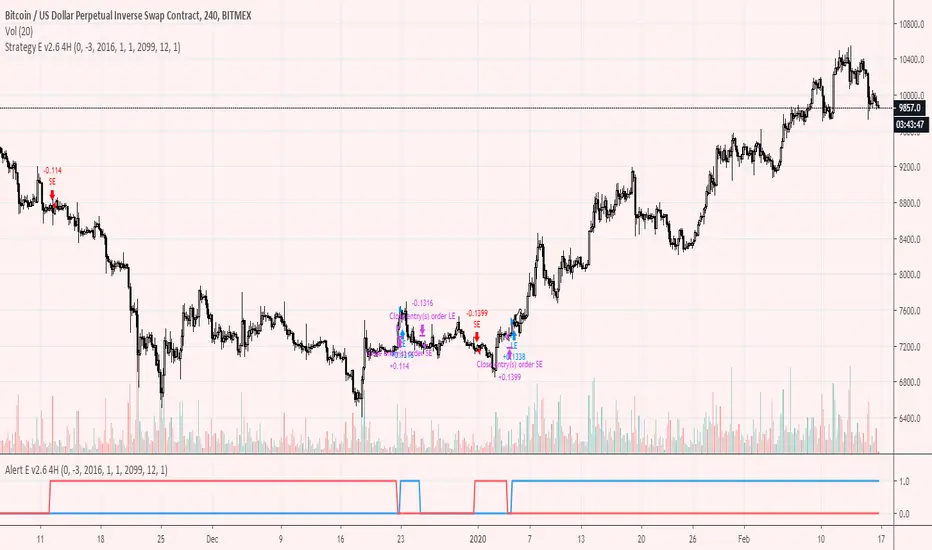
Trend-following Strategy E v2.6 4HHi All,
Welcome to my second published Trend-following strategy for bitcoin , designed specifically for BITMEX:XBTUSD on 4H.
This is an extension of my first script but then for the 4H timeframe.
In order to set up Alerts for this strategy, I've created a second script called Trend-following Alert E v2.6 4H which you can find here:
Here you will find the "active_long" and "active_long" variables (red and blue lines) that show which positions are being taken by the strategy script.
You can set 'Once per bar close' alerts for this to get your alerts on TV.
For instance, I use 'crossing up @ 0.1' on "active_long" to set an 'Open Long" alert and a 'crossing down @ 0.9' to set a 'Close Long' alert.
The same holds for the 'Open Short' and the 'Close Short' alerts but then for the 'active_short' variable.
As you can see from the backtest I've done my best to create a decent ROI with limited DD.
You can also run this backtest/strategy with '100% of equity' but I would advise against trading this as your risk will fundamentally increase.
With a constant order size this strategy should be quite safe to use.
Going from the results it's clear that this strategy excels during clear bull/bear trends but might suffer a little bit during market chop.
This is also where ROI tends to stagnate a little bit only then to take off again during a clear trend.
There are two inputs that can be modified on this strategy, however I think the current settings are optimal for this market on the 2H candle.
I've also added start and end dates to test specific time periods.
Please let me know if you have any questions.
Stochastic Pop and Drop by Jake Bernstein v1 [Bitduke]I found a simple strategy by Jake Bernstein, modified it a little and created a strategy with Risk Management System (SL+TP); After that I test it on the different cryptocurrency pairs.
About the Indicator
Basically it's the strategy of 2 indicators: Stochastic Oscillator to define the bias and Average Directional Index to confirm it.
One again, It uses Stochastic Oscillator to define the trading bias. In particular, the trading bias was deemed bullish when the weekly 14-period Stochastic Oscillator was above some default value (in him paper - 50) and rising and vice versa.
Once the trading bias is established, Steckler used the Average Directional Index (ADX) to define a slowdown in the trend. ADX measures the strength of the trend and a move below 20 signals a weak trend.
Modifications
I didn't implement Average Directional Index (ADX) and test just different sources for data, oscillator periods and different levels in relation to the crypto market.
So, it shows good results with two tight thresholds at 55 and 45 level.
The bar chart below the defining the bullish and bearish periods (green and red) and gives a signal to enter the trade (purple bars).
Backtesting
Backtested on XBTUSD , BTCPERP (FTX) pairs. You may notice it shows good results on 3h timeframe.
Relatively low drawdown
~ 10% (from 2019 to date) FTX
~ 22% (4 years from 2016) Bitmex
I backtested on the different altcoin pairs as well, but the results were just not good.
Relatively good results were shown by some index pairs from the FTX exchange ( FTX:SHITPERP ), but I think there is a few data for backtesting to be asure in them.
Bitmex 3h (2017 - 2020) :
i.imgur.com
FTX 3h (2019 - 2020):
i.imgur.com
Possible Improvements
- Regarding trading algorithm it would be good to check with strategy with ADX somehow. Maybe for the better entries
- As for Risk Management system, it can be improved by adding trailing stop to the strategy.
Link: school.stockcharts.com

MBY_Jet QunatHi, This is Yong From MBY_LAB
As I wish, I am happy to finally be able to publish this strategy.
This strategy is based on the previously published MBY_TMA RSI.
This strategy only works for 45-minute rods and is only applicable to Bitcoin / Bitfinex.
Thanks.
**Since this strategy is based on the starting price, there is no repainting and the backtest results are not false.**
Backtest info
10,000$
slippage 0.2%
trade fee 0.2%

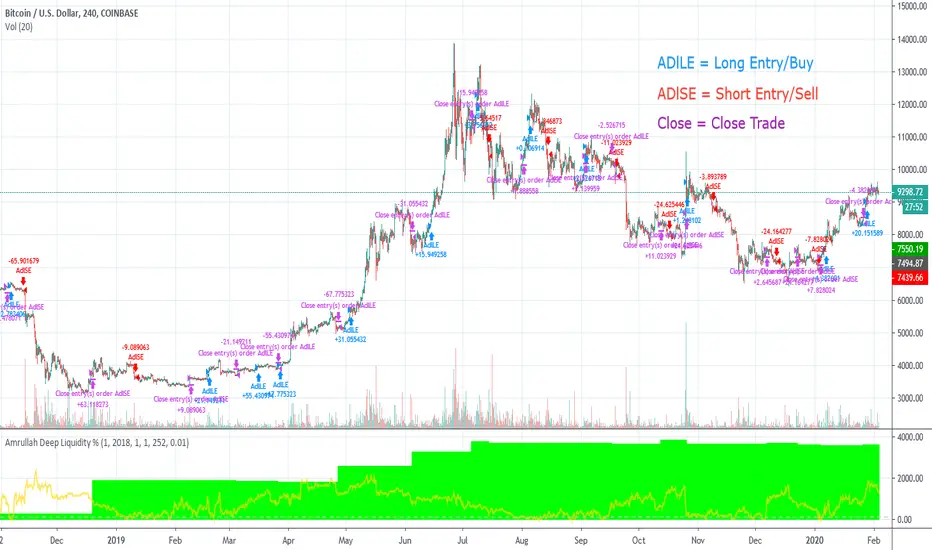
Amrullah Deep Liquidity for BTCUSDAmrullah Deep Liquidity (ADL)
Amrullah Deep Liquidity (ADL) is a high profit factor strategy based on models designed by Muhd Amrullah.
Choosing your trading pair that you are planning to backtest
Check that you have been given access to Amrullah Deep Liquidity (ADL). Select BTCUSD with the default 4H time frame. Once done, open Indicators > Invite-Only Scripts > Amrullah Deep Liquidity %.
Choosing your initial capital that you want to begin backtesting
Go to Settings > Properties > Initial Capital and type in the amount of capital you're starting with. For the BTCUSD trading pair, the initial capital is denominated in USD.
Adjusting your equity at risk until the trades match your risk profile and comfort level
Go to Inputs > Equity Risk and adjust the value you are comfortable with. To analyse performance, you also want to choose the Start Year, Start Month and Start Date. Select lower equity risk for trades that you intend to take without the use of leverage. You can select an equity risk from 0.001 to 0.05 or all the way to 1.
Finding the time frame with the highest profit factor
Profit factor is defined as the gross profit a strategy makes across a defined period of time divided by its gross loss. You may choose to scroll through other time frames to find better models. You can select a different time frame from 1 min to 1H or all the way to 1M. Once you find the model you desire, you are encouraged to check that the model has a backtested profit factor of >3.5. You can then begin looking through the Performance Summary to find other detailed statistics.
Analysing the equity curve from the Amrullah Deep Liquidity (ADL) strategy
A green equity curve indicates that the trades are accumulating profits. A red equity curve indicates that the trades are accumulating losses. A healthy equity curve is one that is green and grows steadily to the right and upward direction.
Analysing the display arrows on the chart
Amrullah Deep Liquidity (ADL) tells you when to take a trade and how much to put in a trade. ADL can do this as the model identifies inventory risk in traders and market makers in the chosen market. On your Tradingview chart, ADL will display an arrow that tells you when to enter a trade. You can also see the amount to trade beside the arrow.
Opting for a trial
Yes you may opt for a trial which has limited availability.
The author's background and experience
My career in software and deep learning development spans across more than 5 years. At work, I lead a team to solve core computer vision tasks for large companies. I continually read all kinds of computer science books and papers, and follows progress on tools used in financial markets.
Trend-following Strategy E v2.6Hi All,
Welcome to my first published Trend-following strategy for bitcoin, designed specifically for BITMEX:XBTUSD.
In order to set up Alerts for this strategy, I've created a second script called Trend-following Alert E v2.6 which you can find here:
Here you will find the "active_long" and "active_long" variables (red and blue lines) that show which positions are being taken by the strategy script.
You can set 'Once per bar close' alerts for this to get your alerts on TV.
For instance, I use 'crossing up @ 0.1' on "active_long" to set an 'Open Long" alert and a 'crossing down @ 0.9' to set a 'Close Long' alert.
The same holds for the 'Open Short' and the 'Close Short' alerts but then for the 'active_short' variable.
As you can see from the backtest I've done my best to create a decent ROI with limited DD, i.e., the current max. losing trade for this is -3.8% and max. DD is a mere -8.09%.
You can also run this backtest/strategy with '100% of equity' but I would advise against trading this as DD increases significantly.
With a constant order size, and due to the low inherent DD, this strategy should be quite safe to use.
Going from the results it's clear that this strategy excels during clear bull/bear trends but might suffer a little bit during market chop.
This is also where ROI tends to stagnate a little bit only then to take off again during a clear trend.
There are two inputs that can be modified on this strategy, however I think the current settings are optimal for this market on the 2H candle.
Please let me know if you have any questions.

[astropark] Trend Is Your Friend V3 [strategy]Dear Followers,
today another awesome Swing and Scalping Trading Strategy indicator, runnable on a bot , which works great on High Timeframes (1D is suggested) but also on lower ones (just write me in order to help you find correct settings) and even better on 1m Renko chart!
If you are a scalper, you will love suggested entries for fast profit. You can run it on 1h timeframe (below is not suggested, there is "no-trend" below 1h!) if you are used to scalp trading and close each trade whenever you feel happy (a proper trailing stop strategy is suggested anyway).
This is not an evolution of "Trend Is Your Friend V1" or V2 , but a twin sister or the "Trend Is Your Friend V1" indicator you can see here below
and twin sister or the "Trend Is Your Friend V2" indicator you can see here below
This strategy differs for the engine used as basis, but has the same usage settings:
enable/disable signals on chart
enable/disable showing trend cloud
enable/disable bar coloring based on trend
enable/disable background coloring based on trend
edit trend period length (direct message me in order to help you fine best settings)
edit a smart variant option to enhance the trend cloud on your chart
enable/disable an option to smart enter trade
This strategy only trigger 1 buy or 1 sell. In order to get notified when a signal is triggered, you need to use the "alarms" version of this indicator.
Strategy results are calculated on the timeframe from December 2012 to now, so on 8 years, using 10000$ as initial capital and working at 1x leverage (so no leverage at all! If you like to use leverage, be sure to use a safe option, like 3x or 5x at most in order to have liquidation price very far).
This is not the "Holy Grail", so use a proper risk management strategy.
This script will let you backtest how the indicator will perform on any chart you may test. Of course results will be very different depending on the chart and timeframe you will open. I tested a lot of charts and always you can find a combination that keep this strategy in profit on swing trading style (and this means that if you can have a daily look at the chart you can always manage to maximize your profit on each trade!)
The alarms version of this indicator, which will let you set all notifications you may need in order to be alerted on each triggered signals, can be found by searching for the astropark's "trend is your friend v3" and then choosing the indicator with "alarms" suffix in the name.
This is a premium indicator , so send me a private message in order to get access to this script.

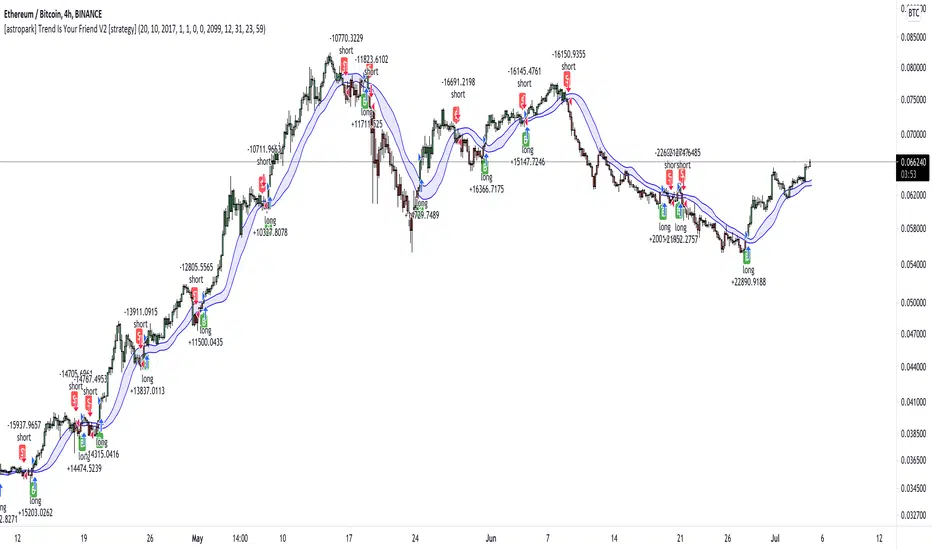
[astropark] Trend Is Your Friend V2 [strategy]Dear Followers,
today another awesome Swing and Scalping Trading Strategy indicator, runnable on a bot , which works great on High Timeframes (1D is suggested) but also on lower ones (just write me in order to help you find correct settings) and even better on 1m Renko chart!
If you are a scalper, you will love suggested entries for fast profit. You can run it on 1h timeframe (below is not suggested, there is "no-trend" below 1h!) if you are used to scalp trading and close each trade whenever you feel happy (a proper trailing stop strategy is suggested anyway).
This is a twin sister or the "Trend Is Your Friend V1" indicator you can see here below
This strategy differs for the engine used as basis, but has the same usage settings:
enable/disable signals on chart
enable/disable showing trend cloud
enable/disable bar coloring based on trend
enable/disable background coloring based on trend
edit trend period length (you have to increase it if you go on lower timeframes or you go on FOREX/Stocks market, direct message me in order to help you fine best settings)
This strategy only trigger 1 buy or 1 sell. In order to get notified when a signal is triggered, you need to use the "alarms" version of this indicator.
Strategy results are calculated on the timeframe from January 2015 to now, so on 5 years, using 10000$ as initial capital and working at 1x leverage (so no leverage at all! If you like to use leverage, be sure to use a safe option, like 3x or 5x at most in order to have liquidation price very far).
This is not the "Holy Grail", so use a proper risk management strategy.
This script will let you backtest how the indicator will perform on any chart you may test. Of course results will be very different depending on the chart and timeframe you will open. I tested a lot of charts and always you can find a combination that keep this strategy in profit on swing trading style (and this means that if you can have a daily look at the chart you can always manage to maximize your profit on each trade!)
The alarms version of this indicator, which will let you set all notifications you may need in order to be alerted on each triggered signals, can be found by searching for the astropark's "trend is your friend v2" and then choosing the indicator with "alarms" suffix in the name.
This is a premium indicator , so send me a private message in order to get access to this script.
[astropark] Trend Is Your Friend V1 [strategy]Dear Followers,
today another awesome Swing and Scalping Trading Strategy indicator, runnable on a bot , which works great on High Timeframes (1D is suggested) but also on lower ones (just write me in order to help you find correct settings) and even better on 1m Renko chart!
If you are a scalper, you will love suggested entries for fast profit. You can run it on 1h timeframe (below is not suggested, there is "no-trend" below 1h!) if you are used to scalp trading and close each trade whenever you feel happy (a proper trailing stop strategy is suggested anyway).
This strategy let's you edit following settings:
enable/disable signals on chart
enable/disable showing trend cloud
enable/disable bar coloring based on trend
enable/disable background coloring based on trend
enable a special option to enhance trend cloud on FOREX/Stocks charts (optional)
edit trend period length (you have to increase it if you go on lower timeframes, like 1h)
This strategy only trigger 1 buy or 1 sell. In order to get notified when a signal is triggered, you need to use the "alarms" version of this indicator.
Strategy results are calculated on the timeframe from August 2017 to now, so on almost 2 years and half, using 10000$ as initial capital and working at 1x leverage (so no leverage at all! If you like to use leverage, be sure to use a safe option, like 3x or 5x at most in order to have liquidation price very far).
This is not the "Holy Grail", so use a proper risk management strategy.
This script will let you backtest how the indicator will perform on any chart you may test. Of course results will be very different depending on the chart and timeframe you will open. I tested a lot of charts and always you can find a combination that keep this strategy in profit on swing trading style (and this means that if you can have a daily look at the chart you can always manage to maximize your profit on each trade!)
The alarms version of this indicator, which will let you set all notifications you may need in order to be alerted on each triggered signals, can be found by searching for the astropark's "trend is your friend" and then choosing the indicator with "alarms" suffix in the name.
This is a premium indicator , so send me a private message in order to get access to this script.

[astropark] Ichimoku Cloud StrategyDear Followers,
today a Great Swing Trading Strategy , runnable on a bot , which works great on High Timeframes (1D is suggested!) but also even better on 1m Renko chart.
If you are a scalper, you will love suggested entries for fast profit. You can run it on 1h timeframe (below is not suggested) if you are used to scalp trading and close each trade whenever you feel happy (a proper trailing stop strategy is suggested anyway).
This strategy is based on the Ichimoku Cloud Indicator and let's you set a lot of settings:
works on all timeframes (but 1D and above is suggested on normal candlesticks chart)
you can run this indicator on 1m Renko chart (be sure to enable the "USING RENKO CHART? ENABLE THIS OPTION" setting)
you can use 4 kind of Ichimoku Cloud (Custom, Slow, Standard and Fast - keep only one enabled)
you can make the Ichimoku Cloud show or not
you can enable showing the possibile re-entries
you can enable an heiking ashi analysis
you can enable a trailing stop strategy ("Auto Trailing Stop Loss" and "Close Trade When Price Breaks Above the Ichimoku Cloud" are two options very much suggested to keep enabled, especially on bot trading)
you can create your own trailing stop stategy and take profit strategy
you can enable a simple take profit strategy based on RSI Overbought and Oversold levels
This strategy only trigger 1 buy or 1 sell, but if you missed the possibility to open your long or short position don't get mad, but just enable the "show re-entry signals" option, so yout will be able to enter again (be sure to always use a proper money management ).
By the way, you can set any alarms you like in order to get notified when any kind of signal is triggered (you need to use the "alarms" version for this).
Strategy results are calculated on the timeframe from January 2016 to now, so on 3 years, using 10000$ as initial capital, doing only 6 trades (great swings!) and working at 1x leverage (so no leverage at all! perfect spot trading style!). If you like to use leverage, be sure tp use a safe option, like 3x or 5x at most in order to have liquidation price very far).
This is not the "Holy Grail", so use a proper risk management strategy.
This script will let you backtest how the indicator will perform on any chart you may test. Of course results will be very different depending on the chart you will open. I tested a lot of charts and always you can find a combination that keep this strategy in profit on swing trading style (and this means that if you can have a daily look at the chart you can always manage to maximize your profit on each trade!
The alarms version of this indicator, which will let you set all notifications you may need in order to be alerted on each triggered signals, can be found by searching for "astropark Ichimoku Cloud Strategy" and then choosing the "astropark" indicator with "alarms" suffix in the name.
This is a premium indicator , so send me a private message in order to get access to this script.

UT Bot Strategy with Backtesting Range [QuantNomad]UT Bot indicator was inially developer by @Yo_adriiiiaan
Idea of original code belongs @HPotter
I can't update my original UT Bot Strategy so I publishing new strategy with backtesting range included.
I just took code of Yo_adriiiiaan, cleaned it, deleted all useless pieces of code, transformet to v4 and created a strategy from it.
Also I added an input that allows you to swich to signals from Heiking Ashi. I saw that author uses HA for the indicator and on HA it look much nices then on real candles.
Do not add this strategy to HA candles, use usual candles and this checkbox.
Original script:
UT Bot

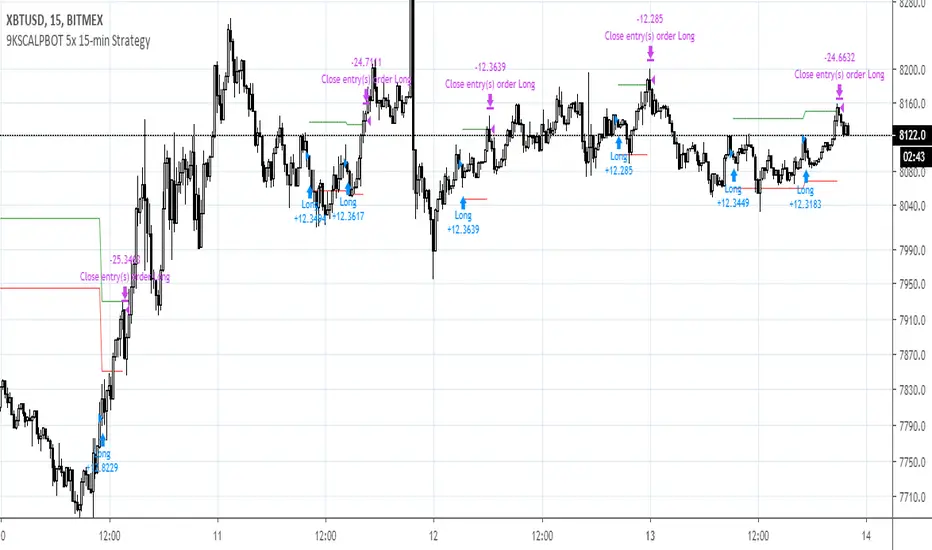
9KSCALPBOT 5x 15-min StrategyThis scalp bot uses low leverage to scalp small but high certainty movements on the 15-minute timeframe. Its amazing proprietary feature addresses the common problem of accumulated losses due to excessive stop-lossing -- this is done by assessing macro trends on higher timeframes when underwater, and then riding the position out until profitable again. You will get an average of about 1 entry and 1 exit per day.
The core logic uses a modified combination of CCI and Schaff Trend oscillators and a proprietary pattern recognition mechanic. Leverage should be kept low (5X or less) as the algorithm could temporarily go significantly underwater as well as pyramid (stack) same direction entries up to five times before closing. Any leverage higher than 5X significantly increases risk of liquidation. This bot has been consistently backtested for 10 months with about 75-85% win rate, 100%+ 3-month profitability, very low ~5% drawdown, all after factoring typical BitMex fees (0.06% after counting affiliate self-referral).
As with any automated strategy, it does not account for black swan events or disruptions in server connectivity (e.g., BitMex overload errors).
YJ Mean ReversionMean reversion strategy, based upon the price deviation (%) from a chosen moving average (bars). Do note that the "gains" are always relative to your starting capital, so if you set a smaller starting capital (e.g. $10000) your gains will look bigger. Also when the strategy tester has finished calculating, check the "Open P/L", as there could still be open trades.
Some Tips:
- Was designed firstly to work on an index like the S&P 500 , which over time tends to go up in value.
- Avoid trading too frequently (e.g. Daily, Weekly), to avoid getting eaten by fees.
- If you change the underlying asset, or time frame, tweaking the moving average may be necessary.
- Can work with a starting capital of just $1000, optimise the settings as necessary.
- Accepts floating point values for the amount of units to purchase (e.g. Bitcoin ).
- If price of units exceeds available capital, script will cancel the buy.
- Adjusted the input parameters to be more intuitive.

SuperFast M3 - STRATEGGYScript developed for automated trading (autoview).
Start of backtest: Jan 01 2020.
Way of acting:
SMA, EMA and HullMA analysis.
Must be used on the 3 minute chart.
Supports leverage up to x50 with certain security.
-------------------- PT-BR -------------------
Script desenvolvido para trading automatizado (autoview).
Início do backtest: Jan 01 2020.
Forma de atuação:
Analise de SMA, EMA e HullMA.
Deve ser usado no gráfico de 3 minutos.
Suporta alvancagem de até x50 com certa segurança.
