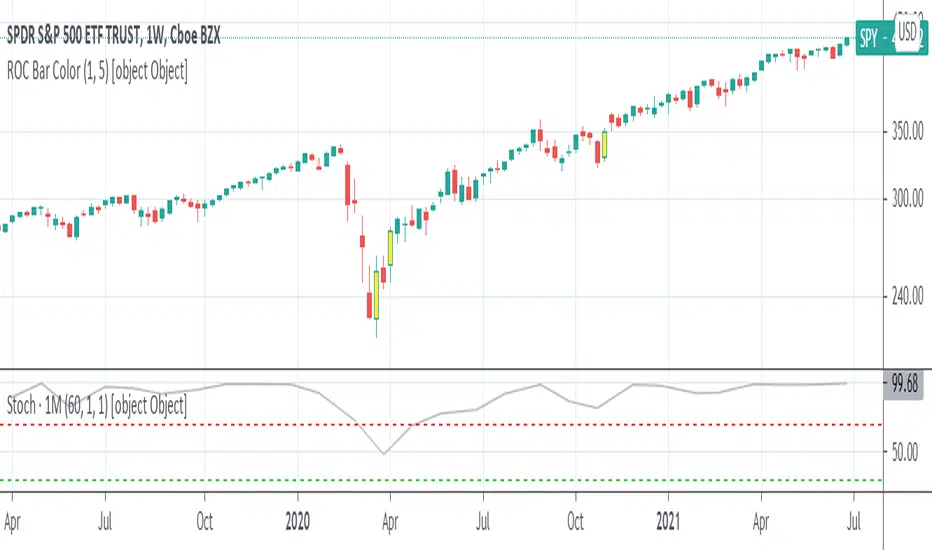
Volume Range EventsChanges in the feelings (positive, negative, neutral) in the market concerning the valuation of an instrument are often preceded with sudden outbursts of buying and selling frenzies. The aim of this indicator is to report such outbursts. We can see them as expansions of volume, sometimes 10 times more than usual. and as extensions of the trading range, also sometimes 10 times more than usual (e.g. usual range is 10 cent suddenly a whole dollar.) The changes are calculated in such a way that these fit between plus and minus 100 percent, the bars are scaled in some sort of logarithmic way. The Emoline is the same as the one in the True Balance of Power indicator, which I already published
ONLY RISES ARE EVENTS
Sometimes analysts are tempted to give meaning to low volume or small ranges. These simply mean that the market has little interest in trading this instrument. I believe that in such cases the trader needs to wait for expansion and extension events to happen, then he can make a better guess of where the market is heading. As events often mark the beginning or ending of a trend, this indicator provides an early and clear signal, because it doesn’t bother us about non-events.
WHAT IS USUAL?
If the algorithm would use an average as a normal to scale volume or range events, then previous peaks will act as spoilers by making the average so high that a following peak is scaled too small. I developed a function, usual() , that kicks out all extremes of a ‘population of values’ and which returns the average of the non-extreme values. It can be called with any serial. This function is called by both algorithms that report volume and range peaks, which guarantees that the results are really comparable. As this function has a fixed look back of 8 periods, we might state that ‘usual’ is a short lived relative value. I think this doesn’t matter for the practical use of the indicator.
COLORING AND INTERPRETATION
I follow the categories in the ‘Better Volume Indicator’, published by LeazyBear, these are:
1. Climactic Volumes, event >40 % (this means peak is 1.5 X usual)
LIME: Climax Buying Volume, direction up, range event also > 30 %
RED: Climax Selling Volume, direction down, range event also > 30 %
AQUA: Climax Churning Volume, both directions, range event < 30%
2. Smaller Volumes, event <40 %
GREEN: Supportive Volume, both directions, if combined with range event
BLUE: Churning Volume, both directions, if not combined with range event (Professional Trading)
3. Just Range Events
BLACK histogram bars (Amateurish Trading)
Recherche dans les scripts pour "change"

DSS Bressert (Double Smoothed Stochastic) Mid point (H+L)/2Changed source to midpoint (High+Low)/2 instead of Close for a cleaner average.

muh gap! [FAIR VALUE GAP FINDER]Change the colors of the indicator to contrast your chart! Make sure to also change the transparency for the colors.
---
This indicator finds fair value gaps which are inefficiencies in price delivery. Gaps can be used for entry or even bias.
I've included midpoints, lines, and boxes. Boxes have the greatest range with respect to historic PA so keep that in mind.
I will be updating this script in the future, potentially adding an MTF function, mitigation of gaps and alarms.
Let me know if you guys have any additional ideas.
Best,
P

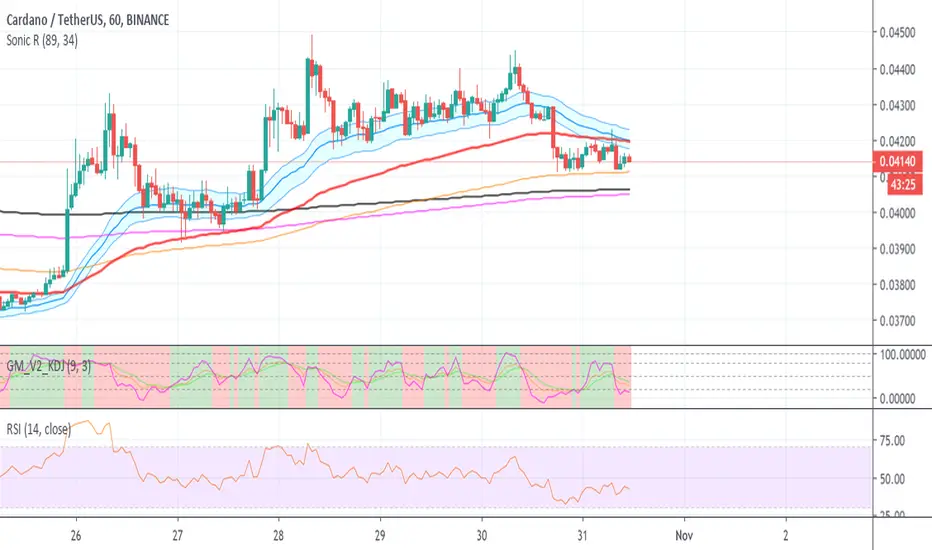
Sonic R by VuTien - edited by Dzung_NagaChange EMA610 to EMA630
Change style: EMA630 to black and thicker.
Willams21EMA13-AlexChanged the algorithm a bit of the Willams21EMA13 to match the texbook definition

CCI Secret Sauce 1hr strategy by CryptoLloydChanged the CCI_Period to 30 and T3_Period to 1
Giving us a much clear indication of when to go long or short when used with RSI and MACD.
Rules:
LONG - RSI above 50, MACD Bullish cross - Use common sense, price action, horizontal support/resistance, 55 and 150 EMA's
SHORT - Inverse rule set - Use common sense, price action, horizontal support/resistance, 55 and 150 EMA's

Relative Strength Index (Color mod)Changed opacity of center band and added green to plot line above 70 and red to plot line below 30.

McGinley Dynamic RangeChanged the formula from the TradingView formula to reflect the true formula that McGinley created.
The difference is that according to MvGinley you want to take half of the period length and not the whole length when calculating the average. This is because he put more emphasis on the relevancy of newer data compared to old.
The other addition is plotting 2 averages, one based on Close pricing and the other based on Open pricing to create envelopes. This can also show when momentum reverses either direction. This is optional, un-check the box in the input settings.

BigCandleAndRSIAlertChanges Candle Color to your choosing for Big Candles or Big Wick Candles or Over Bought/Oversold RSI Levels.

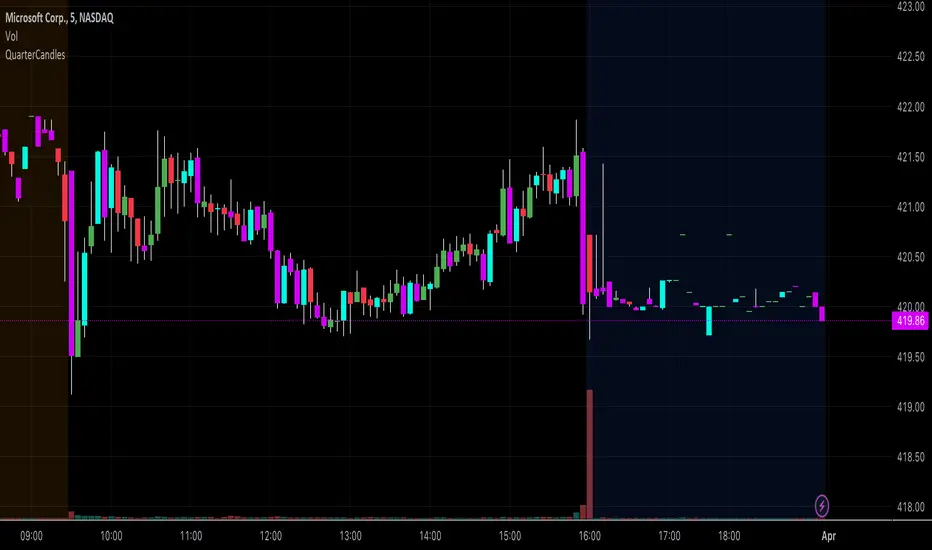
QuarterCandlesChanges candle color when close is within the top 25% or bottom 25% of candle range (High - Low) on the last candle update.
Due to limitations of barcolor command, I'd suggest that you turn OFF the candle borders (chart settings--> right click on chart --> settings -->symbol and uncheck the border option) to ensure that the bar color is easily identifiable.
More than three Candles in a roww Changes color of more than three candles in a row, when there are consecutive candles of same color green or red

Trading time by JZChanges the colors of candles within your selected trading zone -> good for reminding that you are out of trading window anymore. Can work as session indicator. This is the first version so be nice :)

ALMA Candles V1.0 by @overratedtraderChanges the solid colored candles based on the price action around the Arnaud Legoux Moving Average. Please modify / improve and share with the community.
VarianceChange under a 60 ema.
For use with BTCUSD 1 min.
When the indicator is at a low of -2 it shows over sold.
When the indicator is at a high of 2 it shows over bought.


Kaz Style BarsChange bar colors based on above or Below EMA
I use it to match Kaz's bars look on my charts

MARKET BGCOLOR
Change the background color according to the market time zone(NY, TOKYO, LONDON)
Current summer time setting, Fine time is optional and adjustable

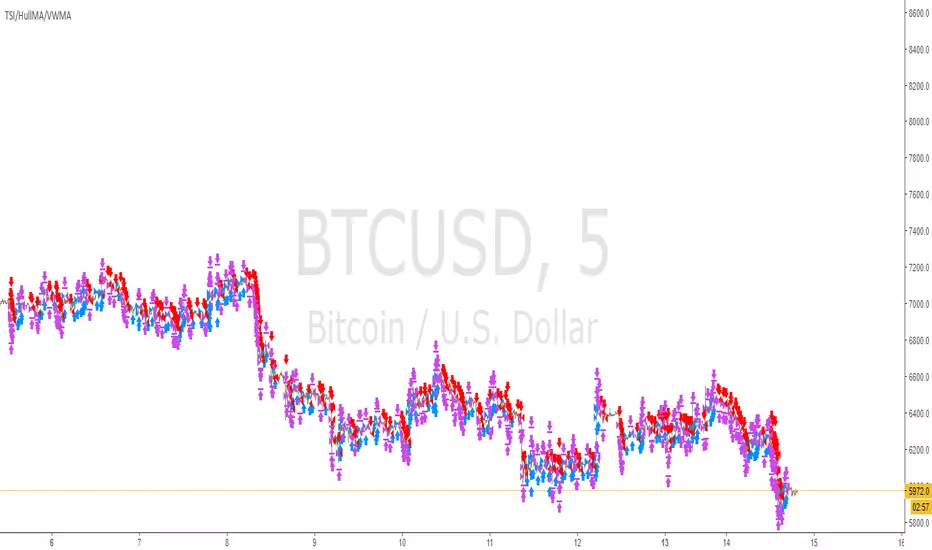
TSI/HullMA/VWMA strategychange the settings to make it profitable.. default settings not apply to any instrument in-particular.. dont be afraid to try different settings to find profitable combo of settings on your chosen crypto/FX/stock etc.. to avoid repaint wait for next candle before confirm signal..