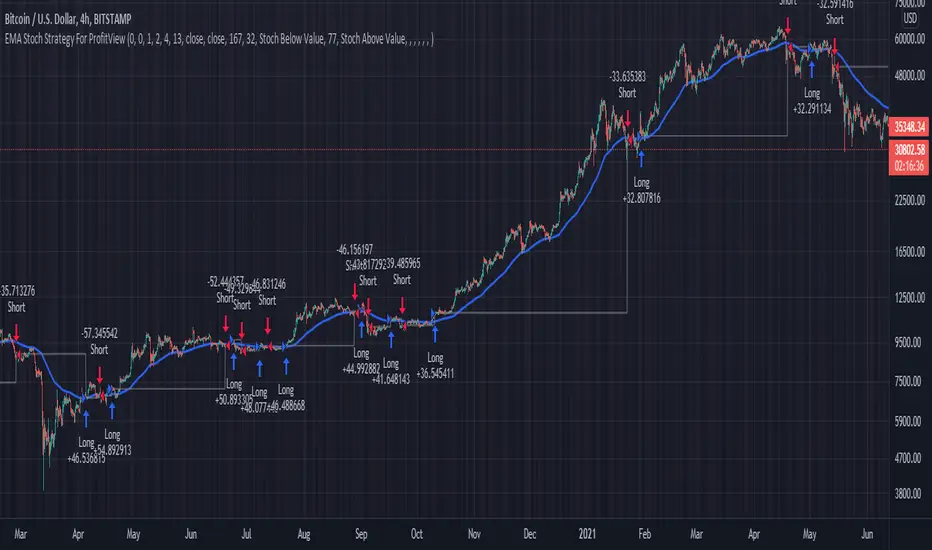
EMA Stoch Strategy For ProfitViewThis strategy will enter positions when the set stochastic conditions are met, and uses the moving average to filter the direction of the trades (long/short). The background is used to illustrate the strength of the stochastic values.
The following is a step by step guide in order to automate the trading of the strategy with ProfitView:
In the indicator settings, set the desired stochastic and ema values, and the stochastic condition you want to use to enter a trade.
In the indicator, set which exchange, symbol, and account to execute trades on.
In the indicator, set the PV Alert names you intend to use. If you want to use the same names as provided in the pastebin below, you may set the three names to Market Long, Market Short, TP SL Hit.
In PV, create two new PV Alerts in the PV Alert tab in accordance to these specifics pastebin.com .
On the Tradingview chart you want the indicator run on, create a new TV alert with this script as its condition, and specify the alert to "alert() function calls only".
Recherche dans les scripts pour "ema"
HARSI - The WHALE v2This strategy is credited to the "Heikin Ashi RSI Oscillator" By JayRogers.
The core of this strategy is "Heikin Ashi RSI Oscillator (HARSI)" By JayRogers, with multiple confirmation indicators. The buy signal is generated by HARSI when there is green HA, and there is a positive stochastic cross under the line OB line.
To confirm the buys signal, you can use one or all of the following:
- EMA: the buy confirmation is positive if the candle closes above the EMA.
- Volume Oscillator: the buy confirmation is positive if the volume value is above the zero line.
- ADX: the buy confirmation is positive if the D+ is above the D- and the D+ is above the threshold level.
- Vortex: the buy confirmation is positive if VI+ is above VI-.
You can enable the take profit, trailing stop loss (TSL), and stop lose (SL), if not, then the strategy will give a sell signal by itself when there is a negative stochastic cross above OB Extreme line.
Note, that the TSL arming value should be lower than the TSL %.
The strategy can give a different result based on your selection. However, the best timeframe is 4 hours without TP.

EMA Cross + Divergence strategy (Div. signals by The Divergent)A sample strategy demonstrating the usage of The Divergent divergence indicator and The Divergent Library .
The Divergent is an advanced divergence indicator which you can easily incorporate into your own strategies.
In order to use this strategy (and to use the signals in your own strategy), you need to have the Pro version of The Divergent applied to your chart.
For more information, please see the comments inlined in the code.

Arch1tect's New Toy (Strategy Tester Version)Description:
The version of Arch1tect's New Toy indicator with Strategy Tester added.
This indicator tries to predict market trends by simply utilising 2 moving averages crossovers.
How it works:
Buy signals are triggered when the faster MA crosses over the slower MA from the downside to the upside.
Sell signals are triggered when the faster MA crosses under the slower MA from the upside to the downside.
How to use:
Take buys when buy signal is triggered AND close existing sell position
Take sells when sell signal is triggered AND close existing buy position
Note:
Settings are optimised for XAUUSD on the M1 chart.
Extra:
Alerts are included.
You can toggle between EMA, WMA and SMA to your liking.
Indicator version:

Moving Average, T3 and Bollinger StrategyThis strategy uses a SMA much like an the faster EMA in many oscillators and the T3 average of the same period as the intermediate trend. Exits are defined by encounters with the Bollinger Band. The long term trend is defined by T3 moving averages of an even longer period.

Ema-Weighted-GainStrategy Inputs: Capital=$10,000, Pyramiding=3, Default Quantity=1
Please note that the strategy buys when the WMA (Blue line) cross under zero and sell above it, your experience is very important in using this indicator. Do not follow the buy/sell signals. Read the plot as I explain in the Uses Section and make your own conclusion on how to use it.
Description,
This Strategy uses multiple Ema’s to calculate Weighted HPR's.
I have calculated the weight numbers based on Fibonacci.
Uses:
NOTE!! (Please Do not take those uses to be 100% Guaranteed. User your experience and judgment to decide your trade).
Zoom out to see all the arrows
White line (MA)
Blue line (WMA)
First
Ride Trends,
1-Downtrend: short
a-MA IS going down
b-Entry: WMA cross above or near the MA (White Arrows).
2-Uptrend:long
a-MA is going up
b-Entry: WMA goes below MA or Near it(Green Arrows).
Second
Trend Reversal
1-buy entry.
WMA at zero, or very close to it, in pullback (Yellow Arrows).
2-short entry
WMA at zero, or very close to it, in a bounce (Orange Arrows).
Third
Divergence as explained in the Red Arrows.
Conclusion,
Red Arrows= Divergence
Green Arrows= Buy entry (The stock is in uptrend)
Yellow Arrows= Buy entry (the stock is in downtrend and could reverse)
White arrows= short entry (the stock is in downtrend)
Orange arrows=short entry (the stock in uptrend and can reverse)
If you are interested, send a private message

EMA trend reversal strategy "muxie1" - 1.5x to 3xThis uses 2 EMA and Stop Loss and Take Profit,
The stops don't fire at the precise value but only when the trend reverses
it is actually good for 1D since 2019, it was however optimised for 1min but I am not able to share for 1m.
have equivalent code for quantum zone ftx
Great profit factor from 1.5x to 3x
Mandatory input is the position size per trade, tested with 1 btc for 100k virtual capital, remember to set it small for a low risk per trade, and even smaller if you use leverage,

Simple EMA_Hull_RSI StrategyAnother simple strategy. Crossing EMA & Hull MA and the level of RSI (overbought/oversold) defines long or short.
Can be improved by varying the parameters and adding take profit / stop loss.
Backtest: ETHUSD (Bitmex): 5m


EMA cross scalp strategy 1m 5m nas100meant for scalping on NAS100 on the 5m and 1m time frames (testing version

EMA Strategy (8,13,21)A strategy using 4 EMA lines.
The purchase is made when the price is above all lines, there is a slight correction in prices touching the average of 8 periods, this is the time for the purchase. The sale happens in the same way with the price below the average.
Closing happens when the price touches the average of 21 periods.
The average of 48 periods is to check the main trend, so in this way do not execute any order that is against the primary movement.

Ema BacktesterA simple, but useful script for backtesting purposes. Find the optimal Settings for your strategy.
tips are always welcome at: 38uGQJDDZDL6wX48x4gYTccPeQ3ZHVYmY4 (btc)
I hope you enjoy the script :)

SW_55-EMA_STRAT//.SYNOPSIS
//.DESCRIPTION : REF - Philakone (@PhilakoneCrypto)
//.NOTES 55 EMA - Backtest
//.DATE 2/5/2019


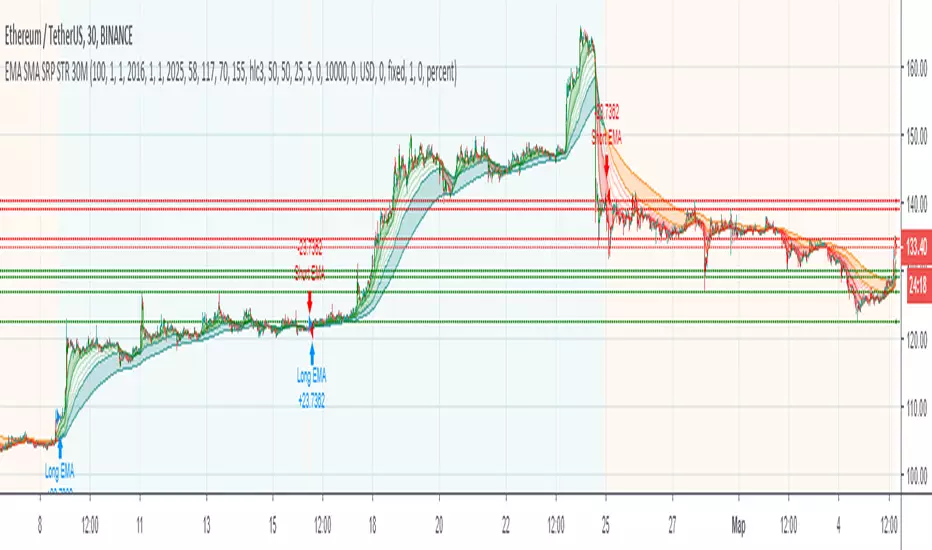
EMA SMA SRP STRATEGY 30MThe strategy is based on indicators:
Exponential Moving Average (EMA)
Simple Moving Average (SMA)
Support and Resistance Levels
Allows to find entry/exit points
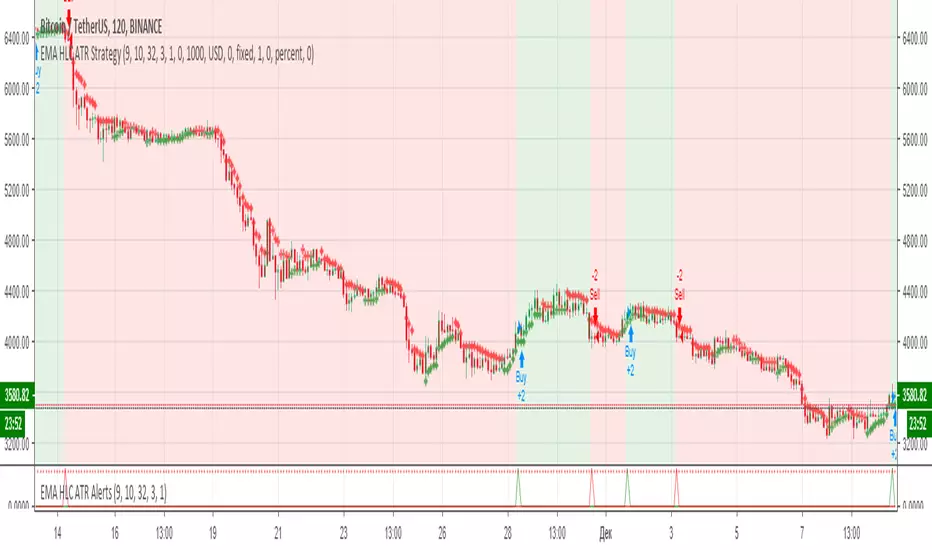
EMA HLC ATR Strategy// Strategy based on EMA HLC ATR Indicators
// Greatest effect on 2H time frame
// Created and based on Binance chart
// Working with comission
// No repaints

EMA HLC ATR Strategy// Strategy based on EMA HLC ATR Indicators
// Greatest effect on 2H time frame
// Created and based on Binance chart
// Working with comission
// No repaints
EMA + Ichimoku Kinko Hyo StrategyThis trading strategy uses combination of the Ichimoku Kinko Hyo system with Fibonacci numbers based exponential moving average(EMA) and RSI 12/24 crossover, giving excellent results in trending stocks !

EMA SMA STRATEGY V1 2H// Strategy based on Simple Moving Average (SMA) and Exponential Moving Average (EMA)
// Greatest profit index on 2H time frame
// Created and based on Binance chart
// Working with comission
// No repaint

MA + EMA Crossover Strategy EMA and MA crossovers are good signals fo trend reversal
You can look at my other scripts.
www.tradingview.com
If you want to ask something, you can message me.
Ema stretegy(lirshah)due to crossing special emas it triggers buying or selling signals.
good results in H1 charts.

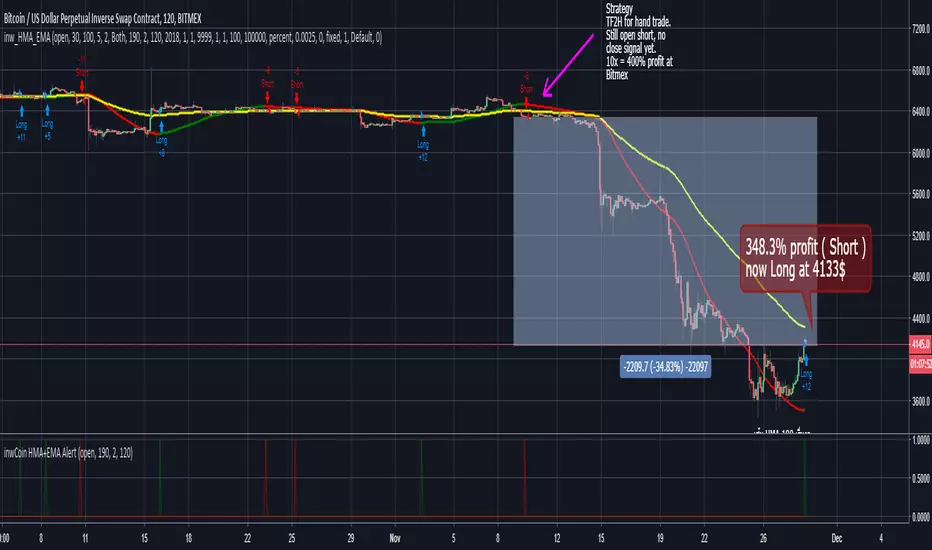
inwCoin HMA + EMA StrategyJust simple HMA + EMA120 strategy
Work well with TF 2H
Tried BTC on OKex and Bitmex and it looking good.
Best for hand trade.
If you want to try, just comment, i'll grant you a permission for 2 days