Recherche dans les scripts pour "ema"

WY Tame the Crypto MarketStrategy utilizes a combination of EMAs, RSIs, EMA of RSIs with adjustable ranges for a wide range of crypto trading flexibility.

SB_CCI coded OBV StrategyStrategy-
Buy Order: Previous obv value is green and obv_cci coded line crosses over ema line
Sell Order: Previous obv value is red and obv_cci coded line crosses under ema line.
Original Idea:
Preferable for day/week intervals.
For Tips to continue :) -
BTC: 1BjswGcRR6c23pka7qh5t5k56j46cuyyy2
ETH: 0x64fed71c9d6c931639c7ba4671aeb6b05e6b3781
LTC: LKT2ykQ8QSzzfTDB6Tnsf12xwYPjgq95h4

Dieyson daytrade EMA 9+20+200+VWAP and bar & line colorDieyson daytrade EMA 9 + EMA20 + EMA 200 + VWAP

True Strength Indicator BTCUSD 2HScript based on True Strength Index (TSI) and RSI
A technical momentum indicator that helps traders determine overbought and oversold conditions of a security by incorporating the short-term purchasing momentum of the market with the lagging benefits of moving averages. Generally a 25-day exponential moving average (EMA) is applied to the difference between two share prices, and then a 13-day EMA is applied to the result, making the indicator more sensitive to prevailing market conditions.
!!! IMPORTANT IN ORDER TO AVOID REPAITING ISSUES
!!! USE Chart resolution >= resCustom parameter, suggestion 2H
Yellow zones indicates that you can claim position for better profits even before a claim confirmation.
Dark zones indicates areas where RSI shows overbought and oversold conditions.
BTCUSD

9/21 MovingAvg Cross Signal EGAV.35Simple buy/sell signal with 9 & 21 ema cross over/under, works better in Daily Charts

Gold/Silver 30m Only Strategy Buy/Sell SignalsIn my free time I felt like coding this strategy, and after backtesting it, it appears that the 30m time frame is the most profitable.
I only have been working on it for gold, but it should work similarly for silver as well.
This includes no pyramiding, and with pyramiding orders of 5, this strategy is upwards of 100% profitable.
Buy order - when price is above the 162 day EMA and RSI is less than 35
Sell order - when price is below the 162 day EMA and RSI is greater than 65
I will probably be adjusting it to increase the profitability and %success rate.

SPY Master v1.0This is a simple swing trading algorithm that uses a fast RSI-EMA to trigger buy/cover signals and a slow RSI-EMA to trigger sell/short signals for SPY, an xchange-traded fund for the S&P 500.
The idea behind this strategy follows the premise that most profitable momentum trades usually occur during periods when price is trending up or down. Periods of flat price actions are usually where most unprofitable trades occur. Because we cannot predict exactly when trending periods will occur, the algorithm basically bets money on all trade opportunities during all market conditions. Despite an accuracy rate of only 40%, the algorithm's asymmetric risk/reward profile allows the average winner to be 2x the average loser. The end result is a positive (profitable) net payout.
TRADING RULES:
Buy/Cover = EMA3(RSI2) cross> 50
Sell/Short = EMA5(RSI2) cross< 50
BACKTEST SETTINGS:
- Period = March 2011 - Present
- Initial capital = $10,000
- Dividends excluded
- Trading costs excluded
PERFORMANCE COMPARISON:
There are 657 trades, which means 1,314 orders. Assuming each order costs $2 (what I pay for at Interactive Brokers), total trading costs should be $2,628.
-SPY (buy & hold) = 132.73 ---> 193.22 = +45.57% (dividends excluded)
-SPY Master v1.0 = $12,649 - $2,628 = $10,021 = +100.21%
DISCLAIMER: None of my ideas and posts are investment advice. Past performance is not an indication of future results. This strategy was constructed with the benefit of hindsight and its future performance cannot be guaranteed.

Relative Outperformance + EMA Trend Filter (Long Only)Relative Outperformance based on underlying and EMA based trend filtering

Crypto Intraday Strategy by SAIFOverview
A comprehensive intraday trading strategy designed for cryptocurrency markets, combining multiple technical indicators and risk management principles to identify high-probability trading opportunities.
Key Features
Multi-Timeframe Analysis
Utilizes exponential moving averages for trend identification
Incorporates swing structure analysis for support and resistance levels
Applies momentum and trend strength filters
Risk Management
Configurable risk-reward ratios (default 1.6:1)
Maximum risk per trade capped at 3.1% of equity
Dynamic stop-loss placement based on market structure
Position sizing at 2% of equity per trade
Advanced Filters
Trend strength confirmation using ADX indicator
Momentum validation through multiple oscillators
Market correlation analysis for additional confluence
Optional weekend trading filter to avoid low-liquidity periods
Swing Structure Recognition
Automatically identifies key swing highs and lows
Uses pivot points to determine optimal entry zones
Prevents entries too far from established support/resistance
Trade Execution
The strategy employs a one-way trading approach, entering positions only when multiple technical conditions align. Each trade includes pre-defined stop-loss and take-profit levels calculated at entry.
Customization Options
Adjustable swing detection sensitivity
Configurable EMA distance thresholds
Optional correlation filters
Weekend trading toggle
Risk parameters can be modified to suit individual preferences
Important Disclaimers
⚠️ Educational Purpose Only: This strategy is provided for educational and informational purposes. Past performance does not guarantee future results.
⚠️ Risk Warning: Trading cryptocurrencies carries substantial risk of loss. Only trade with capital you can afford to lose.
⚠️ Not Financial Advice: This tool does not constitute financial, investment, or trading advice. Always conduct your own research and consult with qualified financial professionals.
⚠️ Backtesting Limitations: Historical backtesting results may not reflect actual trading conditions due to slippage, execution delays, and changing market dynamics.
Fees & Slippage
Commission: 0.12% per trade
Slippage: 2 ticks accounted for in backtesting
Recommended Usage
Thoroughly backtest on your preferred trading pairs
Start with small position sizes when live trading
Monitor performance across different market conditions
Adjust parameters based on asset volatility and your risk tolerance

Double MOST with Pivot and EMAMOST Long Strategy with Multi-Filter Confirmation (Pivot + VAR Trend Filter)
This strategy combines a custom MOST stop-line structure with a moving average trend filter (EMA / VAR / ZLMA), daily pivot levels, and a 9-period VAR filter to generate clean long-only entries.
It aims to capture early trend continuations while avoiding reversals and false breakouts.
✔ Buy Conditions
A long position is opened only if all of the conditions below occur simultaneously:
MA (ort) > MOST Line (s2)
– Confirms that momentum is on the long side.
Price > Daily Pivot (pvt_gun)
– Ensures the market is trading above the day’s fair-value level.
Price > VAR(9)
– Short-term VAR filter to confirm trend strength and reduce noise.
Only the first bar where all conditions turn true generates a position.
✔ Sell Condition
A long position is closed when:
MOST Line (s2) crosses above MA (ort)
– Indicates a momentum shift against the long position.
✔ Execution Style (MetaStock-like)
Strategy operates long-only
Orders are filled on the next bar open, not on the signal bar
Commission: 0.03% (3 bps / on-binde 3)
Position size: 100% of equity per trade
This makes the behavior comparable to classical MetaStock backtesting logic.
✔ Chart Markers
Only actual trade entries and exits are drawn
No repeated signals or overlapping markers
Clean visual trade history
Purpose
This strategy is ideal for traders who want:
A structured long-only trend model
A multi-layer confirmation filter
Clean execution without repaint
High-quality entries above market structure levels

Optimized EMA Ribbon Strategy v6 Based on EMA rotations, ADX we create a system of entering trades. Watch out for the sell and buy signals.

RSI + 55 EMA + Volume (SL Marked, No Engulfing)This is to help entering in trades by considering 50 EMA and RSI indicators, Volume is used for confirmations

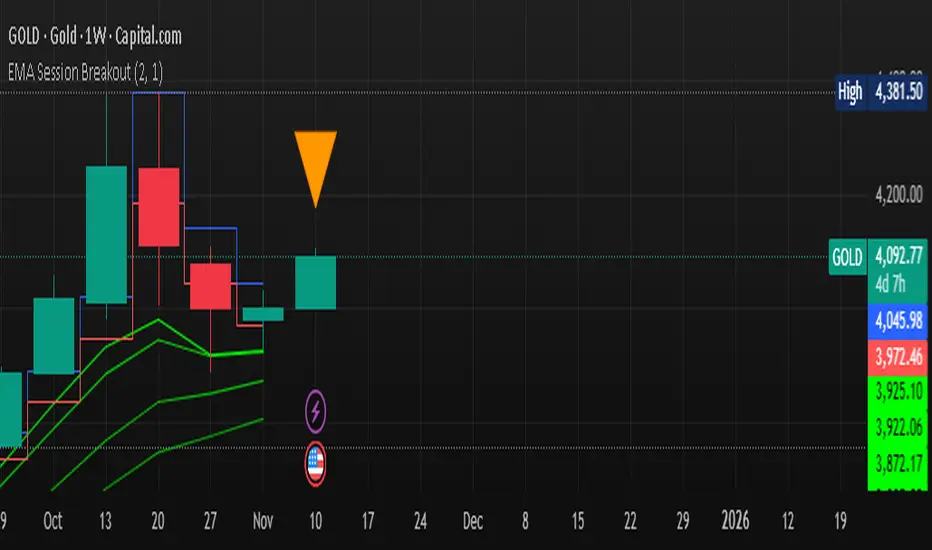
Multi-EMA Session Breakout Strategythis is a strategy that use the session high and low and the EMA LOWS 2 3 6 9 110 355 AND 480
Multi-EMA Strategy (Low Source)this strategy use the ema low for its functionality 8 9 110 355 and 480

1-Min Binary Strategy (EMA + RSI + BB Optimized)creat signal for binary trading using ema rsi ans bolinger band combination

WIN1! • Crossing EMAs• (By Mesquita, v7)Moving average crossover strategy for intraday movements, especially in the continuous index (WIN1!) on the Brazilian stock exchange B³. The strategy is customizable for time windows, has a filter for trades only above the long-term average, whether only long, only short, or both, with or without stop loss.

Iriza4 -DAX EMA+HULL+ADX TP40 SL205 MIN SKALP. Additional filters improve accuracy: the strategy blocks trades after too many consecutive bullish or bearish candles (streak filter) and ignores signals when price is too far from the EMA (measured by ATR distance).
Each position uses a fixed risk-to-reward ratio of 1 : 2 with clear stop-loss and take-profit targets, without partial exits or breakevens. The goal is to identify clean pullbacks inside strong trends and filter out late or exhausted entries

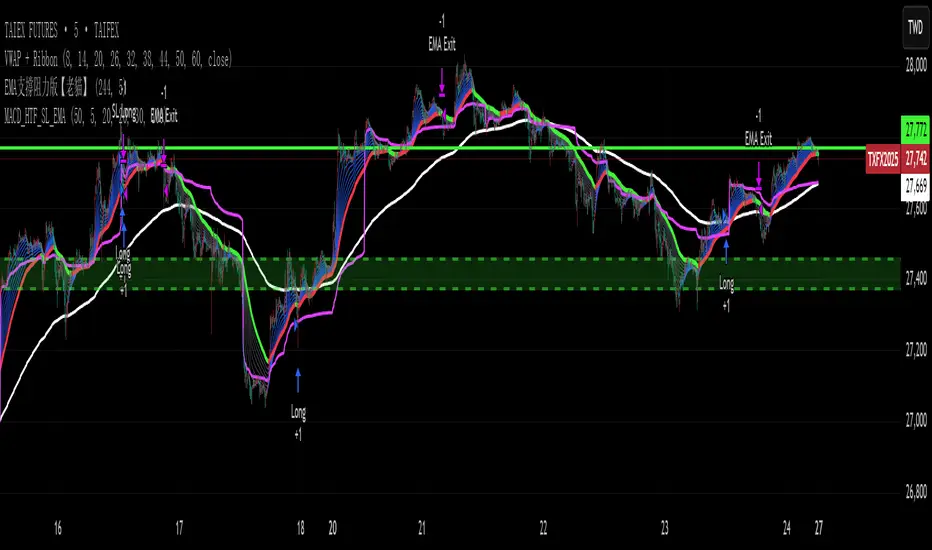
EVWMA VWAP MACD Strategy - HTF Trigger with SL & EMA ExitEVWMA VWAP MACD Strategy - HTF Trigger with SL & EMA Exit

EVWMA VWAP MACD Strategy - HTF Trigger with SL & EMA ExitRENEW TRY IT EVWMA VWAP MACD Strategy - HTF Trigger with SL & EMA Exit
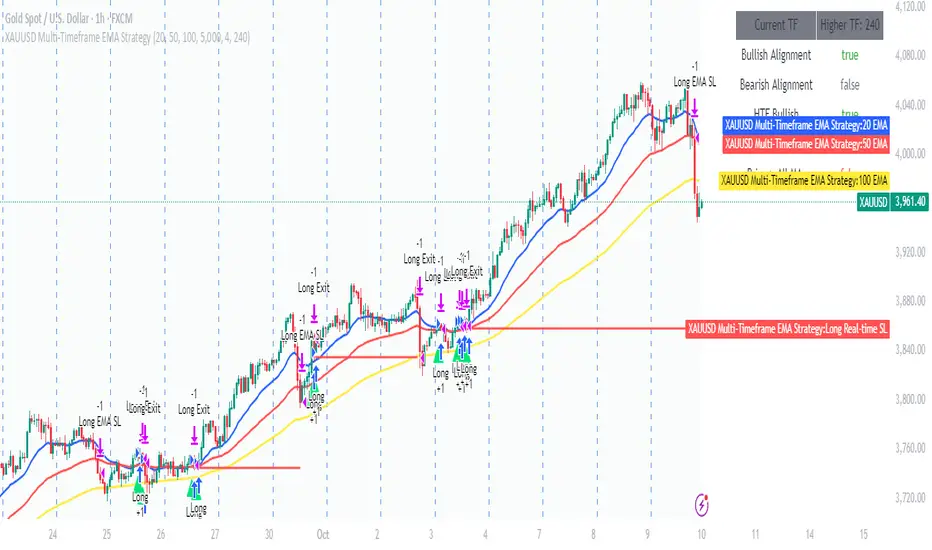
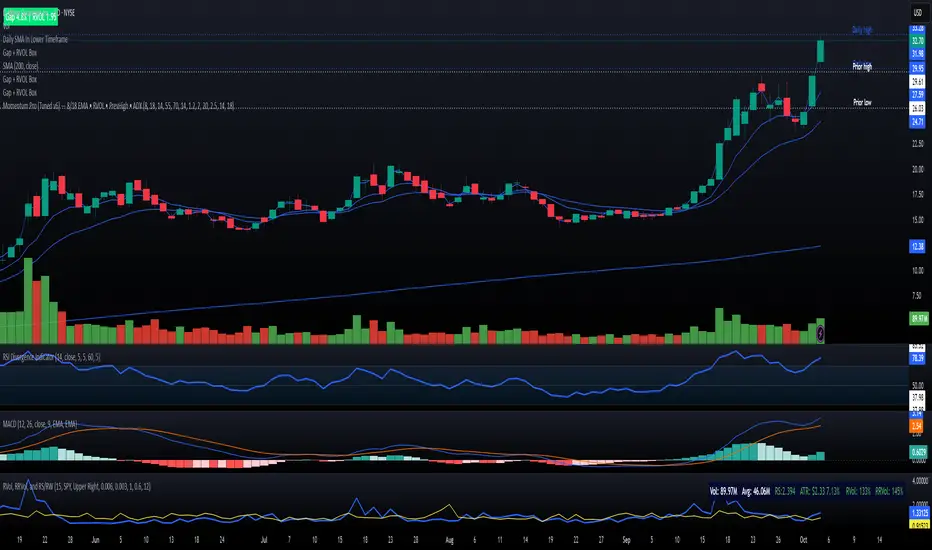
Momentum Pro (Tuned v6) — 8/18 EMA • RVOL • PrevHigh • ADXMomentum strategy with signals (VWAP + 9/20 EMA alignment, MACD hist > 0, RSI 55–70, RVOL filter, ATR stop, 2R target
Dwaggy Scalping Trio (VWAP + EMA + RSI)First attempt at pine script this is a scalping indicator that combines VWAP, EMA, and RSI to signal entry/exit for scalping lower time frames
