VWAP StrategyVWAP and volatility filters for structured intraday trades.
How the Strategy Works
1. VWAP Anchored to Session
VWAP is calculated from the start of each trading day.
Standard deviations are used to create bands above/below the VWAP.
2. Entry Triggers: Al Brooks H1/H2 and L1/L2
H1/H2 (Long Entry): Opens below 2nd lower deviation, closes above it.
L1/L2 (Short Entry): Opens above 2nd upper deviation, closes below it.
3. Volatility Filter (ATR)
Skips trades when deviation bands are too tight (< 3 ATRs).
4. Stop Loss
Based on the signal bar’s high/low ± stop buffer.
Longs: signalBarLow - stopBuffer
Shorts: signalBarHigh + stopBuffer
5. Take Profit / Exit Target
Exit logic is customizable per side:
VWAP, Deviation Band, or None
6. Safety Exit
Exits early if X consecutive bars go against the trade.
Longs: X red bars
Shorts: X green bars
Explanation of Strategy Inputs
- Stop Buffer: Distance from signal bar for stop-loss.
- Long/Short Exit Rule: VWAP, Deviation Band, or None
- Long/Short Target Deviation: Standard deviation for target exit.
- Enable Safety Exit: Toggle emergency exit.
- Opposing Bars: Number of opposing candles before safety exit.
- Allow Long/Short Trades: Enable or disable entry side.
- Show VWAP/Entry Bands: Toggle visual aids.
- Highlight Low Vol Zones: Orange shading for low volatility skips.
Tuning Tips
- Stop buffer: Use 1–5 points.
- Target deviation: Start with VWAP. In strong trends use 2nd deviation and turn off the counter-trend entry.
- Safety exit: 3 bars recommended.
- Disable short/long side to focus on one type of reversal.
Backtest Setup Suggestions
- initial_capital = 2000
- default_qty_value = 1 (fixed contracts or percent-of-equity)
Recherche dans les scripts pour "entry"

RSI Pro+ (Bear market, financial crisis and so on EditionIn markets defined by volatility, fear, and uncertainty – the battlegrounds of bear markets and financial crises – you need tools forged in resilience. Introducing RSI Pro+, a strategy built upon a legendary indicator born in 1978, yet engineered with modern visual clarity to remain devastatingly effective even in the chaotic financial landscapes of 3078.
This isn't about complex algorithms predicting the unpredictable. It's about harnessing the raw, time-tested power of the Relative Strength Index (RSI) to identify potential exhaustion points and capitalize on oversold conditions. RSI Pro+ cuts through the noise, providing clear, actionable signals when markets might be poised for a relief bounce or reversal.
Core Technology (The 1978 Engine):
RSI Crossover Entry: The strategy initiates a LONG position when the RSI (default period 11) crosses above a user-defined low threshold (default 30). This classic technique aims to enter when selling pressure may be waning, offering potential entry points during sharp downturns or periods of consolidation after a fall.
Modern Enhancements (The 3078 Cockpit):
RSI Pro+ isn't just about the signal; it's about providing a professional-grade visual experience directly on your chart:
Entry Bar Highlight: A subtle background flash on the chart signals the exact bar where the RSI crossover condition is met, alerting you to potential entry opportunities.
Trade Bar Coloring: Once a trade is active, the price bars are subtly colored, giving you immediate visual confirmation that the strategy is live in the market.
Entry Price Line: A clear, persistent line marks your exact average entry price for the duration of the trade, serving as a crucial visual anchor.
Take Profit Line: Your calculated Take Profit target is plotted as a distinct line, keeping your objective clearly in sight.
Custom Entry Marker: A precise shape (▲) appears below the bar where the trade entry was actually executed, pinpointing the start of the position.
On-Chart Info Table (HUD): A clean, customizable Heads-Up Display appears when a trade is active, showing vital information at a glance:
Entry Price: Your position's average cost basis.
TP Target: The calculated price level for your Take Profit exit.
Current PnL%: Real-time Profit/Loss percentage for the open trade.
Full Customization: Nearly every aspect is configurable via the settings menu:
RSI Period & Crossover Level
Take Profit Percentage
Toggle ALL visual enhancements on/off individually
Position the Info Table wherever you prefer on the chart.
How to Use RSI Pro+:
Add to Chart: Apply the "RSI Pro+ (Bear market...)" strategy to your TradingView chart. Ensure any previous versions are removed.
Access Settings: Click the cogwheel icon (⚙️) next to the strategy name on your chart.
Configure Inputs (Crucial Step):
RSI Crossover Level: This is key. The default (30) targets standard oversold conditions. In severe downturns, you might experiment with lower levels (e.g., 25, 20) or higher ones (e.g., 40) depending on the asset and timeframe. Observe where RSI(11) typically bottoms out on your chart.
Take Profit Percentage (%): Define your desired profit target per trade (e.g., enter 0.5 for 0.5%, 1.0 for 1%). The default is a very small 0.11%.
RSI Period: While default is 11, you can adjust this (e.g., the standard 14).
Visual Enhancements: Enable or disable the visual features (background highlights, bar coloring, lines, markers, table) according to your preference using the checkboxes. Adjust table position.
Observe & Backtest: Watch how the strategy behaves on your chosen asset and timeframe. Use TradingView's Strategy Tester to analyze historical performance based on your settings. No strategy works perfectly everywhere; testing is essential.
Important Considerations:
Risk Management: This specific script version focuses on a Take Profit exit. It does not include an explicit Stop Loss. You MUST manage risk through appropriate position sizing, potentially adding a Stop Loss manually, or by modifying the script.
Oversold ≠ Reversal: An RSI crossover is an indicator of potential exhaustion, not a guarantee of a price reversal.
Fixed TP: A fixed percentage TP ensures small wins but may exit before larger potential moves.
Backtesting Limitations: Past performance does not guarantee future results.
RSI Pro+ strips away complexity to focus on a robust, time-honored principle, enhanced with modern visuals for the discerning trader navigating today's (and tomorrow's) challenging markets

Smart Liquidity Wave [The_lurker]"Smart Liquidity Wave" هو مؤشر تحليلي متطور يهدف لتحديد نقاط الدخول والخروج المثلى بناءً على تحليل السيولة، قوة الاتجاه، وإشارات السوق المفلترة. يتميز المؤشر بقدرته على تصنيف الأدوات المالية إلى أربع فئات سيولة (ضعيفة، متوسطة، عالية، عالية جدًا)، مع تطبيق شروط مخصصة لكل فئة تعتمد على تحليل الموجات السعرية، الفلاتر المتعددة، ومؤشر ADX.
فكرة المؤشر
الفكرة الأساسية هي الجمع بين قياس السيولة اليومية الثابتة وتحليل ديناميكي للسعر باستخدام فلاتر متقدمة لتوليد إشارات دقيقة. المؤشر يركز على تصفية الضوضاء في السوق من خلال طبقات متعددة من التحليل، مما يجعله أداة ذكية تتكيف مع الأدوات المالية المختلفة بناءً على مستوى سيولتها.
طريقة عمل المؤشر
1- قياس السيولة:
يتم حساب السيولة باستخدام متوسط حجم التداول على مدى 14 يومًا مضروبًا في سعر الإغلاق، ويتم ذلك دائمًا على الإطار الزمني اليومي لضمان ثبات القيمة بغض النظر عن الإطار الزمني المستخدم في الرسم البياني.
يتم تصنيف السيولة إلى:
ضعيفة: أقل من 5 ملايين (قابل للتعديل).
متوسطة: من 5 إلى 20 مليون.
عالية: من 20 إلى 50 مليون.
عالية جدًا: أكثر من 50 مليون.
هذا الثبات في القياس يضمن أن تصنيف السيولة لا يتغير مع تغير الإطار الزمني، مما يوفر أساسًا موثوقًا للإشارات.
2- تحليل الموجات السعرية:
يعتمد المؤشر على تحليل الموجات باستخدام متوسطات متحركة متعددة الأنواع (مثل SMA، EMA، WMA، HMA، وغيرها) يمكن للمستخدم اختيارها وتخصيص فتراتها ، يتم دمج هذا التحليل مع مؤشرات إضافية مثل RSI (مؤشر القوة النسبية) وMFI (مؤشر تدفق الأموال) بوزن محدد (40% للموجات، 30% لكل من RSI وMFI) للحصول على تقييم شامل للاتجاه.
3- الفلاتر وطريقة عملها:
المؤشر يستخدم نظام فلاتر متعدد الطبقات لتصفية الإشارات وتقليل الضوضاء، وهي من أبرز الجوانب المخفية التي تعزز دقته:
الفلتر الرئيسي (Main Filter):
يعمل على تنعيم التغيرات السعرية السريعة باستخدام معادلة رياضية تعتمد على تحليل الإشارات (Signal Processing).
يتم تطبيقه على السعر لاستخراج الاتجاهات الأساسية بعيدًا عن التقلبات العشوائية، مع فترة زمنية قابلة للتعديل (افتراضي: 30).
يستخدم تقنية مشابهة للفلاتر عالية التردد (High-Pass Filter) للتركيز على الحركات الكبيرة.
الفلتر الفرعي (Sub Filter):
يعمل كطبقة ثانية للتصفية، مع فترة أقصر (افتراضي: 12)، لضبط الإشارات بدقة أكبر.
يستخدم معادلات تعتمد على الترددات المنخفضة للتأكد من أن الإشارات الناتجة تعكس تغيرات حقيقية وليست مجرد ضوضاء.
إشارة الزناد (Signal Trigger):
يتم تطبيق متوسط متحرك على نتائج الفلتر الرئيسي لتوليد خط إشارة (Signal Line) يُقارن مع عتبات محددة للدخول والخروج.
يمكن تعديل فترة الزناد (افتراضي: 3 للدخول، 5 للخروج) لتسريع أو تبطيء الإشارات.
الفلتر المربع (Square Filter):
خاصية مخفية تُفعّل افتراضيًا تعزز دقة الفلاتر عن طريق تضييق نطاق التذبذبات المسموح بها، مما يقلل من الإشارات العشوائية في الأسواق المتقلبة.
4- تصفية الإشارات باستخدام ADX:
يتم استخدام مؤشر ADX كفلتر نهائي للتأكد من قوة الاتجاه قبل إصدار الإشارة:
ضعيفة ومتوسطة: دخول عندما يكون ADX فوق 40، خروج فوق 50.
عالية: دخول فوق 40، خروج فوق 55.
عالية جدًا: دخول فوق 35، خروج فوق 38.
هذه العتبات قابلة للتعديل، مما يسمح بتكييف المؤشر مع استراتيجيات مختلفة.
5- توليد الإشارات:
الدخول: يتم إصدار إشارة شراء عندما تنخفض خطوط الإشارة إلى ما دون عتبة محددة (مثل -9) مع تحقق شروط الفلاتر، السيولة، وADX.
الخروج: يتم إصدار إشارة بيع عندما ترتفع الخطوط فوق عتبة (مثل 109 أو 106 حسب الفئة) مع تحقق الشروط الأخرى.
تُعرض الإشارات بألوان مميزة (أزرق للدخول، برتقالي للضعيفة والمتوسطة، أحمر للعالية والعالية جدًا) وبثلاثة أحجام (صغير، متوسط، كبير).
6- عرض النتائج:
يظهر مستوى السيولة الحالي في جدول في أعلى يمين الرسم البياني، مما يتيح للمستخدم معرفة فئة الأصل بسهولة.
7- دعم التنبيهات:
تنبيهات فورية لكل فئة سيولة، مما يسهل التداول الآلي أو اليدوي.
%%%%% الجوانب المخفية في الكود %%%%%
معادلات الفلاتر المتقدمة: يستخدم المؤشر معادلات رياضية معقدة مستوحاة من معالجة الإشارات لتنعيم البيانات واستخراج الاتجاهات، مما يجعله أكثر دقة من المؤشرات التقليدية.
التكيف التلقائي: النظام يضبط نفسه داخليًا بناءً على التغيرات في السعر والحجم، مع عوامل تصحيح مخفية (مثل معامل التنعيم في الفلاتر) للحفاظ على الاستقرار.
التوزيع الموزون: الدمج بين الموجات، RSI، وMFI يتم بأوزان محددة (40%، 30%، 30%) لضمان توازن التحليل، وهي تفاصيل غير ظاهرة مباشرة للمستخدم لكنها تؤثر على النتائج.
الفلتر المربع: خيار مخفي يتم تفعيله افتراضيًا لتضييق نطاق الإشارات، مما يقلل من التشتت في الأسواق ذات التقلبات العالية.
مميزات المؤشر
1- فلاتر متعددة الطبقات: تضمن تصفية الضوضاء وإنتاج إشارات موثوقة فقط.
2- ثبات السيولة: قياس السيولة اليومي يجعل التصنيف متسقًا عبر الإطارات الزمنية.
3- تخصيص شامل: يمكن تعديل حدود السيولة، عتبات ADX، فترات الفلاتر، وأنواع المتوسطات المتحركة.
4- إشارات مرئية واضحة: تصميم بصري يسهل التفسير مع تنبيهات فورية.
5- تقليل الإشارات الخاطئة: الجمع بين الفلاتر وADX يعزز الدقة ويقلل من التشتت.
إخلاء المسؤولية
لا يُقصد بالمعلومات والمنشورات أن تكون، أو تشكل، أي نصيحة مالية أو استثمارية أو تجارية أو أنواع أخرى من النصائح أو التوصيات المقدمة أو المعتمدة من TradingView.
#### **What is the Smart Liquidity Wave Indicator?**
"Smart Liquidity Wave" is an advanced analytical indicator designed to identify optimal entry and exit points based on liquidity analysis, trend strength, and filtered market signals. It stands out with its ability to categorize financial instruments into four liquidity levels (Weak, Medium, High, Very High), applying customized conditions for each category based on price wave analysis, multi-layered filters, and the ADX (Average Directional Index).
#### **Concept of the Indicator**
The core idea is to combine a stable daily liquidity measurement with dynamic price analysis using sophisticated filters to generate precise signals. The indicator focuses on eliminating market noise through multiple analytical layers, making it an intelligent tool that adapts to various financial instruments based on their liquidity levels.
#### **How the Indicator Works**
1. **Liquidity Measurement:**
- Liquidity is calculated using the 14-day average trading volume multiplied by the closing price, always based on the daily timeframe to ensure value consistency regardless of the chart’s timeframe.
- Liquidity is classified as:
- **Weak:** Less than 5 million (adjustable).
- **Medium:** 5 to 20 million.
- **High:** 20 to 50 million.
- **Very High:** Over 50 million.
- This consistency in measurement ensures that liquidity classification remains unchanged across different timeframes, providing a reliable foundation for signals.
2. **Price Wave Analysis:**
- The indicator relies on wave analysis using various types of moving averages (e.g., SMA, EMA, WMA, HMA, etc.), which users can select and customize in terms of periods.
- This analysis is integrated with additional indicators like RSI (Relative Strength Index) and MFI (Money Flow Index), weighted specifically (40% waves, 30% RSI, 30% MFI) to provide a comprehensive trend assessment.
3. **Filters and Their Functionality:**
- The indicator employs a multi-layered filtering system to refine signals and reduce noise, a key hidden feature that enhances its accuracy:
- **Main Filter:**
- Smooths rapid price fluctuations using a mathematical equation rooted in signal processing techniques.
- Applied to price data to extract core trends away from random volatility, with an adjustable period (default: 30).
- Utilizes a technique similar to high-pass filters to focus on significant movements.
- **Sub Filter:**
- Acts as a secondary filtering layer with a shorter period (default: 12) for finer signal tuning.
- Employs low-frequency-based equations to ensure resulting signals reflect genuine changes rather than mere noise.
- **Signal Trigger:**
- Applies a moving average to the main filter’s output to generate a signal line, compared against predefined entry and exit thresholds.
- Trigger period is adjustable (default: 3 for entry, 5 for exit) to speed up or slow down signals.
- **Square Filter:**
- A hidden feature activated by default, enhancing filter precision by narrowing the range of permissible oscillations, reducing random signals in volatile markets.
4. **Signal Filtering with ADX:**
- ADX is used as a final filter to confirm trend strength before issuing signals:
- **Weak and Medium:** Entry when ADX exceeds 40, exit above 50.
- **High:** Entry above 40, exit above 55.
- **Very High:** Entry above 35, exit above 38.
- These thresholds are adjustable, allowing the indicator to adapt to different trading strategies.
5. **Signal Generation:**
- **Entry:** A buy signal is triggered when signal lines drop below a specific threshold (e.g., -9) and conditions for filters, liquidity, and ADX are met.
- **Exit:** A sell signal is issued when signal lines rise above a threshold (e.g., 109 or 106, depending on the category) with all conditions satisfied.
- Signals are displayed in distinct colors (blue for entry, orange for Weak/Medium, red for High/Very High) and three sizes (small, medium, large).
6. **Result Display:**
- The current liquidity level is shown in a table at the top-right of the chart, enabling users to easily identify the asset’s category.
7. **Alert Support:**
- Instant alerts are provided for each liquidity category, facilitating both automated and manual trading.
#### **Hidden Aspects in the Code**
- **Advanced Filter Equations:** The indicator uses complex mathematical formulas inspired by signal processing to smooth data and extract trends, making it more precise than traditional indicators.
- **Automatic Adaptation:** The system internally adjusts based on price and volume changes, with hidden correction factors (e.g., smoothing coefficients in filters) to maintain stability.
- **Weighted Distribution:** The integration of waves, RSI, and MFI uses fixed weights (40%, 30%, 30%) for balanced analysis, a detail not directly visible but impactful on results.
- **Square Filter:** A hidden option, enabled by default, narrows signal range to minimize dispersion in high-volatility markets.
#### **Indicator Features**
1. **Multi-Layered Filters:** Ensures noise reduction and delivers only reliable signals.
2. **Liquidity Stability:** Daily liquidity measurement keeps classification consistent across timeframes.
3. **Comprehensive Customization:** Allows adjustments to liquidity thresholds, ADX levels, filter periods, and moving average types.
4. **Clear Visual Signals:** User-friendly design with easy-to-read visuals and instant alerts.
5. **Reduced False Signals:** Combining filters and ADX enhances accuracy and minimizes clutter.
#### **Disclaimer**
The information and publications are not intended to be, nor do they constitute, financial, investment, trading, or other types of advice or recommendations provided or endorsed by TradingView.

ICT Bread and Butter Sell-SetupICT Bread and Butter Sell-Setup – TradingView Strategy
Overview:
The ICT Bread and Butter Sell-Setup is an intraday trading strategy designed to capitalize on bearish market conditions. It follows institutional order flow and exploits liquidity patterns within key trading sessions—London, New York, and Asia—to identify high-probability short entries.
Key Components of the Strategy:
🔹 London Open Setup (2:00 AM – 8:20 AM NY Time)
The London session typically sets the initial directional move of the day.
A short-term high often forms before a downward push, establishing the daily high.
🔹 New York Open Kill Zone (8:20 AM – 10:00 AM NY Time)
The New York Judas Swing (a temporary rally above London’s high) creates an opportunity for short entries.
Traders fade this move, anticipating a sell-off targeting liquidity below previous lows.
🔹 London Close Buy Setup (10:30 AM – 1:00 PM NY Time)
If price reaches a higher timeframe discount array, a retracement higher is expected.
A bullish order block or failure swing signals a possible reversal.
The risk is set just below the day’s low, targeting a 20-30% retracement of the daily range.
🔹 Asia Open Sell Setup (7:00 PM – 2:00 AM NY Time)
If institutional order flow remains bearish, a short entry is taken around the 0-GMT Open.
Expect a 15-20 pip decline as the Asian range forms.
Strategy Rules:
📉 Short Entry Conditions:
✅ New York Judas Swing occurs (price moves above London’s high before reversing).
✅ Short entry is triggered when price closes below the open.
✅ Stop-loss is set 10 pips above the session high.
✅ Take-profit targets liquidity zones on higher timeframes.
📈 Long Entry (London Close Reversal):
✅ Price reaches a higher timeframe discount array between 10:30 AM – 1:00 PM NY Time.
✅ A bullish order block confirms the reversal.
✅ Stop-loss is set 10 pips below the day’s low.
✅ Take-profit targets 20-30% of the daily range retracement.
📉 Asia Open Sell Entry:
✅ Price trades slightly above the 0-GMT Open.
✅ Short entry is taken at resistance, targeting a quick 15-20 pip move.
Why Use This Strategy?
🚀 Institutional Order Flow Tracking – Aligns with smart money concepts.
📊 Precise Session Timing – Uses market structure across London, New York, and Asia.
🎯 High-Probability Entries – Focuses on liquidity grabs and engineered stop hunts.
📉 Optimized Risk Management – Defined stop-loss and take-profit levels.
This strategy is ideal for traders looking to trade with institutions, fade liquidity grabs, and capture high-probability short setups during the trading day. 📉🔥

Mogwai Method with RSI and EMA - BTCUSD 15mThis is a custom TradingView indicator designed for trading Bitcoin (BTCUSD) on a 15-minute timeframe. It’s based on the Mogwai Method—a mean-reversion strategy—enhanced with the Relative Strength Index (RSI) for momentum confirmation. The indicator generates buy and sell signals, visualized as green and red triangle arrows on the chart, to help identify potential entry and exit points in the volatile cryptocurrency market.
Components
Bollinger Bands (BB):
Purpose: Identifies overextended price movements, signaling potential reversions to the mean.
Parameters:
Length: 20 periods (standard for mean-reversion).
Multiplier: 2.2 (slightly wider than the default 2.0 to suit BTCUSD’s volatility).
Role:
Buy signal when price drops below the lower band (oversold).
Sell signal when price rises above the upper band (overbought).
Relative Strength Index (RSI):
Purpose: Confirms momentum to filter out false signals from Bollinger Bands.
Parameters:
Length: 14 periods (classic setting, effective for crypto).
Overbought Level: 70 (price may be overextended upward).
Oversold Level: 30 (price may be overextended downward).
Role:
Buy signal requires RSI < 30 (oversold).
Sell signal requires RSI > 70 (overbought).
Exponential Moving Averages (EMAs) (Plotted but not currently in signal logic):
Purpose: Provides trend context (included in the script for visualization, optional for signal filtering).
Parameters:
Fast EMA: 9 periods (short-term trend).
Slow EMA: 50 periods (longer-term trend).
Role: Can be re-added to filter signals (e.g., buy only when Fast EMA > Slow EMA).
Signals (Triangles):
Buy Signal: Green upward triangle below the bar when price is below the lower Bollinger Band and RSI is below 30.
Sell Signal: Red downward triangle above the bar when price is above the upper Bollinger Band and RSI is above 70.
How It Works
The indicator combines Bollinger Bands and RSI to spot mean-reversion opportunities:
Buy Condition: Price breaks below the lower Bollinger Band (indicating oversold conditions), and RSI confirms this with a reading below 30.
Sell Condition: Price breaks above the upper Bollinger Band (indicating overbought conditions), and RSI confirms this with a reading above 70.
The strategy assumes that extreme price movements in BTCUSD will often revert to the mean, especially in choppy or ranging markets.
Visual Elements
Green Upward Triangles: Appear below the candlestick to indicate a buy signal.
Red Downward Triangles: Appear above the candlestick to indicate a sell signal.
Bollinger Bands: Gray lines (upper, middle, lower) plotted for reference.
EMAs: Blue (Fast) and Orange (Slow) lines for trend visualization.
How to Use the Indicator
Setup
Open TradingView:
Log into TradingView and select a BTCUSD chart from a supported exchange (e.g., Binance, Coinbase, Bitfinex).
Set Timeframe:
Switch the chart to a 15-minute timeframe (15m).
Add the Indicator:
Open the Pine Editor (bottom panel in TradingView).
Copy and paste the script provided.
Click “Add to Chart” to apply it.
Verify Display:
You should see Bollinger Bands (gray), Fast EMA (blue), Slow EMA (orange), and buy/sell triangles when conditions are met.
Trading Guidelines
Buy Signal (Green Triangle Below Bar):
What It Means: Price is oversold, potentially ready to bounce back toward the Bollinger Band middle line.
Action:
Enter a long position (buy BTCUSD).
Set a take-profit near the middle Bollinger Band (bb_middle) or a resistance level.
Place a stop-loss 1-2% below the entry (or based on ATR, e.g., ta.atr(14) * 2).
Best Context: Works well in ranging markets; avoid during strong downtrends.
Sell Signal (Red Triangle Above Bar):
What It Means: Price is overbought, potentially ready to drop back toward the middle line.
Action:
Enter a short position (sell BTCUSD) or exit a long position.
Set a take-profit near the middle Bollinger Band or a support level.
Place a stop-loss 1-2% above the entry.
Best Context: Effective in ranging markets; avoid during strong uptrends.
Trend Filter (Optional):
To reduce false signals in trending markets, you can modify the script:
Add and ema_fast > ema_slow to the buy condition (only buy in uptrends).
Add and ema_fast < ema_slow to the sell condition (only sell in downtrends).
Check the Fast EMA (blue) vs. Slow EMA (orange) alignment visually.
Tips for BTCUSD on 15-Minute Charts
Volatility: BTCUSD can be erratic. If signals are too frequent, increase bb_mult (e.g., to 2.5) or adjust RSI levels (e.g., 75/25).
Confirmation: Use volume spikes or candlestick patterns (e.g., doji, engulfing) to confirm signals.
Time of Day: Mean-reversion works best during low-volume periods (e.g., Asian session in crypto).
Backtesting: Use TradingView’s Strategy Tester (convert to a strategy by adding entry/exit logic) to evaluate performance with historical BTCUSD data up to March 13, 2025.
Risk Management
Position Size: Risk no more than 1-2% of your account per trade.
Stop Losses: Always use stops to protect against BTCUSD’s sudden moves.
Avoid Overtrading: Wait for clear signals; don’t force trades in choppy or unclear conditions.
Example Scenario
Chart: BTCUSD, 15-minute timeframe.
Buy Signal: Price drops to $58,000, below the lower Bollinger Band, RSI at 28. A green triangle appears.
Action: Buy at $58,000, target $59,000 (middle BB), stop at $57,500.
Sell Signal: Price rises to $60,500, above the upper Bollinger Band, RSI at 72. A red triangle appears.
Action: Sell at $60,500, target $59,500 (middle BB), stop at $61,000.
This indicator is tailored for mean-reversion trading on BTCUSD. Let me know if you’d like to tweak it further (e.g., add filters, alerts, or alternative indicators)!

Sniper Trade Pro (ES 15-Min) - Topstep Optimized🔹 Overview
Sniper Trade Pro is an advanced algorithmic trading strategy designed specifically for E-mini S&P 500 (ES) Futures on the 15-minute timeframe. This strategy is optimized for Topstep 50K evaluations, incorporating strict risk management to comply with their max $1,000 daily loss limit while maintaining a high probability of success.
It uses a multi-confirmation approach, integrating:
✅ Money Flow Divergence (MFD) → To track liquidity imbalances and institutional accumulation/distribution.
✅ Trend Confirmation (EMA + VWAP) → To identify strong trend direction and avoid choppy markets.
✅ ADX Strength Filter → To ensure entries only occur in trending conditions, avoiding weak setups.
✅ Break-Even & Dynamic Stop-Losses → To reduce drawdowns and protect profits dynamically.
This script automatically generates Buy and Sell signals and provides built-in risk management for automated trading execution through TradingView Webhooks.
🔹 How Does This Strategy Work?
📌 1. Trend Confirmation (EMA + VWAP)
The strategy uses:
✔ 9-EMA & 21-EMA: Fast-moving averages to detect short-term momentum.
✔ VWAP (Volume-Weighted Average Price): Ensures trades align with institutional volume flow.
How it works:
Bullish Condition: 9-EMA above 21-EMA AND price above VWAP → Confirms buy trend.
Bearish Condition: 9-EMA below 21-EMA AND price below VWAP → Confirms sell trend.
📌 2. Liquidity & Money Flow Divergence (MFD)
This indicator measures liquidity shifts by tracking momentum changes in price and volume.
✔ MFD Calculation:
Uses Exponential Moving Average (EMA) of Momentum (MOM) to detect changes in buying/selling pressure.
If MFD is above its moving average, it signals liquidity inflows → bullish strength.
If MFD is below its moving average, it signals liquidity outflows → bearish weakness.
Why is this important?
Detects when Smart Money is accumulating or distributing before major moves.
Filters out false breakouts by confirming momentum strength before entry.
📌 3. Trade Entry Triggers (Candlestick Patterns & ADX Filter)
To avoid random entries, the strategy waits for specific candlestick confirmations with ADX trend strength:
✔ Bullish Entry (Buy Signal) → Requires:
Bullish Engulfing Candle (Reversal confirmation)
ADX > 20 (Ensures strong trending conditions)
MFD above its moving average (Liquidity inflows)
9-EMA > 21-EMA & price above VWAP (Trend confirmation)
✔ Bearish Entry (Sell Signal) → Requires:
Bearish Engulfing Candle (Reversal confirmation)
ADX > 20 (Ensures strong trending conditions)
MFD below its moving average (Liquidity outflows)
9-EMA < 21-EMA & price below VWAP (Trend confirmation)
📌 4. Risk Management & Profit Protection
This strategy is built with strict risk management to maintain low drawdowns and maximize profits:
✔ Dynamic Position Sizing → Automatically adjusts trade size to risk a fixed $400 per trade.
✔ Adaptive Stop-Losses → Uses ATR-based stop-loss (0.8x ATR) to adapt to market volatility.
✔ Take-Profit Targets → Fixed at 2x ATR for a Risk:Reward ratio of 2:1.
✔ Break-Even Protection → Moves stop-loss to entry once price moves 1x ATR in profit, locking in gains.
✔ Max Daily Loss Limit (-$1,000) → Stops trading if total losses exceed $1,000, complying with Topstep rules.

TMA StrategyThe **TMA Strategy** is a trend-following strategy that leverages **Smoothed Moving Averages (SMMA)** and **candlestick patterns** to identify high-probability trading opportunities. It is designed for traders who want to capture strong trends while minimizing noise from short-term fluctuations.
**Key Features:**
✔ **Multiple Smoothed Moving Averages (SMMA):** Uses 21, 50, 100, and 200-period SMMAs to identify market trends and key support/resistance zones.
✔ **Candlestick Pattern Confirmation:** Incorporates **3-line strike** and **engulfing candle** patterns to confirm trade entries.
✔ **Dynamic Trend Filter:** A **2-period EMA** ensures that trades align with the dominant trend, reducing false signals.
✔ **Customizable Session Filter:** Allows users to enable/disable trading within specific market sessions (New York, London, Tokyo, etc.), ensuring trades are executed only during high-liquidity hours.
✔ **Risk Management:** Uses predefined exit conditions based on EMA/SMMA crossovers to lock in profits and minimize losses.
**Trading Logic:**
📌 **Long Entry:**
- Bullish Engulfing or 3-Line Strike pattern appears.
- Price is above the 200 SMMA.
- 2 EMA confirms an uptrend.
- Trade executes if session filter allows.
📌 **Short Entry:**
- Bearish Engulfing or 3-Line Strike pattern appears.
- Price is below the 200 SMMA.
- 2 EMA confirms a downtrend.
- Trade executes if session filter allows.
📌 **Exit Conditions:**
- Long trades exit when EMA(2) crosses **below** SMMA(200).
- Short trades exit when EMA(2) crosses **above** SMMA(200).
**Ideal Markets & Timeframes:**
✅ Best suited for **Forex, Stocks, and Crypto** markets.
✅ Works well on **higher timeframes (15m, 1H, 4H, Daily)** for stronger trend confirmation.
📢 **Disclaimer:**
This strategy is for educational purposes only. Backtest results do not guarantee future performance. Always use proper risk management and test in a demo account before live trading.
🚀 **Try the TMA Strategy now and enhance your trend-following approach!**

Price Action Trend and Margin EquityThe Price Action Trend and Margin Equity indicator is a multifunctional market analysis tool that combines elements of money management and price pattern analysis. The indicator helps traders identify key price action patterns and determine optimal entry, exit and stop loss levels based on the current trend.
The main components of the indicator:
Money Management:
Allows the trader to set risk management parameters such as the percentage of possible loss on the position, the use of fixed leverage and the total capital.
Calculates the required leverage level to achieve a specified percentage of loss.
Price Action:
Correctly identifies various price patterns such as Pin Bar, Engulfing Bar, PPR Bar and Inside Bar.
Displays these patterns on the chart with the ability to customize candle colors and display styles.
Allows the trader to customize take profit and stop loss points to display them on the chart.
The ability to display patterns only in the direction of the trend.
Trend: (some code taken from ChartPrime)
Uses a trend cloud to visualize the current market direction.
The trend cloud is displayed on the chart and helps traders determine whether the market is in an uptrend or a downtrend.
Alert:
Allows you to set an alert that will be triggered when the pattern is formed.
Example of use:
Let's say a trader uses the indicator to trade the crypto market. He sets the money management parameters, setting the maximum loss per position to 5% and using a fixed leverage of 1:100. The indicator automatically calculates the required position size to meet these parameters ($: on the label). Or displays the leverage (X: on the label) to achieve the required risk.
The trader receives an alert when a Pin Bar is formed. The indicator displays the entry, exit, and stop loss levels based on this pattern. The trader opens a position for the recommended amount in the direction indicated by the indicator and sets the stop loss and take profit at the recommended levels.
General Settings:
Position Loss Percentage: Sets the maximum loss percentage you are willing to take on a single position.
Use Fixed Leverage: Enables or disables the use of fixed leverage.
Fixed Leverage: Sets the fixed leverage level.
Total Equity: Specifies the total equity you are using for trading. (Required for calculation when using fixed leverage)
Turn Patterns On/Off: You can turn on or off the display of various price patterns such as Pin Bar, Outside Bar (Engulfing), Inside Bar, and PPR Bar.
Pattern Colors: Sets the colors for displaying each pattern on the chart.
Candle Color: Allows you to set a neutral color for candles that do not match the price action.
Show Lines: Allows you to turn on or off the display of labels and lines.
Line Length: Sets the length of the stop, entry, and take profit lines.
Label color: One color for all labels (configured below) or the color of the labels in the color of the candle pattern.
Pin entry: Select the entry point for the pin bar: candle head, bar close, or 50% of the candle.
Coefficients for stop and take lines.
Use trend for price action: When enabled, will show price action signals only in the direction of the trend.
Display trend cloud: Enables or disables the display of the trend cloud.
Cloud calculation period: Sets the period for which the maximum and minimum values for the cloud are calculated. The longer the period, the smoother the cloud will be.
Cloud colors: Sets the colors for uptrends and downtrends, as well as the transparency of the cloud.
The logic of the indicator:
Pin Bar is a candle with a long upper or lower shadow and a short body.
Logic: If the length of one shadow is twice the body and the opposite shadow of the candle, it is considered a Pin Bar.
An Inside Bar is a candle that is completely engulfed by the previous candle.
Logic: If the high and low of the current candle are inside the previous candle, it is an Inside Bar.
An Outside Bar or Engulfing is a candle that completely engulfs the previous candle.
Logic: If the high and low of the current candle are outside the previous candle and close outside the previous candle, it is an Outside Bar.
A PPR Bar is a candle that closes above or below the previous candle.
Logic: If the current candle closes above the high of the previous candle or below its low, it is a PPR Bar.
Stop Loss Levels: Calculated based on the specified ratios. If set to 1.0, it shows the correct stop for the pattern by pushing away from the entry point.
Take Profit Levels: Calculated based on the specified ratios.
Create a Label: The label is created at the stop loss level and contains information about the potential leverage and loss.
The formula for calculating the $ value is:
=(Total Capital x (Maximum Loss Percentage on Position/100)) / (Difference between Entry Level and Stop Loss Level × Ratio that sets the stop loss level relative to the length of the candlestick shadow × Fixed Leverage Value) .
Labels contain the following information:
The percentage of price change from the recommended entry point to the stop loss level.
Required Leverage (X: ): The amount of leverage required to achieve the specified loss percentage. (Or a fixed value if selected).
Required Capital ($: ): The amount of capital required to open a position with the specified leverage and loss percentage (only displayed when using fixed leverage).
The trend cloud identifies the maximum and minimum price values for the specified period.
The cloud value is set depending on whether the current price is equal to the high or low values.
If the current closing price is equal to the high value, the cloud is set at the low value, and vice versa.
RU
Индикатор "Price Action Trend and Margin Equity" представляет собой многофункциональный инструмент для анализа рынка, объединяющий в себе элементы управления капиталом и анализа ценовых паттернов. Индикатор помогает трейдерам идентифицировать ключевые прайс экшн паттерны и определять оптимальные уровни входа, выхода и стоп-лосс на основе текущего тренда.
Основные компоненты индикатора:
Управление капиталом:
Позволяет трейдеру задавать параметры управления рисками, такие как процент возможного убытка по позиции, использование фиксированного плеча и общий капитал.
Рассчитывает необходимый уровень плеча для достижения заданного процента убытка.
Price Action:
Правильно идентифицирует различные ценовые паттерны, такие как Pin Bar, Поглащение Бар, PPR Bar и Внутренний Бар.
Отображает эти паттерны на графике с возможностью настройки цветов свечей и стилей отображения.
Позволяет трейдеру настраивать точки тейк профита и стоп лосса для отображения их на графике.
Возможность отображения паттернов только в натправлении тренда.
Trend: (часть кода взята у ChartPrime)
Использует облако тренда для визуализации текущего направления рынка.
Облако тренда отображается на графике и помогает трейдерам определить, находится ли рынок в восходящем или нисходящем тренде.
Оповещение:
Дает возможность установить оповещение которое будет срабатывать при формировании паттерна.
Пример применения:
Предположим, трейдер использует индикатор для торговли на крипто рынке. Он настраивает параметры управления капиталом, устанавливая максимальный убыток по позиции в 5% и используя фиксированное плечо 1:100. Индикатор автоматически рассчитывает необходимый объем позиции для соблюдения этих параметров ($: на лейбле). Или отображает плечо (Х: на лейбле) для достижения необходимого риска.
Трейдер получает оповещение о формировании Pin Bar. Индикатор отображает уровни входа, выхода и стоп-лосс, основанные на этом паттерне. Трейдер открывает позицию на рекомендуемую сумму в направлении, указанном индикатором, и устанавливает стоп-лосс и тейк-профит на рекомендованных уровнях.
Общие настройки:
Процент убытка по позиции: Устанавливает максимальный процент убытка, который вы готовы понести по одной позиции.
Использовать фиксированное плечо: Включает или отключает использование фиксированного плеча.
Уровень фиксированного плеча: Задает уровень фиксированного плеча.
Общий капитал: Указывает общий капитал, который вы используете для торговли. (Необходим для расчета при использовании фиксированного плеча)
Включение/отключение паттернов: Вы можете включить или отключить отображение различных ценовых паттернов, таких как Pin Bar, Outside Bar (Поглощение), Inside Bar и PPR Bar.
Цвета паттернов: Задает цвета для отображения каждого паттерна на графике.
Цвет свечей: Позволяет задать нейтральный цвет для свечей неподходящих под прйс экшн.
Показывать линии: Позволяет включить или отключить отображение лейблов и линий.
Длинна линий: Настройка длинны линий стопа, линии входа и тейк профита.
Цвет лейбла: Один цвет для всех лейблов (настраивается ниже) или цвет лейблов в цвет паттерна свечи.
Вход в пин: Выбор точки входа для пин бара: голова свечи, точка закрытия бара или 50% свечи.
Коэффиценты для стоп и тейк линий.
Использовать тренд для прайс экшна: При включении будет показывать прайс экшн сигналы только в направлении тренда.
Отображение облака тренда: Включает или отключает отображение облака тренда.
Период расчета облака: Устанавливает период, за который рассчитываются максимальные и минимальные значения для облака. Чем больше период, тем более сглаженным будет облако.
Цвета облака: Задает цвета для восходящего и нисходящего трендов, а также прозрачность облака.
Логика работы индикатора:
Pin Bar — это свеча с длинной верхней или нижней тенью и коротким телом.
Логика: Если длина одной тени вдвое больше тела и противоположной тени свечи, считается, что это Pin Bar.
Inside Bar — это свеча, полностью поглощенная предыдущей свечой.
Логика: Если максимум и минимум текущей свечи находятся внутри предыдущей свечи, это Inside Bar.
Outside Bar или Поглощение — это свеча, которая полностью поглощает предыдущую свечу.
Логика: Если максимум и минимум текущей свечи выходят за пределы предыдущей свечи и закрывается за пределами предыдущей свечи, это Outside Bar.
PPR Bar — это свеча, которая закрывается выше или ниже предыдущей свечи.
Логика: Если текущая свеча закрывается выше максимума предыдущей свечи или ниже ее минимума, это PPR Bar.
Уровни стоп-лосс: Рассчитываются на основе заданных коэффициентов. При значении 1.0 показывает правильный стоп для паттерна отталкиваясь от точки входа.
Уровки тейк-профита: Рассчитываются на основе заданных коэффициентов.
Создание метки: Метка создается на уровне стоп-лосс и содержит информацию о потенциальном плече и убытке.
Формула для вычисления значения $:
=(Общий капитал x (Максимальный процент убытка по позиции/100)) / (Разница между уровнем входа и уровнем стоп-лосс × Коэффициент, задающий уровень стоп-лосс относительно длины тени свечи × Значение фиксированного плеча).
Метки содержат следующую информацию:
Процент изменения цены от рекомендованной точки входа до уровня стоп-лосс.
Необходимое плечо (Х: ): Уровень плеча, необходимый для достижения заданного процента убытка. (Или фиксированное значение если оно выбрано).
Необходимый капитал ($: ): Сумма капитала, необходимая для открытия позиции с заданным плечом и процентом убытка (отображается только при использовании фиксированного плеча).
Облако тренда определяет максимальные и минимальные значения цены за указанный период.
Значение облака устанавливается в зависимости от того, совпадает ли текущая цена с максимальными или минимальными значениями.
Если текущая цена закрытия равна максимальному значению, облако устанавливается на уровне минимального значения, и наоборот.

ORB with 100 EMAORB Trading Strategy for FX Pairs on the 30-Minute Time Frame
Overview
This Opening Range Breakout (ORB) strategy is designed for trading FX pairs on the 30-minute time frame. The strategy is structured to take advantage of price momentum while aligning trades with the overall trend using the 100-period Exponential Moving Average (100EMA). The primary objective is to enter trades when price breaks and closes above or below the Opening Range (OR), with additional confirmation from a retest of the OR level if the initial entry is missed.
Strategy Rules
1. Defining the Opening Range (OR)
- The OR is determined by the high and low of the first 30-minute candle after market open.
- This range acts as the key level for breakout trading.
2. Trend Confirmation Using the 100EMA
- The 100EMA serves as a filter to determine trade direction:
- Buy Setup: Only take buy trades when the OR is above the 100EMA.
- Sell Setup: Only take sell trades when the OR is below the 100EMA.
3. Entry Criteria
- Buy Trade: Enter a long position when a candle breaks and closes above the OR high, confirming the breakout.
- Sell Trade: Enter a short position when a candle breaks and closes below the OR low, confirming the breakout.
- Retest Entry: If the initial entry is missed, wait for a price retest of the OR level for a secondary entry opportunity.
4. Risk-to-Reward Ratio (R2R)
- The goal is to target a 1:1 Risk-to-Reward (R2R) ratio.
- Stop-loss placement:
- Buy Trade: Place stop-loss just below the OR low.
- Sell Trade: Place stop-loss just above the OR high.
- Take profit at a distance equal to the stop-loss for a 1:1 R2R.
5. Risk Management
- Risk per trade should be based on personal risk tolerance.
- Adjust lot sizes accordingly to maintain a controlled risk percentage of account balance.
- Avoid over-leveraging, and consider moving stop-loss to breakeven if the price moves favourably.
Additional Considerations
- Avoid trading during major news events that may cause high volatility and unpredictable price movements.
- Monitor market conditions to ensure breakout confirmation with strong momentum rather than false breakouts.
- Use additional confluences such as candlestick patterns, support/resistance zones, or volume analysis for stronger trade validation.
This ORB strategy is designed to provide structured trade opportunities by combining breakout momentum with trend confirmation via the 100EMA. The strategy is straightforward, allowing traders to capitalise on clear breakout movements while implementing effective risk management practices. While the 1:1 R2R target provides a balanced approach, traders should always adapt their risk tolerance and market conditions to optimise trade performance.
By following these rules and maintaining discipline, traders can use this strategy effectively across various FX pairs on the 30-minute time frame.
Bitcoin 1H-15M Breakout StrategyKey Features
1H and 15M Timeframes:
The script uses the 1-hour timeframe for the range and 15-minute timeframe for breakout conditions.
request.security is used to fetch the higher timeframe data.
Risk Management:
Variables entry_price, sl_price, and tp_price are declared explicitly as float with na initialization to handle dynamic assignment.
Stop-loss and take-profit levels are calculated based on the specified Risk-Reward Ratio (RRR) and buffer (in pips).
Trade Logic:
Long trade triggered when the 15-minute candle closes above the 1-hour high.
Short trade triggered when the 15-minute candle closes below the 1-hour low.
Visualization:
The range_high and range_low (previous 1-hour high and low) are plotted on the chart using dashed lines.
Debugging:
Enabling the show_debug input displays labels showing stop-loss and take-profit values for easier troubleshooting.

JJ Highlight Time Ranges with First 5 Minutes and LabelsTo effectively use this Pine Script as a day trader , here’s how the various elements can help you manage trades, track time sessions, and monitor price movements:
Key Components for a Day Trader:
1. First 5-Minute Highlight:
- Purpose: Day traders often rely on the first 5 minutes of the trading session to gauge market sentiment, watch for opening price gaps, or plan entries. This script draws a horizontal line at the high or low of the first 5 minutes, which can act as a key level for the rest of the day.
- How to Use: If the price breaks above or below the first 5-minute line, it can signal momentum. You might enter a long position if the price breaks above the first 5-minute high or a short if it breaks below the first 5-minute low.
2. Session Time Highlights:
- Morning Session (9:15–10:30 AM): The market often shows its strongest price action during the first hour of trading. This session is highlighted in yellow. You can use this highlight to focus on the most volatile period, as this is when large institutional moves tend to occur.
- Afternoon Session (12:30–2:55 PM): The blue highlight helps you track the mid-afternoon session, where liquidity may decrease, and price action can sometimes be choppier. Day traders should be more cautious during this period.
- How to Use: By highlighting these key times, you can:
- Focus on key breakouts during the morning session.
- Be more conservative in your trades during the afternoon, as market volatility may drop.
3. Dynamic Labels:
- Top/Bottom Positioning: The script places labels dynamically based on the selected position (Top or Bottom). This allows you to quickly glance at the session's start and identify where you are in terms of time.
- How to Use: Use these labels to remind yourself when major time segments (morning or afternoon) begin. You can adjust your trading strategy depending on the session, e.g., being more aggressive in the morning and more cautious in the afternoon.
Trading Strategy Suggestions:
1. Momentum Trades:
- After the first 5 minutes, use the high/low of that period to set up breakout trades.
- Long Entry: If the price breaks the high of the first 5 minutes (especially if there's a strong trend).
- Short Entry: If the price breaks the low of the first 5 minutes, signaling a potential downtrend.
2. Session-Based Strategy:
- Morning Session (9:15–10:30 AM):
- Look for strong breakout patterns such as support/resistance levels, moving average crossovers, or candlestick patterns (like engulfing candles or pin bars).
- This is a high liquidity period, making it ideal for executing quick trades.
- Afternoon Session (12:30–2:55 PM):
- The market tends to consolidate or show less volatility. Scalping and mean-reversion strategies work better here.
- Avoid chasing big moves unless you see a clear breakout in either direction.
3. Support and Resistance:
- The first 5-minute high/low often acts as a key support or resistance level for the rest of the day. If the price holds above or below this level, it’s an indication of trend continuation.
4. Breakout Confirmation:
- Look for breakouts from the highlighted session time ranges (e.g., 9:15 AM–10:30 AM or 12:30 PM–2:55 PM).
- If a breakout happens during a key time window, combine that with other technical indicators like volume spikes , RSI , or MACD for confirmation.
---
Example Day Trader Usage:
1. First 5 Minutes Strategy: After the market opens at 9:15 AM, watch the price action for the first 5 minutes. The high and low of these 5 minutes are critical levels. If the price breaks above the high of the first 5 minutes, it might indicate a strong bullish trend for the day. Conversely, breaking below the low may suggest bearish movement.
2. Morning Session: After the first 5 minutes, focus on the **9:15 AM–10:30 AM** window. During this time, look for breakout setups at key support/resistance levels, especially when paired with high volume or momentum indicators. This is when many institutions make large trades, so price action tends to be more volatile and predictable.
3. Afternoon Session: From 12:30 PM–2:55 PM, the market might experience lower volatility, making it ideal for scalping or range-bound strategies. You could look for reversals or fading strategies if the market becomes too quiet.
Conclusion:
As a day trader, you can use this script to:
- Track and react to key price levels during the first 5 minutes.
- Focus on high volatility in the morning session (9:15–10:30 AM) and **be cautious** during the afternoon.
- Use session-based timing to adjust your strategies based on the time of day.

Dynamic Volatility Differential Model (DVDM)The Dynamic Volatility Differential Model (DVDM) is a quantitative trading strategy designed to exploit the spread between implied volatility (IV) and historical (realized) volatility (HV). This strategy identifies trading opportunities by dynamically adjusting thresholds based on the standard deviation of the volatility spread. The DVDM is versatile and applicable across various markets, including equity indices, commodities, and derivatives such as the FDAX (DAX Futures).
Key Components of the DVDM:
1. Implied Volatility (IV):
The IV is derived from options markets and reflects the market’s expectation of future price volatility. For instance, the strategy uses volatility indices such as the VIX (S&P 500), VXN (Nasdaq 100), or RVX (Russell 2000), depending on the target market. These indices serve as proxies for market sentiment and risk perception (Whaley, 2000).
2. Historical Volatility (HV):
The HV is computed from the log returns of the underlying asset’s price. It represents the actual volatility observed in the market over a defined lookback period, adjusted to annualized levels using a multiplier of \sqrt{252} for daily data (Hull, 2012).
3. Volatility Spread:
The difference between IV and HV forms the volatility spread, which is a measure of divergence between market expectations and actual market behavior.
4. Dynamic Thresholds:
Unlike static thresholds, the DVDM employs dynamic thresholds derived from the standard deviation of the volatility spread. The thresholds are scaled by a user-defined multiplier, ensuring adaptability to market conditions and volatility regimes (Christoffersen & Jacobs, 2004).
Trading Logic:
1. Long Entry:
A long position is initiated when the volatility spread exceeds the upper dynamic threshold, signaling that implied volatility is significantly higher than realized volatility. This condition suggests potential mean reversion, as markets may correct inflated risk premiums.
2. Short Entry:
A short position is initiated when the volatility spread falls below the lower dynamic threshold, indicating that implied volatility is significantly undervalued relative to realized volatility. This signals the possibility of increased market uncertainty.
3. Exit Conditions:
Positions are closed when the volatility spread crosses the zero line, signifying a normalization of the divergence.
Advantages of the DVDM:
1. Adaptability:
Dynamic thresholds allow the strategy to adjust to changing market conditions, making it suitable for both low-volatility and high-volatility environments.
2. Quantitative Precision:
The use of standard deviation-based thresholds enhances statistical reliability and reduces subjectivity in decision-making.
3. Market Versatility:
The strategy’s reliance on volatility metrics makes it universally applicable across asset classes and markets, ensuring robust performance.
Scientific Relevance:
The strategy builds on empirical research into the predictive power of implied volatility over realized volatility (Poon & Granger, 2003). By leveraging the divergence between these measures, the DVDM aligns with findings that IV often overestimates future volatility, creating opportunities for mean-reversion trades. Furthermore, the inclusion of dynamic thresholds aligns with risk management best practices by adapting to volatility clustering, a well-documented phenomenon in financial markets (Engle, 1982).
References:
1. Christoffersen, P., & Jacobs, K. (2004). The importance of the volatility risk premium for volatility forecasting. Journal of Financial and Quantitative Analysis, 39(2), 375-397.
2. Engle, R. F. (1982). Autoregressive conditional heteroskedasticity with estimates of the variance of United Kingdom inflation. Econometrica, 50(4), 987-1007.
3. Hull, J. C. (2012). Options, Futures, and Other Derivatives. Pearson Education.
4. Poon, S. H., & Granger, C. W. J. (2003). Forecasting volatility in financial markets: A review. Journal of Economic Literature, 41(2), 478-539.
5. Whaley, R. E. (2000). The investor fear gauge. Journal of Portfolio Management, 26(3), 12-17.
This strategy leverages quantitative techniques and statistical rigor to provide a systematic approach to volatility trading, making it a valuable tool for professional traders and quantitative analysts.

Forex Pair Yield Momentum This Pine Script strategy leverages yield differentials between the 2-year government bond yields of two countries to trade Forex pairs. Yield spreads are widely regarded as a fundamental driver of currency movements, as highlighted by international finance theories like the Interest Rate Parity (IRP), which suggests that currencies with higher yields tend to appreciate due to increased capital flows:
1. Dynamic Yield Spread Calculation:
• The strategy dynamically calculates the yield spread (yield_a - yield_b) for the chosen Forex pair.
• Example: For GBP/USD, the spread equals US 2Y Yield - UK 2Y Yield.
2. Momentum Analysis via Bollinger Bands:
• Yield momentum is computed as the difference between the current spread and its moving
Bollinger Bands are applied to identify extreme deviations:
• Long Entry: When momentum crosses below the lower band.
• Short Entry: When momentum crosses above the upper band.
3. Reversal Logic:
• An optional checkbox reverses the trading logic, allowing long trades at the upper band and short trades at the lower band, accommodating different market conditions.
4. Trade Management:
• Positions are held for a predefined number of bars (hold_periods), and each trade uses a fixed contract size of 100 with a starting capital of $20,000.
Theoretical Basis:
1. Yield Differentials and Currency Movements:
• Empirical studies, such as Clarida et al. (2009), confirm that interest rate differentials significantly impact exchange rate dynamics, especially in carry trade strategies .
• Higher-yields tend to appreciate against lower-yielding currencies due to speculative flows and demand for higher returns.
2. Bollinger Bands for Momentum:
• Bollinger Bands effectively capture deviations in yield momentum, identifying opportunities where price returns to equilibrium (mean reversion) or extends in trend-following scenarios (momentum breakout).
• As Bollinger (2001) emphasized, this tool adapts to market volatility by dynamically adjusting thresholds .
References:
1. Dornbusch, R. (1976). Expectations and Exchange Rate Dynamics. Journal of Political Economy.
2. Obstfeld, M., & Rogoff, K. (1996). Foundations of International Macroeconomics.
3. Clarida, R., Davis, J., & Pedersen, N. (2009). Currency Carry Trade Regimes. NBER.
4. Bollinger, J. (2001). Bollinger on Bollinger Bands.
5. Mendelsohn, L. B. (2006). Forex Trading Using Intermarket Analysis.

McClellan A-D Volume Integration ModelThe strategy integrates the McClellan A-D Oscillator with an adjustment based on the Advance/Decline (A-D) volume data. The McClellan Oscillator is calculated by taking the difference between the short-term and long-term exponential moving averages (EMAs) of the A-D line. This strategy introduces an enhancement where the A-D volume (the difference between the advancing and declining volume) is factored in to adjust the oscillator value.
Inputs:
• ema_short_length: The length for the short-term EMA of the A-D line.
• ema_long_length: The length for the long-term EMA of the A-D line.
• osc_threshold_long: The threshold below which the oscillator must drop for an entry signal to trigger.
• exit_periods: The number of periods after which the position is closed.
• Data Sources:
• ad_advance and ad_decline are the data sources for advancing and declining issues, respectively.
• vol_advance and vol_decline are the volume data for the advancing and declining issues. If volume data is unavailable, it defaults to na (Not Available), and the fallback logic ensures that the strategy continues to function.
McClellan Oscillator with Volume Adjustment:
• The A-D line is calculated by subtracting the declining issues from the advancing issues. Then, the volume difference is applied to this line, creating a “weighted” A-D line.
• The short and long EMAs are calculated for the weighted A-D line to generate the McClellan Oscillator.
Entry Condition:
• The strategy looks for a reversal signal, where the oscillator falls below the threshold and then rises above it again. The condition is designed to trigger a long position when this reversal happens.
Exit Condition:
• The position is closed after a set number of periods (exit_periods) have passed since the entry.
Plotting:
• The McClellan Oscillator and the threshold are plotted on the chart for visual reference.
• Entry and exit signals are highlighted with background colors to make the signals more visible.
Scientific Background:
The McClellan A-D Oscillator is a popular market breadth indicator developed by Sherman and Marian McClellan. It is used to gauge the underlying strength of a market by analyzing the difference between the number of advancing and declining stocks. The oscillator is typically calculated using exponential moving averages (EMAs) of the A-D line, with the idea being that crossovers of these EMAs indicate potential changes in the market’s direction.
The integration of A-D volume into this model adds another layer of analysis, as volume is often considered a leading indicator of price movement. By factoring in volume, the strategy becomes more sensitive to not just the number of advancing or declining stocks but also how significant those movements are based on trading volume, as discussed in Schwager, J. D. (1999). Technical Analysis of the Financial Markets. This enhanced version aims to capture stronger and more sustainable trends in the market, helping to filter out false signals.
Additionally, volume analysis is often used to confirm price movements, as described in Wyckoff, R. (1931). The Day Trading System. Therefore, incorporating the volume of advancing and declining stocks in the McClellan Oscillator offers a more robust signal for trading decisions.

Swing High/Low Pivots Strategy [LV]The Swing High/Low Pivots Strategy was developed as a counter-momentum trading tool.
The strategy is suitable for any market and the default values used in the input settings menu are set for Bitcoin (best on 15min). These values, expressed in minimum ticks (or pips if symbol is Forex) make this tool perfectly adaptable to every symbol and/or timeframe.
Check tooltips in the settings menu for more details about every user input.
STRTEGY ENTRY & EXIT MECHANISMS:
Trades Entry based on the detection of swing highs and lows for short and long entries respectively, validated by:
- Limit orders placed after each new pivot level confirmation
- Moving averages trend filter (if enabled)
- No active trade currently open
Trades Exit when the price reaches take-profit or stop-loss level as defined in the settings menu. A double entry/second take-profit level can be enabled for partial exits, with dynamic stop-loss adjustment for the remaining position.
Enhanced Trade Precision:
By limiting entries to confirmed swing high (HH, LH) or swing low (HL, LL) pivot points, the strategy ensures that trades occur at levels of significant price reversals. This precision reduces the likelihood of entering trades in the midst of a trend or during uncertain price action.
Risk Management Optimization:
The strategy incorporates clearly defined stop-loss (SL) and take-profit (TP) levels derived from the pivot points. This structured approach minimizes potential losses while locking in profits, which is critical for consistent performance in volatile markets.
Trend Filtering for Better Entry:
The use of a configurable moving average filter adds a layer of trend validation. This prevents entering trades against the dominant market trend, increasing the probability of success for each trade.
Avoidance of Noise:
The lookback period (length parameter) confirms pivots only after a set number of bars, effectively filtering out market noise and ensuring that entries are based on reliable, well-defined price movements.
Adaptability Across Markets:
The strategy is versatile and can be applied across different markets (Forex, stocks, crypto) due to its dynamic use of ticks and pips converters. It adapts seamlessly to varying price scales and asset types.
Dual Quantity Entries:
The original and optionnal double-entry mechanism allows traders to capture both short-term and extended profits by scaling out of positions. This adaptive approach caters to varying risk appetites and market conditions.
Clear Visualization:
The plotted pivot points, entry limits, SL, and TP levels provide visual clarity, making it easy for traders to track the strategy's behavior and make informed decisions.
Automated Execution with Alerts:
Integrated alerts for both entries and exits ensure timely actions without the need for constant market monitoring, enhancing efficiency. Configurable alert messages are suitable for API use.
Any feedback, comments, or suggestions for improvement are always welcome.
Hope you enjoy!

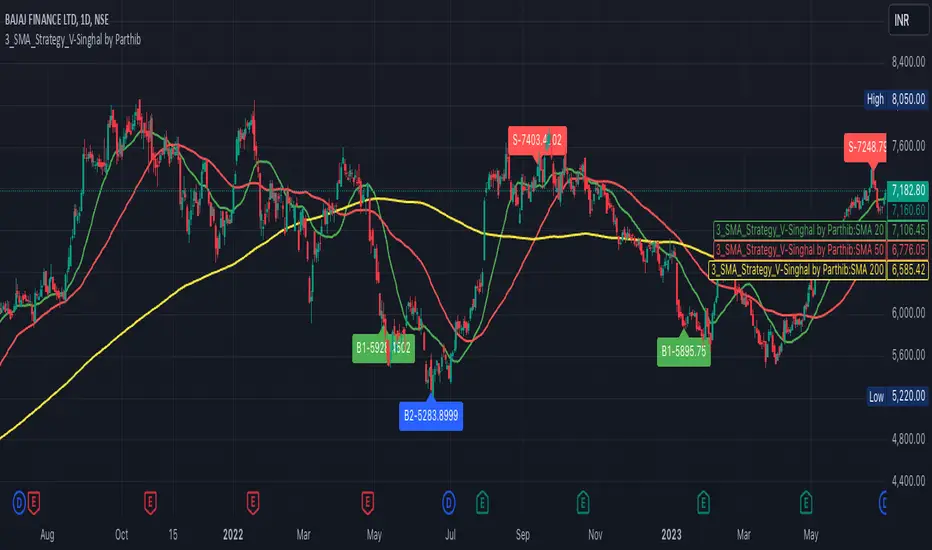
3_SMA_Strategy_V-Singhal by ParthibIndicator Name: 3_SMA_Strategy_V-Singhal by Parthib
Description:
The 3_SMA_Strategy_V-Singhal by Parthib is a dynamic trend-following strategy that combines three key simple moving averages (SMA) — SMA 20, SMA 50, and SMA 200 — to generate buy and sell signals. This strategy uses these SMAs to capture and follow market trends, helping traders identify optimal entry (buy) and exit (sell) points. Additionally, the strategy highlights the closing price (CP), which plays a critical role in confirming buy and sell signals.
The strategy also features a Second Buy Signal triggered if the price falls more than 10% after an initial buy signal, providing a re-entry opportunity with a different visual highlight for the second buy signal.
Features:
Three Simple Moving Averages (SMA):
SMA 20: Short-term moving average reflecting immediate market trends.
SMA 50: Medium-term moving average showing the prevailing trend.
SMA 200: Long-term moving average that indicates the overall market trend.
Buy Signal (B1):
Triggered when:
SMA 200 > SMA 50 > SMA 20, indicating a bullish market structure.
The closing price is positioned below all three SMAs, confirming a potential upward reversal.
A green label appears at the low of the bar with the text B1-Price, indicating the price at which the buy signal is generated.
Second Buy Signal (B2):
Triggered if the price falls more than 10% after the first buy signal, providing an opportunity to re-enter the market at a potentially better price.
A blue label appears at the low of the bar with the text B2-Price, showing the price at which the second buy opportunity arises.
Sell Signal (S):
Triggered when:
SMA 20 > SMA 50 > SMA 200, indicating a bearish trend.
The closing price (CP) is positioned above all three SMAs, confirming a potential downward movement.
A red label appears at the high of the bar with the text S-Price, showing the price at which the sell signal is triggered.
How It Works:
Buy Conditions:
SMA 200 > SMA 50 > SMA 20: Indicates a bullish market where the long-term trend (SMA 200) is above the medium-term (SMA 50), and the medium-term trend is above the short-term (SMA 20).
Closing price below all three SMAs: Confirms that the price is in a favorable position for a potential upward reversal.
Sell Conditions:
SMA 20 > SMA 50 > SMA 200: This setup indicates a bearish trend.
Closing price above all three SMAs: Confirms that the price is in a favorable position for a potential downward movement.
Second Buy Signal (B2): If the price falls more than 10% after the first buy signal, the strategy triggers a second buy opportunity (B2) at a potentially better price. This helps traders take advantage of pullbacks or corrections after an initial favorable entry.
Labeling System:
B1-Price: The first buy signal label, appearing when the market is bullish and the closing price is below all three SMAs.
B2-Price: The second buy signal label, triggered if the price falls more than 10% after the initial buy signal.
S-Price: The sell signal label, appearing when the market turns bearish and the closing price is above all three SMAs.
How to Use:
Add the Indicator: Add "3_SMA_Strategy_V-Singhal by Parthib" to your chart on TradingView.
Interpret Buy Signals (B1): Look for green labels with the text "B1-Price" when the closing price (CP) is below all three SMAs and the trend is bullish.
Interpret Second Buy Signals (B2): If the price falls more than 10% after the first buy, look for blue labels with "B2-Price" and a re-entry opportunity.
Interpret Sell Signals (S): Look for red labels with the text "S-Price" when the market turns bearish, and the closing price (CP) is above all three SMAs.
Conclusion:
The 3_SMA_Strategy_V-Singhal by Parthib is an efficient and simple trend-following tool for traders looking to make informed buy and sell decisions. By combining the power of three SMAs and the closing price (CP) confirmation, this strategy helps traders to buy when the market shows a strong bullish setup and sell when the trend turns bearish. Additionally, the second buy signal feature ensures that traders don’t miss out on re-entry opportunities after price corrections, giving them a chance to re-enter the market at a favorable price.
Smart DCA Strategy (Public)INSPIRATION
While Dollar Cost Averaging (DCA) is a popular and stress-free investment approach, I noticed an opportunity for enhancement. Standard DCA involves buying consistently, regardless of market conditions, which can sometimes mean missing out on optimal investment opportunities. This led me to develop the Smart DCA Strategy – a 'set and forget' method like traditional DCA, but with an intelligent twist to boost its effectiveness.
The goal was to build something more profitable than a standard DCA strategy so it was equally important that this indicator could backtest its own results in an A/B test manner against the regular DCA strategy.
WHY IS IT SMART?
The key to this strategy is its dynamic approach: buying aggressively when the market shows signs of being oversold, and sitting on the sidelines when it's not. This approach aims to optimize entry points, enhancing the potential for better returns while maintaining the simplicity and low stress of DCA.
WHAT THIS STRATEGY IS, AND IS NOT
This is an investment style strategy. It is designed to improve upon the common standard DCA investment strategy. It is therefore NOT a day trading strategy. Feel free to experiment with various timeframes, but it was designed to be used on a daily timeframe and that's how I recommend it to be used.
You may also go months without any buy signals during bull markets, but remember that is exactly the point of the strategy - to keep your buying power on the sidelines until the markets have significantly pulled back. You need to be patient and trust in the historical backtesting you have performed.
HOW IT WORKS
The Smart DCA Strategy leverages a creative approach to using Moving Averages to identify the most opportune moments to buy. A trigger occurs when a daily candle, in its entirety including the high wick, closes below the threshold line or box plotted on the chart. The indicator is designed to facilitate both backtesting and live trading.
HOW TO USE
Settings:
The input parameters for tuning have been intentionally simplified in an effort to prevent users falling into the overfitting trap.
The main control is the Buying strictness scale setting. Setting this to a lower value will provide more buying days (less strict) while higher values mean less buying days (more strict). In my testing I've found level 9 to provide good all round results.
Validation days is a setting to prevent triggering entries until the asset has spent a given number of days (candles) in the overbought state. Increasing this makes entries stricter. I've found 0 to give the best results across most assets.
In the backtest settings you can also configure how much to buy for each day an entry triggers. Blind buy size is the amount you would buy every day in a standard DCA strategy. Smart buy size is the amount you would buy each day a Smart DCA entry is triggered.
You can also experiment with backtesting your strategy over different historical datasets by using the Start date and End date settings. The results table will not calculate for any trades outside what you've set in the date range settings.
Backtesting:
When backtesting you should use the results table on the top right to tune and optimise the results of your strategy. As with all backtests, be careful to avoid overfitting the parameters. It's better to have a setup which works well across many currencies and historical periods than a setup which is excellent on one dataset but bad on most others. This gives a much higher probability that it will be effective when you move to live trading.
The results table provides a clear visual representation as to which strategy, standard or smart, is more profitable for the given dataset. You will notice the columns are dynamically coloured red and green. Their colour changes based on which strategy is more profitable in the A/B style backtest - green wins, red loses. The key metrics to focus on are GOA (Gain on Account) and Avg Cost.
Live Trading:
After you've finished backtesting you can proceed with configuring your alerts for live trading.
But first, you need to estimate the amount you should buy on each Smart DCA entry. We can use the Total invested row in the results table to calculate this. Assuming we're looking to trade on
BTCUSD
Decide how much USD you would spend each day to buy BTC if you were using a standard DCA strategy. Lets say that is $5 per day
Enter that USD amount in the Blind buy size settings box
Check the Blind Buy column in the results table. If we set the backtest date range to the last 10 years, we would expect the amount spent on blind buys over 10 years to be $18,250 given $5 each day
Next we need to tweak the value of the Smart buy size parameter in setting to get it as close as we can to the Total Invested amount for Blind Buy
By following this approach it means we will invest roughly the same amount into our Smart DCA strategy as we would have into a standard DCA strategy over any given time period.
After you have calculated the Smart buy size, you can go ahead and set up alerts on Smart DCA buy triggers.
BOT AUTOMATION
In an effort to maintain the 'set and forget' stress-free benefits of a standard DCA strategy, I have set my personal Smart DCA Strategy up to be automated. The bot runs on AWS and I have a fully functional project for the bot on my GitHub account. Just reach out if you would like me to point you towards it. You can also hook this into any other 3rd party trade automation system of your choice using the pre-configured alerts within the indicator.
PLANNED FUTURE DEVELOPMENTS
Currently this is purely an accumulation strategy. It does not have any sell signals right now but I have ideas on how I will build upon it to incorporate an algorithm for selling. The strategy should gradually offload profits in bull markets which generates more USD which gives more buying power to rinse and repeat the same process in the next cycle only with a bigger starting capital. Watch this space!
MARKETS
Crypto:
This strategy has been specifically built to work on the crypto markets. It has been developed, backtested and tuned against crypto markets and I personally only run it on crypto markets to accumulate more of the coins I believe in for the long term. In the section below I will provide some backtest results from some of the top crypto assets.
Stocks:
I've found it is generally more profitable than a standard DCA strategy on the majority of stocks, however the results proved to be a lot more impressive on crypto. This is mainly due to the volatility and cycles found in crypto markets. The strategy makes its profits from capitalising on pullbacks in price. Good stocks on the other hand tend to move up and to the right with less significant pullbacks, therefore giving this strategy less opportunity to flourish.
Forex:
As this is an accumulation style investment strategy, I do not recommend that you use it to trade Forex.
For more info about this strategy including backtest results, please see the full description on the invite only version of this strategy named "Smart DCA Strategy"

Momentum Zones [TradersPro]OVERVIEW
The Momentum Zones indicator is designed for momentum stock traders to provide a visible trend structure with actionable price levels. The indicator has been designed for high-growth, bullish stocks on a daily time frame but can be used on any chart and timeframe.
Momentum zones help traders focus on the momentum structure of price, enabling disciplined trading plans with specific entry, exit, and risk management levels.
It is built using CCI values, allowing for fixed trend range calculations. It is most effective when applied to screens of stocks with high RSI, year-to-date (YTD) price gains of 25% or higher, as well as stocks showing growth in both sales and earnings quarter-over-quarter and year-over-year.
CONCEPTS
The indicator defines and colors uptrends (green), downtrends (red), and trends in transition or pausing (yellow).
The indicator can be used for new trend entry or trend continuation entry. New trend entry can be done on the first green bar after a red bar. Trend continuation entries can be done with the first green bar after a yellow bar. The yellow transition zones can be used as price buffers for stop-loss management on new entries.
To see the color changes, users need to be sure to uncheck the candlestick color settings. This can be done by right-clicking the chart, going to Symbols, and unchecking the candle color body, border, and wick boxes.
Remember to check them if the indicator is turned off, or the candles will be blank with no color.
The settings also correspond to the screening function to get a list of stocks entering various momentum zones so you can have a prime list of the stocks meeting any other fundamental criteria you may desire. Traders can then use the indicator for the entry and risk structure of the trading plan.

Lot Size & Risk Calculator (All Pairs)this indicator is designed to simplify and optimize risk management. It automatically calculates the ideal lot size based on your account balance, risk percentage, and defined entry and exit levels. Additionally, it includes visual tools to represent stop-loss (SL) and take-profit (TP) levels, helping you trade with precision and consistency.
WHAT IS THIS INDICATOR FOR?
This indicator is essential for traders who want to:
Maintain consistent risk in their trades.
Quickly calculate lot sizes for Forex, XAUUSD, BTCUSD, and US100.
Visualize key levels (Entry, SL, and TP) on the chart.
Monitor potential losses and gains in real time.
COMPATIBLE ASSETS
The Lot Size Calculator works with the following assets:
Forex: Standard currency pairs.
XAUUSD: Gold versus the US dollar.
BTCUSD: Bitcoin versus the US dollar.
US100: Nasdaq 100 index.
Calculations adjust automatically based on the selected asset.
TAKE-PROFIT (TP) LEVELS
The indicator allows you to define up to three take-profit levels:
TP1
TP2
TP3
.
Each level is configurable based on your exit strategy.
DASHBOARD
The dashboard is a visual tool that consolidates key information about your trade:
Account balance: Total amount available in your account.
Lot size: Calculated based on your risk and parameters.
Potential loss (SL): Amount you could lose if the price hits your stop-loss.
Potential gain (TP): Expected profit if the take-profit level is reached.
SETTINGS
The indicator offers multiple configurable options to adapt to your trading style:
Levels
Entry: Initial trade price.
Stop-Loss (SL): Maximum allowed loss level.
Take-Profit (TP): Up to three configurable levels.
Risk Management
Account balance ($): Enter your total available balance.
Risk percentage: Define how much you're willing to risk per trade
.
Visual Options
Visualization style: Choose between simple lines or visual fills.
Colors: Customize the colors of lines and labels.
Dashboard Settings
Statistics: Enable or disable key data display.
Size and position: Adjust the dashboard's size and location on the chart.
HOW TO CHANGE AN ENTRY?
Open the indicator settings in TradingView and entering the new data manually
Removing and re-adding the indicator to the chart

Adaptive MA Crossover with ATR-Based Risk MarkersDescription:
The Cross MA Entry Indicator with ATR-Based Stop-Loss and Take-Profit Markers is a powerful tool designed to help traders identify trend-following opportunities while managing risk effectively. By combining customizable moving average (MA) crossovers with ATR-based stop-loss (SL) and take-profit (TP) markers, this indicator provides a complete entry and risk management framework in a single script.
Unique Features:
1. Versatile Moving Average Combinations: The indicator allows users to select from four types of moving averages—SMA, EMA, DEMA, and TEMA—for both fast and slow lines, enabling a variety of crossover configurations. This flexibility helps traders tailor entry signals to specific trading strategies, asset types, or market conditions, enhancing the adaptability of the indicator across different styles and preferences.
2. ATR-Based Dynamic Risk Management: Leveraging the Average True Range (ATR), the indicator dynamically calculates stop-loss and take-profit levels based on market volatility. This approach adjusts to changing market conditions, making it more responsive and reliable for setting realistic, volatility-based risk parameters.
3. Customizable Risk/Reward Ratio: Users can define their preferred risk/reward ratio (e.g., 2:1, 3:1) to tailor take-profit levels relative to stop-loss distances. This feature empowers traders to align trades with their individual risk management strategies and objectives, while maintaining consistency and discipline in execution.
4. Streamlined Visualization of Entry and Risk Levels: Upon a crossover, the indicator places discrete markers at the calculated SL and TP levels, avoiding clutter while providing traders with an immediate view of potential risk and reward. Small dots represent SL and TP levels, offering a clean, clear display of critical decision points.
How to Use:
1. Entry Signals from MA Crossovers: This indicator generates entry signals when the selected moving averages cross, with green markers indicating long entries and red markers indicating short entries. The customizable MA selection enables traders to optimize crossover signals for various timeframes and asset classes.
2. Integrated Risk Markers: SL and TP levels are shown as small dots at the crossover point, based on the ATR multiplier and risk/reward ratio settings. These markers allow traders to quickly visualize the defined risk and potential reward for each entry.
This indicator offers a comprehensive solution for trend-following strategies by combining entry signals with adaptive risk management. Suitable for multiple timeframes, it allows for backtesting and adjustments to ATR and risk/reward parameters for improved alignment with individual trading goals. As with all strategies, thorough testing is recommended to ensure compatibility with your trading approach.

Stoch RSI and RSI Buy/Sell Signals with MACD Trend FilterDescription of the Indicator
This Pine Script is designed to provide traders with buy and sell signals based on the combination of Stochastic RSI, RSI, and MACD indicators, enhanced by the confirmation of candle colors. The primary goal is to facilitate informed trading decisions in various market conditions by utilizing different indicators and their interactions. The script allows customization of various parameters, providing flexibility for traders to adapt it to their specific trading styles.
Usefulness
This indicator is not just a mashup of existing indicators; it integrates the functionality of multiple momentum and trend-detection methods into a cohesive trading tool. The combination of Stochastic RSI, RSI, and MACD offers a well-rounded approach to analyzing market conditions, allowing traders to identify entry and exit points effectively. The inclusion of color-coded signals (strong vs. weak) further enhances its utility by providing visual cues about the strength of the signals.
How to Use This Indicator
Input Settings: Adjust the parameters for the Stochastic RSI, RSI, and MACD to fit your trading style. Set the overbought/oversold levels according to your risk tolerance.
Signal Colors:
Strong Buy Signal: Indicated by a green label and confirmed by a green candle (close > open).
Weak Buy Signal: Indicated by a blue label and confirmed by a green candle (close > open).
Strong Sell Signal: Indicated by a red label and confirmed by a red candle (close < open).
Weak Sell Signal: Indicated by an orange label and confirmed by a red candle (close < open).
Example Trading Strategy Using This Indicator
To effectively use this indicator as part of your trading strategy, follow these detailed steps:
Setup:
Timeframe : Select a timeframe that aligns with your trading style (e.g., 15-minute for intraday, 1-hour for swing trading, or daily for longer-term positions).
Indicator Settings : Customize the Stochastic RSI, RSI, and MACD parameters to suit your trading approach. Adjust overbought/oversold levels to match your risk tolerance.
Strategy:
1. Strong Buy Entry Criteria :
Wait for a strong buy signal (green label) when the RSI is at or below the oversold level (e.g., ≤ 35), indicating a deeply oversold market. Confirm that the MACD shows a decreasing trend (bearish momentum weakening) to validate a potential reversal. Ensure the current candle is green (close > open) if candle color confirmation is enabled.
Example Use : On a 1-hour chart, if the RSI drops below 35, MACD shows three consecutive bars of decreasing negative momentum, and a green candle forms, enter a buy position. This setup signals a robust entry with strong momentum backing it.
2. Weak Buy Entry Criteria :
Monitor for weak buy signals (blue label) when RSI is above the oversold level but still below the neutral (e.g., between 36 and 50). This indicates a market recovering from an oversold state but not fully reversing yet. These signals can be used for early entries with additional confirmations, such as support levels or higher timeframe trends.
Example Use : On the same 1-hour chart, if RSI is at 45, the MACD shows momentum stabilizing (not necessarily negative), and a green candle appears, consider a partial or cautious entry. Use this as an early warning for a potential bullish move, especially when higher timeframe indicators align.
3. Strong Sell Entry Criteria :
Look for a strong sell signal (red label) when RSI is at or above the overbought level (e.g., ≥ 65), signaling a strong overbought condition. The MACD should show three consecutive bars of increasing positive momentum to indicate that the bullish trend is weakening. Ensure the current candle is red (close < open) if candle color confirmation is enabled.
Example Use : If RSI reaches 70, MACD shows increasing momentum that starts to level off, and a red candle forms on a 1-hour chart, initiate a short position with a stop loss set above recent resistance. This is a high-confidence signal for potential price reversal or pullback.
4. Weak Sell Entry Criteria :
Use weak sell signals (orange label) when RSI is between the neutral and overbought levels (e.g., between 50 and 64). These can indicate potential short opportunities that might not yet be fully mature but are worth monitoring. Look for other confirmations like resistance levels or trendline touches to strengthen the signal.
Example Use : If RSI reads 60 on a 1-hour chart, and the MACD shows slight positive momentum with signs of slowing down, place a cautious sell position or scale out of existing long positions. This setup allows you to prepare for a possible downtrend.
Trade Management:
Stop Loss : For buy trades, place stop losses below recent swing lows. For sell trades, set stops above recent swing highs to manage risk effectively.
Take Profit : Target nearby resistance or support levels, apply risk-to-reward ratios (e.g., 1:2), or use trailing stops to lock in profits as price moves in your favor.
Confirmation : Align these signals with broader trends on higher timeframes. For example, if you receive a weak buy signal on a 15-minute chart, check the 1-hour or daily chart to ensure the overall trend is not bearish.
Real-World Example: Imagine trading on a 15-minute chart :
For a buy:
A strong buy signal (green) appears when the RSI dips to 32, MACD shows declining bearish momentum, and a green candle forms. Enter a buy position with a stop loss below the most recent support level.
Alternatively, a weak buy signal (blue) appears when RSI is at 47. Use this as a signal to start monitoring the market closely or enter a smaller position if other indicators (like support and volume analysis) align.
For a sell:
A strong sell signal (red) with RSI at 72 and a red candle signals to short with conviction. Place your stop loss just above the last peak.
A weak sell signal (orange) with RSI at 62 might prompt caution but can still be acted on if confirmed by declining volume or touching a resistance level.
These strategies show how to blend both strong and weak signals into your trading for more nuanced decision-making.
Technical Analysis of the Code
1. Stochastic RSI Calculation:
The script calculates the Stochastic RSI (stochRsiK) using the RSI as input and smooths it with a moving average (stochRsiD).
Code Explanation : ta.stoch(rsi, rsi, rsi, stochLength) computes the Stochastic RSI, and ta.sma(stochRsiK, stochSmoothing) applies smoothing.
2. RSI Calculation :
The RSI is computed over a user-defined period and checks for overbought or oversold conditions.
Code Explanation : rsi = ta.rsi(close, rsiLength) calculates RSI values.
3. MACD Trend Filter :
MACD is calculated with fast, slow, and signal lengths, identifying trends via three consecutive bars moving in the same direction.
Code Explanation : = ta.macd(close, macdLengthFast, macdLengthSlow, macdSignalLength) sets MACD values. Conditions like macdLine < macdLine confirm trends.
4. Buy and Sell Conditions :
The script checks Stochastic RSI, RSI, and MACD values to set buy/sell flags. Candle color filters further confirm valid entries.
Code Explanation : buyConditionMet and sellConditionMet logically check all conditions and toggles (enableStochCondition, enableRSICondition, etc.).
5. Signal Flags and Confirmation :
Flags track when conditions are met and ensure signals only appear on appropriate candle colors.
Code Explanation : Conditional blocks (if statements) update buyFlag and sellFlag.
6. Labels and Alerts :
The indicator plots "BUY" or "SELL" labels with the RSI value when signals trigger and sets alerts through alertcondition().
Code Explanation : label.new() displays the signal, color-coded for strength based on RSI.
NOTE : All strategies can be enabled or disabled in the settings, allowing traders to customize the indicator to their preferences and trading styles.

Harmony Signal Flow By ArunThis Pine Script strategy, titled "Harmony Signal Flow By Arun," uses the Relative Strength Index (RSI) indicator to generate buy and sell signals based on custom thresholds. The script incorporates stop-loss and target management and restricts new trades until the previous position closes. Here's a detailed description:
Custom RSI Metric:
The strategy calculates a 5-period RSI based on the closing price, aiming for a more responsive measure of price momentum.
RSI thresholds are defined:
Lower threshold (30): Indicates oversold conditions, triggering a potential buy.
Upper threshold (70): Indicates overbought conditions, prompting a possible sell.
Entry Conditions:
Buy Signal: The strategy initiates a buy order when the RSI crosses above the lower threshold (30), indicating a shift from oversold conditions.
Sell Signal: A sell order is triggered when the RSI crosses below the upper threshold (70), suggesting an overbought reversal.
Only one order (buy or sell) can be active at a time, ensuring that a new trade begins only when there’s no existing position.
Stop-Loss and Target Management:
For each trade, stop-loss and target conditions are applied to manage risk and secure profits.
For Buy Positions:
Stop-loss is set 100 points below the entry price.
Target is set 150 points above the entry price.
For Sell Positions:
Stop-loss is set 100 points above the entry price.
Target is 150 points below the entry price.
The strategy closes the trade when either the stop-loss or target is met, marking the trade as "closed" and allowing a new trade entry.
Trade Sequencing:
A new trade (buy or sell) is only permitted after the previous position hits either its stop-loss or target, preventing overlapping trades and ensuring clear trade sequences.
This sequential approach enhances risk management by ensuring only one active position at any time.
End-of-Day Closure:
All open positions are closed automatically at 3:25 PM (Indian market time) to avoid overnight exposure, ensuring the strategy remains strictly intraday.
The flag for trade entry is reset at the end of each day, enabling fresh trades the next day.
Chart Indicators:
The script plots buy and sell signals directly on the chart with visible labels.
It also displays the custom RSI metric with horizontal lines for the lower and upper thresholds, providing visual cues for entry and exit points.
Summary
This strategy is a momentum-based intraday trading approach that uses the RSI for identifying potential reversals and manages trades through predefined stop-loss and target levels. By enforcing trade sequencing and closing positions at the end of the trading day, it prioritizes risk management and seeks to capitalize on short-term trends while avoiding overnight market risks.

Price Action StrategyThe **Price Action Strategy** is a tool designed to capture potential market reversals by utilizing classic reversal candlestick patterns such as Hammer, Shooting Star, Doji, and Pin Bar near dinamic support and resistance levels.
***Note to moderators
- The moving average was removed from the strategy because it was not suitable for the strategy and not participating in the entry or exit criteria.
- The moving average length has been replaced/renamed by the support/resistance lenght.
- The bullish engulfing and bearish engulfing patterns were also removed because in practice they were not working as entry criteria, since the candle price invariably closes far from the support/resistance level even considering the sensitivity range. There was no change in the backtest results after removing these patterns.
### Key Elements of the Strategy
1. Support and Resistance Levels
- Support and resistance are pivotal price levels where the asset has previously struggled to move lower (support) or higher (resistance). These levels act as psychological barriers where buying interest (at support) or selling interest (at resistance) often increases, potentially causing price reversals.
- In this strategy, support is calculated as the lowest low and resistance as the highest high over a 16-period length. When the price nears these levels, it indicates possible zones for a reversal, and the strategy looks for specific candlestick patterns to confirm an entry.
2. Candlestick Patterns
- This strategy uses classic reversal patterns, including:
- **Hammer**: Indicates a buy signal, suggesting rejection of lower prices.
- **Shooting Star**: Suggests a sell signal, showing rejection of higher prices.
- **Doji**: Reflects indecision and potential reversal.
- **Pin Bar**: Represents price rejection with a long shadow, often signaling a reversal.
By combining these reversal patterns with the proximity to dinamic support or resistance levels, the strategy aims to capture potential reversal movements.
3. Sensitivity Level
- The sensitivity parameter adjusts the acceptable range (Default 0.018 = 1.8%) around support and resistance levels within which reversal patterns can trigger trades (i.e. the closing price of the candle must occur within the specified range defined by the sensitivity parameter). A higher sensitivity value expands this range, potentially leading to less accurate signals, as it may allow for more false positives.
4. Entry Criteria
- **Buy (Long)**: A Hammer, Doji, or Pin Bar pattern near support.
- **Sell (Short)**: A Shooting Star, Doji, or Pin Bar near resistance.
5. Exit criteria
- Take profit = 9.5%
- Stop loss = 16%
6. No Repainting
- The Price Action Strategy is not subject to repainting.
7. Position Sizing by Equity and risk management
- This strategy has a default configuration to operate with 35% of the equity. The stop loss is set to 16% from the entry price. This way, the strategy is putting at risk about 16% of 35% of equity, that is, around 5.6% of equity for each trade. The percentage of equity and stop loss can be adjusted by the user according to their risk management.
8. Backtest results
- This strategy was subjected to deep backtest and operations in replay mode on **1000000MOGUSDT.P**, with the inclusion of transaction fees at 0.12% and slipagge of 5 ticks, and the past results have shown consistent profitability. Past results are no guarantee of future results. The strategy's backtest results may even be due to overfitting with past data.
9. Chart Visualization
- Support and resistance levels are displayed as green (support) and red (resistance) lines.
- Only the candlestick pattern that generated the entry signal to triger the trade is identified and labeled on the chart. During the operation, the occurrence of new Doji, Pin Bar, Hammer and Shooting Star patterns will not be demonstrated on the chart, since the exit criteria are based on percentage take profit and stop loss.
Doji:
Pin Bar and Doji
Shooting Star and Doji
Hammer
10. Default settings
Chart timeframe: 20 min
Moving average lenght: 16
Sensitivity: 0.018
Stop loss (%): 16
Take Profit (%): 9.5
BYBIT:1000000MOGUSDT.P
