6-9 session & levels6-9 Session & Levels - Customizable Range Analysis Indicator
Description:
This indicator provides comprehensive session-based range analysis designed for intraday traders. It calculates and displays key levels based on a customizable session period (default 6:00-9:00 AM ET).
Core Features:
Session Tracking
Monitors user-defined session times with timezone support
Displays session open, high, and low levels
Highlights session range with optional box visualization
Shows previous day RTH (Regular Trading Hours: 9:30 AM - 4:00 PM) levels
Range Levels
25%, 50%, and 75% range levels within the session
Range deviations at 0.5x, 1.0x, and 2.0x multiples
Fibonacci extension levels (customizable, default 1.33x and 1.66x)
Optional fill zones between Fibonacci levels
Time Zone Highlighting
Marks the 9:40-9:50 AM period as a potential reversal zone
Vertical lines with shading to identify key time windows
Statistical Analysis
Calculates mean and median extension levels based on historical sessions
Displays statistics table showing current range, average range, range difference, and z-score
Customizable sample size (1-100 sessions) for statistical calculations
Option to anchor extensions from either session open or high/low points
Input Settings Explained:
Session Settings
Levels Session Time: Define your session window in HHMM-HHMM format (default: 0600-0900)
Time Zone: Choose from UTC, America/New_York, America/Chicago, America/Los_Angeles, Europe/London, or Asia/Tokyo
Anchor Settings
Show Session Anchor: Toggle the session anchor line (marks session open price at 6:00 AM)
Anchor Style/Color/Width: Customize appearance (Solid/Dashed/Dotted, color, 1-4 width)
Show Anchor Label: Display price label for the anchor
Session Open Line: Similar options for the session open reference line
Range Box Settings
Show Range Box: Display a shaded rectangle highlighting the session high-to-low range
Range Box Color: Set the box background color and transparency
Range Levels (25%/50%/75%)
Show Range Levels: Toggle all three intermediate levels on/off
Individual Level Styling: Each level (25%, 50%, 75%) has its own color, style, and width settings
Show Range Level Labels: Display price labels for each level
Range Deviations
Show Range Deviations: Toggle deviation levels on/off
0.5x/1.0x/2.0x Settings: Each deviation multiplier can be customized with its own color, line style (Solid/Dashed/Dotted), and width
Show Range Deviation Labels: Display labels showing the deviation price levels
Previous Day RTH Levels
Show Previous RTH Levels: Display yesterday's regular trading hours high and low
RTH High/Low Styling: Separate color, style, and width settings for each level
Show Previous RTH Labels: Toggle price labels for RTH levels
Time Zones
Show 9:40-9:50 AM Zone: Highlight this specific time period with vertical lines and shading
Zone Color: Set the background fill color for the time zone
Zone Label Color/Text: Customize the label appearance and text
Fibonacci Extension Settings
Show Fibonacci Extensions: Toggle Fib levels on/off
Fib Extension Color/Style/Width: Customize line appearance
Show Fib Extension Labels: Display price labels
Fib Ext Level 1/2: Set custom multipliers (default 1.33 and 1.66, range 0-5 in 0.1 increments)
Show Fibonacci Fills: Display shaded zones between Fib levels
Fib Fill Color: Customize the fill color and transparency
Session High/Low Settings
Show Session High/Low Lines: Display the actual session extremes
Style/Color/Width: Customize line appearance
Show Labels: Toggle price labels for high/low levels
Extension Stats Settings
Show Statistical Levels on Chart: Display mean and median extension levels based on historical data
Extension Anchor Point: Choose whether to anchor from "Open" or "High/Low" of the session
Number of Sessions for Statistics: Set sample size (1-100, default 60) for calculating averages
Mean/Median High Extension: Separate styling for each statistical level (color, style, width)
Mean/Median Low Extension: Separate styling for downside statistical levels
Tables
Show Statistics Table: Display a summary table with current range, average range, difference, z-score, and sample size
Table Position: Choose from 9 positions (Bottom/Middle/Top + Center/Left/Right)
Table Text Size: Select from Auto, Tiny, Small, Normal, Large, or Huge
Display Settings
Projection Offset: Number of bars to extend lines forward (default 24)
Label Size: Choose from Tiny, Small, Normal, or Large
Price Decimal Precision: Set decimal places for price labels (0-6)
How It Works:
The indicator tracks the specified session period and calculates the session's open, high, low, and range. At the end of the session (9:00 AM by default), it projects all configured levels forward for the trading day. The statistical features analyze the last N sessions (you choose the number) to calculate typical extension behavior from either the session open or the session high/low points.
The z-score calculation helps identify whether the current session's range is normal, expanded, or contracted compared to recent history, allowing traders to adjust expectations for the rest of the day.
Use Case:
This indicator helps traders identify key support and resistance levels based on early session price action, understand current range context relative to historical averages, and spot potential reversal zones during specific time periods.
Note: This indicator is for informational purposes only and does not constitute investment advice. Always perform your own analysis before making trading decisions.
Recherche dans les scripts pour "fib"

Hybrid Linear Regression Channel with Fibonacci LevelsHow to Use the LRC Fib Hybrid Indicator (Detailed Guide)
1. Read the Trend
2.The thick blue line is the linear regression midline.
If it’s sloping upward → uptrend (favor longs).
If sloping downward → downtrend (favor shorts).
The gray channel bounds are ±2 standard deviations (adjustable).
3. Understand Fibonacci Levels
Fib lines are projected parallel to the regression slope using the channel width as 100%:
Red dashed lines (0.0 to 0.786): Support zones in uptrends.
Blue dashed line (0.5): Midline/neutral.
Green dashed lines (1.0 to 2.618): Resistance zones in downtrends.
Strongest levels: 0.618 (support) and 1.618 (resistance).
4. Buy Signal (Long Entry)
Triggered when:
Midline is rising (uptrend confirmed).
Price crosses above a red Fib level (0.0–0.786).
Volume > 20-period average (if confirmation enabled).
Action:
Enter long on the green triangle (▲).
Stop Loss: Below the lower gray channel or recent swing low.
Take Profit: At 1.0, 1.272, or 1.618 green Fibs.
5. Sell Signal (Short Entry)
Triggered when:
Midline is falling (downtrend).
Price crosses below a green Fib level (1.272–2.618).
Volume > average.
Action:
Enter short on the red triangle (▼).
Stop Loss: Above the upper gray channel.
Take Profit: At 1.0, 0.786, or 0.618 red Fibs.
6. Use the Info Table (Bottom-Right)
Shows live prices of all Fib levels, current trend ("Up"/"Down"), and signal status ("BUY"/"SELL"/"None").
7. Customize via Settings (Gear Icon)
Regression Length: 50–200 (shorter = faster response).
Std Dev Multiplier: 1.5–3.0 (tighter/wider channel).
Toggle Fibs: Hide unused levels to declutter.
Volume Confirmation: Turn off for pure price action.
8. Set Alerts
Right-click chart → Add Alert → Select "Buy Signal" or "Sell Signal" → Enable popup/email/webhook.
9. Best Practices
Best in trending markets (avoid chop).
Wait for volume spike on bounce.
Combine with higher timeframe bias.
Use 0.618/1.618 as primary reversal zones.
This indicator gives you adaptive trend, precise entries, volume filter, and dynamic targets — all in one clean overlay.

MSFA_LibraryLibrary "MSFA_library"
TODO: add library description here
getDecimals()
Calculates how many decimals are on the quote price of the current market
Returns: The current decimal places on the market quote price
getPipSize(multiplier)
Calculates the pip size of the current market
Parameters:
multiplier (int) : The mintick point multiplier (1 by default, 10 for FX/Crypto/CFD but can be used to override when certain markets require)
Returns: The pip size for the current market
truncate(number, decimalPlaces)
Truncates (cuts) excess decimal places
Parameters:
number (float) : The number to truncate
decimalPlaces (simple float) : (default=2) The number of decimal places to truncate to
Returns: The given number truncated to the given decimalPlaces
toWhole(number)
Converts pips into whole numbers
Parameters:
number (float) : The pip number to convert into a whole number
Returns: The converted number
toPips(number)
Converts whole numbers back into pips
Parameters:
number (float) : The whole number to convert into pips
Returns: The converted number
getPctChange(value1, value2, lookback)
Gets the percentage change between 2 float values over a given lookback period
Parameters:
value1 (float) : The first value to reference
value2 (float) : The second value to reference
lookback (int) : The lookback period to analyze
Returns: The percent change over the two values and lookback period
random(minRange, maxRange)
Wichmann–Hill Pseudo-Random Number Generator
Parameters:
minRange (float) : The smallest possible number (default: 0)
maxRange (float) : The largest possible number (default: 1)
Returns: A random number between minRange and maxRange
bullFib(priceLow, priceHigh, fibRatio)
Calculates a bullish fibonacci value
Parameters:
priceLow (float) : The lowest price point
priceHigh (float) : The highest price point
fibRatio (float) : The fibonacci % ratio to calculate
Returns: The fibonacci value of the given ratio between the two price points
bearFib(priceLow, priceHigh, fibRatio)
Calculates a bearish fibonacci value
Parameters:
priceLow (float) : The lowest price point
priceHigh (float) : The highest price point
fibRatio (float) : The fibonacci % ratio to calculate
Returns: The fibonacci value of the given ratio between the two price points
getMA(length, maType)
Gets a Moving Average based on type (! MUST BE CALLED ON EVERY TICK TO BE ACCURATE, don't place in scopes)
Parameters:
length (simple int) : The MA period
maType (string) : The type of MA
Returns: A moving average with the given parameters
barsAboveMA(lookback, ma)
Counts how many candles are above the MA
Parameters:
lookback (int) : The lookback period to look back over
ma (float) : The moving average to check
Returns: The bar count of how many recent bars are above the MA
barsBelowMA(lookback, ma)
Counts how many candles are below the MA
Parameters:
lookback (int) : The lookback period to look back over
ma (float) : The moving average to reference
Returns: The bar count of how many recent bars are below the EMA
barsCrossedMA(lookback, ma)
Counts how many times the EMA was crossed recently (based on closing prices)
Parameters:
lookback (int) : The lookback period to look back over
ma (float) : The moving average to reference
Returns: The bar count of how many times price recently crossed the EMA (based on closing prices)
getPullbackBarCount(lookback, direction)
Counts how many green & red bars have printed recently (ie. pullback count)
Parameters:
lookback (int) : The lookback period to look back over
direction (int) : The color of the bar to count (1 = Green, -1 = Red)
Returns: The bar count of how many candles have retraced over the given lookback & direction
getBodySize()
Gets the current candle's body size (in POINTS, divide by 10 to get pips)
Returns: The current candle's body size in POINTS
getTopWickSize()
Gets the current candle's top wick size (in POINTS, divide by 10 to get pips)
Returns: The current candle's top wick size in POINTS
getBottomWickSize()
Gets the current candle's bottom wick size (in POINTS, divide by 10 to get pips)
Returns: The current candle's bottom wick size in POINTS
getBodyPercent()
Gets the current candle's body size as a percentage of its entire size including its wicks
Returns: The current candle's body size percentage
isHammer(fib, colorMatch)
Checks if the current bar is a hammer candle based on the given parameters
Parameters:
fib (float) : (default=0.382) The fib to base candle body on
colorMatch (bool) : (default=false) Does the candle need to be green? (true/false)
Returns: A boolean - true if the current bar matches the requirements of a hammer candle
isStar(fib, colorMatch)
Checks if the current bar is a shooting star candle based on the given parameters
Parameters:
fib (float) : (default=0.382) The fib to base candle body on
colorMatch (bool) : (default=false) Does the candle need to be red? (true/false)
Returns: A boolean - true if the current bar matches the requirements of a shooting star candle
isDoji(wickSize, bodySize)
Checks if the current bar is a doji candle based on the given parameters
Parameters:
wickSize (float) : (default=2) The maximum top wick size compared to the bottom (and vice versa)
bodySize (float) : (default=0.05) The maximum body size as a percentage compared to the entire candle size
Returns: A boolean - true if the current bar matches the requirements of a doji candle
isBullishEC(allowance, rejectionWickSize, engulfWick)
Checks if the current bar is a bullish engulfing candle
Parameters:
allowance (float) : (default=0) How many POINTS to allow the open to be off by (useful for markets with micro gaps)
rejectionWickSize (float) : (default=disabled) The maximum rejection wick size compared to the body as a percentage
engulfWick (bool) : (default=false) Does the engulfing candle require the wick to be engulfed as well?
Returns: A boolean - true if the current bar matches the requirements of a bullish engulfing candle
isBearishEC(allowance, rejectionWickSize, engulfWick)
Checks if the current bar is a bearish engulfing candle
Parameters:
allowance (float) : (default=0) How many POINTS to allow the open to be off by (useful for markets with micro gaps)
rejectionWickSize (float) : (default=disabled) The maximum rejection wick size compared to the body as a percentage
engulfWick (bool) : (default=false) Does the engulfing candle require the wick to be engulfed as well?
Returns: A boolean - true if the current bar matches the requirements of a bearish engulfing candle
isInsideBar()
Detects inside bars
Returns: Returns true if the current bar is an inside bar
isOutsideBar()
Detects outside bars
Returns: Returns true if the current bar is an outside bar
barInSession(sess, useFilter)
Determines if the current price bar falls inside the specified session
Parameters:
sess (simple string) : The session to check
useFilter (bool) : (default=true) Whether or not to actually use this filter
Returns: A boolean - true if the current bar falls within the given time session
barOutSession(sess, useFilter)
Determines if the current price bar falls outside the specified session
Parameters:
sess (simple string) : The session to check
useFilter (bool) : (default=true) Whether or not to actually use this filter
Returns: A boolean - true if the current bar falls outside the given time session
dateFilter(startTime, endTime)
Determines if this bar's time falls within date filter range
Parameters:
startTime (int) : The UNIX date timestamp to begin searching from
endTime (int) : the UNIX date timestamp to stop searching from
Returns: A boolean - true if the current bar falls within the given dates
dayFilter(monday, tuesday, wednesday, thursday, friday, saturday, sunday)
Checks if the current bar's day is in the list of given days to analyze
Parameters:
monday (bool) : Should the script analyze this day? (true/false)
tuesday (bool) : Should the script analyze this day? (true/false)
wednesday (bool) : Should the script analyze this day? (true/false)
thursday (bool) : Should the script analyze this day? (true/false)
friday (bool) : Should the script analyze this day? (true/false)
saturday (bool) : Should the script analyze this day? (true/false)
sunday (bool) : Should the script analyze this day? (true/false)
Returns: A boolean - true if the current bar's day is one of the given days
atrFilter(atrValue, maxSize)
Parameters:
atrValue (float)
maxSize (float)
tradeCount()
Calculate total trade count
Returns: Total closed trade count
isLong()
Check if we're currently in a long trade
Returns: True if our position size is positive
isShort()
Check if we're currently in a short trade
Returns: True if our position size is negative
isFlat()
Check if we're currentlyflat
Returns: True if our position size is zero
wonTrade()
Check if this bar falls after a winning trade
Returns: True if we just won a trade
lostTrade()
Check if this bar falls after a losing trade
Returns: True if we just lost a trade
maxDrawdownRealized()
Gets the max drawdown based on closed trades (ie. realized P&L). The strategy tester displays max drawdown as open P&L (unrealized).
Returns: The max drawdown based on closed trades (ie. realized P&L). The strategy tester displays max drawdown as open P&L (unrealized).
totalPipReturn()
Gets the total amount of pips won/lost (as a whole number)
Returns: Total amount of pips won/lost (as a whole number)
longWinCount()
Count how many winning long trades we've had
Returns: Long win count
shortWinCount()
Count how many winning short trades we've had
Returns: Short win count
longLossCount()
Count how many losing long trades we've had
Returns: Long loss count
shortLossCount()
Count how many losing short trades we've had
Returns: Short loss count
breakEvenCount(allowanceTicks)
Count how many break-even trades we've had
Parameters:
allowanceTicks (float) : Optional - how many ticks to allow between entry & exit price (default 0)
Returns: Break-even count
longCount()
Count how many long trades we've taken
Returns: Long trade count
shortCount()
Count how many short trades we've taken
Returns: Short trade count
longWinPercent()
Calculate win rate of long trades
Returns: Long win rate (0-100)
shortWinPercent()
Calculate win rate of short trades
Returns: Short win rate (0-100)
breakEvenPercent(allowanceTicks)
Calculate break even rate of all trades
Parameters:
allowanceTicks (float) : Optional - how many ticks to allow between entry & exit price (default 0)
Returns: Break-even win rate (0-100)
averageRR()
Calculate average risk:reward
Returns: Average winning trade divided by average losing trade
unitsToLots(units)
(Forex) Convert the given unit count to lots (multiples of 100,000)
Parameters:
units (float) : The units to convert into lots
Returns: Units converted to nearest lot size (as float)
skipTradeMonteCarlo(chance, debug)
Checks to see if trade should be skipped to emulate rudimentary Monte Carlo simulation
Parameters:
chance (float) : The chance to skip a trade (0-1 or 0-100, function will normalize to 0-1)
debug (bool) : Whether or not to display a label informing of the trade skip
Returns: True if the trade is skipped, false if it's not skipped (idea being to include this function in entry condition validation checks)
fillCell(tableID, column, row, title, value, bgcolor, txtcolor, tooltip)
This updates the given table's cell with the given values
Parameters:
tableID (table) : The table ID to update
column (int) : The column to update
row (int) : The row to update
title (string) : The title of this cell
value (string) : The value of this cell
bgcolor (color) : The background color of this cell
txtcolor (color) : The text color of this cell
tooltip (string)
Returns: Nothing.

FA_PA_LIBLibrary "FA_PA_LIB"
A collection of custom tools & utility functions commonly used for coding Dr Al Brooks, Price Action System with my scripts
getBodySize()
Gets the current candle's body size (in POINTS, divide by 10 to get pips)
Returns: The current candle's body size in POINTS
getTopWickSize()
Gets the current candle's top wick size (in POINTS, divide by 10 to get pips)
Returns: The current candle's top wick size in POINTS
getTopWickPercent()
Gets the current candle's top wick size (in POINTS, divide by 10 to get pips)
Returns: Percent of total candle width that is occupied by the upper wick
getBottomWickSize()
Gets the current candle's bottom wick size (in POINTS, divide by 10 to get pips)
Returns: The current candle's bottom wick size in POINTS
getBottomWickPercent()
Gets the current candle's bottom wick size (in POINTS, divide by 10 to get pips)
Returns: Percent of total candle width that is occupied by the lower wick
getBarMidPoint()
Gets the current candle's midpoint wick to wick
Returns: The current candle's mid point
getBodyPercent()
Gets the current candle's body size as a percentage of its entire size including its wicks
Returns: The current candle's body size percentage (00.00)
bullFib(priceLow, priceHigh, fibRatio)
Calculates a bullish fibonacci value
Parameters:
priceLow (float) : The lowest price point
priceHigh (float) : The highest price point
fibRatio (float) : The fibonacci % ratio to calculate
Returns: The fibonacci value of the given ratio between the two price points
bearFib(priceLow, priceHigh, fibRatio)
Calculates a bearish fibonacci value
Parameters:
priceLow (float) : The lowest price point
priceHigh (float) : The highest price point
fibRatio (float) : The fibonacci % ratio to calculate
Returns: The fibonacci value of the given ratio between the two price points
isBr()
Checks if the current bar is a Bear Bar
Returns: A boolean - true if the current bar is bear candle
isBl()
Checks if the current bar is a Bull Bar
Returns: A boolean - true if the current bar is Bull candle
isTrendBar()
Checks if the current bar is a Trend Bar. Candle that its body size is greater than 50% of entire candle size
Returns: A boolean - true if the current bar is Trend candle
isBlTrendBar()
Checks if the current bar is a Bull Trend Bar. Bullish candle that its body size is greater than 50% of entire candle size
Returns: A boolean - true if the current bar is Bull Trend candle
isBrTrendBar()
Checks if the current bar is a Bull Trend Bar. Bullish candle that its body size is greater than 50% of entire candle size
Returns: A boolean - true if the current bar is Bull Trend candle
isBlRevB()
Checks if the current bar is a Bull Reversal Bar. Bullish candle that closes on upper half of candle body
Returns: A boolean - true if the current bar is Bull Reversal candle
isBrRevB()
Checks if the current bar is a Bear Reversal Bar. BulBearish candle that closes on lower half of candle body
Returns: A boolean - true if the current bar is Bear Reversal candle
isDoji(wickSize, bodySize)
Checks if the current bar is a doji candle based on the given parameters
Parameters:
wickSize (float) : (default=2) The maximum top wick size compared to the bottom (and vice versa)
bodySize (float) : (default=0.05) The maximum body size as a percentage compared to the entire candle size
Returns: A boolean - true if the current bar matches the requirements of a doji candle
isHammer(fib, colorMatch)
Checks if the current bar is a hammer candle based on the given parameters
Parameters:
fib (float) : (default=0.382) The fib to base candle body on
colorMatch (bool) : (default=true) Does the candle need to be green? (true/false)
Returns: A boolean - true if the current bar matches the requirements of a hammer candle
isStar(fib, colorMatch)
Checks if the current bar is a shooting star candle based on the given parameters
Parameters:
fib (float) : (default=0.382) The fib to base candle body on
colorMatch (bool) : (default=false) Does the candle need to be red? (true/false)
Returns: A boolean - true if the current bar matches the requirements of a shooting star candle
isBlOB()
Detects Bullish outside bars(OB)
Returns: Returns true if the current bar is a bull outside bar
isBrOB()
Detects Bearish outside bars(OB)
Returns: Returns true if the current bar is a bear outside bar
Visible and Anchored OTE chart [SYNC & TRADE]Thanks for the start @twingall
Visible and Anchored OTE chart
Indicator for visualizing price levels and optimal trading zones (OTE - Optimal Trading Entry) using Fibonacci levels.
Main features
Visualization of price ranges using two OTE zones:
OTE 70% (79-62 Fibonacci levels)
OTE 30% (21-38 Fibonacci levels)
Setting up time periods:
Ability to use a custom date range
Option to work with a higher time frame
Flexible display settings:
Choose between using candle bodies or the full range for binding
Customizable appearance of OTE boxes
Customizable text labels
Additional levels:
Middle line (50.5%)
Optional levels of 29.5%, 70.5% and 88%
Customizable Fibonacci extensions
Indicator settings
Main parameters
Use Custom Dates - enable a custom date range
Start Date/End Date - set a time range
Use Higher Timeframe - use a higher time frame
Higher Timeframe - select a higher timeframe
Setting up OTE zones
Show Fib Box - displaying OTE zones
Enable Fib Box 79-62 - enabling OTE zone 70%
Enable Fib Box 21-38 - enabling OTE zone 30%
Show Text - displaying text labels in zones
Visual design
Text Size - text size (tiny/small/medium/large)
Text Color - text color
Text Alignment - text alignment
Line Thickness - line thickness (1-4)
Line Style - line style (Solid/Dashed/Dotted)
Fibonacci levels
High/Low Lines - displaying extreme levels
Midline - displaying the middle line (50.5%)
Show 29.5 Line - additional level 29.5%
Show 70.5 Line - additional level 70.5%
Show 88 Line - additional level 88%
Extensions Fibonacci
There are 6 customizable extension levels available:
Ext#1 (default 1.0)
Ext#2 (default 1.27)
Ext#3 (default 1.62)
Ext#4 (default 2.0)
Ext#5 (default 2.62)
Ext#6 (default 3.62)
For each level, you can configure:
On/Off
Color
Meaning
Alerts
The indicator provides the following types of alerts:
Entering/Exiting OTE Zones:
Entering 70% OTE Zone
Exiting 70% OTE Zone
Entering 30% OTE Zone
Exiting 30% OTE Zone
Crossing Additional Levels:
Crossing 29.5% Level
Crossing 70.5% Level
Crossing 88% Level
Reaching Extension Levels Fibonacci:
Alerts for each configured extension level
Support for both positive and negative extensions
Usage
Add the indicator to the chart
Configure the required display parameters
Set alerts if necessary
Use OTE zones to identify potential entry points into the market
Notes
The indicator automatically updates when the visible area of the chart changes
When using a custom date range, make sure the selected period contains data
For correct operation with a higher time frame, make sure that historical data is available
Visible and Anchored OTE chart
Индикатор для визуализации ценовых уровней и зон оптимальной торговли (OTE - Optimal Trading Entry) с использованием уровней Фибоначчи.
Основные возможности
Визуализация ценовых диапазонов с помощью двух OTE зон:
OTE 70% (79-62 уровни Фибоначчи)
OTE 30% (21-38 уровни Фибоначчи)
Настройка временных периодов:
Возможность использования пользовательского диапазона дат
Опция работы с высшим таймфреймом
Гибкая настройка отображения:
Выбор между использованием тел свечей или полного диапазона для привязки
Настраиваемый внешний вид боксов OTE
Настраиваемые текстовые метки
Дополнительные уровни:
Средняя линия (50.5%)
Опциональные уровни 29.5%, 70.5% и 88%
Настраиваемые расширения Фибоначчи
Настройка индикатора
Основные параметры
Use Custom Dates - включение пользовательского диапазона дат
Start Date/End Date - установка временного диапазона
Use Higher Timeframe - использование высшего таймфрейма
Higher Timeframe - выбор высшего таймфрейма
Настройка OTE зон
Show Fib Box - отображение зон OTE
Enable Fib Box 79-62 - включение зоны OTE 70%
Enable Fib Box 21-38 - включение зоны OTE 30%
Show Text - отображение текстовых меток в зонах
Визуальное оформление
Text Size - размер текста (tiny/small/medium/large)
Text Color - цвет текста
Text Alignment - выравнивание текста
Line Thickness - толщина линий (1-4)
Line Style - стиль линий (Solid/Dashed/Dotted)
Уровни Фибоначчи
High/Low Lines - отображение крайних уровней
Midline - отображение средней линии (50.5%)
Show 29.5 Line - дополнительный уровень 29.5%
Show 70.5 Line - дополнительный уровень 70.5%
Show 88 Line - дополнительный уровень 88%
Расширения Фибоначчи
Доступно 6 настраиваемых уровней расширения:
Ext#1 (по умолчанию 1.0)
Ext#2 (по умолчанию 1.27)
Ext#3 (по умолчанию 1.62)
Ext#4 (по умолчанию 2.0)
Ext#5 (по умолчанию 2.62)
Ext#6 (по умолчанию 3.62)
Для каждого уровня можно настроить:
Включение/выключение
Цвет
Значение
Оповещения
Индикатор предоставляет следующие типы оповещений:
Вход/выход из зон OTE:
Вход в зону OTE 70%
Выход из зоны OTE 70%
Вход в зону OTE 30%
Выход из зоны OTE 30%
Пересечение дополнительных уровней:
Пересечение уровня 29.5%
Пересечение уровня 70.5%
Пересечение уровня 88%
Достижение уровней расширения Фибоначчи:
Оповещения для каждого настроенного уровня расширения
Поддержка как положительных, так и отрицательных расширений
Использование
Добавьте индикатор на график
Настройте необходимые параметры отображения
При необходимости установите оповещения
Используйте зоны OTE для определения потенциальных точек входа в рынок
Примечания
Индикатор автоматически обновляется при изменении видимой области графика
При использовании пользовательского диапазона дат убедитесь, что выбранный период содержит данные
Для корректной работы с высшим таймфреймом убедитесь в доступности исторических данных
JordanSwindenLibraryLibrary "JordanSwindenLibrary"
TODO: add library description here
getDecimals()
Calculates how many decimals are on the quote price of the current market
Returns: The current decimal places on the market quote price
getPipSize(multiplier)
Calculates the pip size of the current market
Parameters:
multiplier (int) : The mintick point multiplier (1 by default, 10 for FX/Crypto/CFD but can be used to override when certain markets require)
Returns: The pip size for the current market
truncate(number, decimalPlaces)
Truncates (cuts) excess decimal places
Parameters:
number (float) : The number to truncate
decimalPlaces (simple float) : (default=2) The number of decimal places to truncate to
Returns: The given number truncated to the given decimalPlaces
toWhole(number)
Converts pips into whole numbers
Parameters:
number (float) : The pip number to convert into a whole number
Returns: The converted number
toPips(number)
Converts whole numbers back into pips
Parameters:
number (float) : The whole number to convert into pips
Returns: The converted number
getPctChange(value1, value2, lookback)
Gets the percentage change between 2 float values over a given lookback period
Parameters:
value1 (float) : The first value to reference
value2 (float) : The second value to reference
lookback (int) : The lookback period to analyze
Returns: The percent change over the two values and lookback period
random(minRange, maxRange)
Wichmann–Hill Pseudo-Random Number Generator
Parameters:
minRange (float) : The smallest possible number (default: 0)
maxRange (float) : The largest possible number (default: 1)
Returns: A random number between minRange and maxRange
bullFib(priceLow, priceHigh, fibRatio)
Calculates a bullish fibonacci value
Parameters:
priceLow (float) : The lowest price point
priceHigh (float) : The highest price point
fibRatio (float) : The fibonacci % ratio to calculate
Returns: The fibonacci value of the given ratio between the two price points
bearFib(priceLow, priceHigh, fibRatio)
Calculates a bearish fibonacci value
Parameters:
priceLow (float) : The lowest price point
priceHigh (float) : The highest price point
fibRatio (float) : The fibonacci % ratio to calculate
Returns: The fibonacci value of the given ratio between the two price points
getMA(length, maType)
Gets a Moving Average based on type (! MUST BE CALLED ON EVERY TICK TO BE ACCURATE, don't place in scopes)
Parameters:
length (simple int) : The MA period
maType (string) : The type of MA
Returns: A moving average with the given parameters
barsAboveMA(lookback, ma)
Counts how many candles are above the MA
Parameters:
lookback (int) : The lookback period to look back over
ma (float) : The moving average to check
Returns: The bar count of how many recent bars are above the MA
barsBelowMA(lookback, ma)
Counts how many candles are below the MA
Parameters:
lookback (int) : The lookback period to look back over
ma (float) : The moving average to reference
Returns: The bar count of how many recent bars are below the EMA
barsCrossedMA(lookback, ma)
Counts how many times the EMA was crossed recently (based on closing prices)
Parameters:
lookback (int) : The lookback period to look back over
ma (float) : The moving average to reference
Returns: The bar count of how many times price recently crossed the EMA (based on closing prices)
getPullbackBarCount(lookback, direction)
Counts how many green & red bars have printed recently (ie. pullback count)
Parameters:
lookback (int) : The lookback period to look back over
direction (int) : The color of the bar to count (1 = Green, -1 = Red)
Returns: The bar count of how many candles have retraced over the given lookback & direction
getBodySize()
Gets the current candle's body size (in POINTS, divide by 10 to get pips)
Returns: The current candle's body size in POINTS
getTopWickSize()
Gets the current candle's top wick size (in POINTS, divide by 10 to get pips)
Returns: The current candle's top wick size in POINTS
getBottomWickSize()
Gets the current candle's bottom wick size (in POINTS, divide by 10 to get pips)
Returns: The current candle's bottom wick size in POINTS
getBodyPercent()
Gets the current candle's body size as a percentage of its entire size including its wicks
Returns: The current candle's body size percentage
isHammer(fib, colorMatch)
Checks if the current bar is a hammer candle based on the given parameters
Parameters:
fib (float) : (default=0.382) The fib to base candle body on
colorMatch (bool) : (default=false) Does the candle need to be green? (true/false)
Returns: A boolean - true if the current bar matches the requirements of a hammer candle
isStar(fib, colorMatch)
Checks if the current bar is a shooting star candle based on the given parameters
Parameters:
fib (float) : (default=0.382) The fib to base candle body on
colorMatch (bool) : (default=false) Does the candle need to be red? (true/false)
Returns: A boolean - true if the current bar matches the requirements of a shooting star candle
isDoji(wickSize, bodySize)
Checks if the current bar is a doji candle based on the given parameters
Parameters:
wickSize (float) : (default=2) The maximum top wick size compared to the bottom (and vice versa)
bodySize (float) : (default=0.05) The maximum body size as a percentage compared to the entire candle size
Returns: A boolean - true if the current bar matches the requirements of a doji candle
isBullishEC(allowance, rejectionWickSize, engulfWick)
Checks if the current bar is a bullish engulfing candle
Parameters:
allowance (float) : (default=0) How many POINTS to allow the open to be off by (useful for markets with micro gaps)
rejectionWickSize (float) : (default=disabled) The maximum rejection wick size compared to the body as a percentage
engulfWick (bool) : (default=false) Does the engulfing candle require the wick to be engulfed as well?
Returns: A boolean - true if the current bar matches the requirements of a bullish engulfing candle
isBearishEC(allowance, rejectionWickSize, engulfWick)
Checks if the current bar is a bearish engulfing candle
Parameters:
allowance (float) : (default=0) How many POINTS to allow the open to be off by (useful for markets with micro gaps)
rejectionWickSize (float) : (default=disabled) The maximum rejection wick size compared to the body as a percentage
engulfWick (bool) : (default=false) Does the engulfing candle require the wick to be engulfed as well?
Returns: A boolean - true if the current bar matches the requirements of a bearish engulfing candle
isInsideBar()
Detects inside bars
Returns: Returns true if the current bar is an inside bar
isOutsideBar()
Detects outside bars
Returns: Returns true if the current bar is an outside bar
barInSession(sess, useFilter)
Determines if the current price bar falls inside the specified session
Parameters:
sess (simple string) : The session to check
useFilter (bool) : (default=true) Whether or not to actually use this filter
Returns: A boolean - true if the current bar falls within the given time session
barOutSession(sess, useFilter)
Determines if the current price bar falls outside the specified session
Parameters:
sess (simple string) : The session to check
useFilter (bool) : (default=true) Whether or not to actually use this filter
Returns: A boolean - true if the current bar falls outside the given time session
dateFilter(startTime, endTime)
Determines if this bar's time falls within date filter range
Parameters:
startTime (int) : The UNIX date timestamp to begin searching from
endTime (int) : the UNIX date timestamp to stop searching from
Returns: A boolean - true if the current bar falls within the given dates
dayFilter(monday, tuesday, wednesday, thursday, friday, saturday, sunday)
Checks if the current bar's day is in the list of given days to analyze
Parameters:
monday (bool) : Should the script analyze this day? (true/false)
tuesday (bool) : Should the script analyze this day? (true/false)
wednesday (bool) : Should the script analyze this day? (true/false)
thursday (bool) : Should the script analyze this day? (true/false)
friday (bool) : Should the script analyze this day? (true/false)
saturday (bool) : Should the script analyze this day? (true/false)
sunday (bool) : Should the script analyze this day? (true/false)
Returns: A boolean - true if the current bar's day is one of the given days
atrFilter(atrValue, maxSize)
Parameters:
atrValue (float)
maxSize (float)
tradeCount()
Calculate total trade count
Returns: Total closed trade count
isLong()
Check if we're currently in a long trade
Returns: True if our position size is positive
isShort()
Check if we're currently in a short trade
Returns: True if our position size is negative
isFlat()
Check if we're currentlyflat
Returns: True if our position size is zero
wonTrade()
Check if this bar falls after a winning trade
Returns: True if we just won a trade
lostTrade()
Check if this bar falls after a losing trade
Returns: True if we just lost a trade
maxDrawdownRealized()
Gets the max drawdown based on closed trades (ie. realized P&L). The strategy tester displays max drawdown as open P&L (unrealized).
Returns: The max drawdown based on closed trades (ie. realized P&L). The strategy tester displays max drawdown as open P&L (unrealized).
totalPipReturn()
Gets the total amount of pips won/lost (as a whole number)
Returns: Total amount of pips won/lost (as a whole number)
longWinCount()
Count how many winning long trades we've had
Returns: Long win count
shortWinCount()
Count how many winning short trades we've had
Returns: Short win count
longLossCount()
Count how many losing long trades we've had
Returns: Long loss count
shortLossCount()
Count how many losing short trades we've had
Returns: Short loss count
breakEvenCount(allowanceTicks)
Count how many break-even trades we've had
Parameters:
allowanceTicks (float) : Optional - how many ticks to allow between entry & exit price (default 0)
Returns: Break-even count
longCount()
Count how many long trades we've taken
Returns: Long trade count
shortCount()
Count how many short trades we've taken
Returns: Short trade count
longWinPercent()
Calculate win rate of long trades
Returns: Long win rate (0-100)
shortWinPercent()
Calculate win rate of short trades
Returns: Short win rate (0-100)
breakEvenPercent(allowanceTicks)
Calculate break even rate of all trades
Parameters:
allowanceTicks (float) : Optional - how many ticks to allow between entry & exit price (default 0)
Returns: Break-even win rate (0-100)
averageRR()
Calculate average risk:reward
Returns: Average winning trade divided by average losing trade
unitsToLots(units)
(Forex) Convert the given unit count to lots (multiples of 100,000)
Parameters:
units (float) : The units to convert into lots
Returns: Units converted to nearest lot size (as float)
getFxPositionSize(balance, risk, stopLossPips, fxRate, lots)
(Forex) Calculate fixed-fractional position size based on given parameters
Parameters:
balance (float) : The account balance
risk (float) : The % risk (whole number)
stopLossPips (float) : Pip distance to base risk on
fxRate (float) : The conversion currency rate (more info below in library documentation)
lots (bool) : Whether or not to return the position size in lots rather than units (true by default)
Returns: Units/lots to enter into "qty=" parameter of strategy entry function
EXAMPLE USAGE:
string conversionCurrencyPair = (strategy.account_currency == syminfo.currency ? syminfo.tickerid : strategy.account_currency + syminfo.currency)
float fx_rate = request.security(conversionCurrencyPair, timeframe.period, close )
if (longCondition)
strategy.entry("Long", strategy.long, qty=zen.getFxPositionSize(strategy.equity, 1, stopLossPipsWholeNumber, fx_rate, true))
skipTradeMonteCarlo(chance, debug)
Checks to see if trade should be skipped to emulate rudimentary Monte Carlo simulation
Parameters:
chance (float) : The chance to skip a trade (0-1 or 0-100, function will normalize to 0-1)
debug (bool) : Whether or not to display a label informing of the trade skip
Returns: True if the trade is skipped, false if it's not skipped (idea being to include this function in entry condition validation checks)
fillCell(tableID, column, row, title, value, bgcolor, txtcolor, tooltip)
This updates the given table's cell with the given values
Parameters:
tableID (table) : The table ID to update
column (int) : The column to update
row (int) : The row to update
title (string) : The title of this cell
value (string) : The value of this cell
bgcolor (color) : The background color of this cell
txtcolor (color) : The text color of this cell
tooltip (string)
Returns: Nothing.

Opening Range Gap + Std Dev [starclique]The ICT Opening Range Gap is a concept taught by Inner Circle Trader and is discussed in the videos: 'One Trading Setup For Life' and 2023 ICT Mentorship - Opening Range Gap Repricing Macro
ORGs, or Opening Range Gaps, are gaps that form only on the Regular Trading Hours chart.
The Regular Trading Hours gap occurs between 16:15 PM - 9:29 AM EST (UTC-4)
These times are considered overnight trading, so it is useful to filter the PA (price action) formed there.
The RTH option is only available for futures contracts and continuous futures from CME Group.
To change your chart to RTH, first things first, make sure you’re looking at a futures contract for an asset class, then on the bottom right of your chart, you’ll see ETH (by default) - Click on that, and change it to RTH.
Now your charts are filtering the price action that happened overnight.
To draw out your gap, use the Close of the 4:14 PM candle and the open of the 9:30 AM candle.
How is this concept useful?
Well, It can be used in many ways.
---
How To Use The ORG
One of the ways you can use the opening range gap is simply as support and resistance
If we extend out the ORG from the example above, we can see that there is a clean retest of the opening range gap high after breaking structure to the upside and showing acceptance outside of the gap after consolidating within it.
The ORG High (4:14 Candle Close in this case) was used as support.
We then see an expansion to the upside.
Another way to implement the ORG is by using it as a draw on liquidity (magnet for price)
In this example, if we looked to the left, there was a huge ORG to the downside, leaving a massive gap.
The market will want to rebalance that gap during the regular trading hours.
The market rallies higher, rejects, comes down to clear the current days ORG low, then closes.
That is one example of how you can combine liquidity & ICT market structure concepts with Opening Range Gaps to create a story in the charts.
Now let’s discuss standard deviations.
---
Standard Deviations
Standard Deviations are essentially projection levels for ranges / POIs (Point of Interests)
By this I mean, if you have a range, and you would like to see where it could potentially expand to, you’d place your fibonacci retracement tool on and high and low of the range, then use extension levels to find specific price points where price might reject from.
Since 0 and 1 are your Range High and Low respectively, your projection levels would be something like 1.5, 2, 2.5, and 3, for the extension from your 1 Fib Level, and -0.5, -1, -1.5, and -2 for your 0 Fib level.
The -1 and 2 level produce a 1:1 projection of your range low and high, meaning, if you expect price to expand as much as it did from the range low to range high, then you can project a -1 and 2 on your Fib, and it would show you what ICT calls “symmetrical price”
Now, how are standard deviations relevant here?
Well, if you’ve been paying attention to ICT’s recent videos, you would’ve caught that he’s recently started using Standard Deviation levels on breakers.
So my brain got going while watching his video on ORGs, and I decided to place the fib on the ORG high and low and see what it’d produce.
The results were very interesting.
Using this same example, if we place our fib on the ORG High and Low, and add some projection levels, we can see that we rejected right at the -2 Standard Deviation Level.
---
You can see that I also marked out the EQ (Equilibrium, 50%, 0.5 of Fib) of the ORG. This is because we can use this level as a take profit level if we’re using an old ORG as our draw.
In days like these, where the gap formed was within a consolidation, and it continued to consolidate within the ORG zone that we extended, we can use the EQ in the same way we’d use an EQ for a range.
If it’s showing acceptance above the EQ, we are bullish, and expect the high of the ORG to be tapped, and vice versa.
---
Using The Indicator
Here’s where our indicator comes in play.
To avoid having to do all this work of zooming in and marking out the close and open of the respective ORG candles, we created the Opening Range Gap + Standard Deviations Indicator, with the help of our dedicated Star Clique coder, a1tmaniac.
With the ORG + STD DEV indicator, you will be able to view ORG’s and their projections on the ETH (Electronic Trading Hours) chart.
---
Features
Range Box
- Change the color of your Opening Range Gap to your liking
- Enable or disable the box from appearing using the checkbox
Range Midline
- Change the color of your Opening Range Gap Equilibrium
- Enable or disable the midline from appearing using the checkbox
Std. Dev
- Add whichever standard deviation levels you’d like.
- By default, the indicator comes with 0.5, 1, 1.5, and 2 standard deviation levels.
- Ensure that you add a comma ( , ) in between each standard deviation level
- Enable or disable the standard deviations from appearing using the opacity of the color (change to 0%)
Labels / Offset
- Adjust the offset of the label for the Standard Deviations
- Enable or disable the Labels from appearing using the checkbox
Time
- Adjust the time used for the indicators range
- If you’d like to use this for a Session or ICT Killzone instead, adjust the time
- Adjust the timezone used for the time referenced
- Options are UTC, US (UTC-4, New York Local Time) or UK (UTC+1, London Time)
- By default, the indicator is set to US

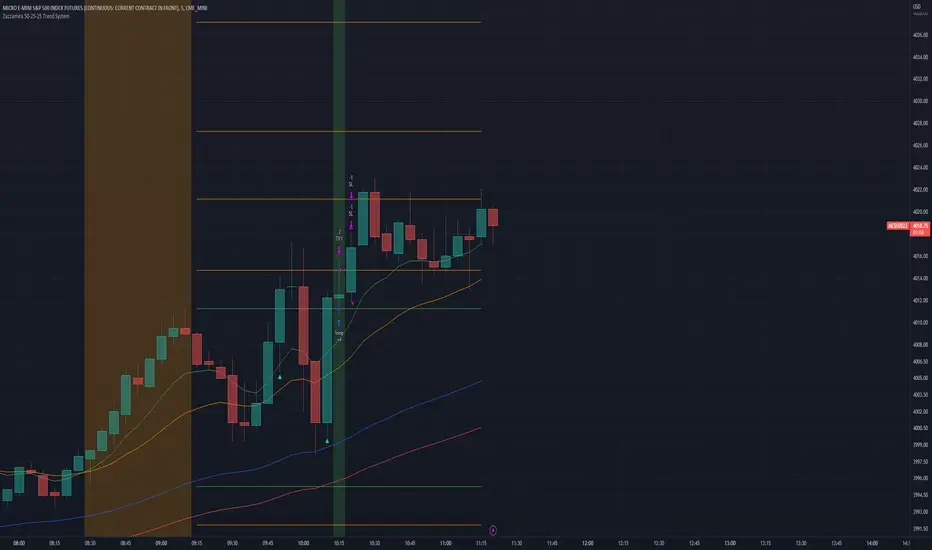
Zazzamira 50-25-25 Trend System Alerts OnlyPublishing my trading system script. It consist of several conditions to happen in order to open a trade. Work best on ES/MES 5 minute timeframe.
I like to use it with this settings:
- UTC -6 (don't tick Exchange Timezone)
and rest as default
To enter a trade, the following conditions must be met: Entry 1: the opening range (8:30AM - 9:15AM UTC-6) must be defined and the price must close above or below the opening range on the 5-minute timeframe. This entry condition defines the trade direction (above = long / below = short). Once the opening range is defined, the Trend-Based Fib Extension is applied from the range high to the range low (and vice versa). Fib levels are required for Exit conditions. Entry 2: the 8 - 27 - 67 - 97 EMAs must be defined. If the EMAs value order is 8 > 27 > 67 > 97, long-only trades are allowed. If the EMAs value order is 8 < 27 < 67 < 97, short-only trades are allowed. This entry condition filters fake breakouts of Entry 1. Entry 3: no trades are allowed after 12:59 UTC-6 (2PM EST). Entry 4: if Entry 1, Entry 2, and Entry 3 conditions are valid and the price hasn't reached the 23.6% Fib line, an entry order can be set at the range high/long with 4 contracts. To exit a trade, the following conditions must be met: Exit 1 (Stop loss): set a trailing stop based on 2.1x ATR (14) from entry. Exit 2: take 50% profits at the 23.6% Fib and leave trailing stop untouched. Exit 3: if Exit 2 triggers, take 50% (25% of total entry) off at 61.8% Fib, leaving Exit 2 trailing stop values valid. Exit 4: exit the full position at the FIB 100% value. Exit 5: all trades must be closed at 3pm UTC-6 (4PM EST). So basically Take Profit are 50%-25%-25% of position.
Code has been written by © Hiubris_Indicators who has been an amazing coder and gave me the possibility to make this script public so a really big shoutout to him.
This indicator only works for alerts, please check version without alerts to backtest or tweaks. This indicator is meant to be used to automate the system via webhooks

Zazzamira 50-25-25 Trend SystemPublishing my trading system script. It consist of several conditions to happen in order to open a trade. Work best on ES/MES 5 minute timeframe.
I like to use it with this settings:
- UTC -6 (don't tick Exchange Timezone)
and rest as default
To enter a trade, the following conditions must be met: Entry 1: the opening range (8:30AM - 9:15AM UTC-6) must be defined and the price must close above or below the opening range on the 5-minute timeframe. This entry condition defines the trade direction (above = long / below = short). Once the opening range is defined, the Trend-Based Fib Extension is applied from the range high to the range low (and vice versa). Fib levels are required for Exit conditions. Entry 2: the 8 - 27 - 67 - 97 EMAs must be defined. If the EMAs value order is 8 > 27 > 67 > 97, long-only trades are allowed. If the EMAs value order is 8 < 27 < 67 < 97, short-only trades are allowed. This entry condition filters fake breakouts of Entry 1. Entry 3: no trades are allowed after 12:59 UTC-6 (2PM EST). Entry 4: if Entry 1, Entry 2, and Entry 3 conditions are valid and the price hasn't reached the 23.6% Fib line, an entry order can be set at the range high/long with 4 contracts. To exit a trade, the following conditions must be met: Exit 1 (Stop loss): set a trailing stop based on 2.1x ATR (14) from entry. Exit 2: take 50% profits at the 23.6% Fib and leave trailing stop untouched. Exit 3: if Exit 2 triggers, take 50% (25% of total entry) off at 61.8% Fib, leaving Exit 2 trailing stop values valid. Exit 4: exit the full position at the FIB 100% value. Exit 5: all trades must be closed at 3pm UTC-6 (4PM EST). So basically Take Profit are 50%-25%-25% of position.
Code has been written by © Hiubris_Indicators who has been an amazing coder and gave me the possibility to make this script public so a really big shoutout to him.
Fibonacci Bollinger Band ClusterThis indicator creates moving averages based on Fibonacci numbers (3-233, divided by 10 to average) sourced by high, low, and ohlc4 and plots lines based on these three. The Fib MA High line is either green or red (Fib High < Close), the Fib MA Low line is either lime or orange (Fib Low < Close), and the Fib MA OHLC4 line is constantly white. A cluster or series of Bollinger Bands is then created using the Fib MA OHLC4 line as the basis. Fibonacci-based deviations (1, 2, 3, 5, 8) are then used to create three upper and three lower Bollinger lines.
AbdulLibraryLibrary "AbdulLibrary"
The library consists of three sections:
Technical Analysis Functions - A collection of tools commonly used by day traders
Trading Setup Filters Functions - A number of filters that help day traders to screen trading signals
Candlestick Pattern Detection Functions - To detect different candlestick patterns that are used in day trading setups
Note that this would have been possible without the help of @ZenAndTheArtOfTrading as I build-up this library after completing his pine script mastery course so big thanks to him
The content of the library are:-
fibLevels(preDayClose, preDayHigh, preDayLow) Calculates Daily Pivot Point and Fibonacci Key Levels
Parameters:
preDayClose : The previous day candle close
preDayHigh : The previous day candle high
preDayLow : The previous day candle low
Returns: Returns Daily Pivot Point and Fibonacci Key Levels as a tuple
bullishFib(canHigh, canLow, fibLevel) Calculates Fibonacci Levels in Bullish move
Parameters:
canHigh : The high of the move
canLow : The low of the move
fibLevel : The Fib level as % you want to calculate
Returns: Returns The Fib level for the Bullish move
bearishFib(canHigh, canLow, fibLevel) Calculates Fibonacci Levels in Bearish move
Parameters:
canHigh : The high of the move
canLow : The low of the move
fibLevel : The Fib level as % you want to calculate
Returns: Returns The Fib level for the Bearish move
getCandleSize() Calculates the size of candle (high - low) in points
Returns: Returns candle size in points
getCandleBodySize() Calculates the size of candle (close - open) in points
Returns: Returns candle body size in points
getHighWickSize() Calculates the high wick size of candle in points
Returns: Returns The high wick size of candle in points
getLowWickSize() Calculates the low wick size of candle in points
Returns: Returns The low wick size of candle in points
getBodyPercentage() Calculates the candle body size as % of overall candle size
Returns: Returns The candle body size as % of overall candle size
isSwingHigh(period) Checks if the price has created new swing high over a period of time
Parameters:
period : The lookback time we want to check for swing high
Returns: Returns True if the current candle or the previous candle is a swing high
isSwingLow(period) Checks if the price has created new swing low over a period of time
Parameters:
period : The lookback time we want to check for swing low
Returns: Returns True if the current candle or the previous candle is a swing low
isDojiSwingHigh(period) Checks if a doji is a swing high over a period of time
Parameters:
period : The lookback time we want to check for swing high
Returns: Returns True if the doji is a swing high
isDojiSwingLow(period) Checks if a doji is a swing low over a period of time
Parameters:
period : The lookback time we want to check for swing low
Returns: Returns True if the doji is a swing low
isBigBody(atrFilter, atr, candleBodySize, multiplier) Checks if a candle has big body compared to ATR
Parameters:
atrFilter : Check if user wants to use ATR to filter candle-setup signals
atr : The ATR value to be used to compare candle body size
candleBodySize : The candle body size
multiplier : The multiplier to be used to compare candle body size
Returns: Returns Boolean true if the candle setup is big
isSmallBody(atrFilter, atr, candleBodySize, multiplier) Checks if a candle has small body compared to ATR
Parameters:
atrFilter : Check if user wants to use ATR to filter candle-setup signals
atr : The ATR value to be used to compare candle body size
candleBodySize : The candle body size
multiplier : The multiplier to be used to compare candle body size
Returns: Returns Boolean true if the candle setup is small
isHammer(fibLevel, colorMatch) Checks if a candle is a hammer based on user input parameters and candle conditions
Parameters:
fibLevel : Fib level to base candle body on
colorMatch : Checks if user needs for the candel to be green
Returns: Returns Boolean - True if the candle setup is hammer
isShootingStar(fibLevel, colorMatch) Checks if a candle is a shooting star based on user input parameters and candle conditions
Parameters:
fibLevel : Fib level to base candle body on
colorMatch : Checks if user needs for the candel to be red
Returns: Returns Boolean - True if the candle setup is star
isBullEngCan(allowance, period) Check if a candle is a bullish engulfing candle
Parameters:
allowance : How many points the candle open is allowed to be off (To allow for gaps)
period : The lookback period for swing low check
Returns: Boolean - True only if the candle is a bullish engulfing candle
isBearEngCan(allowance, period) Check if a candle is a bearish engulfing candle
Parameters:
allowance : How many points the candle open is allowed to be off (To allow for gaps)
period : The lookback period for swing high check
Returns: Boolean - True only if the candle is a bearish engulfing candle
isBullDoji(maxSize, wickLimit, colorFilter) Check if a candle is a bullish doji candle
Parameters:
maxSize : Maximum candle body size as % of total candle size to be considered as doji
wickLimit : Maximum wick size of one wick compared to the other wick
colorFilter : Checks if the doji is green
Returns: Boolean - True if the candle is a bullish doji
isBearDoji(maxSize, wickLimit, colorFilter) Check if a candle is a bearish doji candle
Parameters:
maxSize : Maximum candle body size as % of total candle size to be considered as doji
wickLimit : Maximum wick size of one wick compared to the other wick
colorFilter : Checks if the doji is red
Returns: Boolean - True if the candle is a bearish doji
isBullOutBar() Check if a candle is a bullish outside bar
Returns: Boolean - True if the candle is a bullish outside bar
isInsideBar() Check if a candle is an inside bar
Returns: Returns Boolean - True if a candle is an inside bar

[MF] Auto Fibonacci LevelsDescription:
Automatically draw Fibonacci Pivot levels based on the previous (day's, week's or month's)
Range ( High-Low ). The HLC3 is used as the default Pivot level.
Unlike the "Auto Fibonacci Levels", this variation does not update
Levels on current day even if the price goes past the R3/S3 levels.
Timeframes: 1D, 1W, 1M
Range = (High - Low) - From previous Day, Week or month.
FIB LEVELS:
- Yellow = Pivot and Pivot Zone (HLC3 by default)
- red = R1,S1 Levels 0.236 * Range
- Green = R2,S2 Levels 0.368 * Range
- Lime = R3,S3 Levels 0.618 * Range
- Blue = R4,S4 Levels 0.786 * Range
- Gray = R5,S5 Levels 1.000 * Range
- Lime = R6,S6 Levels 1.236 * Range
- Red = R7,S7 Levels 1.382 * Range
- Blue = R8,S8 Levels 1.618 * Range
- Green = R9,S9 Levels 2.000 * Range
CLASSIC LEVELS:
- Yellow = Pivot and Pivot Zone (HLC3)
- Green = R1,S1 Levels (Pivot*2 - Low), (Pivot*2 - High)
- Lime = R2,S2 Levels ( Pivot + Range), ( Pivot - Range)
- Lime = R3,S3 Levels (High + 2*( Pivot - Low)), (Low - 2*(High - Pivot ))
- Blue = R4,S4 Levels (High + 3*( Pivot - Low)), (Low - 3*(High - Pivot ))
Refrences:
- Auto Daily Fib Levels R3.0 by JustUncleL
- Auto Fib by TheYangGuizi
- Monthly Dynamic Range Levels (Fibonaci) V0 by RicardoSantos
Modifications:
- Added next FIB Levels. (changes during the current cycle)
- Added FIB 0.236 Levels
- Added Option to change the colors of the Fib Levels
- Changed Default colors to the colors of Tradingview
- Upgraded to Version4 Pinescript

Fibonacci LevelsThe 420 VWMA (Volume Weighted Moving Average) per period selected of the low price (Fib 0) and the high price (Fib 1). They are labeled in Color of the line they represent.
The other Fib lines are calculated using common fib ratios as follows:
longRange_fib2618 = highestHighperLongRange +
(highestHighperLongRange - lowestLowperLongRange) * 1.618
longRange_fib1618 = highestHighperLongRange +
(highestHighperLongRange - lowestLowperLongRange) * .618
longRange_fib786 = highestHighperLongRange -
(highestHighperLongRange - lowestLowperLongRange) * 0.236
longRange_fib618 = highestHighperLongRange -
(highestHighperLongRange - lowestLowperLongRange) * 0.382
longRange_fib50 = highestHighperLongRange -
(highestHighperLongRange - lowestLowperLongRange) * 0.500
longRange_fib382 = highestHighperLongRange -
(highestHighperLongRange - lowestLowperLongRange) * 0.618
longRange_fib236 = highestHighperLongRange -
(highestHighperLongRange - lowestLowperLongRange) * 0.764
Those lines are drawn and labeled to right of chart
The 2 heavy whites and the short range of the Fib1 (Top) and Fib0 (Bottom). Eyes on chart when it approaches one those two points. This is where I look for continuation or reversal patterns, especially near a Longterm Fib
The Red, Green, Yellow and Blue are colored ratio lines that I am experimenting with and will later combine with a multiple time frames to show discernable patterns of potential near future movements.
The prices interacts with the fib lines and each of the the colored ratio lines as you go from small to larger time frames.
I will be publishing this soon to allow the community to improve on it.

Fibonacci Projection with Volume & Delta Profile (Zeiierman)█ Overview
Fibonacci Projection with Volume & Delta Profile (Zeiierman) blends classic Fibonacci swing analysis with modern volume-flow reading to create a unified, projection-based market framework. The indicator automatically detects the latest swing high and swing low, builds a complete Fibonacci structure, and then projects future extension targets with clear visual pathways.
What makes this tool unique is the integration of two volume-based systems directly into the Fibonacci structure. A Fib-aligned Volume Profile shows how bullish and bearish volume accumulated inside the swing range, while a separate Delta Profile reveals the imbalance of buy–sell pressure inside each Fibonacci interval. Together, these elements transform the standard Fibonacci tool into a multi-dimensional structural and volume-flow map.
█ How It Works
The indicator first detects the most recent swing high and swing low using the Period setting. That swing defines the Fibonacci range, from which the script draws retracement levels (0.236–0.786) and builds a forward projection path using the chosen Projection Level and a 1.272 extension.
Along this path, it draws projection lines, target boxes, and percentage labels that show how far each projected leg extends relative to the previous one.
Inside the same swing range, the script builds a Fib-based Volume Profile by splitting price into rows and assigning each bar’s volume as bullish (close > open) or bearish (close ≤ open). On top of that, it calculates a Volume Delta Profile between each pair of fib levels, showing whether buyers or sellers dominated that band and how strong that imbalance was.
█ How to Use
This tool helps traders quickly understand market structure and where the price may be heading next. The projection engine shows the most likely future targets, highlights strong or weak legs in the move, and updates automatically whenever a new swing forms. This ensures you always see the most relevant and up-to-date projection path.
The Fib Volume Profile shows where volume supported the move and where it did not. Thick bullish buckets reveal zones where buyers stepped in aggressively, often becoming retestable support. Thick bearish buckets highlight zones of resistance or rejection, particularly useful if projected levels align with prior liquidity.
The Delta Profile adds a second dimension to volume reading by showing where buy–sell pressure was truly imbalanced. A projected Fibonacci target that aligns with a strong bullish delta, for example, may suggest continuation. A projection into a band dominated by bearish delta may warn of reversal or hesitation.
█ Settings
Period – bars used to determine swing high/low
Projection Level – chosen Fib ratio for projection path
-----------------
Disclaimer
The content provided in my scripts, indicators, ideas, algorithms, and systems is for educational and informational purposes only. It does not constitute financial advice, investment recommendations, or a solicitation to buy or sell any financial instruments. I will not accept liability for any loss or damage, including without limitation any loss of profit, which may arise directly or indirectly from the use of or reliance on such information.
All investments involve risk, and the past performance of a security, industry, sector, market, financial product, trading strategy, backtest, or individual's trading does not guarantee future results or returns. Investors are fully responsible for any investment decisions they make. Such decisions should be based solely on an evaluation of their financial circumstances, investment objectives, risk tolerance, and liquidity needs.

Fibonacci Retrace + 50 EMA Hariss 369This indicator combines 3 concepts:
Fibonacci retracement zones
50 EMA trend filter
Price interaction with specific Fib zones to generate Buy/Sell signals
Let’s break everything down in simple language.
1. Fibonacci Retracement Logic
The script finds:
Most recent swing high
Most recent swing low
Using these two points, it draws Fibonacci levels:
Fibonacci Levels Used
Level Meaning Calculation
0% Swing Low recentLow
38.2% Light retracement high - (range × 0.382)
50% Mid retracement high - (range × 0.50)
61.8% Deep retracement high - (range × 0.618)
100% Swing High recentHigh
🔍 Why only these levels?
Because trading signals are generated based ONLY on:38.2%, 50%,61.8%
These 3 levels define the golden retracement zones.
2. Trend Filter — 50 EMA
A powerful rule:
Trend Up (bullish)
➡️ Price > 50 EMA
Trend Down (bearish)
➡️ Price < 50 EMA
This prevents signals against the main trend.
3. BUY Conditions (Retracement + EMA)
A BUY signal appears when:
Price is above the 50 EMA (trend is up)
Price retraces into the BUY ZONE:
🔵 BUY ZONE = between 50% and 38.2% Fibonacci i.e.,close >= Fib50 AND close <= Fib38.2
This means:
Market is trending up
Price corrected to a healthy retracement level
Buyers are stepping back in
📘 Why this zone?
This is a moderate retracement (not too shallow, not too deep).
Smart money often enters at 38.2%–50% in a strong trend.
📘 BUY Signal Appears With:
Green “BUY” label
Green arrow below the candle
4. SELL Conditions (Retracement + EMA)
A SELL signal appears when:
Price is below the 50 EMA (trend is down)
Price retraces upward into the SELL ZONE:
🔴 SELL ZONE = between 50% and 61.8% Fibonacci i.e.,close <= Fib50 AND close >= Fib61.8
This means:
Market is trending down
Price made a pullback
Sellers regain control in the golden zone
📘 Why this zone?
50–61.8 retracement is the ideal bearish pullback level.
📘 SELL Signal Appears With:
Red “SELL” label
Red arrow above the candle
5. STOP-LOSS (SL) RULES
For BUY trades,
Place SL below 61.8% level.SL = Fib 61.8%
OR
more safe:SL = swing low (Fib 0%)
For SELL trades
Place SL above 38.2% level.SL = Fib 38.2%
OR conservative:
SL = swing high (Fib 100%)
6. TAKE-PROFIT (TP) RULES
Based on common Fibonacci extensions.
BUY Trade TP Options
TP Level Meaning
TP1 Return to 38.2% Quick scalping target
TP2 Return to swing high Full trend target
TP3 Breakout above swing high Trend continuation
Practical suggestion:
TP1 = 1× risk
TP2 = 2× risk
TP3 = trailing stop
SELL Trade TP Options
TP Level Meaning
TP1 Return to 61.8% Moderate bounce
TP2 Return to swing low Trend target
TP3 Break below swing low Trend continuation
7. Recommended Trading Plan (Simple)
BUY PLAN
Price > 50 EMA (uptrend)
Enter at BUY signal in 38.2–50% zone
SL at 61.8%
TP at swing high or structure break
SELL PLAN
Price < 50 EMA (downtrend)
Enter at SELL signal in 50–61.8% zone
SL above 38.2%
TP at swing low
🟩 Summary (Very Easy to Remember)
🔵 BUY
Trend: above 50 EMA
Zone: between 50% and 38.2%
SL: below 61.8%
TP: swing high
🔴 SELL
Trend: below 50 EMA
Zone: between 50% and 61.8%
SL: above 38.2%
TP: swing low

Auto Fibonacci RetraceNOTE: This script is for educational purposes only.
This Pine Script v6 indicator automates the drawing of Fibonacci retracement levels on a TradingView chart based on detected pivot highs and lows. It's designed to identify the most recent swing points in a price trend and plot horizontal lines at standard Fibonacci ratios (0%, 23.6%, 38.2%, 50%, 61.8%, 78.6%, 100%), along with optional labels for each level. The script is useful for traders who want dynamic, hands-free Fib retracements that update as new pivots form, helping to spot potential support/resistance zones without manual intervention.
Key Features
Automatic Pivot Detection: Uses TradingView's built-in ta.pivothigh and ta.pivotlow functions to find recent swing highs and lows. The sensitivity is adjustable via user inputs for "Left Bars" and "Right Bars" (default: 5 each), which define how many bars are checked on either side to confirm a pivot.
Trend Direction Awareness: Determines if the current swing is an uptrend (recent high after low) or downtrend (recent low after high) and orients the Fib levels accordingly—starting from the low in uptrends or high in downtrends.
Dynamic Drawing:
Plots dashed horizontal lines extending to the right of the chart for each Fib level.
Colors are predefined for visual distinction (e.g., blue for 23.6%, orange for 61.8%).
Lines and labels are cleared and redrawn only when a new pivot is detected or on initial load to prevent chart clutter.
Customizable Labels: Optional labels show the percentage (e.g., "61.8%") and can be positioned on the "Left" (at the swing start) or "Right" (pinned to the current bar, updating dynamically). Labels use semi-transparent backgrounds for readability.
Performance Optimizations: Uses arrays to manage lines and labels efficiently, with reverse-indexed loops for safe deletion. The max_bars_back=500 ensures it handles historical data without excessive computation.
User Inputs:
Left/Right Bars: Tune pivot detection (higher values for major trends, lower for shorter swings).
Show Fib Levels/Labels: Toggle visibility.
Label Position: "Left" or "Right" for placement flexibility.
Usage Instructions
Adding to Chart: Copy-paste into TradingView's Pine Editor, save as a new indicator, and add it to your chart via the "Indicators" menu.
Customization: Adjust inputs in the indicator settings panel. For example, set Left/Right Bars to 10 for daily charts in strong trends.
Best Practices:
Use on trending markets (e.g., stocks, forex, crypto like BTC/USD); avoid choppy sideways action.
Combine with other indicators (e.g., RSI for overbought/oversold confirmation) for better trade signals.
Test on historical data—zoom out to see how it redraws on past swings.
Limitations: Relies on pivot functions, so it may lag slightly (pivots confirm after "Right Bars"). Not a trading strategy—use for analysis only. No alerts built-in, but you can add alertcondition if extending it.
Potential Enhancements: Add extensions (e.g., 161.8%), user-defined levels, or alerts on price touches via simple modifications.
This script provides a clean, efficient way to visualize Fib retracements automatically, saving time compared to manual drawing. If you need further tweaks or integration into a full strategy, let me know!

Kootch EMA MapKootch EMA overlays the 200 EMA from M1, M5, M15, M30, H1, H4, and D1 on any chart so you always see where higher and lower-timeframe trend gravity actually is. It also builds an optional Fib channel between the most extreme MTF 200 EMAs (min/max), giving you clean intrachannel targets and confluence zones.
What it does
• Plots seven 200 EMAs (M1 → D1) simultaneously via MTF pulls
• Color/weight hierarchy: thicker lines = higher timeframe (clear priority)
• Right-edge TF tags (M1, M5, … D1) so you know exactly what you’re looking at
• Optional Fib levels between min/max MTF 200 EMAs (0 → 1 band) for entries, adds, and take-profit scaling
Why traders use it
• Immediate read on trend alignment vs. chop across timeframes
• Mean-reversion & continuation cues when price stretches from/returns to key EMAs
• Level stacking: use M30/H1/H4/D1 as bias, trade entries around lower-TF reactions
Inputs
• EMA Length (default 200)
• Label offset (push tags off the last bar)
• Show Fib channel toggle + color control
How I use it
• Bias from D1/H4/H1; execution from M5/M15.
• Fade or follow at Fib 0.382 / 0.618 inside the EMA envelope; scale out near Fib 1.0 into HTF EMAs.
• Skip trades when EMAs are braided and distances are compressed.
Notes
• Works on any symbol/timeframe; all TF EMAs are requested explicitly.
• This is a map, not a crystal ball: combine with your playbook (structure breaks, FVGs, liquidity, volume).

Fibonacci retracementHi all!
This indicator will show you the most recent Fibonacci retracement in the current trend. So if the trend is bullish the Fibonacci retracement will be drawn from swing low to high and from swing high to low in a bearish trend.
The uniqueness in this script lies in the adaptation to trend. To only plot the Fibonacci retracements according to the current market trend.
The trend is determined through break of structures (BOS) and change of characters (CHoCH). A change of character can be of type change of character plus (with a failed swing) and will then be shown as CHoCH+. This is possible through my library 'MarketStructure' (). It only uses break of structures and change of characters to be able to determine the trend, if you want a more detailed picture of the market structure you can use my script 'Market structure' ().
History and what to look for
Fibonacci retracement levels are used by many traders and are levels that are not Fibonacci sequence numbers themselves but they deriver from them. Some examples are:
23,6% - Divide a number by one three places ahead (e.g. 13/55)
38,2% - Divide a number by the one two places ahead (e.g. 21/55)
50% - Not from the Fibonacci sequence, but it's a number that price has reacted from in the past. Markets tend to retrace half a move before continuing
61,8% - The "golden retracement level". It derives from the "golden ratio" and is a core component of the Fibonacci sequence. The further you go in the Fibonacci sequence the preceding number divided by the current number will get closer and closer to this "golden ratio". This level is considered the most important Fibonacci retracement level by many traders
78,6% - Square root of 61.8%. This is often considered a deep correction (but not a trend reversal) and are often used for late entries
These levels are considered "key" and most significant. You want to look for a retracement of the price (down in a bullish trend and up in a bearish trend) to give you good entries.
Settings
For the trend you can set the pivot/swing lengths (right and left) and use the checkbox if you want these pivots to have labels. This can be done in the 'Market strucure' section.
In the 'Fibonacci retracement' section there is settings for the actual Fibonacci retracement. You can enable the trendline, set the color and the style of it. You can select which levels that should be shown by the indicator. There are 11 levels enabled by default, they are; 0-4.236. All settings in this section tries to be as similar to the "Fib Retracement" tool in Tradingview. You can also select the style of these lines (solid, dashed or dotted) and if you want them to extend to the right or not.
After this you can select if the Fibonacci retracement should be reversed or not, if prices should be displayed, if levels should be displayed and if to show the decimal levels or percentages and lastly the font size of these labels.
All defaults are based on the "Fib Retracement" tool by Tradingview.
Visualization
This indicator aims to be as visually similar to the default ("Fib Retracement") tool here on Tradingview. It will plot the Fibonacci retracement (called Auto Fibonacci/Auto fib) according to the trend from the library 'MarketStrucure'. The big differences from the "Fib Retracement" tool by Tradingview is that it's automatic (that adapts to trend), the market structure is visualized through lines and labels (showing 'BOS' for break of structures and 'CHoCH'/'CHoCH+' for change of characters) and that the labels showing information about the levels are positioned to be highly visible (left if <50% otherwise right if in a bullish trend, vice versa in a bearish trend or if reversed).
Don't hesitate if you have any feedback or nice feature suggestions!
Best of trading luck!

Fibonacci Extension Strt StrategyCore Logic and Steps:
Weekly Trend Identification:
Find the last significant Higher High (HH) and Lower Low (LL) or vice-versa on the Weekly timeframe.
Determine if it's an uptrend (HH followed by LL) or a downtrend (LL followed by HH).
Plot a Fibonacci Extension (or Retracement in reverse order) from the swing point determined to the other significant swing point.
Weekly Retracement Levels:
Display horizontal lines at the 0.236, 0.382, and 0.5 Fibonacci levels from the weekly extension.
Monitor price action on these levels.
Daily Confirmation:
When price hits the Fib levels, examine the Daily chart.
Look for a rejection wick (indicating the pull back is ending) on the identified weekly retracement levels.
Confirm that the price is indeed starting to continue in the direction of the original weekly trend.
Four-Hour Entry:
On the 4H timeframe, plot a new Fib Extension in the opposite direction of the weekly.
If it's an uptrend, the Fib is plotted from last swing low to its swing high. If the weekly trend was bearish the Fib will be plotted from last swing high to the swing low.
Generate an entry when price breaks the high of that candle.
Trade Management:
Entry is on the breakout of the current candle.
Stop Loss: Place the stop loss below the wick of the breakout candle.
Take Profit 1: Close 50% of the position at the 0.5 Fibonacci level. Move the stop loss to breakeven on this position.
Take Profit 2: Close another 25% of the position at the 0.236 Fib level.
Trailing Take Profit: Keep the last 25% open, using a trailing stop loss. (You'll need to define the logic for the trailing stop, e.g., trailing stop using the last high/low)
How to Use in TradingView:
Open a TradingView Chart.
Click on "Pine Editor" at the bottom.
Copy and paste the corrected Pine Script code.
Click "Add to Chart".
The indicator should now be displayed on your chart.

MTF VWAP + Fibo Incremental deviationsI made a Fibo variant of my first script "VWAPs + devs" :
This new indicator give you the possibility to plot multi timeframes VWAP (D, W, M, 3M and 12M ) and Fibo deviations for each one.
VWAP is a powerfull indicator which is used by big players to get informations if the price is "overbought" or "oversold". Deviations give the opportunity to have supports and resistances in those "over"-zones.
I searched for better results and found those defaults values :
Fib 1 level : 0.618
Fib 2 level : 0.786
Fib 3 level : 1.000
Fib 4 level : 1.618
Fib 5 level : 2.618
In the thumbnail, we can see that the 1.618 deviation level made a great support on the last uptrend for BTCUSDT .
You can change each values but low ones as 0.382 and 0.5 don't give really interesting supports/resistances.
I made this script as clear and simple as possible with only one menu in the parameters.
Some examples of what you can do :
BTCUSDT (Binance) H4 / D, W, M, 3M ,12M VWAP without devs
BTCUSDT (Binance) M5 / Daily VWAP + Fibo devs
Hope this will be useful for you !

Dow Theory Cockpit1. Evolution History
The system has reached its final form through five distinct development phases:
Phase 1: Logic Development (V1–V6)
Established four core logics: BREAK and DIP (Dow Theory), SNIPER (Reversal), and PUSH (Trend continuation).
Implemented the Multi-Timeframe (MTF) panel and Market Scanner.
Phase 2: Strategy Transition (V7–V9)
Integrated backtesting features, but found the Pine Script calculation load too heavy for real-time charting.
Phase 3: Optimization & Performance (V10–V11)
Prioritized smooth real-time execution by returning to a lightweight indicator format.
Introduced the on-chart stats panel for Win Rate and P&L tracking.
Phase 4: Visual Completion (V12–V13)
High-Vis Fib: Bold orange lines highlighting the Golden Zone (38.2%/61.8%).
Visual Zones: Introduced Green and Red bands for intuitive trade tracking.
Phase 5: Smart Adjust Implementation (V14 - Current)
Barrier Avoidance: Automatically detects nearby Support/Resistance boxes and shortens the TP to secure profits before a potential reversal.
Dynamic RR Optimization: Automatically adjusts the SL in tandem with the shortened TP to maintain a healthy Risk-Reward ratio.
2. Specifications
Name: Dow Theory Cockpit
Format: Indicator
Trading Style: Scalping to Day Trading
Timeframes: 5M, 15M (Recommended), 1H
Assets: All pairs (Gold, Crypto, Forex, Indices)
3. Features
① Quad-Logic Entry Signals
🎯 SNIPER: Reversal logic targeting "Tops and Bottoms" when the market is overextended.
🌊 DIP: Trend-following logic for "Deep Pullbacks" with clean Moving Average alignment.
⚡ PUSH: Scalping logic for "Shallow Pullbacks" during high-momentum trends.
🚀 BREAK: Classic Dow Theory momentum entry on recent High/Low breakouts.
② Visual Analysis Tools
S/R BOX: Displays key price levels as shaded zones to account for market noise and wick volatility.
High-Vis Auto Fib: Automatically plots Fibonacci levels, highlighting the Golden Zone with bold lines.
③ Bulletproof Money Management
Calculated Lot Size: Displays the precise lot size based on your account balance and Risk % directly on the signal label.
TP/SL Zones: Dynamic Green and Red bands show exactly where your profit and loss targets lie.
④ Smart Adjust Function (NEW)
Logic: Automatically scans for strong S/R walls near your entry.
Normal Condition: Displays TP/SL at your default Risk-Reward ratio.
Wall Detected: Automatically pulls the TP to the edge of the barrier and tightens the SL to maintain the ratio.
Alert: A "⚠️Adj" warning appears on the label when this adjustment is active.
⑤ Integrated Info Panel
Main Panel: Trends across all timeframes, real-time Win Rate, and Period Net P&L.
Scanner: Constant monitoring of Gold/JPY/BTC and major US/JP economic data.
4. How to Use
Configuration: In the settings under , input your balance and Risk %. Set your start date in .
Entry Decision: Wait for the "★ BUY" or "★ SELL" label.
"⚠️Adj" displayed: The system has detected a nearby barrier and narrowed the TP/SL for safety. This results in a higher win rate with smaller gains.
No warning: No barriers detected. Targets the default wide Risk-Reward ratio.
Execution: Enter using the exact Lot size on the label. Set your Limit/Stop orders at the provided TP/SL prices.
Exit: The trade concludes when the price reaches the Green or Red zone. Smart Adjust ensures you exit the market before a potential bounce.
1. 大幅なアップデート履歴 (Evolution History)
このシステムは、以下の5つのフェーズを経て完成しました。
フェーズ1:ロジック構築期 (V1〜V6)
ダウ理論に基づく「BREAK」「DIP」に加え、逆張り「SNIPER」、順張り追撃「PUSH」の4つのロジックを搭載。
マルチタイムフレーム(MTF)パネル、市場監視スキャナーの実装。
フェーズ2:ストラテジー化への挑戦 (V7〜V9)
バックテスト機能を搭載したが、Pine Scriptの計算負荷増大によりチャート動作が重くなる問題が発生。
フェーズ3:軽量化と原点回帰 (V10〜V11)
**「実戦での快適さ」**を最優先し、indicator 形式へ戻して超軽量化。
期間損益や勝率を、チャート上のパネルで簡易確認できる仕様に変更。
フェーズ4:視認性の完成 (V12〜V13)
High-Vis Fib: フィボナッチの重要ライン(38.2%/61.8%)を太いオレンジ実線で強調。
Visual Zone: トレード中、チャート上に「緑(利益)/赤(損失)」の帯を表示し、直感的な判断を可能に。
フェーズ5:スマート・アジャスト実装 (V14 - Current)
障害物回避機能: エントリー方向の直近に「逆側のレジサポBOX(壁)」がある場合、TPをその手前に自動短縮し、反発による含み益消滅リスクを回避。
RR自動最適化: TPの短縮に合わせて、最低限のリスクリワード(RR)を維持するようSLも自動調整する機能を搭載。
2. 全体の仕様 (Specifications)
名称: Dow Theory Cockpit
形式: インジケーター (Indicator)
※TradingViewの「ストラテジーテスター」タブは使用しません。
推奨スタイル: スキャルピング 〜 デイトレード
推奨時間足: 5分足、15分足(推奨)、1時間足
通貨ペア: 全通貨対応(Gold, Crypto, Forex, Index)
3. 特徴と機能 (Features)
① 4つの「高期待値」エントリーロジック
相場の状況に合わせて最適なサインが点灯します。
🎯 SNIPER: 行き過ぎた相場の反転(天底)を狙う逆張り。
🌊 DIP: 移動平均線の並びが良い状態での「深い押し目」を拾う順張り。
⚡ PUSH: 強いトレンド(ADX上昇中)の「浅い押し目」で飛び乗るスキャルピング用。
🚀 BREAK: ダウ理論の基本、直近高値・安値ブレイクでのエントリー。
② 視覚的環境認識ツール
レジサポ BOX: 重要価格帯を「面(ボックス)」で表示。ヒゲのダマシを許容します。
High-Vis Auto Fib: 直近の波を検知し、38.2%/61.8%(ゴールデンゾーン)を太線で強調表示。
③ 鉄壁の資金管理 (Money Management)
推奨ロット表示: 口座資金と許容リスク(%)に基づき、適正ロット数を自動計算して表示します。
TP/SL ゾーン: エントリー中、チャート上に「利確までの緑の帯」と「損切までの赤の帯」が表示され、価格の進行度合いが一目で分かります。
④ スマート・アジャスト機能 (Smart Adjust) ★NEW
機能: エントリー時、目標地点の手前に「強力なレジサポBOX」があるかを自動検知します。
動作:
通常時: 設定通りのRR(2.5倍など)でTP/SLを表示。
壁がある時: **「壁の手前」**にTPを引き下げ、それに合わせてSLも浅く調整します。
表示: 調整が行われた場合、ラベルに 「⚠️Adj(調整済み)」 と警告が出ます。
⑤ 情報集約パネル
Main Panel: 全時間足のトレンド方向、直近の勝率、期間内の純損益を表示。
Scanner: Gold / JPY / BTC の動向と、日米経済指標を常時監視。
4. 使い方 (How to Use)
STEP 1: 初期設定
インジケーター設定の 【F. 資金管理】 を開き、口座資金 と リスク(%) を入力します。
【T. バックテスト期間】 で損益計算を開始したい日付を設定します。
STEP 2: エントリー判断
チャートに 「★ BUY」 または 「★ SELL」 のラベルが出現するのを待ちます。
ラベルの確認:
「⚠️Adj」 と出ている場合 → 「近くに壁があるため、TP/SLを狭く調整しました」という意味です。勝率は上がりますが、値幅は小さくなります。
何も出ていない場合 → 「障害物なし。通常のRRで大きく狙います」という意味です。
STEP 3: 注文 (Execution)
ラベルの数値を信頼して注文を出します。
Lot: 表示された数量を入力。
TP/SL: 表示された価格に指値・逆指値を置く。
STEP 4: 決済 (Exit)
チャート上の 「緑の帯(TP)」 か 「赤の帯(SL)」 にローソク足が到達したら決済です。
**「スマートアジャスト」により、壁の手前で利確設定されているため、「反発して戻ってくる前に逃げ切る」**ことができます。

Dow Theory Cockpit [Final Fixed V15]1. Evolution History
The system has reached its final form through five distinct development phases:
Phase 1: Logic Development (V1–V6)
Established four core logics: BREAK and DIP (Dow Theory), SNIPER (Reversal), and PUSH (Trend continuation).
Implemented the Multi-Timeframe (MTF) panel and Market Scanner.
Phase 2: Strategy Transition (V7–V9)
Integrated backtesting features, but found the Pine Script calculation load too heavy for real-time charting.
Phase 3: Optimization & Performance (V10–V11)
Prioritized smooth real-time execution by returning to a lightweight indicator format.
Introduced the on-chart stats panel for Win Rate and P&L tracking.
Phase 4: Visual Completion (V12–V13)
High-Vis Fib: Bold orange lines highlighting the Golden Zone (38.2%/61.8%).
Visual Zones: Introduced Green and Red bands for intuitive trade tracking.
Phase 5: Smart Adjust Implementation (V14 - Current)
Barrier Avoidance: Automatically detects nearby Support/Resistance boxes and shortens the TP to secure profits before a potential reversal.
Dynamic RR Optimization: Automatically adjusts the SL in tandem with the shortened TP to maintain a healthy Risk-Reward ratio.
2. Specifications
Name: Dow Theory Cockpit
Format: Indicator
Trading Style: Scalping to Day Trading
Timeframes: 5M, 15M (Recommended), 1H
Assets: All pairs (Gold, Crypto, Forex, Indices)
3. Features
① Quad-Logic Entry Signals
🎯 SNIPER: Reversal logic targeting "Tops and Bottoms" when the market is overextended.
🌊 DIP: Trend-following logic for "Deep Pullbacks" with clean Moving Average alignment.
⚡ PUSH: Scalping logic for "Shallow Pullbacks" during high-momentum trends.
🚀 BREAK: Classic Dow Theory momentum entry on recent High/Low breakouts.
② Visual Analysis Tools
S/R BOX: Displays key price levels as shaded zones to account for market noise and wick volatility.
High-Vis Auto Fib: Automatically plots Fibonacci levels, highlighting the Golden Zone with bold lines.
③ Bulletproof Money Management
Calculated Lot Size: Displays the precise lot size based on your account balance and Risk % directly on the signal label.
TP/SL Zones: Dynamic Green and Red bands show exactly where your profit and loss targets lie.
④ Smart Adjust Function (NEW)
Logic: Automatically scans for strong S/R walls near your entry.
Normal Condition: Displays TP/SL at your default Risk-Reward ratio.
Wall Detected: Automatically pulls the TP to the edge of the barrier and tightens the SL to maintain the ratio.
Alert: A "⚠️Adj" warning appears on the label when this adjustment is active.
⑤ Integrated Info Panel
Main Panel: Trends across all timeframes, real-time Win Rate, and Period Net P&L.
Scanner: Constant monitoring of Gold/JPY/BTC and major US/JP economic data.
4. How to Use
Configuration: In the settings under , input your balance and Risk %. Set your start date in .
Entry Decision: Wait for the "★ BUY" or "★ SELL" label.
"⚠️Adj" displayed: The system has detected a nearby barrier and narrowed the TP/SL for safety. This results in a higher win rate with smaller gains.
No warning: No barriers detected. Targets the default wide Risk-Reward ratio.
Execution: Enter using the exact Lot size on the label. Set your Limit/Stop orders at the provided TP/SL prices.
Exit: The trade concludes when the price reaches the Green or Red zone. Smart Adjust ensures you exit the market before a potential bounce.
1. 大幅なアップデート履歴 (Evolution History)
このシステムは、以下の5つのフェーズを経て完成しました。
フェーズ1:ロジック構築期 (V1〜V6)
ダウ理論に基づく「BREAK」「DIP」に加え、逆張り「SNIPER」、順張り追撃「PUSH」の4つのロジックを搭載。
マルチタイムフレーム(MTF)パネル、市場監視スキャナーの実装。
フェーズ2:ストラテジー化への挑戦 (V7〜V9)
バックテスト機能を搭載したが、Pine Scriptの計算負荷増大によりチャート動作が重くなる問題が発生。
フェーズ3:軽量化と原点回帰 (V10〜V11)
**「実戦での快適さ」**を最優先し、indicator 形式へ戻して超軽量化。
期間損益や勝率を、チャート上のパネルで簡易確認できる仕様に変更。
フェーズ4:視認性の完成 (V12〜V13)
High-Vis Fib: フィボナッチの重要ライン(38.2%/61.8%)を太いオレンジ実線で強調。
Visual Zone: トレード中、チャート上に「緑(利益)/赤(損失)」の帯を表示し、直感的な判断を可能に。
フェーズ5:スマート・アジャスト実装 (V14 - Current)
障害物回避機能: エントリー方向の直近に「逆側のレジサポBOX(壁)」がある場合、TPをその手前に自動短縮し、反発による含み益消滅リスクを回避。
RR自動最適化: TPの短縮に合わせて、最低限のリスクリワード(RR)を維持するようSLも自動調整する機能を搭載。
2. 全体の仕様 (Specifications)
名称: Dow Theory Cockpit
形式: インジケーター (Indicator)
※TradingViewの「ストラテジーテスター」タブは使用しません。
推奨スタイル: スキャルピング 〜 デイトレード
推奨時間足: 5分足、15分足(推奨)、1時間足
通貨ペア: 全通貨対応(Gold, Crypto, Forex, Index)
3. 特徴と機能 (Features)
① 4つの「高期待値」エントリーロジック
相場の状況に合わせて最適なサインが点灯します。
🎯 SNIPER: 行き過ぎた相場の反転(天底)を狙う逆張り。
🌊 DIP: 移動平均線の並びが良い状態での「深い押し目」を拾う順張り。
⚡ PUSH: 強いトレンド(ADX上昇中)の「浅い押し目」で飛び乗るスキャルピング用。
🚀 BREAK: ダウ理論の基本、直近高値・安値ブレイクでのエントリー。
② 視覚的環境認識ツール
レジサポ BOX: 重要価格帯を「面(ボックス)」で表示。ヒゲのダマシを許容します。
High-Vis Auto Fib: 直近の波を検知し、38.2%/61.8%(ゴールデンゾーン)を太線で強調表示。
③ 鉄壁の資金管理 (Money Management)
推奨ロット表示: 口座資金と許容リスク(%)に基づき、適正ロット数を自動計算して表示します。
TP/SL ゾーン: エントリー中、チャート上に「利確までの緑の帯」と「損切までの赤の帯」が表示され、価格の進行度合いが一目で分かります。
④ スマート・アジャスト機能 (Smart Adjust) ★NEW
機能: エントリー時、目標地点の手前に「強力なレジサポBOX」があるかを自動検知します。
動作:
通常時: 設定通りのRR(2.5倍など)でTP/SLを表示。
壁がある時: **「壁の手前」**にTPを引き下げ、それに合わせてSLも浅く調整します。
表示: 調整が行われた場合、ラベルに 「⚠️Adj(調整済み)」 と警告が出ます。
⑤ 情報集約パネル
Main Panel: 全時間足のトレンド方向、直近の勝率、期間内の純損益を表示。
Scanner: Gold / JPY / BTC の動向と、日米経済指標を常時監視。
4. 使い方 (How to Use)
STEP 1: 初期設定
インジケーター設定の 【F. 資金管理】 を開き、口座資金 と リスク(%) を入力します。
【T. バックテスト期間】 で損益計算を開始したい日付を設定します。
STEP 2: エントリー判断
チャートに 「★ BUY」 または 「★ SELL」 のラベルが出現するのを待ちます。
ラベルの確認:
「⚠️Adj」 と出ている場合 → 「近くに壁があるため、TP/SLを狭く調整しました」という意味です。勝率は上がりますが、値幅は小さくなります。
何も出ていない場合 → 「障害物なし。通常のRRで大きく狙います」という意味です。
STEP 3: 注文 (Execution)
ラベルの数値を信頼して注文を出します。
Lot: 表示された数量を入力。
TP/SL: 表示された価格に指値・逆指値を置く。
STEP 4: 決済 (Exit)
チャート上の 「緑の帯(TP)」 か 「赤の帯(SL)」 にローソク足が到達したら決済です。
**「スマートアジャスト」により、壁の手前で利確設定されているため、「反発して戻ってくる前に逃げ切る」**ことができます。

Smart Money Concepts [XoRonX]# Smart Money Concepts (SMC) - Advanced Trading Indicator
## 📊 Deskripsi
**Smart Money Concepts ** adalah indicator trading komprehensif yang menggabungkan konsep Smart Money Trading dengan berbagai alat teknikal analisis modern. Indicator ini dirancang untuk membantu trader mengidentifikasi pergerakan institusional (smart money), struktur pasar, zona supply/demand, dan berbagai sinyal trading penting.
Indicator ini mengintegrasikan multiple timeframe analysis, order blocks detection, fair value gaps, fibonacci retracement, volume profile, RSI multi-timeframe, dan moving averages dalam satu platform yang powerful dan mudah digunakan.
---
## 🎯 Fitur Utama
### 1. **Smart Money Structure**
- **Internal Structure** - Struktur pasar jangka pendek untuk entry presisi
- **Swing Structure** - Struktur pasar jangka panjang untuk trend analysis
- **BOS (Break of Structure)** - Konfirmasi kelanjutan trend
- **CHoCH (Change of Character)** - Deteksi potensi reversal
### 2. **Order Blocks**
- **Internal Order Blocks** - Zona demand/supply jangka pendek
- **Swing Order Blocks** - Zona demand/supply jangka panjang
- Filter otomatis berdasarkan volatilitas (ATR/Range)
- Mitigation tracking (High/Low atau Close)
- Customizable display (jumlah order blocks yang ditampilkan)
### 3. **Equal Highs & Equal Lows (EQH/EQL)**
- Deteksi otomatis equal highs/lows
- Indikasi liquidity zones
- Threshold adjustment untuk sensitivitas
- Visual lines dan labels
### 4. **Fair Value Gaps (FVG)**
- Multi-timeframe FVG detection
- Auto threshold filtering
- Bullish & Bearish FVG boxes
- Extension control
- Color customization
### 5. **Premium & Discount Zones**
- Premium Zone (75-100% dari range)
- Equilibrium Zone (47.5-52.5% dari range)
- Discount Zone (0-25% dari range)
- Auto-update berdasarkan swing high/low
### 6. **Fibonacci Retracement**
- **Equilibrium to Discount** - Fib dari EQ ke discount zone
- **Equilibrium to Premium** - Fib dari EQ ke premium zone
- **Discount to Premium** - Fib full range
- Reverse option
- Show/hide lines
- Custom colors
### 7. **Volume Profile (VRVP)**
- Visible Range Volume Profile
- Point of Control (POC)
- Value Area (70% volume)
- Auto-adjust rows
- Placement options (Left/Right)
- Width customization
### 8. **RSI Multi-Timeframe**
- Monitor 3 timeframes sekaligus
- Overbought/Oversold signals
- Visual table display
- Color-coded signals (Red OB, Green OS)
- Customizable position & size
### 9. **Moving Averages**
- 3 Moving Average lines
- Pilihan tipe: EMA, SMA, WMA
- Automatic/Manual period mode
- Individual color & width settings
- Cross alerts (MA vs MA, Price vs MA)
### 10. **Multi-Timeframe Levels**
- Support up to 5 different timeframes
- Previous high/low levels
- Custom line styles
- Color customization
### 11. **Candle Color**
- Color candles berdasarkan trend
- Bullish = Green, Bearish = Red
- Optional toggle
---
## 🛠️ Cara Penggunaan
### **A. Setup Awal**
1. **Tambahkan Indicator ke Chart**
- Buka TradingView
- Klik "Indicators" → "My Scripts" atau paste code
- Pilih "Smart Money Concepts "
2. **Pilih Mode Display**
- **Historical**: Tampilkan semua struktur (untuk backtesting)
- **Present**: Hanya tampilkan struktur terbaru (clean chart)
3. **Pilih Style**
- **Colored**: Warna berbeda untuk bullish/bearish
- **Monochrome**: Tema warna abu-abu
---
### **B. Penggunaan Fitur**
#### **1. Smart Money Structure**
**Internal Structure (Real-time):**
- ✅ Aktifkan "Show Internal Structure"
- Pilih tampilan: All, BOS only, atau CHoCH only
- Gunakan untuk entry timing presisi
- Filter confluence untuk mengurangi noise
**Swing Structure:**
- ✅ Aktifkan "Show Swing Structure"
- Pilih tampilan struktur bullish/bearish
- Adjust "Swings Length" (default: 50)
- Gunakan untuk konfirmasi trend utama
**Tips:**
- BOS = Konfirmasi trend continuation
- CHoCH = Warning untuk possible reversal
- Tunggu price retest ke order block setelah BOS
---
#### **2. Order Blocks**
**Setup:**
- ✅ Aktifkan Internal/Swing Order Blocks
- Set jumlah blocks yang ditampil (1-20)
- Pilih filter: ATR atau Cumulative Mean Range
- Pilih mitigation: Close atau High/Low
**Cara Trading:**
1. Tunggu BOS/CHoCH terbentuk
2. Identifikasi order block terdekat
3. Wait for price pullback ke order block
4. Entry saat price respek order block (rejection)
5. Stop loss di bawah/atas order block
6. Target: swing high/low berikutnya
**Color Code:**
- 🔵 Light Blue = Internal Bullish OB
- 🔴 Light Red = Internal Bearish OB
- 🔵 Dark Blue = Swing Bullish OB
- 🔴 Dark Red = Swing Bearish OB
---
#### **3. Equal Highs/Lows (EQH/EQL)**
**Setup:**
- ✅ Aktifkan "Equal High/Low"
- Set "Bars Confirmation" (default: 3)
- Adjust threshold (0-0.5, default: 0.1)
**Interpretasi:**
- EQH = Liquidity di atas, kemungkinan sweep lalu dump
- EQL = Liquidity di bawah, kemungkinan sweep lalu pump
- Biasanya smart money akan grab liquidity sebelum move besar
**Trading Strategy:**
- Wait for EQH/EQL formation
- Anticipate liquidity grab
- Entry setelah sweep dengan konfirmasi (order block, FVG, CHoCH)
---
#### **4. Fair Value Gaps (FVG)**
**Setup:**
- ✅ Aktifkan "Fair Value Gaps"
- Pilih timeframe (default: chart timeframe)
- Enable/disable auto threshold
- Set extension bars
**Cara Trading:**
1. Bullish FVG = Support zone untuk buy
2. Bearish FVG = Resistance zone untuk sell
3. Price tends to fill FVG (retest)
4. Entry saat price kembali ke FVG
5. Partial fill = valid, full fill = invalidated
**Tips:**
- FVG + Order Block = High probability setup
- Multi-timeframe FVG lebih kuat
- Unfilled FVG = strong momentum
---
#### **5. Premium & Discount Zones**
**Setup:**
- ✅ Aktifkan "Premium/Discount Zones"
- Zones akan auto-update berdasarkan swing high/low
**Interpretasi:**
- 🟢 **Discount Zone** = Area BUY (price murah)
- ⚪ **Equilibrium** = Neutral (50%)
- 🔴 **Premium Zone** = Area SELL (price mahal)
**Trading Strategy:**
- BUY dari discount zone
- SELL dari premium zone
- Avoid trading di equilibrium
- Combine dengan structure confirmation
---
#### **6. Fibonacci Retracement**
**Setup:**
- Pilih Fib yang ingin ditampilkan:
- Equilibrium to Discount
- Equilibrium to Premium
- Discount to Premium
- Toggle show lines
- Enable reverse jika perlu
- Custom colors
**Key Levels:**
- 0.236 = Shallow retracement
- 0.382 = Common retracement
- 0.5 = 50% golden level
- 0.618 = Golden ratio (penting!)
- 0.786 = Deep retracement
**Cara Pakai:**
- 0.618-0.786 = Ideal entry zone dalam trend
- Combine dengan order blocks
- Wait for confirmation candle
---
#### **7. Volume Profile (VRVP)**
**Setup:**
- ✅ Aktifkan "Show Volume Profile"
- Set jumlah rows (10-100)
- Adjust width (5-50%)
- Pilih placement (Left/Right)
- Enable POC dan Value Area
**Interpretasi:**
- **POC (Point of Control)** = Harga dengan volume tertinggi = magnet
- **Value Area** = 70% volume = fair price range
- **Low Volume Nodes** = Weak support/resistance
- **High Volume Nodes** = Strong support/resistance
**Trading:**
- POC acts as support/resistance
- Price tends to return to POC
- Breakout dari Value Area = momentum
---
#### **8. RSI Multi-Timeframe**
**Setup:**
- ✅ Aktifkan "Show RSI Table"
- Set 3 timeframes (default: chart, 5m, 15m)
- Set RSI period (default: 14)
- Set Overbought level (default: 70)
- Set Oversold level (default: 30)
- Pilih posisi & ukuran table
**Interpretasi:**
- 🟢 **OS (Oversold)** = RSI ≤ 30 = Kondisi jenuh jual
- 🔴 **OB (Overbought)** = RSI ≥ 70 = Kondisi jenuh beli
- **-** = Neutral zone
**Trading Strategy:**
1. Multi-timeframe alignment = strong signal
2. OS + Bullish structure = BUY signal
3. OB + Bearish structure = SELL signal
4. Divergence RSI vs Price = reversal warning
**Contoh:**
- TF1: OS, TF2: OS, TF3: OS + Price di discount zone = STRONG BUY
---
#### **9. Moving Averages**
**Setup:**
- Pilih MA Type: EMA, SMA, atau WMA (berlaku untuk ketiga MA)
- Pilih Period Mode: Automatic atau Manual
- Set period untuk MA 1, 2, 3 (default: 20, 50, 100)
- Custom color & width per MA
- ✅ Enable Cross Alerts
**Interpretasi:**
- **Golden Cross** = MA fast cross above MA slow = Bullish
- **Death Cross** = MA fast cross below MA slow = Bearish
- Price above all MAs = Strong uptrend
- Price below all MAs = Strong downtrend
**Trading Strategy:**
1. MA1 (20) = Short-term trend
2. MA2 (50) = Medium-term trend
3. MA3 (100) = Long-term trend
**Entry Signals:**
- Price bounce dari MA dalam trend = continuation
- MA cross dengan konfirmasi structure = entry
- Multiple MA confluence = strong support/resistance
**Alerts Available:**
- MA1 cross MA2/MA3
- MA2 cross MA3
- Price cross any MA
---
#### **10. Multi-Timeframe Levels**
**Setup:**
- Enable HTF Level 1-5
- Set timeframes (contoh: 5m, 1H, 4H, D, W)
- Pilih line style (solid/dashed/dotted)
- Custom colors
**Cara Pakai:**
- Previous high/low dari HTF = strong S/R
- Breakout HTF level = significant move
- Multiple HTF levels confluence = major zone
---
### **C. Trading Setup Combination**
#### **Setup 1: High Probability Buy (Bullish)**
1. ✅ Swing structure: Bullish BOS
2. ✅ Price di Discount Zone
3. ✅ Pullback ke Bullish Order Block
4. ✅ Bullish FVG di bawah
5. ✅ RSI Multi-TF: Oversold
6. ✅ Price bounce dari MA
7. ✅ POC/Value Area support
8. ✅ Fibonacci 0.618-0.786 retracement
**Entry:** Saat price reject dari order block dengan confirmation candle
**Stop Loss:** Below order block
**Target:** Swing high atau premium zone
---
#### **Setup 2: High Probability Sell (Bearish)**
1. ✅ Swing structure: Bearish BOS
2. ✅ Price di Premium Zone
3. ✅ Pullback ke Bearish Order Block
4. ✅ Bearish FVG di atas
5. ✅ RSI Multi-TF: Overbought
6. ✅ Price reject dari MA
7. ✅ POC/Value Area resistance
8. ✅ Fibonacci 0.618-0.786 retracement
**Entry:** Saat price reject dari order block dengan confirmation candle
**Stop Loss:** Above order block
**Target:** Swing low atau discount zone
---
#### **Setup 3: Liquidity Grab (EQH/EQL)**
1. ✅ Identifikasi EQH atau EQL
2. ✅ Wait for liquidity sweep
3. ✅ Konfirmasi dengan CHoCH
4. ✅ Order block terbentuk setelah sweep
5. ✅ Entry saat retest order block
---
### **D. Tips & Best Practices**
**Risk Management:**
- Selalu gunakan stop loss
- Risk 1-2% per trade
- Risk:Reward minimum 1:2
- Jangan over-leverage
**Confluence adalah Kunci:**
- Minimal 3-4 konfirmasi sebelum entry
- Lebih banyak konfirmasi = higher probability
- Quality over quantity
**Timeframe Analysis:**
- HTF (Higher Timeframe) = Trend direction
- LTF (Lower Timeframe) = Entry timing
- Align dengan HTF trend
**Backtesting:**
- Gunakan mode "Historical"
- Test strategy di berbagai market condition
- Record dan analyze hasil
**Market Condition:**
- Trending market = Follow BOS, use order blocks
- Ranging market = Use premium/discount zones, EQH/EQL
- High volatility = Wider stops, wait for clear structure
**Avoid:**
- Trading di equilibrium zone
- Entry tanpa konfirmasi
- Fighting the trend
- Overleveraging
- Emotional trading
---
## 📈 Recommended Settings
### **For Scalping (1m - 5m):**
- Internal Structure: ON
- Swing Structure: OFF
- Order Blocks: Internal only
- RSI Timeframes: 1m, 5m, 15m
- MA Periods: 9, 21, 50
### **For Day Trading (15m - 1H):**
- Internal Structure: ON
- Swing Structure: ON
- Order Blocks: Both
- RSI Timeframes: 15m, 1H, 4H
- MA Periods: 20, 50, 100
### **For Swing Trading (4H - D):**
- Internal Structure: OFF
- Swing Structure: ON
- Order Blocks: Swing only
- RSI Timeframes: 4H, D, W
- MA Periods: 20, 50, 200
---
## ⚠️ Disclaimer
Indicator ini adalah alat bantu analisis teknikal. Tidak ada indicator yang 100% akurat. Selalu:
- Lakukan analisa fundamental
- Gunakan proper risk management
- Praktik di demo account terlebih dahulu
- Trading memiliki resiko, trade at your own risk
---
## 📝 Version Info
**Version:** 5.0
**Platform:** TradingView Pine Script v5
**Author:** XoRonX
**Max Labels:** 500
**Max Lines:** 500
**Max Boxes:** 500
---
## 🔄 Updates & Support
Untuk update, bug reports, atau pertanyaan:
- Check documentation regularly
- Test new features in replay mode
- Backup your settings before updates
---
## 🎓 Learning Resources
**Recommended Study:**
1. Smart Money Concepts (SMC) basics
2. Order blocks theory
3. Liquidity concepts
4. ICT (Inner Circle Trader) concepts
5. Volume profile analysis
6. Multi-timeframe analysis
**Practice:**
- Start with higher timeframes
- Master one concept at a time
- Keep a trading journal
- Review your trades weekly
---
**Happy Trading! 🚀📊**
_Remember: The best indicator is your own analysis and discipline._
