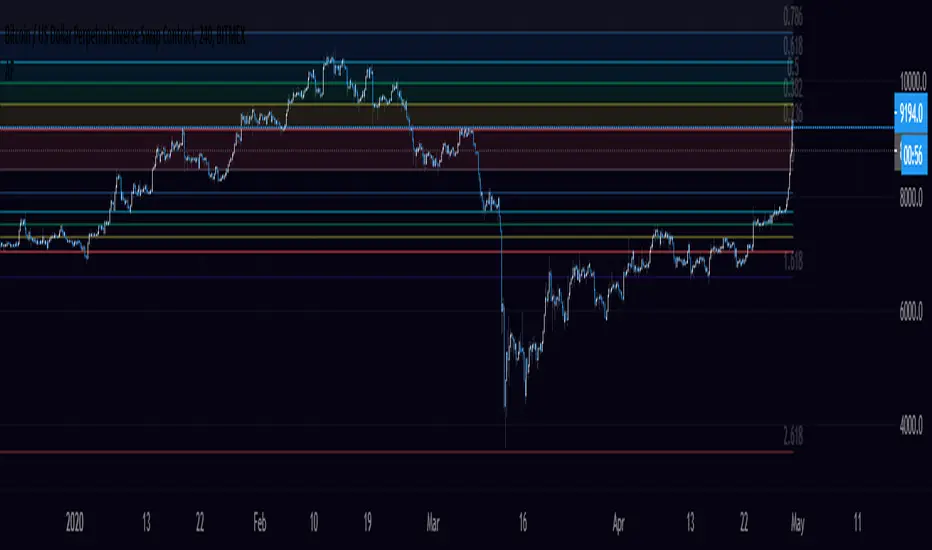
Fibonacci Extension / Retracement / Pivot Points by DGTFɪʙᴏɴᴀᴄᴄɪ Exᴛᴇɴᴛɪᴏɴ / Rᴇᴛʀᴀᴄᴍᴇɴᴛ / Pɪᴠᴏᴛ Pᴏɪɴᴛꜱ
This study combines various Fibonacci concepts into one, and some basic volume and volatility indications
█ Pɪᴠᴏᴛ Pᴏɪɴᴛꜱ — is a technical indicator that is used to determine the levels at which price may face support or resistance. The Pivot Points indicator consists of a pivot point (PP) level and several support (S) and resistance (R) levels. PP, resistance and support values are calculated in different ways, depending on the type of the indicator, this study implements Fibonacci Pivot Points
The indicator resolution is set by the input of the Pivot Points TF (Timeframe). If the Pivot Points TF is set to AUTO (the default value), then the increased resolution is determined by the following algorithm:
for intraday resolutions up to and including 5 min, 4HOURS (4H) is used
for intraday resolutions more than 5 min and up to and including 45 min, DAY (1D) is used
for intraday resolutions more than 45 min and up to and including 4 hour, WEEK (1W) is used
for daily resolutions MONTH is used (1M)
for weekly resolutions, 3-MONTH (3M) is used
for monthly resolutions, 12-MONTH (12M) is used
If the Pivot Points TF is set to User Defined, users may choose any higher timeframe of their preference
█ Fɪʙ Rᴇᴛʀᴀᴄᴇᴍᴇɴᴛ — Fibonacci retracements is a popular instrument used by technical analysts to determine support and resistance areas. In technical analysis, this tool is created by taking two extreme points (usually a peak and a trough) on the chart and dividing the vertical distance by the key Fibonacci coefficients equal to 23.6%, 38.2%, 50%, 61.8%, and 100%. This study implements an automated method of identifying the pivot lows/highs and automatically draws horizontal lines that are used to determine possible support and resistance levels
█ Fɪʙᴏɴᴀᴄᴄɪ Exᴛᴇɴꜱɪᴏɴꜱ — Fibonacci extensions are a tool that traders can use to establish profit targets or estimate how far a price may travel AFTER a retracement/pullback is finished. Extension levels are also possible areas where the price may reverse. This study implements an automated method of identifying the pivot lows/highs and automatically draws horizontal lines that are used to determine possible support and resistance levels.
IMPORTANT NOTE: Fibonacci extensions option may require to do further adjustment of the study parameters for proper usage. Extensions are aimed to be used when a trend is present and they aim to measure how far a price may travel AFTER a retracement/pullback. I will strongly suggest users of this study to check the education post for further details, where to use extensions and where to use retracements
Important input options for both Fibonacci Extensions and Retracements
Deviation, is a multiplier that affects how much the price should deviate from the previous pivot in order for the bar to become a new pivot. Increasing its value is one way to get higher timeframe Fib Retracement Levels
Depth, affects the minimum number of bars that will be taken into account when building
█ Volume / Volatility Add-Ons
High Volatile Bar Indication
Volume Spike Bar Indication
Volume Weighted Colored Bars
This study benefits from build-in auto fib retracement tv study and modifications applied to get extentions and also to fit this combo
Disclaimer:
Trading success is all about following your trading strategy and the indicators should fit within your trading strategy, and not to be traded upon solely
The script is for informational and educational purposes only. Use of the script does not constitute professional and/or financial advice. You alone have the sole responsibility of evaluating the script output and risks associated with the use of the script. In exchange for using the script, you agree not to hold dgtrd TradingView user liable for any possible claim for damages arising from any decision you make based on use of the script
Recherche dans les scripts pour "fib"

Fibonacci levels alerted as Support and Resistance lvlsThis script is another Fibonacci script however this script gives select signals indicating when a resistance level is hit aswell as a support level.
A resistance level is calculated by price action failing to close or open above a fib level yet its high crossing the level. This essentially means price action was too weak to break this level.
The same goes for support levels where the price open and closes above the fib level yet the price low was below. This means the bears where unable to break the support level and may potentially rebound.
This script uses the 0.764, 0.618, 0.5, 0.382 and 0.236 levels. More can be added to script if asked.
From personal use I use the script to help guide the entry and exit for potential trades aswell as helping mark price targets and exit levels. However i never use this script alone and actively ensure it is used alongside other technical indicators.
Within the script there is also a plotted Fibonacci retracement chart which can help visually aid the trader.

(Custom)Bollingers Bands Fibonacci ratiosThis is a modified Bollinger bands that uses EMA,with ATH to get a main average and then takes Standard Deviations by Fib ratios outwards. It is very useful for Entries and exits. I Typically use it to exit longs or shorts, entries are a bit harder. Generally the price will wick just barely or briefly into the end of one of the bands and then leave, it PINGs it and that is your exit. It is a little hard to predict in real time and set a Take profit at any exact point because it is always moving, but because it constantly adjust it is pretty damn accurate at nailing it. They sorta work at any timeframe, so its up to you, though for Crypto it doesnt do so well above 4hr because it can pump really hard or dump hard and super stretch the bands. Best numbers for the Average are Fib numbers. Stick to using 13, 21, and 34. 34 is my favorite and works best for me, But its up to you. Sometimes its benificial to use 34 on lower timeframes and maybe a smaller number on larger ones IE 21 or 2 or 4hr charts.
Once again it is up to you how to use it. I dont have credit for the original version of it. It is someone else's who I think modified another person's version lol. Ill try and find their name and post a comment though for who I took the original code from.

Padovan RetracementsAlternative to Fibonacci levels. There are actually many such ratios besides the golden ratio and the Fib sequence. This is based on the plastic ratio or the Padovan sequence.
If you wish to use the ratios in the fib tool, the following are the corresponding alternate values :
0.245
0.325
0.430
0.570
0.755
1.000
1.325
1.755
2.325
3.080
4.080

Auto FibonacciA series of Fibonacci sequences using a variety of triggers to base highs and lows off.
High and low look back length can be altered, fibs and fib extensions can be shown or hidden and the background can be filled or transparent.
VPTbollfib & Camarilla (Danarilla)I do not own the original indicators. This is just a combination of the two because of their nature to work in a similar way.
Camarilla Pivots run on the basis of intraday range trading. Usually after daily open you look the fade whatever move happened before. by shorting R3/H3 levels or longing R3/L3. Targeting the other side of the range. This is the infamous PivotBoss level calculations and you would want to activate camarilla and turn off the normal pivots. They use the previous days volatility to plot the next days levels.
But what about some confirmation?
Well RafaelIzoni (who made it open source for improvement) threw together this VPTbollfib. It is volume price trend crossing down a fib line using bollinger bands as price envelope. The beauty of this is that It will signal usually counter to current price action based on selling into uptrends or vise versa. Meaning you get signals to counter price. Which is what you might be looking for on range day trade scalps for camarilla. A wick reversal or engulfing + volume based signal is a very happy pairing together. And those signals are usually suitable for the target of the range you are day trading. Hourly time frame works quite well for both. And camarilla should also be on daily settings.
Special Thanks to Nanda (who published the pivotboss indicator AND) Helped to merge the scripts together.
This indicator alone is an entire trade system. Camarilla already is. If you know the rules. it can be used for entries, exits, risk management to trade the range on TREND, COUNTER TREND, and BREAKOUT plays. The bollinger band fibs add confirmation to the trends levels. And the VPT adds a secondary confirmation to take a camarilla trade.
Try it out. I think you will find both the levels on camarilla and the VPT signals quite suprising.

system yUsing The donchiam fib system and modification of linear regresion bands in which i put the central fib band insted of close
to create it.
we can detect sweet entry and exit points as marked by the arrow (blue =entry) red(exit(
if the cabdles above the bands it very bullish
bellow the bands -very bearish

Fibonacci RSI Ribbon (UO)All levels and RSIs are calculated using Fib numbers. RSI hitting a Fib level is more useful than just hitting 70 or 30

Rumpy's D/W AutofibsUses yesterday's & last week's high/low to plot auto fibs.
You can toggle them on/off separately as it does become a bit cluttered with both enabled.
--------------------------------------
If you find it useful please consider a tip/donation :
BTC - 3BMEXEDyWJ58eXUEALYPadbn1wwWKmf6sA
--------------------------------------
Weekly fibs
--------------------------------------
Daily fibs

The 6 Line Death PunchIf you are looking to discover what trend you are in, you need to first what direction the price is going in...
I've been using and testing a mixture of EMA's and SMA's for a long time and I've found that these ones are by far the best.
EMA 3
EMA 8
MA 20
EMA 55
MA 100
MA 200
EMA 3 & 8 Crossover is a good method for confirming a coin going to the upside or to the downside.
EMA 8 is known as the Trigger Line (trademarked brand) as one of the fib numbers it shows good support or resistance of a trend.
MA 20 universal way of seeing trend direction in the stock market, works well with crypto too.
EMA 55, another trusty fib number. Works very well and could trade off that alone as support and resistance.
MA 100 and MA 200. Long ranged moving averages which govern the overall longer-term trend.
LONG ENTRY
Option 1 - 3/8 crossover
Option 2 - Candles above EMA 8
Option 3 - Candles above MA 20
Option 4 - Candles Above EMA 55.
SHORT ENTRY
Option 1 - 3/8 crossover
Option 2 - Candles below EMA 8
Option 3 - Candles below MA 20
Option 4 - Candles below EMA 55.

Bollingers Bands Fibonacci ratios modifybased on the study of
I just make the fibs bollinger to look slight diffrent( i think in this way its more easy to see the fib bands )
so nothing special about it...

Logarithmic Fibonacci RetraceThis script will allow you to use Logarithmic (instead of linear) Fibonacci retrace.
Please see excellent write up here: www.elliottwavetrader.net
explaining why logarithmic is preferred, especially over large price movement and long timeframes.
All TradingView fib tools use linear math, and will show incorrect long-term levels because of this.
HOW TO USE:
* Enter your points for Wave 0 and 1. Example: 1810.10 and 2872.87 in the SPX chart shown.
* Turn on "show lines" and "show labels". These are OFF by default because the chart will usually get warped
if you display the lines before entering the actual values you want.
* Change the "label offset" if the fib labels are too close or too far from the chart.
Please be aware that this is considered an "INDICATOR" script and so will not save the values separately
for each chart. You will need to enter new values each time you change to a different symbol.

Logarithmic Fibonacci ExtensionThis script will allow you to use Logarithmic (instead of linear) Fibonacci extensions.
Please see excellent write up here: www.elliottwavetrader.net
explaining why logarithmic is preferred, especially over large price movement and long timeframes.
All TradingView fib tools use linear math, and will show incorrect long-term levels because of this.
HOW TO USE:
* Enter your points for Wave 0, 1, and 2. Example: 666.79, 1219.80, 1010.91 in the SPX chart shown.
* Turn on "show lines" and "show labels". These are OFF by default because the chart will usually get warped
if you display the lines before entering the actual values you want.
* Change the "label offset" if the fib labels are too close or too far from the chart.
* Select up to 2.000, 3.000, and 4.000 to display higher-power fibs.
Please be aware that this is considered an "INDICATOR" script and so will not save the values separately
for each chart. You will need to enter new values each time you change to a different symbol.

Fractals V9 ModifiedSo taking Ricardo Santos script for fractals V9 -I change the time function of the high TF fractal to non repainting one
adding daily fib levels
This hybrid seems to look nice . I have to admit that all credit to Ricardo Santos for his exelent script.
thi work it hybrid work and not so much original work....
The main improvment is the signals which are not reapinting as we remove security from that.
Security function exist for daily fib but it has nothing to do wih signal generation so i did not touch it

Hullfib-trailingso I add a trialing function based on volume pf the bars
this will ,ake the system more easy for the trader
1. Hull mean avreage with color changes (green -red that show the trend )
2. signal prouduce by Hull and bollinger fibs
3.signal prouduce by trailing volume bars (B , S)
4. upper and lower daily fibs
togetther you can make good combination when you bet on bitmex
have fun

RSX FracticalityA little project I was working on to avoid studying for finals. Using LazyBear's RSX code for a smoother RSI, then taking the RSX of fib number lengths. Take the average of that, then the JMA of that from the same fib numbers. The average of that is then treated as the trend, take the average of the trend values from the main time frames, the script calls pretty far back so adding a W or M TF I think would throw the calculations off. Then I smoothed that value using the jma's to create the overall trend. I got the idea from Ehler's Empirical Mode Decomposition about identifying peaks and valleys and creating an average of that to create a range. The idea is that if the trend is above the Average Peak then it is a bull trend, less than the average valley it's a bear trend, in between it's ranging. It looks like it turned out alright, I'll be working on this idea of fractals a lot this summer to see if I can improve it or build something better off of the idea.

Fibonacci Commodity Stenth IndexFibonacci Commodity Strength Value tells us about the strength and weakness of bull or bear market.
The main focus in this is too be done at reversal. It can also be used for identifying fake ups/downs.
If all the 4 lines moves upward after a huge up spike, then notice the values of all 4 values. If red fib is smaller than green fib then it is a fake trend. If its more then its uptrend and same for bear movement. ;)
It also represents cci (in terms of values) and rsi (in terms of waves).
Enjoy !!!!!

Automatic Daily Fibonacci v0.3 by JustUncleLThis update is a correction on the way the Fib Zero line is calculated. Previously it was just based on the source of the previous day, which is Ok as long as the Fiblength was set to 2. The new version calculates the Fib Zero from the average of the specified source over the Fiblength, so if Fiblength is now something other than 2 the Fibonacci Zero and other support and resistant levels should calculate correctly.

Everyday 0003 _ MAC Pullback I recently posted a Moving Averge Crossover strategy for my Everyday project - a project I've given myself where I try to create one strategy everyday in between 15 minutes and 2 hours.
In the comments of my last published idea, user SignalTradersUK was very kind and suggested I try the following in my next study:
"i think your next study should be, to workout what to do after the Moving Average cross! If you look just on the chart you have posted, Price would appear to always come back to the levels where the 2 MA's cross and then go back in the direction of the crossing of the MA's. It's a great pull back strategy."
I'm really just beginning to learn about coding strategies so I'm not 100% sure I correctly understood his suggestion.
I admit I had difficulties wrapping my head around how to do this.
Anyway, the result is a strategy which runs alongside the main Moving Average Crossover.
'The Algorithm'
When the fast and slow MA cross the strategy traces back 40 days to find a swing low.
This swing low and the price at the MA cross is used to calculate a fib 1.272 extension.
The price at this 1.272 extension is used to place a Pullback short order.
Since we're shorting a bull trend, a tight stop is used.
If the pullback reaches down to the fib 0.618 we take profit (close the short).
Like I said, I don't know if I correctly understood SignalTradersUK feedback, but I really appreciate the
feedback and advice!
As always I'm hoping to learn from the community, so all feedback, corrections and advice is very welcome!
Thanks!
/pbergden

Vegas TunnelThis indicator adds and subtracts fib levels from the moving average. I suppose profits are meant to be taken at certain levels. Additionally, it may help in finding tops and bottoms. There's more info here: www.forexstrategiesresources.com
The fib levels should be changed depending on time frame:
short) 5, 8, 13, 21
intermediate) 34, 55, 89, 144
long) 55, 89, 144, 233

Indicators: 6 RSI variationsAs we all know, as published by Wilder, RSI makes use of "CLOSE" values. You probably have experimented changing the input to hl2 or hlc3 . I have included many other RSI variations in this chart. Refer to the developers section below to learn how you can use this code in your scripts.
1) RSI with Volume
---------------------------------------------
Suggested by Morris, this idea adds volume to the RSI indicator. Because volume offers one means of determining whether money is entering or leaving a market, this would provide additional information with which to make trading decisions.
2) RSI using last Open
---------------------------------------------
This is RSI with yesterday's open, This basically compares two full days of price action and in the process produces a smoother RSI line.
RSI of today's close is used as a signal (blue line).
3) RSI using SMA
---------------------------------------------
Wilder used his own MA for calculating RSI (check my post on Wilders MA here - -- This closely resembles EMA). One of Morris's suggestion is to try out SMA.
Compared to normal RSI, you will see more squiggles here.
4) RSI using EMA
---------------------------------------------
Same idea as above, but using EMA.
5) RSI with Fibs
---------------------------------------------
How much does RSI retrace? This makes it easy to determine that :)
6) RSI of MACD
---------------------------------------------
As I mentioned earlier, RSI is a pluggable formula. You can substitute "close" with any data series to derive an index out of it.
This shows RSI of MACD. Note that this is range bound.
More info on RSI variations:
drive.google.com
For Pinescript developers:
---------------------------------------------
You can substitute your favorite indicator in the RSI function. I have made the RSI calculation a separate function in all the indicators above.
Following are the reusable functions (simply copy to your script and call with proper arguments):
* WiMA(src, length)
* calc_rsi(fv, length): This is equivalent to stock rsi() in TV.
* calc_rsi_volume(fv, length)
* calc_rsi_sma(fv, length)
* calc_rsi_ema(fv, length)
* calc_rsi_lastopen(fv, length)
* calc_macd(src, fast, slow)
You can also pick up fibs drawing code and put in on any indicator.

ICT Liquidity & OTE Engine - Real TimeICT Liquidity & OTE Engine - Real Time
This indicator is a comprehensive toolkit designed for traders utilizing Inner Circle Trader (ICT) concepts. It automates the identification of key structural liquidity pools (Buy Side & Sell Side Liquidity) and calculates real-time Optimal Trade Entry (OTE) levels, allowing you to react instantly to market structure shifts and liquidity sweeps.
Core Features
1. Dynamic Liquidity Pools (BSL / SSL) The script uses pivot high and low logic to identify significant swing points where stop losses and breakout orders typically reside.
BSL (Buy Side Liquidity): Green lines extending from Pivot Highs. These represent areas where short sellers have stops (buy stops).
SSL (Sell Side Liquidity): Red lines extending from Pivot Lows. These represent areas where long traders have stops (sell stops).
2. Real-Time "Sweep" Detection Unlike static support/resistance indicators, this script reacts to live price action.
Visual Feedback: When price "sweeps" or purges a liquidity level (breaks a BSL or SSL line), the line style automatically changes from solid to dotted and becomes semi-transparent.
Why this matters: This provides immediate visual confirmation that a "Stop Hunt" has occurred, often a precursor to a Smart Money reversal.
3. Optimal Trade Entry (OTE) 70.5% The indicator continuously tracks the highest high and lowest low over a definable lookback period (default 40 bars) to establish the current dealing range.
It plots the 70.5% Fibonacci retracement level, which is the classic ICT "Sweet Spot" for entries during a retracement.
This removes the need to manually draw and redraw Fib tools every time the range expands.
4. Bullish Fair Value Gap (FVG) Markers The script highlights specific bars that exhibit bullish displacement gaps, aiding in the identification of strong buying pressure or potential entries after a liquidity sweep.
How It Works
Pivots: It calculates pivots based on your user-defined Lookback input (default 20). A higher number finds longer-term swings; a lower number finds short-term scalping levels.
Liquidity Logic: Once a pivot is confirmed, a line is projected forward. If the current live High or Low breaches this line, the script detects the liquidity run and alters the line's appearance.
OTE Logic: (Highest High - Lowest Low) * 0.705. This dynamic calculation ensures the OTE level moves with the market structure in real-time.
How to Use
Identify the Sweep: Wait for price to run a SSL (Red Line) or BSL (Green Line). Watch for the line to turn dotted, indicating the liquidity has been taken.
Wait for Displacement: Look for a reaction away from the sweep (e.g., a sharp move up after taking SSL).
Find the Entry: Look for price to retrace to the plotted OTE 70.5% Line, ideally aligning with a marked FVG square, to position yourself in alignment with Smart Money.
Settings
Pivot Lookback: Adjusts the sensitivity of the liquidity lines (Default: 20).
Show BSL/SSL Lines: Toggles the liquidity pools on/off.
Show OTE Levels: Toggles the real-time Fibonacci level.
OTE Line Color: Customize the visual style of your entry level.

ICT Professional OB HunterICT Professional OB Hunter
A professional-grade Order Block mapping tool designed for traders following Smart Money Concepts to track institutional order flow and significant market structures.
This tool identifies validated Order Blocks with Break of Structure confirmation, filtering out market noise and focusing only on high-probability levels where institutional participation is evident.
How It Works
The script operates without repainting, using historical swing highs and lows as reference points rather than future data. Three core criteria must be satisfied before an Order Block is drawn:
Strong Candle Formation: The candle must have a significant body (no dojis), exceeding the ATR threshold—indicating genuine institutional participation rather than indecision.
Displacement: Following the Order Block candle, price must move with momentum exceeding 1.5x the ATR. This captures true "market shifting" moves while ignoring slow, low-volume price action.
Break of Structure: Price must definitively break the previous swing high or low to confirm momentum before the Order Block is validated and drawn.
What You See on the Chart
Thick Blue Lines: Bullish Order Blocks representing demand zones where price historically finds support and reacts upward.
Thick Orange Lines: Bearish Order Blocks representing supply zones that act as resistance.
Yellow Boxes: OTE (Optimal Trade Entry) zones between the 50% and 61.8% retracement levels of the Order Block—ICT's preferred fib confluence area for precision entries.
Dashed Lines: Breaker Blocks indicating former Order Blocks that have been violated by price and now act as reverse levels or "mitigated" areas.
Key Differences from Standard Tools
Most available Order Block indicators mark every red or green candle indiscriminately, creating excessive noise and poor trading opportunities. This code implements a displacement filter to capture only structures formed after significant, volume-backed institutional moves. It contains no future reference or repainting logic—all decisions finalize strictly on bar close based on confirmed historical data.
Settings
Displacement Lookback (2-5 bars): Determines how many subsequent bars to analyze for momentum confirmation after the initial Order Block candle. Three bars provides the optimal balance between responsiveness and confirmation.
ATR Multiplier (0.5+): Sets the sensitivity for displacement detection. A value of 1.5 works well for Gold (XAU/USD). Lower values generate more Order Blocks but decrease quality and reliability.
Mitigation Zones: Toggle the display of OTE (Optimal Trade Entry) boxes on or off.
Usage Recommendations
This indicator is not a standalone buy/sell signal generator—it marks zones where institutional capital is likely positioned.
Recommended approach:
Apply to 15-minute or 1-hour charts, particularly during the New York session (14:30-17:00 EST) when institutional volume peaks.
Wait for price to reach the confluence of the Blue Line and Yellow OTE box.
The setup invalidates if price closes below the OTE zone boundary.
When Orange lines transition to dashed (Breaker Block), recognize that former support has become resistance; adjust position management accordingly.
Risk Warning
This is a statistical model based on historical price behavior, not a "holy grail" solution. Market conditions change, particularly during high-volatility macroeconomic news events (FOMC, CPI, NFP), where Order Blocks may fail. Always employ stop-loss protection and integrate this tool as one component of a comprehensive risk management strategy rather than relying on it exclusively.
Written in Pine Script v6 utilizing array structures for efficient real-time line updates and optimized for performance even on older hardware configurations.
Developer Note: Historical backtest analysis indicates that BOS-validated Order Blocks, particularly in Gold (XAU/USD) and major indices, demonstrate improved win rates when combined with disciplined entry criteria and proper risk management. However, the market retains ultimate authority—respect price action above all indicators.
