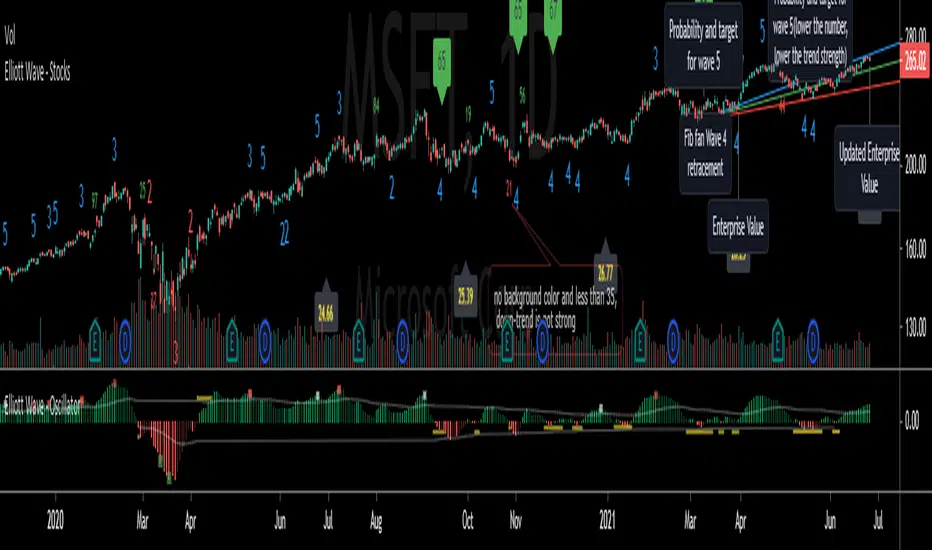
Elliott Wave - StocksElliott Wave, indicating possible waves 2, 3, 4 and 5
Based on my Elliott Wave - Oscillator, this signals are converted into numbers displayed on chart:
Waves2, Waves3, Waves4, Waves5:
- Indicated on Chart with numbers
Fib fan Wave 4 retracement
- Blue, green and red lines for optimum retracement
Probability and target for wave 5
- Plotted when wave 4 is found
- Stays visible in chart
- Target is based on Monthly Fibonnacci
- Probability: If current trend volume is bigger than previous opposite wave trend volume, probability is painted with color of trend background(for a trend to continue, value is recommended bigger than 35)
Projection Wave 4 (if wave 3 detected) and Projection Wave 5(if wave 4 detected)
- Only displayed when waves are active, else not displayed and not saved on chart
- For upside trend 2 blue target lines are displayed based on Monthly Fibonnacci
- For downside trend 2 red target lines are displayed based on Monthly Fibonnacci
Fundamentals: Enterprise Value
- Displayed when financial reports are updated to database
- Also displayed the latest calculated enterprise value with current stock price and last financial report
REMINDER OF OSCILATOR USE:
Waves3: Indicated in RED Line(Upwards) and Green Line(Downwards)
- Detects wave greater than SMA
Waves4: Maximum height indicated in yellow Line
- Detects when wave greater than SMA (Wave 3 or 5) approaches wave 4 regression point
Waves5: Indicated in White Line
- Detects divergence in oscilator and price, meaning end of trend
Appreciate any suggestions, collaboration, comments or ideas.
Detects Waves 2, 3 , 4 and 5
Fib fan Wave 4 retracement
Probability and target for wave 5
Projection Wave 4 (if wave 3 detected)
Projection Wave 5(if wave 4 detected)
Alerts for Waves 2, 3, 4 and 5
Fundamentals: Enterprise Value
Better and accurate targets for waves based on Stocks
Recherche dans les scripts pour "fib"
TestedFX Pitchfork Intersections v1.4TestedFX Sexy Pitchfork Intersection Strategy Trading Rules:
All trades are 4R !! If you don’t understand this, please DO NOT TRADE until you have researched Risk to Reward ratios. Basically 4R means you win 4x your risk. Ie. SL = 25 pips and TP is 100 pips so you win 4x your risk.
AUTHOR’S NOTE: Statistically Pitchforks reach the median line 80% of the time. Yet they are the most overlooked and underused tool used by traders. Of course you will NOT get an 80% win rate with this strategy because we can never know for sure if price will bounce on a line or bust through.
WARNING: TRADE ON 4 HOUR OR HIGHER TIMEFRAME. Less than expert level traders should trade on 4 hour or higher time frames. Getting in and out of a trade will likely cost you 2 to 3 pips with spread and commission. This strategy produces precision entries which sounds good BUT on smaller time frames this will affect your average R significantly and eat up much of your profits. For example on a 15 min timeframe this strategy will often give you 6 or 7 pip SL. When you add 2 or 3 pips your Risk to Reward ratio will often be 3R instead of 4R. Our long term backtests show an average win of 1.3R when losses are factored in. So on a 15 min time frame you would only be left with 0.3R average win which is ok but not optimal. Inexperienced traders to this strategy will likely make mistakes which will eat up the rest of the profits. So please all new traders keep to the 4H or higher time frames and backtest a lot before you start trading.
1) Trade with the Pitchfork ONLY.
At least one line must be pushing in the direction of the trade. Breakouts tend to occur when multiple lines are facing the same direction.
2) Sexy Line Touch: Enter the trade when the sexy line is touched just outside a fib zone. A sexy line is a line just outside the fib rejection zone or outer line of a pitchfork. Price loves to reach out and touch or almost touch it before reversing which is your key to precision entries.
a) 3+ LINES: Only trade with 3+ confirmation lines.
b) EMPTY SPACE: Trade the outermost line. There should be no more sexy lines to touch nearby.
3) NO MESS
Don't trade when there are so many lines you can't see what is going on. The cost to not trade is exactly $0. So skip areas where trend direction is not clear and pitchforks are going in too many conflicting directions.
4) Set TP just past the next level.
5) Set SL at 4R.
Recommendations:
1) Once you lose on a pitchfork move on to the next pitchfork. In choppy markets I also apply this rule to wins since a long term trend is unlikely.
2) Search for trades using Andrew's Pitchforks in a trend. In consolidation search for trades using Modified-Schiff Pitchforks. Confirm trades by turning on both pitchforks momentarily to find sexy line touches.
3) Backtest, Backtest, Backtest !! This strategy isn’t for traders who want clear easy entries. Often multiple pitchforks give conflicting or overlapping signals. Practice to know when the market is too complex and you need to “Skip the Mess” takes practice. Also knowing how much "Empty Space" is enough takes practice too.

MA Strategy Emperor insiliconotThe Script offers 9 different EMAs with 14 different MA types.
The make use of the script is to find the entry on the 1-4 hour altcoins while using the in-built 13/21 crossover strategy to be used in sync with Heikin Ashi cross-over with Fib levels of 0.236 Fib level.
How to use it.
Entry is to be made when the
1. Cross over gives a P(Positive Sign) and the candle completely closes above the cross-over
2. When the Heikin Ashi turns green and the next green HA candle goes above the previous green HA candle.
3. The price should be at-least above the 0.236 Level from the Swing high.
All the Best.
EmperorBTC

Fibonacci Extension / Retracement / Pivot Points by DGTFɪʙᴏɴᴀᴄᴄɪ Exᴛᴇɴᴛɪᴏɴ / Rᴇᴛʀᴀᴄᴍᴇɴᴛ / Pɪᴠᴏᴛ Pᴏɪɴᴛꜱ
This study combines various Fibonacci concepts into one, and some basic volume and volatility indications
█ Pɪᴠᴏᴛ Pᴏɪɴᴛꜱ — is a technical indicator that is used to determine the levels at which price may face support or resistance. The Pivot Points indicator consists of a pivot point (PP) level and several support (S) and resistance (R) levels. PP, resistance and support values are calculated in different ways, depending on the type of the indicator, this study implements Fibonacci Pivot Points
The indicator resolution is set by the input of the Pivot Points TF (Timeframe). If the Pivot Points TF is set to AUTO (the default value), then the increased resolution is determined by the following algorithm:
for intraday resolutions up to and including 5 min, 4HOURS (4H) is used
for intraday resolutions more than 5 min and up to and including 45 min, DAY (1D) is used
for intraday resolutions more than 45 min and up to and including 4 hour, WEEK (1W) is used
for daily resolutions MONTH is used (1M)
for weekly resolutions, 3-MONTH (3M) is used
for monthly resolutions, 12-MONTH (12M) is used
If the Pivot Points TF is set to User Defined, users may choose any higher timeframe of their preference
█ Fɪʙ Rᴇᴛʀᴀᴄᴇᴍᴇɴᴛ — Fibonacci retracements is a popular instrument used by technical analysts to determine support and resistance areas. In technical analysis, this tool is created by taking two extreme points (usually a peak and a trough) on the chart and dividing the vertical distance by the key Fibonacci coefficients equal to 23.6%, 38.2%, 50%, 61.8%, and 100%. This study implements an automated method of identifying the pivot lows/highs and automatically draws horizontal lines that are used to determine possible support and resistance levels
█ Fɪʙᴏɴᴀᴄᴄɪ Exᴛᴇɴꜱɪᴏɴꜱ — Fibonacci extensions are a tool that traders can use to establish profit targets or estimate how far a price may travel AFTER a retracement/pullback is finished. Extension levels are also possible areas where the price may reverse. This study implements an automated method of identifying the pivot lows/highs and automatically draws horizontal lines that are used to determine possible support and resistance levels.
IMPORTANT NOTE: Fibonacci extensions option may require to do further adjustment of the study parameters for proper usage. Extensions are aimed to be used when a trend is present and they aim to measure how far a price may travel AFTER a retracement/pullback. I will strongly suggest users of this study to check the education post for further details, where to use extensions and where to use retracements
Important input options for both Fibonacci Extensions and Retracements
Deviation, is a multiplier that affects how much the price should deviate from the previous pivot in order for the bar to become a new pivot. Increasing its value is one way to get higher timeframe Fib Retracement Levels
Depth, affects the minimum number of bars that will be taken into account when building
█ Volume / Volatility Add-Ons
High Volatile Bar Indication
Volume Spike Bar Indication
Volume Weighted Colored Bars
This study benefits from build-in auto fib retracement tv study and modifications applied to get extentions and also to fit this combo
Disclaimer:
Trading success is all about following your trading strategy and the indicators should fit within your trading strategy, and not to be traded upon solely
The script is for informational and educational purposes only. Use of the script does not constitute professional and/or financial advice. You alone have the sole responsibility of evaluating the script output and risks associated with the use of the script. In exchange for using the script, you agree not to hold dgtrd TradingView user liable for any possible claim for damages arising from any decision you make based on use of the script

Fibonacci levels alerted as Support and Resistance lvlsThis script is another Fibonacci script however this script gives select signals indicating when a resistance level is hit aswell as a support level.
A resistance level is calculated by price action failing to close or open above a fib level yet its high crossing the level. This essentially means price action was too weak to break this level.
The same goes for support levels where the price open and closes above the fib level yet the price low was below. This means the bears where unable to break the support level and may potentially rebound.
This script uses the 0.764, 0.618, 0.5, 0.382 and 0.236 levels. More can be added to script if asked.
From personal use I use the script to help guide the entry and exit for potential trades aswell as helping mark price targets and exit levels. However i never use this script alone and actively ensure it is used alongside other technical indicators.
Within the script there is also a plotted Fibonacci retracement chart which can help visually aid the trader.

(Custom)Bollingers Bands Fibonacci ratiosThis is a modified Bollinger bands that uses EMA,with ATH to get a main average and then takes Standard Deviations by Fib ratios outwards. It is very useful for Entries and exits. I Typically use it to exit longs or shorts, entries are a bit harder. Generally the price will wick just barely or briefly into the end of one of the bands and then leave, it PINGs it and that is your exit. It is a little hard to predict in real time and set a Take profit at any exact point because it is always moving, but because it constantly adjust it is pretty damn accurate at nailing it. They sorta work at any timeframe, so its up to you, though for Crypto it doesnt do so well above 4hr because it can pump really hard or dump hard and super stretch the bands. Best numbers for the Average are Fib numbers. Stick to using 13, 21, and 34. 34 is my favorite and works best for me, But its up to you. Sometimes its benificial to use 34 on lower timeframes and maybe a smaller number on larger ones IE 21 or 2 or 4hr charts.
Once again it is up to you how to use it. I dont have credit for the original version of it. It is someone else's who I think modified another person's version lol. Ill try and find their name and post a comment though for who I took the original code from.

CvZone1388This is the true convection zones of the fib. The green and red show the retracement trend
-This fib doesn't have golden zone 61 nor the 38... we are looking for higher magnet areas in the market tp 1 50 tp 2 your 23 or 78
all credit to first script fib convection zone88

The CryptoPlayground FrameworkThe CryptoPlayground Framework & Built-in Strategy Analysis
CryptoPlayground’s Framework provides the community an “executive assistant” that teaches traders how to trade The CryptoPlayground Framework ‘LIVE’. Producing a structured approach with a built in Strategy where traders to learn the method as the trade pans out.
Cryptoplayground’s Framework pays close attentions to fundamental as well as technical analysis . In this publication we will be breaking down the simplicity of what makes the framework “tick”.
Traders take notice how the price moves between the double blue sets of lines marked #cpf, these are some of the most important aspects of the CryptoPlayground Framework. Let’s jump in and explain.. The built-in Fibonacci Retraction add+ tool is the method we use to frame up our technical analysis . Helping CryptoPlayground traders define support and resistance levels of extreme relevance and more importantly defining #cpf Optimal Trade Entries. Traders trading from these blue lines produce high probability low risk trade ideas and opportunities.
How it’s done: Drawn using (plot) the high and low of a particular time-frame (depicted by your chart settings, or set using custom time settings in the indicator settings itself). These high and low points have many names and can be defined in many ways. as basic as it comes these are knows as pivot points . Using these points, Cryptoplayground Framework draws levels respecting Fibonacci ratios. Reminder that CryptoPlayground is a framework to structure trades, these levels are supposed to change. Using a time series to do so allows traders to define their style of trading, whether intra, daily or swing.
When the CryptoPlayground Framework is “about to change” we call this a liquidity event and most commonly in crypto it’s some sort of purge in the direction that traders are willing to buy up to or sell to.
🤖 Technicals in the code:
// Fibonacci Retraction
Length(x)
Source( close)
Out = fib retract
High(close, x)
Low(close, x)
plot(…
Plotshape (fib = high - low within time series multiples by ratio)
Alert condition(
crossunder(close, x)…. ; candle close below x indicating our liquidity event)
Plot ( purge
Plotshape (purge
CryptoPlayground Framework traders have the added improvement of RSI add+ , as a further confirmation, defining whether bulls are in control, bears are in control or when defining overbought or oversold thresholds. Represented by the larger blue and grey dotted channel, traders are able to use this visual tool and add it to their analysis.
🤖 Technicals in the code:
//RSI+
Based on in-build RSI , where RSI is (rsiSource, rsilength)
RSI = close
Legth = x
Condition = x
Condition = x
plot ( plot as size 2 dotted lines on the chart )
CryptoPlaygound “Helper Tool” is an Exponential Moving Average function to determine bullish and bearish conditions, we are able to remain emotionless through the trade. As well as, when to book profit and the sign of a possible reversal. Backtested for optimal crypto conditions, the degree of weighted decrease provides observations faster for a volatile market. CryptoFramework makes these calculations available on all time frames or customisable for the style of trader. CryptoPlayground used a time settings (constant) that makes traders pay themselves first.
🤖 Technicals in the code:
// bullish . bearish
Length = ( x )
Source( close )
Out = ( ema )
High ( close, x )
Low ( close, x )
Last = ( high , x )
Last = ( low , x )
Bearish = cross ( close , x )
Bullish = cross ( close , x )
Plotshape ( bullish , style
Plotshape ( bearish , style
// Long.short exit
Ema = x
SMA = x
EMA ( close, x )
SMA ( close , x )
RSI (close , x )
Using the CryptoPlayground Framework, the description below will describe, How to trade a “Fake Out - Purge Event“, also known as “Purge and Revert”
Set alert: Purge Event (This way you will get notified, this type of trade can be ruined with emotions and therefor it is best traded with structure)
Purge Events indicate one of 3 things, a breakout/liquidity run or raid, a reach for liquidity or a possible fake-out. Purge Events are represented by the label “Purge”.
In this example, CryptoPlayground Framework has structured a trade example during a “Fakeout - Purge Event” to the sell side.
Further visual description provided.
On chart elaboration and description on how to trade
1. Set Alert Condition - Liquidity Purge Alert
(using TradingView alert settings)
2. Set entry at #cpf Entry 1 :
This is a level 2 entry.
Scaling down chart time-frame will create a further "Optimal Trade Entry
".
3. Pay yourself, book profit, move your stop loss up or to break even.
The trade is now risk free and you’ve made a successful trade.
The rest is just added bonus.
4. Opportunity to consider re-enter, add partials previously taken signified by bullish Label and Rejection of Fibonacci ratios.
5. Trade is complete, you paid yourself, lowered risk, added more into a trade and entered hopefully using a limit order :)
Blue horizontal lines marked #cpf are your long and short optimal trade entry location, where trading from these regions carry less risk. These blue lines are what the Cryptoplayground Framework refers to as Optimal Trade Entries.
In the opposition's corner we have a mirrored x2 blue horizontal lines marked #cpf these are your targets. Traders are made aware of a "liquidity Event" at these levels when bulls or bears are in control.
White "time to book profit" labels are there to remind traders to pay themselves first. Having Entered from #cpf a CryptoPlayground Trader would at this point take profit and move stop loss into profit or break even. Using this method further reduces downside and removes the risk from your original entry position. Leaving the CryptoPlayground Framework Trader with a "Risk Free Trade".
White "exit trade" indicates extreme limits of oversold and overbought conditions where it is likely that a reversal will take place as buyers or sellers increase in the respected direction.
Grey horizontal dotted lines indicate levels at which price action is likely to respect. In that regard, price action will make moves from these levels and to these levels.
If you have any questions please reach out, the script is invite-only.
If you wish to have access please reach out.
Hope you enjoy, please comment or message! 🙏

AustinJames: Yume Wave 2.0This is the all-access version of the Yume Wave 2.0
The wave uses the bottom, top, and mid line as resistance points. The upper limit is the resistance, the lower limit is support - and the middle line is the support when wave is above it, and resistance when wave is below it.
Check against trend lines to find the best buy/sell point based on the wave. The timeframe you select with the trendline should match the yume wave.
-----------
This is a upgraded version of the wave with modified parameters for a higher success rate. 3 New Lengths and 75 more lines of code added to the overall algorithm. Also included are 2 sublevel signals based on the Fib MA and pattern trading.
The Wave:
+ The Yume is the Fast length
+ The Akume is the Slow length
+ The Miaku is a median weighted length
+ The Upper Limit is an overbought asset indication
+ The Lower Limit is an oversold asset indication
+ The Wave is the spread between Yume and Miaku
Bullish Indications:
+ The Yume is above the Akume
+ The Yume is above the Miaku
+ The Yume is below the Lower Limit
Bearish Indications:
+ The Yume is below the Akume
+ The Yume is below the Miaku
+ The Yume is above the Upper Limit
Signal Strength Weights:
+ 50 = Yume Wave crossed a Limit Line
+ 100 = Yume Wave crossed a Limit Line + Close to a Fib Moving Average
+ 100 = Edge's Market Bottom/Top Algorithm is marked 'True'
Setting up Signals (Based on a 100 Signal Height):
+ Set the "Bull Signal" to be at 50 or 100
+ Set the "Bear Signal" to be at 50 or 100
+ 50 is Agressive, 100 is Conservative.
+ Bull/Bear are separate so you can play conservative bull with aggressive bear.

Padovan RetracementsAlternative to Fibonacci levels. There are actually many such ratios besides the golden ratio and the Fib sequence. This is based on the plastic ratio or the Padovan sequence.
If you wish to use the ratios in the fib tool, the following are the corresponding alternate values :
0.245
0.325
0.430
0.570
0.755
1.000
1.325
1.755
2.325
3.080
4.080

Oracle v2.0 [Market Vision]This algorithm uses Fibonacci Cycles to identify high probability reversal zones. It works on Crypto, Forex and Stocks. All timeframes are supported.
It contains several modes, such as "Equinox", "Regular", "Scalp" and "Fib". Use these modes to adjust the script to your favourite asset and timeframe.
This is a premium algorithm , that can be rented on a monthly basis.
PM if you are interested.
-Hawk
Some additional pictures:
15 minute 'Fib'
1 hour 'Equinox'

PT RSx RSIVersion 1.0 of our RSx RSI indicator was developed initially as a scalper. It helps determine a possible top/bottom for a specified time frame. The indicator is a modified version of the original RSI . We added a second line to help give you a visual on a bull/bear cross.
Bull crosses at the bottom of the range indicate that the current trend is trying to reverse & vice versa.
We also added a series of Fibonacci levels that act as pivotal areas. We have two highlighted areas that offer volatility . Our Red zone (upper fibs) should prompt you to look for short entries & our Grey zone (mid fibs), which acts as a neutral/range area.
This Oscillator was built around our buy sell indicator & it is used on all time frames for swinging & scalping. It is included as part of the library. Just message us for access!

PT MSTx StochasticVersion 1.0 of our MSTx Stochastic indicator helps determine when a trend is strong vs. exhausted. The indicator is a modified version of the original stochastic. We added a second line for further confluence, which acts as support & resistance. The added smoothing toggle of the indicator can help you get a different perspective of the move. We also added a series of Fibonacci levels that act as pivotal areas. We have two highlighted areas that offer volatility. Our Red zone (upper fibs) should prompt you to look for short entries & our Grey zone (mid fibs), which acts as a neutral/range area.
Main line – Faster settings that move through support/resistance quicker.
Signal line- Slower settings that tend to act as support/resistance for our main line.
Strategy:
Shorting- Look for the Main line to cross down into the Signal line & then retest the Signal line. Stronger signal if algo is active (Maroon).
Longing – Look for the Main line to cross up into the Signal line & then retest the Signal line. Stronger signal if algo is active (Green).
This Oscillator was built around our buy sell indicator & it is used on all time frames for swinging & scalping. It is included as part of the library. Just message us for access!

ORBBased on Based on ORB: Opening Range Breakout Strategy (Trading Made Simple Series)
By default, it plots the high and low of the first 15 minutes of market open. It then plots 2 fib extensions above the high and 2 fib extensions below the low for possible price targets.
For use in stocks.
Send me a private message on TV to gain access.

Market Reader Trend Following systemThis indicator combine:
1) fast moving average cloud (lime:red)
2)slow moving average cloud (blue:orange)
2) Impulsive candle (long=lime, short=red) that check at least 10 conditions to be plotted
The aim is to catch trend move during significant retracement (trend following).
// LONG TRADE//
1- Both cloud should be in the same direction (green/blue)
2- You have to wait to the price coming inside one of the 2 cloud
3- if a green candle appears you can long at the break out of its high with SL on its low
4-target are 50% retracement and 100% fibs extension
// SHORT TRADE//
1- Both cloud should be in the same direction (red/orange)
2- You have to wait to the price coming inside one of the 2 cloud
3- if a red candle appears you can shortat the break out of its low with SL on its high
4-target are 50% retracement and 100% fibs extension
this is an invite-only scripts. Send me a private message to gain access.

Auto FibonacciA series of Fibonacci sequences using a variety of triggers to base highs and lows off.
High and low look back length can be altered, fibs and fib extensions can be shown or hidden and the background can be filled or transparent.
VPTbollfib & Camarilla (Danarilla)I do not own the original indicators. This is just a combination of the two because of their nature to work in a similar way.
Camarilla Pivots run on the basis of intraday range trading. Usually after daily open you look the fade whatever move happened before. by shorting R3/H3 levels or longing R3/L3. Targeting the other side of the range. This is the infamous PivotBoss level calculations and you would want to activate camarilla and turn off the normal pivots. They use the previous days volatility to plot the next days levels.
But what about some confirmation?
Well RafaelIzoni (who made it open source for improvement) threw together this VPTbollfib. It is volume price trend crossing down a fib line using bollinger bands as price envelope. The beauty of this is that It will signal usually counter to current price action based on selling into uptrends or vise versa. Meaning you get signals to counter price. Which is what you might be looking for on range day trade scalps for camarilla. A wick reversal or engulfing + volume based signal is a very happy pairing together. And those signals are usually suitable for the target of the range you are day trading. Hourly time frame works quite well for both. And camarilla should also be on daily settings.
Special Thanks to Nanda (who published the pivotboss indicator AND) Helped to merge the scripts together.
This indicator alone is an entire trade system. Camarilla already is. If you know the rules. it can be used for entries, exits, risk management to trade the range on TREND, COUNTER TREND, and BREAKOUT plays. The bollinger band fibs add confirmation to the trends levels. And the VPT adds a secondary confirmation to take a camarilla trade.
Try it out. I think you will find both the levels on camarilla and the VPT signals quite suprising.

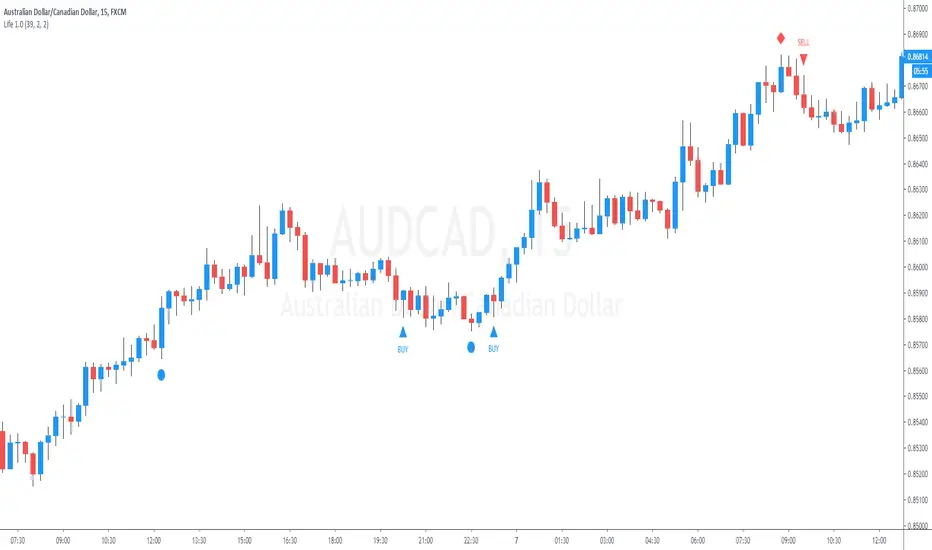
25 Life Bank BreakOutThis indicator allows the user to visually identify a swing High/Low and place a marker which will measure 2 candles either side of the swing point for the lowest body.
Once identified apply a 50% Fib to the body to ID a break out point and allow an alert to be placed.
Subsequently measures a 25% fib retracement of the breakout for a potential entry point. Alerts may also be created.
This does not provide trading signals nor is designed to do so.
It is not a trading strategy.
system yUsing The donchiam fib system and modification of linear regresion bands in which i put the central fib band insted of close
to create it.
we can detect sweet entry and exit points as marked by the arrow (blue =entry) red(exit(
if the cabdles above the bands it very bullish
bellow the bands -very bearish

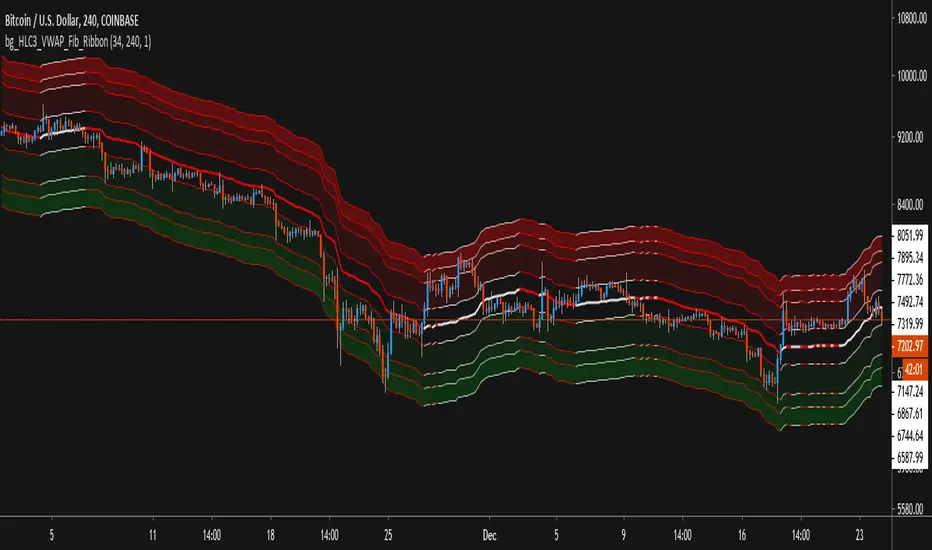
HLC3_VWAP_Fib_RibbonThis Script use Volume Weighted Average Price (VWAP) combined with Fibonacci Deviations of that value as Ribbons to show Support and Resistance levels, as well as estimate good Buy and Sell areas based on the extremity of distance from the central VWAP.
Features:
- Alerts exist for price crossover / crossunder the VWAP value, as well as any of the Fib Ribbon levels.
- Ribbons & Fills can be toggled on/off, leaving just the VWAP as a single line if desired.
- Using the Amplification setting, you can expand or contract the ribbons while maintaining the Fib Ratio, to fit different time-frames and volatility.
- Time-Frame and Length of VWAP can be changed while staying on the same Time-Frame chart view.
500 EMA based FBB + EMAx4 + LSMAx2i just don't like having to draw fib lines so configured fib bollinger bands using the 500 EMA as it's basis

Fibonacci RSI Ribbon (UO)All levels and RSIs are calculated using Fib numbers. RSI hitting a Fib level is more useful than just hitting 70 or 30

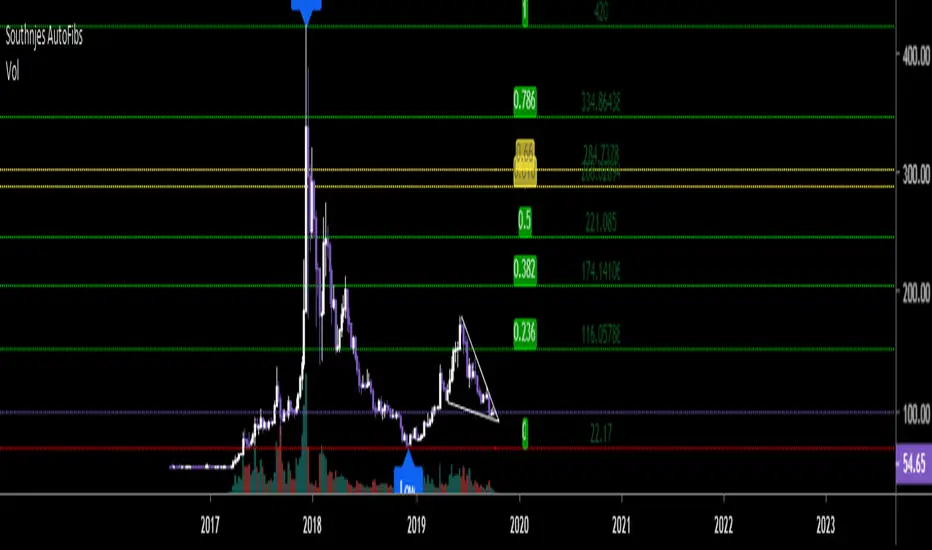
Southnjes - Auto Fibonacci LevelsI obtained this script elsewhere and modified it. Original Script by "borserman". Thank you for this.
I added some extras that he did not have, hence the uploaded and modified version.
I tried to add this to my "Southnjes- Multi 5MA/5EMA crossover signal + RSI/MACD/STOCH Div signal + Bollinger + Candlestick signals." But there were too many outputs so it had to go separate.
Anyway. You can change the "Fib period" to get the positions you need on the levels. Default is 100 but I will change mine to 25/50/200 and sometimes 180 or 220 which gives me my needed highs and lows for calculations. Play with it as it only takes a minute or so to get the desired H/L.
Golden pocket is mapped in golden.
Green is up, Red is down.
Higher Fib levels can be turned off or on (1.272-3.618).
I hope you all enjoy it and again, don't forget to visit borserman for his other great scripts. :)