Daily Swing High/Low Fibs (Clean v6)This indicator automatically detects the latest Daily Swing High and Swing Low and plots clean Fibonacci retracement levels based on those swings.
Even if you switch to 4H, 1H, 15m, or 5m, the levels remain locked to the Daily timeframe, giving you consistent higher-timeframe structure on any chart.
Recherche dans les scripts pour "fib"

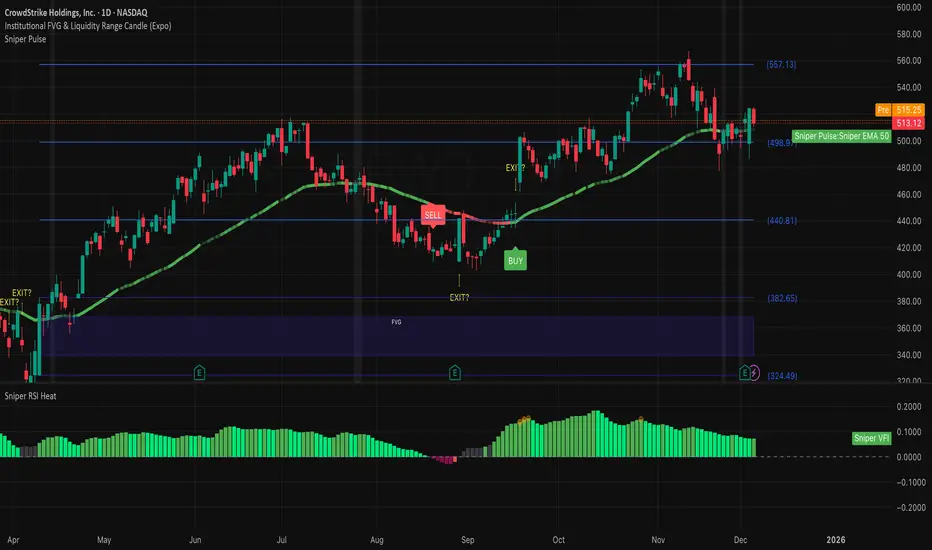
Institutional 50: The Truth TellerOverview This is a comprehensive "Fusion Strategy" overlay designed to filter out false breakouts and catch high-probability trends. It upgrades the classic EMA 50 Cross Strategy by "locking" the signal with Institutional Volume Flow (VFI) and adding an automated Fibonacci safety guard.
The Problem Standard moving average strategies often fail in two scenarios:
Fakeouts: Price crosses the line, but there is no real volume backing the move.
Choppy Markets: The price dances around the line, generating multiple false signals.
The Solution: Triple-Layer Filtering This indicator solves these issues using a strict logic:
The Trigger (EMA 50): The primary signal is generated when price crosses the EMA 50.
The Lock (VFI Filter): A signal is ONLY valid if the Volume Flow Indicator (VFI) confirms the direction (Positive for Buy, Negative for Sell). If price crosses but VFI disagrees, the line turns GRAY, warning of a "Empty Rally" or "Bear Trap."
The Safety (Fib Guard): The system automatically draws invisible Fibonacci retracement levels based on recent price action. If a trend reverses and breaks the Golden Ratio (0.618), a Yellow Warning Arrow appears, signaling a potential trend failure.
Anti-Chop Filter: It calculates the slope of the EMA. If the market is flat/ranging, the line turns WHITE and signals are suppressed.
Visual Guide & Legend
🟢 Green Line + BUY Label: Confirmed Uptrend (Price > EMA 50 + Positive Institutional Volume).
🔴 Red Line + SELL Label: Confirmed Downtrend (Price < EMA 50 + Negative Institutional Volume).
⚪ Gray Line: CAUTION. Price has crossed the EMA, but Volume does NOT confirm. Do not enter.
⬜ White Line / Background: CHOP ZONE. The market is ranging/flat. No trades.
⚠️ Yellow Arrows (EXIT?): The price has moved against the trend and broken key Fibonacci Support/Resistance. Consider tightening stops or exiting.
Best For:
Trend Following on 1H, 4H, and Daily timeframes.
Traders looking to filter out "Noise" and focus only on Volume-Backed moves.
Multi-Factor Trend Confluence Indicator (PTP V4)Disclaimer: This is a technical analysis tool for educational and informational purposes only. It does not constitute investment advice, financial solicitation, or a recommendation to buy or sell any security or instrument. Trading involves significant risk, and past performance is not indicative of future results. Use at your own risk.
KEY Features and Strategic Methodology
This is a comprehensive trend and confluence indicator built on multiple factors to identify potential pullbacks within an established trend.
• Core Trend Filter: Uses a long-term EMA to confirm the overall market bias.
• Fibonacci Pullback Logic: Identifies potential low-risk entry zones by calculating a 61.8% Fibonacci Retracement over a user-defined lookback period.
• Multi-Factor Confluence: A signal is generated only when the price touches the Fib zone AND the following factors align (You can edit the script to adjust the confluence conditions.):
o RSI is above 50.
o Positive DI is above Negative DI (DMI Bullish Crossover).
o Price is above the fast EMA.
• Consecutive Signal Counter: Includes a unique counter that highlights bars where the confluence conditions have been met for a minimum number of consecutive candles (4 by default), aiding in the validation of strong momentum entries.
• Moving Average Visualization: Plots and color-fills 10 WMA, 21 EMA, 42 EMA, and 200 EMA to provide a full market context and visualize momentum shifts.
1. Short-Term Momentum (WMA10 vs. EMA42 Fill)
This fill area highlights immediate price acceleration and momentum shifts:
• Green Fill (Bullish Momentum): WMA10 > EMA42.
• Red Fill (Bearish Momentum): WMA10 < EMA42.
2. Long-Term Market Context (EMA200 vs. EMA42 Fill)
This fill area defines the dominant backdrop of the market, essential for strategic positioning:
• Green Fill (Bullish Context): EMA200 < EMA42.
• Red Fill (Bearish Context): EMA200 > EMA42.
EMA200 Line Coloration
The EMA200 line color itself also provides a visual cue for the long-term context:
• Red Line: When EMA200 > EMA42 (Bearish Context).
• Green Line: When EMA200 < EMA42 (Bullish Context).
Customization
The indicator is highly customizable via the settings menu, allowing users to adjust lengths for EMA, RSI, DMI, Pivot Points, and the specific parameters for the Fibonacci Retracement Strategy (tolerance and candle limits).

LJ Parsons Adjustable expanding MRT Fibpapers.ssrn.com
Market Resonance Theory (MRT) reinterprets financial markets as structured multiplicative, recursive systems rather than linear, dollar-based constructs. By mapping price growth as a logarithmic lattice of intervals, MRT identifies the deep structural cycles underlying long-term market behaviour. The model draws inspiration from the proportional relationships found in musical resonance, specifically the equal temperament system, revealing that markets expand through recurring octaves of compounded growth. This framework reframes volatility, not as noise, but as part of a larger self-organising structure.

Intraday Fibonacci Retracement Golden pocket for scalping# Intraday Fibonacci Retracement Golden pocket for scalping
## Overview
This advanced Pine Script indicator provides dynamic Fibonacci retracement levels specifically designed for intraday trading. Using proprietary AI-powered algorithms, the script automatically identifies optimal high and low reference points to generate precise Fibonacci levels that adapt in real-time throughout the trading day.
## Key Features
### 🎯 Dynamic Level Generation
- **Intelligent Auto-Detection**: Advanced algorithm automatically identifies key price levels using machine learning-based pattern recognition
- **Real-Time Updates**: Fibonacci levels dynamically adjust as new highs or lows are established during the session
- **Seven Core Levels**: 0% (LOD), 23.6%, 38.2%, 50%, 61.8%, 78.6%, and 100% (HOD)
### 📊 Visual Customization
- **Individual Level Control**: Show or hide any Fibonacci level independently
- **Custom Color Schemes**: Assign unique colors to each retracement level for easy identification
- **Adjustable Line Width**: Choose line thickness from 1-5 pixels for optimal chart clarity
- **Professional Labeling**: Each level displays both percentage and exact price value
### 🏆 Golden Zone Highlighting
- **Automated Zone Detection**: Automatically highlights the critical 50%-61.8% retracement zone
- **Visual Emphasis**: Shaded area between these key levels for quick visual reference
- **Customizable Transparency**: Adjust the golden zone color and opacity to match your chart theme
### 🔧 Flexible Configuration Options
#### Label Management
- **Master Toggle**: Instantly show or hide all labels with a single switch
- **Individual Label Control**: Selective visibility for each Fibonacci level label
- **Custom Label Colors**: Choose distinct colors for each label to match your trading style
- **Price Display Format**: Labels show percentage and corresponding price level
#### Level Visibility
Independent toggles for each retracement level:
- 0% (Low of Day)
- 23.6% Retracement
- 38.2% Retracement
- 50% Retracement (Midpoint)
- 61.8% Retracement (Golden Ratio)
- 78.6% Retracement
- 100% (High of Day)
### 📈 Trading Applications
**Support & Resistance**
- Identify potential reversal zones
- Spot key support and resistance levels
- Plan entry and exit points
**Price Targets**
- Set realistic profit targets based on Fibonacci extensions
- Identify potential pullback levels in trending markets
**Risk Management**
- Place stop losses at strategic Fibonacci levels
- Calculate risk-to-reward ratios using multiple levels
**Golden Zone Strategy**
- Focus on the 50%-61.8% zone for high-probability trade setups
- The golden ratio area often acts as a strong confluence zone
### 🔔 Built-in Alert System
Pre-configured alert conditions for critical price level crossings:
- 38.2% level cross
- 50% level cross (equilibrium)
- 61.8% level cross (golden ratio)
### 💡 Best Practices
**Optimal Usage**
- Works on all intraday timeframes (1min, 5min, 15min, 30min, 1hour)
- Most effective during active trading sessions
- Combine with volume analysis for confirmation
- Use alongside other technical indicators for confluence
**Chart Setup Tips**
- Adjust colors to ensure levels are visible against your chart background
- Use thicker lines on higher timeframes for better visibility
- Enable only the levels most relevant to your trading strategy
- Customize label colors to differentiate between key levels quickly
## Technical Specifications
**Performance Features**
- Maximum 500 lines supported for extensive historical analysis
- Maximum 500 labels for comprehensive price level identification
- Optimized calculations for minimal chart lag
- Real-time updates with every price tick
**Compatibility**
- Pine Script Version 6
- Compatible with all TradingView chart types
- Works across all markets (Stocks, Forex, Crypto, Futures, Options)
- Supports all timeframes from 1-minute to daily
## Installation & Setup
1. Copy the script code into TradingView Pine Editor
2. Click "Add to Chart" to apply the indicator
3. Access settings via the indicator's gear icon
4. Customize colors, labels, and visibility options to your preference
5. Save your configuration as a default template for future use
## Advanced Configuration
**For Clean Charts**
- Disable labels for a minimalist view
- Show only 50% and 61.8% levels for focused trading
- Use muted colors with higher transparency
**For Detailed Analysis**
- Enable all levels and labels
- Use high-contrast colors for each level
- Increase line width for emphasis
**For Specific Strategies**
- Mean reversion traders: Focus on 38.2%, 50%, 61.8%
- Breakout traders: Monitor 0% and 100% levels closely
- Scalpers: Use golden zone exclusively with tight stops
## Algorithm Intelligence
The indicator employs sophisticated algorithms to:
- Automatically calculate optimal reference points
- Adapt to changing market conditions
- Filter out noise and false signals
- Provide consistent, reliable level placement
This ensures that traders receive accurate, actionable Fibonacci levels without manual intervention or subjective placement decisions.
🎁 Free Trial Access
Interested in trying this indicator?
I'm offering a ONE MONTH FREE TRIAL to help you experience the power of dynamic Fibonacci levels in your trading.
To request your trial access:
Send me a Direct Message (DM) on TradingView
Include "Fib Trial Request" in your message
I'll respond with access instructions within 24 hours
This trial includes:
✅ Full access to all indicator features
✅ All customization options unlocked
✅ Priority support during trial period
✅ Setup assistance and configuration help
Don't miss this opportunity to enhance your intraday trading with professional-grade Fibonacci analysis!
📞 Author's Notes
For questions, feedback, or trial access requests, feel free to reach out via DM. I'm committed to helping traders succeed and continuously improving this tool based on user feedback.
Happy Trading!
---
**Disclaimer**: This indicator is a technical analysis tool. Past performance does not guarantee future results. Always use proper risk management and combine with other forms of analysis for trading decisions.

Elliott Wave - Wave 3 Entry EngineThis indicator is a Wave 3 entry engine built on top of an Elliott Wave–style 1-2-3 structure. It automatically finds potential Wave 3 trades, manages a simple R-multiple target/stop model, and marks outcomes directly on the chart.
What the indicator does
At a high level, the script:
Detects swing points on three “degrees”
Small (S) – fast, local swings
Medium (M) – broader swings
Large (L) – higher-timeframe context only
Looks for a 3-pivot pattern (W0 → W1 → W2)
Bullish setup: Low → High → Higher Low (L-H-L)
Bearish setup: High → Low → Lower High (H-L-H)
Checks whether that pattern is a valid Wave 1–2 structure
Using multiple rules:
Wave 2 retraces Wave 1 by a configurable fraction
Wave 1 is strong enough (percentage move + slope)
Wave 2 doesn’t overshoot Wave 0 too far
Trend direction and swing “consensus” across S/M/L degrees line up
Scores the setup (Pre-W3 Score)
The script calculates a 0–1 score based on:
How “nice” the Wave 2 retracement is vs the ideal level
How much stronger Wave 1’s slope is vs Wave 2’s pullback
How much consensus there is across the swing engine (S/M/L)
Only setups above your chosen minimum Pre-W3 score and that pass alignment checks become Wave 3 candidates.
Waits for breakout → creates a Wave 3 “entry”
For longs: price breaks above the Wave 1 high (plus an optional tick buffer)
For shorts: price breaks below the Wave 1 low (minus buffer)
When triggered, the indicator:
Stores entry price (close at breakout)
Sets a stop beyond Wave 2 (with optional extra ticks)
Calculates a target based on a fixed R multiple (e.g., 2R)
Tracks the trade until exit or timeout
For each open W3 trade, it monitors:
Target hit → marks “W3 ✅”
Stop hit → marks “W3 ❌”
Bar where both could have hit → conservative loss “W3 ?/❌”
Time-based expiry (too many bars in trade) → “W3 ⏰”
Candidates that never get a breakout within your chosen max bars from W2 can also be marked as timeout (⏰).
Visual elements on the chart
The script can plot several helpful visuals:
Swing connector lines (Small/Medium/Large)
Small = blue
Medium = purple
Large = orange
These show the detected swings at each degree
Pre-W3 labels at Wave 2 (optional)
Signals :
"Pre-W3 Long XX%" or"Pre-W3 Short XX%"
Placed at the Wave 2 pivot
Colored yellow, with the % score rounded to an integer
W3 Entry labels (optional)
"W3 Long Entry" below the bar for longs (green)
"W3 Short Entry" above the bar for shorts (red)
Outcome labels (optional)
W3 ✅ – target hit
W3 ❌ – stop hit
W3 ?/❌ – both hit on same bar, treated as loss
W3 ⏰ – candidate or trade timed out
All these can be toggled in the “Wave 3 Engine (Pre-W3 + Entries + Outcomes)” group.
Input groups & how to use them
Swing Detection (Small / Medium / Large)
These groups control how the script finds swing highs/lows using a multi-parameter pivot scan:
Left Min / Left Max / Right Min / Right Max
Define the pivot “strength” ranges (how many bars to the left/right the high/low must dominate).
Minimum swing % (post-aggregation)
Ensures that, once swings are merged and cleaned up, each swing is at least this % move from the prior opposite swing.
Loop Filters (Small/Medium/Large loop min % change)
Extra gating inside the pivot-search loop, so small noise pivots can be ignored even before final swing construction.
Practical use:
Tighten % thresholds or increase left/right bars to reduce noise.
Loosen them to get more swings and more potential W3 setups.
Wave 3 Logic
Wave 2 depth
W2 min / max retracement of W1 (fraction)
Example: 0.30–0.80 means W2 must retrace 30–80% of W1.
Ideal W2 retracement (for scoring)
Often set around 0.618 (classic fib). The closer W2 is to this, the higher the retracement part of the score.
Max W2 beyond W0 (%)
How far W2 may push past W0 (in %) before the setup is invalid. Set to 0 to disable this filter.
Wave 1 strength
Min W1 move (%)
Ensures Wave 1 itself is meaningful.
Min |W1 slope| / |W2 slope|
Wave 1 must be “steeper” than Wave 2’s correction.
Slope ratio for max score
Above this, extra slope advantage doesn’t improve the score further.
Scoring & Trend Alignment
Min Pre-W3 score (0..1)
Hard gate: anything below this won’t become a W3 candidate.
Trend alignment (S/M/L)
Options:
None – ignore swing directions, purely pattern/score based
Majority – at least 2 of S/M/L must point in the W3 direction
AllThree, S+M, S+L, M+L – stricter alignment variants
Alignment uses the latest swing direction (up or down) for each degree.
Max W3 candidates to track
Limits how many candidates + trades are stored. Old, already-closed items are pruned first; open trades are never pruned.
This is an indicator, not an order engine**:** it doesn’t place trades; it only marks hypothetical Wave 3 entries and outcomes based on your settings. Always validate on historical data and combine with your own analysis and risk management before using it in live trading.

Magic Swing Suite: Trend, Pullback & Risk DashboardMagic Swing Suite: Trend, Pullback & Risk Dashboard
This indicator is a complete Swing Trading System designed to identify high-probability trend continuation setups. It combines classic trend-following principles with a unique "3-Bar Retest" logic and provides a real-time Strategy Dashboard to help you manage positions without needing a separate strategy script.
How it Works:
The system looks for a "Confluence" of factors before generating a signal. It scores every bar out of 140 points based on the following criteria:
Trend Alignment: Price must be above EMA 10, and EMA 10 must be above EMA 20.
Momentum (RSI): RSI must be in the "Bullish Control Zone" (60-80) and above its SMA.
Volume: Volume must be significantly higher than the average (1.5x by default).
The "Magic" Retest: The script checks the last 2-5 bars to see if the price has pulled back to "kiss" the EMA 10. This ensures we are buying a dip in a trend, not chasing a top.
Breakout Confirmation: Checks for Darvas Box breakouts and price position relative to Pivot R1.
Features:
🎯 Virtual Strategy Dashboard: A table that mimics a strategy tester. It tracks Entry, Stop Loss (Trailing), Target 1, and Target 2 in real-time.
📊 Confluence Scorecard: A detailed table showing exactly why a signal was (or wasn't) generated (Trend, Retest, RSI, Volume, etc.).
🛡️ Risk Management: automatically calculates a Trailing Stop (EMA 10) and fixed Risk:Reward targets based on recent highs.
📉 Multi-Layered Overlays: Includes Auto-Pivots (Traditional, Fib, Woodie, etc.) and Darvas Boxes to identify support/resistance levels.
How to Use:
Wait for a Signal:
"FULL BUY SIGNAL" (Green): All conditions are met, including a recent retest of the EMA. This is the highest probability setup.
"BUY - NO RETEST" (Orange): Trend and momentum are strong, but price hasn't pulled back recently. Use caution, as this may be a breakout trade.
Monitor the Dashboard: Once a trade is active, the dashboard will change to "IN POSITION." Follow the "Action" row.
If the trend weakens, the Trailing Stop (EMA 10) will move up to protect profits.
Targets:
T1: Previous Swing High (or 5% if no high found).
T2: 1:1.6 Risk/Reward extension.
Settings:
Volume Spike Factor: Adjust how much volume is needed to confirm a move. Default is 1.2.
Retest Tolerance: Adjust how close the price needs to get to the EMA 10 to count as a "retest."
Dashboard Toggles: You can hide the tables if you prefer a clean chart.
Pivot Timeframes: customizable lookback for S/R levels.
FAQ:
Does this repaint?
No. All signals trigger only on confirmed bars.
Can I use this intraday?
Yes. Works great from 5m to 1D.
Are exits manual or automated?
The indicator tracks SL, T1, and T2, and marks them on the chart.
Does retest affect the buy signal?
Retest is optional. The buy logic does not require it, but adds weight to the score.
Disclaimer: This tool is for educational purposes only. The "Strategy Dashboard" is a simulation based on script calculations and does not execute real trades. Always manage your own risk.

Superior-Range Bound Renko - Alerts - 11-29-25 - Signal LynxSuperior-Range Bound Renko – Alerts Edition with Advanced Risk Management Template
Signal Lynx | Free Scripts supporting Automation for the Night-Shift Nation 🌙
1. Overview
This is the Alerts & Indicator Edition of Superior-Range Bound Renko (RBR).
The Strategy version is built for backtesting inside TradingView.
This Alerts version is built for automation: it emits clean, discrete alert events that you can route into webhooks, bots, or relay engines (including your own Signal Lynx-style infrastructure).
Under the hood, this script contains the same core engine as the strategy:
Adaptive Range Bounding based on volatility
Renko Brick Emulation on standard candles
A stack of Laguerre Filters for impulse detection
K-Means-style Adaptive SuperTrend for trend confirmation
The full Signal Lynx Risk Management Engine (state machine, layered exits, AATS, RSIS, etc.)
The difference is in what we output:
Instead of placing historical trades, this version:
Plots the entry and RM signals in a separate pane (overlay = false)
Exposes alertconditions for:
Long Entry
Short Entry
Close Long
Close Short
TP1, TP2, TP3 hits (Staged Take Profit)
This makes it ideal as the signal source for automated execution via TradingView Alerts + Webhooks.
2. Quick Action Guide (TL;DR)
Best Timeframe:
4H and above. This is a swing-trading / position-trading style engine, not a micro-scalper.
Best Assets:
Volatile but structured markets, e.g.:
BTC, ETH, XAUUSD (Gold), GBPJPY, and similar high-volatility majors or indices.
Script Type:
indicator() – Alerts & Visualization Only
No built-in order placement
All “orders” are emitted as alerts for your external bot or manual handling
Strategy Type:
Volatility-Adaptive Trend Following + Impulse Detection
using Renko-like structure and multi-layer Laguerre filters.
Repainting:
Designed to be non-repainting on closed candles.
The underlying Risk Management engine is built around previous-bar data (close , high , low ) for execution-critical logic.
Intrabar values can move while the bar is forming (normal for any advanced signal), but once a bar closes, the alert logic is stable.
Recommended Alert Settings:
Condition: one of the built-in signals (see section 3.B)
Options: “Once Per Bar Close” is strongly recommended for automation
Message: JSON, CSV, or simple tokens – whatever your webhook / relay expects
3. Detailed Report: How the Alerts Edition Works
A. Relationship to the Strategy Version
The Alerts Edition shares the same internal logic as the strategy version:
Same Adaptive Lookback and volatility normalization
Same Range and Close Range construction
Same Renko Brick Emulator and directional memory (renkoDir)
Same Fib structures, Laguerre stack, K-Means SuperTrend, and Baseline signals (B1, B2)
Same Risk Management Engine and layered exits
In the strategy script, these signals are wired into strategy.entry, strategy.exit, and strategy.close.
In the alerts script:
We still compute the final entry/exit signals (Fin, CloseEmAll, TakeProfit1Plot, etc.)
Instead of placing trades, we:
Plot them for visual inspection
Expose them via alertcondition(...) so that TradingView can fire alerts.
This ensures that:
If you use the same settings on the same symbol/timeframe, the Alerts Edition and Strategy Edition agree on where entries and exits occur.
(Subject only to normal intrabar vs. bar-close differences.)
B. Signals & Alert Conditions
The alerts script focuses on discrete, automation-friendly events.
Internally, the main signals are:
Fin – Final entry decision from the RM engine
CloseEmAll – RM-driven “hard close” signal (for full-position exits)
TakeProfit1Plot / 2Plot / 3Plot – One-time event markers when each TP stage is hit
On the chart (in the separate indicator pane), you get:
plot(Fin) – where:
+2 = Long Entry event
-2 = Short Entry event
plot(CloseEmAll) – where:
+1 = “Close Long” event
-1 = “Close Short” event
plot(TP1/TP2/TP3) (if Staged TP is enabled) – integer tags for TP hits:
+1 / +2 / +3 = TP1 / TP2 / TP3 for Longs
-1 / -2 / -3 = TP1 / TP2 / TP3 for Shorts
The corresponding alertconditions are:
Long Entry
alertcondition(Fin == 2, title="Long Entry", message="Long Entry Triggered")
Fire this to open/scale a long position in your bot.
Short Entry
alertcondition(Fin == -2, title="Short Entry", message="Short Entry Triggered")
Fire this to open/scale a short position.
Close Long
alertcondition(CloseEmAll == 1, title="Close Long", message="Close Long Triggered")
Fire this to fully exit a long position.
Close Short
alertcondition(CloseEmAll == -1, title="Close Short", message="Close Short Triggered")
Fire this to fully exit a short position.
TP 1 Hit
alertcondition(TakeProfit1Plot != 0, title="TP 1 Hit", message="TP 1 Level Reached")
First staged take profit hit (either long or short). Your bot can interpret the direction based on position state or message tags.
TP 2 Hit
alertcondition(TakeProfit2Plot != 0, title="TP 2 Hit", message="TP 2 Level Reached")
TP 3 Hit
alertcondition(TakeProfit3Plot != 0, title="TP 3 Hit", message="TP 3 Level Reached")
Together, these give you a complete trade lifecycle:
Open Long / Short
Optionally scale out via TP1/TP2/TP3
Close remaining via Close Long / Close Short
All while the Risk Management Engine enforces the same logic as the strategy version.
C. Using This Script for Automation
This Alerts Edition is designed for:
Webhook-based bots
Execution relays (e.g., your own Lynx-Relay-style engine)
Dedicated external trade managers
Typical setup flow:
Add the script to your chart
Same symbol, timeframe, and settings you use in the Strategy Edition backtests.
Configure Inputs:
Longs / Shorts enabled
Risk Management toggles (SL, TS, Staged TP, AATS, RSIS)
Weekend filter (if you do not want weekend trades)
RBR-specific knobs (Adaptive Lookback, Brick type, ATR vs Standard Brick, etc.)
Create Alerts for Each Event Type You Need:
Long Entry
Short Entry
Close Long
Close Short
TP1 / TP2 / TP3 (optional, if your bot handles partial closes)
For each:
Condition: the corresponding alertcondition
Option: “Once Per Bar Close” is strongly recommended
Message:
You can use structured JSON or a simple token set like:
{"side":"long","event":"entry","symbol":"{{ticker}}","time":"{{timenow}}"}
or a simpler text for manual trading like:
LONG ENTRY | {{ticker}} | {{interval}}
Wire Up Your Bot / Relay:
Point TradingView’s webhook URL to your execution engine
Parse the messages and map them into:
Exchange
Symbol
Side (long/short)
Action (open/close/partial)
Size and risk model (this script does not position-size for you; it only signals when, not how much.)
Because the alerts come from a non-repainting, RM-backed engine that you’ve already validated via the Strategy Edition, you get a much cleaner automation pipeline.
D. Repainting Protection (Alerts Edition)
The same protections as the Strategy Edition apply here:
Execution-critical logic (trailing stop, TP triggers, SL, RM state changes) uses previous bar OHLC:
open , high , low , close
No security() with lookahead or future-bar dependencies.
This means:
Alerts are designed to fire on states that would have been visible at bar close, not on hypothetical “future history.”
Important practical note:
Intrabar: While a bar is forming, internal conditions can oscillate.
Bar Close: With “Once Per Bar Close” alerts, the fired signal corresponds to the final state of the engine for that candle, matching your Strategy Edition expectations.
4. For Developers & Modders
You can treat this Alerts script as an ”RM + Alert Framework” and inject any signal logic you want.
Where to plug in:
Find the section:
// BASELINE & SIGNAL GENERATION
You’ll see how B1 and B2 are built from the RBR stack and then combined:
baseSig = B2
altSig = B1
finalSig = sigSwap ? baseSig : altSig
To use your own logic:
Replace or wrap the code that sets baseSig / altSig with your own conditions:
e.g., RSI, MACD, Heikin Ashi filters, candle patterns, volume filters, etc.
Make sure your final decision is still:
2 → Long / Buy signal
-2 → Short / Sell signal
0 → No trade
finalSig is then passed into the RM engine and eventually becomes Fin, which:
Drives the Long/Short Entry alerts
Interacts with the RM state machine to integrate properly with AATS, SL, TS, TP, etc.
Because this script already exposes alertconditions for key lifecycle events, you don’t need to re-wire alerts each time — just ensure your logic feeds into finalSig correctly.
This lets you use the Signal Lynx Risk Management Engine + Alerts wrapper as a drop-in chassis for your own strategies.
5. About Signal Lynx
Automation for the Night-Shift Nation 🌙
Signal Lynx builds tools and templates that help traders move from:
“I have an indicator” → “I have a structured, automatable strategy with real risk management.”
This Superior-Range Bound Renko – Alerts Edition is the automation-focused companion to the Strategy Edition. It’s designed for:
Traders who backtest with the Strategy version
Then deploy live signals with this Alerts version via webhooks or bots
While relying on the same non-repainting, RM-driven logic
We release this code under the Mozilla Public License 2.0 (MPL-2.0) to support the Pine community with:
Transparent, inspectable logic
A reusable Risk Management template
A reference implementation of advanced adaptive logic + alerts
If you are exploring full-stack automation (TradingView → Webhooks → Exchange / VPS), keep Signal Lynx in your search.
License: Mozilla Public License 2.0 (Open Source).
If you build improvements or helpful variants, please consider sharing them back with the community.

GIX Analiza bar+ FIBFor feedback, I am at your disposal on WhatsApp 0040734534441 or Email George.Catinca@gmail.com

🌊 QUANTUM FLOW PRO - Ultimate Trading System🌊 QUANTUM FLOW PRO - Ultimate Trading System
Description:
QUANTUM FLOW PRO (QFP) is a comprehensive, all-in-one professional trading ecosystem designed for Crypto, Forex, and Stock markets. Unlike simple indicators that rely on a single metric, QFP combines Trend Analysis, Volume Profiles, Order Flow, and Institutional Accumulation logic into a single, powerful decision-making engine.
This system calculates a "Signal Score" (0-100) for every potential trade by analyzing over 10 different technical factors simultaneously.
🚀 KEY FEATURES
1. 🧠 Smart Signal Scoring System Every Buy or Sell signal is not just a guess; it is the result of a complex calculation. The system evaluates:
Trend: SuperTrend & EMA confluence.
Momentum: RSI, MACD, and Stochastic levels.
Volume: Money Flow, OBV, and Volume Z-Score.
Multi-Timeframe (HTF): Checks 4H and Daily trends for confirmation.
Result: You get a score (e.g., 85/100) indicating the probability of success.
2. 🐋 Whale & Accumulation Detection Identify where big players are positioning themselves before the move happens.
Purple Zones: High Accumulation areas (potential explosive breakouts).
Whale Activity: Detects unusual volume spikes often associated with institutional entries.
Consolidation: Measures volatility contraction to predict expansion.
3. 🔵 Order Flow & Pressure Visualize the battle between buyers and sellers directly on the chart.
Green/Red Dots: Show real-time Buying or Selling pressure based on price-volume divergence.
Order Walls: Identifies potential liquidity zones where price might stall or reverse.
4. 💰 Advanced Risk Management Stop guessing your exits. QFP provides dynamic levels automatically:
Entry, Stop Loss, and 3 Take Profit Levels.
Methods: Choose between ATR-based (Volatility), Fibonacci-based, or a Hybrid calculation.
Win Probability: Shows the statistical probability of reaching the next target (DN1, DN2, DN3).
5. 📊 Professional Dashboard A sleek, non-intrusive panel displaying:
Current Trend & Strength.
HTF Status.
RSI, MACD, VWAP status.
Accumulation Score & Volume Health.
🛠️ HOW TO USE
Select your Mode:
Conservative: Best for beginners. Fewer signals, higher confirmation (Wait 30 bars).
Balanced: Standard approach for day trading.
Aggressive: For scalping and volatile markets.
Wait for a Signal:
Look for the "STRONG BUY" (Green Triangle) or "STRONG SELL" (Red Triangle) labels.
Check the Score on the label (e.g., Score: 75/60). Higher is better.
Confirm with Dashboard:
Ensure the "Trend" and "HTF" (Higher Timeframe) match the signal direction.
Look for "Healthy" volume.
Execute & Manage:
Enter the trade.
Place your Stop Loss at the suggested SL line.
Take partial profits at TP1 and TP2.
Move SL to Breakeven after TP1 is hit (the script suggests this visually).
⚙️ SETTINGS OVERVIEW
Market Type: Optimize calculations for Crypto, Forex, or Stocks (BIST).
Risk Level: Low, Medium, High (Adjusts the signal threshold score).
TP Method: Hybrid (Recommended) blends ATR and Fib levels for precision.
⚠️ DISCLAIMER
This tool is for educational and analytical purposes only. Trading involves significant risk. Always perform your own due diligence and never trade with money you cannot afford to lose

Ryan Bot Signals ProRyan EMA Trend Screener Pro — Smart Auto Signals + TP/SL Engine + MTF Dashboard
Ryan EMA Trend Screener Pro is an advanced trading system that combines
✔ EMA Ribbon Trend Confirmation
✔ Auto BUY/SELL Signals
✔ ATR-based TP & SL engine
✔ Multi-Timeframe Trend Dashboard
✔ Real-Time Screener
into one clean, powerful tool.
Key Features
🔹 Smart EMA Crossover Signals
Automatically detects momentum shifts using fast vs slow EMA cloud.
🔹 Auto TP/SL System
– Up to 4 Take-Profit levels
– ATR-based dynamic Stop Loss
– Entry, SL & TP lines with labels
– Trade zones highlighted using boxes
🔹 MTF Trend Dashboard
Trend status from 5m, 15m, 30m, 1h, Daily
Shows combined trend strength (Bullish / Bearish).
🔹 Built-in Screener
Scan multiple symbols directly on your chart.
Displays trend direction & recent signals.
🔹 Fully Customizable
Modify EMA lengths, ATR settings, TP count, dashboard position & screener layout.
How to Use
Follow BUY/SELL labels created by EMA2/EMA8 crossover.
Use TP/SL lines to plan exits.
Check dashboard to confirm higher-timeframe trend.
Optional: add your favourite chart structure (S/R, Fibs, Liquidity).
Disclaimer
This tool does not guarantee profits. Use proper risk management.

[MTX] Weekly Support & Resistance Weekly Support & Resistance
Overview
Discover key market structure with this all-in-one indicator:
Weekly Support & Resistance (SR) levels , Fair Value Gap (FVG) detection , and Automatic Fibonacci retracements .
Designed for MTX traders, it plots non-repainting weekly highs/lows/opens/closes, highlights unmitigated FVGs for potential imbalances, and auto-draws Fib levels, Perfect for swing/day traders on XAUUSD.
🚀 Key Features
- Weekly SR Levels : Plots previous week's High (resistance), Low (support), Open, and Close. Optional historical levels (Week -2/-3).
- SR Zones : Customizable % zones around levels for dynamic support/resistance bands. Fill colors for easy visualization.
- FVG Detection : Identifies bullish (green) and bearish (red) Fair Value Gaps on your chart timeframe.
- buy/sell Signals :
- Trend Filter : Optional EMA/SMA to filter signals
- Auto Fibonacci : auto-retracement with 20+ levels (0%, 23.6%, 38.2%, 50%, 61.8%, 100%, extensions to 423.6%, negatives). Custom colors, labels, and background fills.
- Alerts: Built-in for FVG creation/mitigation + all buy/sell signals. Set up once for real-time notifications.
⚠️ Important Disclaimer
This indicator is for educational and analysis purposes only. It provides visual tools and signals based on historical price action— not financial advice. Past performance ≠ future results. Trading involves risk; use proper risk management. Backtest thoroughly. No guarantees of profitability. Consult a financial advisor.
#tradingview #smc #MTX #fvg #fibonacci #supportresistance

Opening Range Gap Fib + StdDevMeasures high and low of midnight, am, and pm opening range gaps. Gives standard deviation projections above and below that range, with custom settings.
***CURRENTLY AN ERROR WITH USING MORE THAN THE CURRENT DAY, IS PLOTTING 24 HOURS FROM WHEN THE RANGE WAS CREATED. FOR EXAMPLE: MIDNIGHT WILL CARRY INTO MIDNIGHT THE NEXT DAY, AM WILL CARRY INTO AM THE NEXT DAY.***
Will have a fix for that soon, but for now leave it on ONE DAY historical lookback so you're only using it for the current day.

BTC Energy + HR + Longs + M2
BTC Energy Ratio + Hashrate + Longs + M2
The #1 Bitcoin Macro Weapon on TradingView 🚀🔥
If you’re tired of getting chopped by fakeouts, ETF noise, and Twitter hopium — this is the one chart that finally puts you on the right side of every major move.
What you’re looking at:
Orange line → Bitcoin priced in real-world mining energy (Oil × Gas + Uranium × Coal) × 1000
→ The true fundamental floor of BTC
Blue line → Scaled hashrate trend (miner strength & capex lag)
Green line → Bitfinex longs EMA (leveraged bull sentiment)
Purple line → Global M2 money supply (US+EU+CN+JP) with 10-week lead (the liquidity wave BTC rides)
Why this indicator prints money:
Most tools react to price.
This one predicts where price is going based on energy, miners, leverage, and liquidity — the only four things that actually drive Bitcoin long-term.
It has nailed:
2022 bottom at ~924 📉
2024 breakout above 12,336 🚀
2025 top at 17,280 🏔️
And right now it’s flashing generational accumulation at ~11,500 (Nov 2025)
13 permanent levels with right-side labels — no guessing what anything means:
20,000 → 2021 Bull ATH
17,280 → 2025 ATH
15,000 → 2024 High Resist
14,000 → Overvalued Zone
13,000 → 2024 Breakout
12,336 → Bull/Bear Line (the most important level)
12,000 → 2024 Volume POC
10,930 → Key Support 2024
9,800 → Strong Buy Fib
8,000 → Deep Support 2023
6,000 → 2021 Mid-Cycle
4,500 → 2023 Accum Low
924 → 2022 Bear Low
Live dashboard tells you exactly what to do — no thinking required:
Current ratio (updates live)
Hashrate + 24H %
Longs trend
Risk Mode → Orange vs Hashrate (RISK ON / RISK OFF)
180-day correlation
RSI
13-tier Zone + SIGNAL (STRONG BUY / ACCUMULATE / HOLD / DISTRIBUTE / EXTREME SELL)
Dead-simple rules that actually work:
Weekly timeframe = cleanest view
Blue peaking + orange holding support → miner pain = next leg up
Green spiking + orange failing → overcrowded longs = trim
Purple rising → liquidity coming in = ride the wave
Risk Mode = RISK OFF → price is cheap vs miners → buy
Set these 3 alerts and walk away:
Ratio > 12,336 → Bull confirmed → add
Ratio > 14,000 → Start scaling out
Ratio < 9,800 → Generational buy → back up the truck
No repainting • Fully open-source • Forced daily data • Works on any TF
Energy is the only real backing Bitcoin has.
Hashrate lag is the best leading indicator.
Longs show greed.
M2 is the tide.
This chart combines all four — and right now it’s screaming ACCUMULATE.
Load it. Trust it.
Stop trading hope. Start trading reality.
DYOR • NFA • For entertainment purposes only 😎
#bitcoin #macro #energy #hashrate #m2 #cycle #riskon #riskoff

WeeklyDealingRange Pro+ (Fib Edition)Weekly Dealing Range Indicator
Overview
The Weekly Dealing Range indicator identifies range + volatility based pivot levels that form at the close of the first trading session and extend for the entire week. This tool provides key reference points for both trending and range-bound market conditions.
What It Provides
Range High & Low: Weekly session extremes
Median Level: Mid-point of the weekly range
Weekly Open: First session opening price
Fibonacci Extensions: Calculated levels above the high and below the low
Practical Application
These levels serve as:
Reversal zones for mean reversion setups
Support/resistance reference points
Target levels for existing positions
Framework for building trade ideas around high-probability pivot areas
Key Features
Optional function based alerts
Traditional price crosses level alerts
Automatically updates each week
Clean, uncluttered chart display
Works across all timeframes
Suitable for all markets and instruments

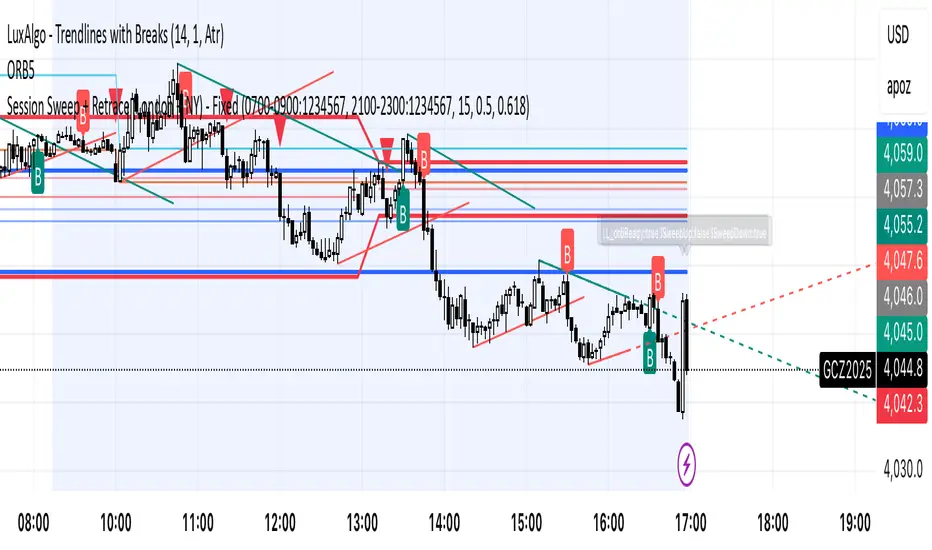
Session Sweep + Retrace (London + NY) - FixedORB Strategy with confluence. This sets out the 5 min session sweep from London and NY, and highlights a test back into the order zone with fib retracement.
Multi-Timeframe Pivot SystemMulti-Timeframe Pivot Point System
A comprehensive pivot point indicator that displays support and resistance levels across multiple timeframes simultaneously.
Key Features:
• Adaptive Latest Pivot - Automatically calculates pivots from the most recent completed candle based on your current chart timeframe (works on any timeframe from 1-minute to monthly)
• Multi-Timeframe - Customizable historical lookback (choose how many days/weeks/months back to display)
• Pivot Formula - Uses the standard pivot point calculation method:
- Pivot Point (PP) = (High + Low + Close) / 3
- R1/S1 = 2 × PP - Low/High
- R2/S2 = PP ± (High - Low)
• Visual Design - Lines extend to the right with clearly labeled price levels that automatically stagger to prevent overlap
• Fully Customizable - Choose colours, line styles, and line widths for each timeframe group
Upcoming: Fibs pivots.


Fibonacci Cluster Zones + OB + FVG (AR34)Detailed Description – Fibonacci Cluster Zones + OB + FVG (AR34)
This script is an advanced multi-layer confluence system developed under the AR34 Trading Framework, designed to identify high-accuracy reversal zones, liquidity imbalances, institutional footprints, and trend direction using a unified analytic engine.
It combines Fibonacci mathematics, Smart Money Concepts, market structure, and smart trend signals to produce precise, reliable trading zones.
⸻
🔶 1 — Fibonacci Retracement Zones + Custom Smart Levels
The script calculates the highest and lowest prices over a selected lookback period to generate key Fibonacci retracement levels:
• 0.236
• 0.382
• 0.500
• 0.618
• 0.786
• 1.000
You can also add up to three custom Fibonacci levels (0.66, 0.707, 0.88 or any value you want).
✔ Each level is drawn as a horizontal line
✔ Optional label display for every level
✔ Color and activation fully customizable
These levels help identify pullback zones and potential turning points.
⸻
🔶 2 — True Fibonacci Cluster Detection
The script automatically identifies Cluster Zones, which occur when:
1. A Fibonacci level
2. An Order Block
3. A Fair Value Gap
all overlap in the same price range.
When all three conditions align, the script prints a CLUSTER marker in yellow.
These zones represent:
• High-probability reversal areas
• Strong institutional footprints
• Highly reactive price levels
⸻
🔶 3 — Automatic Order Block (OB) Detection
The indicator detects Order Blocks based on structural candle behavior:
• Bearish candle → followed by bullish
• Price interacts with a Fibonacci level
• Area aligns with institutional order flow
When detected, the OB is marked for easy visualization.
⸻
🔶 4 — Fair Value Gap (FVG) Mapping
The script scans for liquidity imbalances using the classic FVG logic:
• low > high
When an FVG exists, it draws a green liquidity box.
This highlights:
• Gaps left by institutional moves
• High-value return zones
• Efficient price retracement levels
⸻
🔶 5 — Fibonacci Extension Projections
The script calculates extension targets using:
• 1.272
• 1.618
• 2.000
These are drawn as dashed teal lines and help forecast:
• Breakout continuation targets
• Wave extension objectives
• Take-profit areas
⸻
🔶 6 — Smart Trend Signal (EMA-200 Engine)
Trend direction is determined using the EMA 200:
• Price above EMA → uptrend
• Price below EMA → downtrend
A green or red signal icon appears only when the trend flips, reducing noise and improving clarity.
This helps detect:
• Trend shifts early
• Cleaner entries and exits
• Trend-based filtering
⸻
🔶 7 — Four-EMA Multi-Trend System
The indicator includes optional visualization of four moving averages:
• EMA 20 → Short-term
• EMA 50 → Medium-term
• EMA 100 → Long-term
• EMA 200 → Major trend
All are fully customizable (length + color + visibility).
⸻
🔶 8 — Dynamic Negative Fibonacci Levels (Green Only)
When enabled, the script calculates deep retracement zones using:
• –0.23
• –0.75
• –1.20
These negative Fibonacci levels are drawn in green and help identify:
• Deep liquidity capture points
• Hidden structural supports
• Potential reversal bottoms
⸻
🔶 9 — Complete User Control
Users maintain full control over:
✔ Enabling/disabling OB detection
✔ Enabling/disabling FVG detection
✔ Activating custom Fibonacci levels
✔ Showing or hiding labels
✔ Selecting timeframe for Fib calculations
✔ Adjusting moving average parameters
✔ Activating dynamic Fibonacci
The script is designed to be flexible, scalable, and suitable for any trading style.
⸻
🎯 Summary
This indicator is a powerful all-in-one analytical system that merges:
✔ Fibonacci Mathematics
✔ Smart Money Concepts (OB + FVG)
✔ Trend-based filtering
✔ Institutional cluster detection
✔ Dynamic extensions + retracements
✔ Multi-EMA trend mapping
It is ideal for:
• Professional traders
• SMC / ICT analysts
• Day traders and swing traders
• Anyone using confluence-based strategies
The script provides high-precision reversal zones, trend confirmation, and institutional liquidity mapping — all within a clean and smart visual layout.

Elliott Wave + SMC Fusion # Elliott Wave + SMC Fusion
## TITLE:
Elliott Wave + Smart Money Concepts Fusion
---
## SHORT DESCRIPTION:
Automated Elliott Wave pattern detection with Smart Money Concepts confirmation, EWO oscillator integration, and confluence scoring system.
---
## FULL DESCRIPTION:
### 📊 OVERVIEW
This indicator combines three powerful trading methodologies into a unified system:
- **Elliott Wave Theory** - Automated detection of Wave 1-2 impulse patterns
- **Smart Money Concepts (SMC)** - Order Blocks and Fair Value Gaps for institutional confirmation
- **Elliott Wave Oscillator (EWO)** - Momentum-based signal validation
The core concept is to identify high-probability Wave 3 entries by detecting completed Wave 1-2 structures and validating them with SMC and momentum indicators.
---
### 🔧 HOW IT WORKS
**1. Pattern Detection (ZigZag Method)**
- Uses pivot high/low detection to identify swing points
- Validates Wave 2 retracement using Fibonacci ratios (default: 38.2% - 88.6%)
- Requires minimum wave size to filter noise
- Applies confirmation bars to avoid premature signals
**2. Wave Projections**
- Wave 3 target: Fibonacci extension of Wave 1 (default: 1.618)
- Wave 4 retracement: Percentage of Wave 3 (default: 38.2%)
- Wave 5 projection: Extension of Wave 1 from Wave 4
**3. Smart Money Validation**
- **Order Blocks**: Identifies last opposing candle before breakout (institutional footprint)
- **Fair Value Gaps**: Detects price imbalances for potential support/resistance
**4. EWO Confirmation**
- Calculates momentum: (EMA5 / EMA34 - 1) × 100
- Signal line crossovers confirm trend direction
- Strong signals occur at extremes (< -13 or > 13 threshold)
**5. Confluence Scoring (0-100%)**
Points awarded for:
- Fibonacci quality of Wave 2 retracement (10-30 pts)
- Order Block presence (15 pts)
- Fair Value Gap presence (10 pts)
- Volume confirmation (10-15 pts)
- Trend alignment with EMA50 (10 pts)
- EWO confirmation (10-20 pts)
---
### 🎯 UNIQUE FEATURES
**Pattern Locking System**
- Once a valid pattern is detected, it locks until:
- Pattern invalidates (price breaks Wave 0)
- Pattern completes (Wave 5 reached)
- Auto-timeout (configurable bars)
- Prevents rapid signal flipping and false alerts
**Signal Stability Controls**
- Adjustable cooldown between signals (default: 20 bars)
- Minimum bar distance between wave points
- Direction change requirement option
- Confirmation bars after Wave 2 formation
**Visual Wave Tracking**
- Solid lines for impulse waves (0→1, 2→3, 4→5)
- Dashed lines for corrective waves (1→2, 3→4)
- Numbered labels on each wave point
- Real-time projection lines to targets
**Comprehensive Dashboard**
- Current wave status and lock state
- Pattern grade (A+ to D based on confluence)
- Projected vs actual wave levels (✓ when completed)
- SMC confirmation status
- Risk/Reward ratio calculation
- EWO trend direction
---
### 📈 TRADING APPLICATION
**Entry Strategy**
- Wait for Wave 1-2 pattern detection (diamond signal)
- Check confluence score (>65% = higher probability)
- Verify EWO alignment with pattern direction
- Enter after 30% retracement of Wave 2 (customizable)
**Risk Management**
- Stop Loss: Below Wave 0 (with buffer)
- Take Profit 1: Wave 3 projection
- Take Profit 2: Wave 5 projection
- R:R displayed in dashboard
**Invalidation Rules**
- Price breaks below Wave 0 (bullish) or above (bearish)
- Wave 2 level violated before Wave 3 forms
- Pattern timeout exceeded
---
### ⚙️ KEY SETTINGS
**Elliott Wave**
- ZigZag Length: Pivot detection sensitivity
- Fib Tolerance: Acceptable retracement range
- Min Wave Size: Filter small movements
**Signal Stability**
- Signal Cooldown: Minimum bars between signals
- Lock Pattern Until Invalid: Prevent signal changes
- Confirmation Bars: Wait after Wave 2
**Wave Projection**
- Wave 3/4/5 Fibonacci extensions
- Projection display distance
**EWO Settings**
- Fast/Slow EMA lengths
- Signal smoothing
- Strength threshold
**SMC Settings**
- Order Block lookback period
- FVG minimum size percentage
---
### 🔔 ALERTS
- New bullish/bearish pattern detected
- High confluence setup (>75%)
- Pattern invalidation
- Wave completion
---
### ⚠️ IMPORTANT NOTES
- This indicator identifies **potential** Elliott Wave patterns based on mathematical rules
- Elliott Wave analysis is subjective - patterns may be interpreted differently
- Always combine with other analysis methods and proper risk management
- Past pattern performance does not guarantee future results
- Pattern locking prevents repainting but delays new pattern detection
- Best used on higher timeframes (1H+) for cleaner wave structures
---
### 📚 METHODOLOGY REFERENCES
**Elliott Wave Theory**
- Wave 2 typically retraces 38.2% - 88.6% of Wave 1
- Wave 3 is often the strongest, extending 161.8% of Wave 1
- Wave 4 usually retraces 38.2% of Wave 3
- Wave 5 completes the impulse structure
**Smart Money Concepts**
- Order Blocks represent institutional supply/demand zones
- FVGs indicate price inefficiencies that may act as magnets
**Elliott Wave Oscillator**
- Developed to identify wave momentum
- Crossovers signal potential wave transitions
- Extreme readings often coincide with wave completions
---
### 🎨 VISUAL ELEMENTS
- **Green**: Bullish patterns and projections
- **Red**: Bearish patterns and projections
- **Orange**: Wave projection levels
- **Purple**: Order Block zones
- **Yellow**: Fair Value Gaps
- **Blue**: Entry levels
- **Diamond shapes**: New pattern signals
- **Triangle shapes**: EWO crossover signals
---
### 💡 TIPS FOR BEST RESULTS
1. Use on liquid markets with clear trend behavior
2. Higher timeframes produce more reliable patterns
3. Look for confluence scores above 65%
4. Verify EWO alignment before entry
5. Consider market context (overall trend, key levels)
6. Adjust ZigZag length based on your trading style
7. Increase cooldown period for longer-term signals
---
**Indicator Type**: Overlay
**Markets**: All (Crypto, Forex, Stocks, Commodities)
**Timeframes**: All (1H+ recommended)
**Style**: Pattern Recognition + Momentum + Price Action

RED-E Market Structure (Pro V2)RED-E Market Structure - Comprehensive Technical Analysis System
⚠️ EDUCATIONAL TOOL - NO GUARANTEES
This indicator is designed for educational purposes to help traders learn technical analysis concepts. It does not predict future price movements or guarantee profitable trades. Trading involves substantial risk of loss.
═══════════════════════════════════════════════════════════════
📊 WHAT THIS INDICATOR DOES
This indicator combines multiple standard technical analysis methods into a unified system for analyzing market structure, momentum, volume dynamics, and key price levels. Rather than adding 10 separate indicators to your chart, this consolidates related information into one cohesive interface where each component informs the others.
═══════════════════════════════════════════════════════════════
🔧 TECHNICAL METHODOLOGY - HOW IT WORKS
1️⃣ MOMENTUM CANDLE COLORING (6 Levels)
Calculation Method:
- Compares close vs EMA(9) and EMA(21)
- Applies RSI(14) thresholds for strength
- Color codes: Royal Blue (strongest bull) → Cyan → Green → Yellow → Orange → Red (strongest bear) → White (neutral)
Formula Logic:
IF close > EMA(9) AND close > EMA(21) AND close > open:
RSI > 70 = Level 3 Bull (Royal Blue)
RSI 60-70 = Level 2 Bull (Cyan)
RSI < 60 = Level 1 Bull (Green)
Purpose: Visualizes momentum strength by combining trend (EMAs), candle direction, and overbought/oversold conditions (RSI).
2️⃣ ENTRY SIGNAL LABELS
Calculation Method:
- Uses EMA alignment: EMA(9) > EMA(21) > EMA(50) for bullish
- Filters RSI to avoid extremes
- Requires confirming candle
BUY Signal Logic:
IF close > EMA(9) AND RSI between 40-70 AND EMA(9) > EMA(21) > EMA(50) AND close > open
THEN: Display "BUY" label
Purpose: Identifies potential entries when multiple trend and momentum conditions align. This is standard multi-confirmation technical analysis.
3️⃣ VOLUME DELTA PERCENTAGE
Calculation Method:
FOR each bar in lookback period (default 20):
IF close > open: add volume to bullish_volume
IF close < open: add volume to bearish_volume
bullish_percent = (bullish_volume / total_volume) × 100
Purpose: Quantifies buying vs selling pressure as percentages. Shows if volume supports the current trend.
Display: "🟢65.3% | 🔴34.7%" in dashboard
4️⃣ PRE-MARKET HIGH/LOW TRACKING
Calculation Method:
1. Detect pre-market session (4:00-9:30 AM ET)
2. Track highest high during pre-market
3. Track lowest low during pre-market
4. Draw horizontal lines when market opens
Purpose: Pre-market levels often act as support/resistance during regular hours. This automates their tracking and visualization.
5️⃣ OPENING RANGE BREAKOUT (ORB)
Calculation Method:
1. User sets start time (default 9:30 AM) and duration (default 15 min)
2. Track highest high and lowest low during this period
3. Draw box and extend lines
Purpose: The opening range breakout is a well-documented day trading strategy. First X minutes establish a range, and breakouts often signal directional moves.
6️⃣ SUPPORT/RESISTANCE TRENDLINES
Calculation Method:
1. Identify pivot highs: ta.pivothigh(high, 5, 5)
2. Identify pivot lows: ta.pivotlow(low, 5, 5)
3. Connect last two pivot highs = Resistance (red)
4. Connect last two pivot lows = Support (blue)
Purpose: Automatically connects significant pivot points. Based on standard pivot analysis where price respects these levels.
7️⃣ GAMMA ZONE DETECTION
Calculation Method:
1. Calculate 30-min range: (high - low)
2. Calculate 10-period SMA of range
3. Calculate ratio: current_range / average_range
IF ratio < (1.0 / sensitivity): HIGH GAMMA = Low volatility
IF ratio > (1.0 × sensitivity): LOW GAMMA = High volatility
Purpose: Approximates options gamma effects. High gamma = dealers hedge more = suppressed volatility. Low gamma = less hedging = potential explosive moves.
8️⃣ TAKE PROFIT LEVELS (5 Levels + ATR Stop Loss)
Calculation Method:
LONG: TP = entry_price × (1 + percentage/100)
SHORT: TP = entry_price × (1 - percentage/100)
Stop Loss (ATR): entry ± (ATR(14) × multiplier)
Purpose: Automatically calculates percentage-based targets and volatility-adjusted stops. ATR adapts stop to current market conditions.
9️⃣ THE STRAT PATTERN RECOGNITION
Calculation Method:
Compare current bar to previous:
- Strat 3 (outside bar): high > high AND low < low
- Strat 1 (inside bar): high ≤ high AND low ≥ low
- Strat 2 (directional): All others
Purpose: The Strat is a price action system categorizing bars by relationship to previous bars. This automates classification.
🔟 FIBONACCI RETRACEMENTS
Calculation Method:
1. Find highest high in lookback (default 30 bars)
2. Find lowest low in lookback
3. Calculate: 0.0, 0.382, 0.5, 0.618, 1.0 levels
Purpose: Standard Fibonacci tool. These ratios are commonly used support/resistance in technical analysis.
1️⃣1️⃣ MULTI-TIMEFRAME ANALYSIS
Calculation Method:
FOR each timeframe (default 15m, 1H, 4H):
Check if close > EMA(9) on that timeframe
IF true: "BULLISH", else: "BEARISH"
Purpose: Shows trend alignment across timeframes using Pine's request.security(). Common confirmation technique.
═══════════════════════════════════════════════════════════════
💡 WHY THESE COMPONENTS WORK TOGETHER
This indicator's originality lies in its unified system approach:
1. TREND IDENTIFICATION (EMAs, MTF) - Shows direction
2. MOMENTUM MEASUREMENT (RSI, candles) - Shows strength
3. VOLUME CONFIRMATION (Volume Delta) - Shows conviction
4. KEY LEVELS (PM, ORB, Fib, S/R) - Shows decision points
5. RISK MANAGEMENT (TP levels, ATR stops) - Shows exits
VALUE OF INTEGRATION:
Rather than 10 separate indicators creating chart clutter, this consolidates related concepts where each component provides different information that, when viewed together, gives a more complete market picture.
Example Integration:
- Entry signal appears (EMA + RSI aligned)
- Volume Delta confirms (more buying than selling)
- MTF shows higher timeframes agree
- TP levels auto-calculate with good risk:reward
- Support trendline nearby provides stop reference
═══════════════════════════════════════════════════════════════
⚙️ CUSTOMIZATION OPTIONS
All features independently toggleable:
- EMAs: Adjust lengths (9, 21, 50, 200), colors, widths
- RSI: Change overbought/oversold levels (70/30)
- Volume Delta: Adjust lookback period (20)
- ORB: Set custom start time, duration, timezone
- Gamma: Adjust sensitivity (1-10)
- TP Levels: Customize all 5 percentages
- Dashboard: Reposition, resize, recolor
═══════════════════════════════════════════════════════════════
📖 HOW TO USE
Step 1 - Assess Context:
- Check MTF Dashboard for alignment
- Check EMA indicator for trend
- Check Gamma Zone for volatility expectation
Step 2 - Identify Setups:
- Wait for BUY/SELL signal
- Check Volume Delta matches direction
- Verify RSI not extreme (30-70)
- Look for support/resistance confluence
Step 3 - Evaluate Risk:Reward:
- Review TP3 R:R ratio (target 2:1+)
- Check stop loss placement
- Ensure risk acceptable
Step 4 - Monitor:
- Track P&L % in real-time
- Use TP levels as potential exits
- Adjust stops based on S/R
═══════════════════════════════════════════════════════════════
⚠️ LIMITATIONS & REALISTIC EXPECTATIONS
This indicator does NOT:
- Predict future price movements
- Guarantee profitable trades
- Work in all market conditions
- Replace proper education and practice
This indicator CAN:
- Display standard technical indicators in organized way
- Automate common calculations
- Visualize multiple analysis methods simultaneously
- Help learn how different indicators relate
Key Understanding:
All technical indicators use historical data. They help identify patterns and conditions but cannot predict the future. Successful trading requires risk management, psychology, and experience—not just indicators.
═══════════════════════════════════════════════════════════════
📚 EDUCATIONAL CONCEPTS TAUGHT
- How EMAs show trend direction and alignment
- How RSI identifies momentum extremes
- How volume confirms or diverges from price
- How support/resistance levels form
- How multiple timeframes provide context
- How ATR adapts stops to volatility
- How risk:reward ratios work
═══════════════════════════════════════════════════════════════
📊 BEST SUITED FOR
- Scalping: 1m-5m charts with quick entries/exits
- Day Trading: 15m-1H focusing on ORB and PM levels
- Swing Trading: 4H-D following major trends
═══════════════════════════════════════════════════════════════
⚠️ RISK DISCLAIMER
Trading involves substantial risk of loss. This educational tool:
- Does NOT guarantee profits
- Cannot predict future performance
- Requires proper risk management
- Should be practiced on demo accounts first
Always use stop losses, risk only 1-2% per trade, and consult licensed financial professionals before trading with real capital.
═══════════════════════════════════════════════════════════════
Educational tool for learning technical analysis. Not financial advice. Past results do not indicate future performance.

Structure Pilot - Z&Z [Wang Indicators]Structure Pilot Zone & Zil is a complete suite of structure driven features that's build around pattern that can be visible around any timeframe.
Built in collaboration with Dave Teaches,
All these tools were shaped and combined together as the only toolkit Structure & DTFX traders want to have !
▫️ Structures & Zones ▫️
Zones are drawn when a break of structure (new high or low being created) or a market reversal happens.
It will highlight the last valid down move before a new high for bullish zones and the last valid up move before a new low for bearish zones.
These zones are used to analyze the market trend and to make entries into the market trend once the price retraces into these zones.
For example, with the latest bullish zones drawn in green for LTF zones and in blue for HTF zones, when the price retraces into this zone, there is a strong probability that the price will turn around to provide a buying opportunity all the way to the top of the zone or even higher.
These buying opportunities generally occur at specific retracement levels in the 30%, 50% and 70% zones, automatically represented by broken lines in the zones when they are created.
Example with bullish zones :
The aim with these zones is to find places on the chart where it's best to buy or sell, in order to take the biggest possible move while minimizing your risk.
Indeed, if the price is rising and a bullish zone has been created, I don't want to buy on the highs, preferring to wait for a retracement in my bullish zone to buy lower and reduce my risk, as the invalidation of the current trend will be found below the last protected low under the bullish zone drawn in blue for the HTF and in green for the LTF. Conversely, if the price is falling and a bearish zone has been created, I don't want to sell at the bottom. I'd rather wait for a retracement in the bearish zone to sell higher and reduce my risk, as the invalidation of the current trend will this time be above the last protected high above the bearish zone drawn in orange for the HTF and red for the LTF.
Example with bearish zones :
When it comes to market structure, it's good to know that zones recur within the same trend at a frequency of between 3 and 6 before there's a trend reversal.
So, after a certain number of successive zones, you can expect a reversal or the last protected high or low to be breached. The indicator automatically counts the number of successive zones, so you can keep track of the market and avoid surprises.
The zones are generated through the structure length. It can be increased to display larger (and more important) zones.
As we recommend keeping the default value (20) for new traders, experienced traders will find some success with other settings depending on their strategies.
Structure Pilot also provides auto HTF Zones, which is particularly useful to have a macro vision of the market.
Settings:
Swing types: Bullish only, Bearish only, both, or none
Structure length
Swing count: useful when it comes to tracking Trend strenght in any given time frame
Show Zones: Display boxes with 30%, 50%, and 70% fibs
Show HTF Zones: Display HTF zones with the same retracement configuration as the regular zones
Show 30%, 50% and 70%: Enable/disable these options to show or hide the corresponding fibs.
Box visibility, Line width & Line style: Style configuration for the zone
All settings can be activated or deactivated in the indicator parameters to suit individual needs and preferences.
30% Level : This is often considered a shallow retracement. If prices pull back to this level after an uptrend and flip in a lower timeframe, traders might view it as a strong sign of continued bullish momentum. Conversely, after a downtrend, this level could act as a temporary resistance where sellers might re-enter after a flip in a lower timeframe.
50% Level : This level is seen as a balance point or midpoint in the price move. A retracement to 50% can indicate a strong trend change or continuation.
70% Level : A retracement this deep can signal that the market might be losing steam or that the previous trend could be weakening. If the price bounces off this level, it might suggest that the trend is still in control but needed a more significant correction before moving further in its original direction.
We as structure traders prefer to take entry out of The 50% or when price retrace past it
there will be something at the level i'm looking for price to reverse from either some specific candles or imbalances.
Advanced traders might combine these levels with other tools or chart patterns that we bundle in this indicator.
▫️ ZIL ▫️
The ZIL Indicator is designed to automate the process of identifying key structural levels in the market and applying Fibonacci retracements when a significant price break occurs.
The indicator detects when a market structure (high or low) is broken and a candle closes below the previous low or above the previous high, indicating a potential trend shift or continuation.
• Tracks the break of structural lows or highs and waits for a confirmation candle that closes above or bellow the candle that set the new low.
Automated Fibonacci Retracement:
• Once the structure break is confirmed, the indicator automatically plots a Fibonacci retracement between:
• The high of the last bullish move (before the new low is set) or the low of the last bearish move (before the new high is set)
• The newly formed low after the structure break or the newly formed high after the structure break
Fibonacci levels plotted with colors :
• -0.27 : Dark red - Stop loss
• 0 : white - The new high/low - Potential entry
• 0.3, Orange 0.5, Light green 0.7: Green : Levels - Partial and take profit zones
• 1.15 pale blue - for your runner
We may long the retracement when the price is comming from a bearish zone using the ZIL to manage
Example :
Multi-Timeframe Support:
• Using the option "HTF ZIL" will display ZIL on higher timeframe (corresponding to the HTF Zones) on your charts to help traders find structural breaks and Fibonacci setups in both short-term and long-term markets.
HTF ZIL is really usefull to manage trades if the regular ZIL target get ran through
Wang use case :
HTF zill level are used when the small zill get ran through
▫️ Opening Range Tracker ▫️
The Opening Range Tracker is designed to help traders identify and track the opening range of a specified time period, specifically starting with the 144-minute candle between 8:24 AM and 10:48 AM. (default value) The indicator highlights this range and automatically plots key levels (30%, 50%, 70%) to provide potential strong reaction areas for trading. The time period for the opening range is fully customizable, allowing users to adjust it according to their strategy.
Opening range should be seen and used as a classic zone. If we trade above or below it price tend to come back into it and bounce of of the One or multiple level...
classic 30/50/70.
• Customizable Opening Range: Adapt the indicator to any market or session by changing the opening range time window.
• Precise Levels for Trading: The 30%, 50%, and 70% levels provide key zones where price may react, helping traders define entries, exits, or stop loss placements.
• Visual Clarity: The range box and levels make it easy to see the important price areas during the opening range and the rest of the trading session. If we range a lot in the opening range, we may range for the rest of the day. We should keep that in mind to avoid taking wrong decisions.
its basically a large zone that's we have seen often time price rejects from the level in it
Daily Reset: Each trading day resets the opening range, giving traders fresh data and new opportunities to capitalize on market movements.
Structure Pilot is built for beginner and experienced. It provides the tools to the traders that want to learn, understand, and trade efficiently within the principles of structure trading.
▫️ Alerts▫️
Alerts can be configured to these events :
New Swing / HTF Swing
Trend Change
Zil attached to a zone/HTF zone
Price cross 30/50/70 zones levels
Trend change and align the HTF/LTF trend
On cross partial (50%) and take profit (70%) ZIL and HTF ZIL
On cross Zil can now be configured for Bull or Bear zone
On HTF ZIL when 30% is crossed

chanlun缠论 - 笔与中枢Overview
The Chanlun (缠论) Strokes & Central Zones indicator is an advanced technical analysis tool based on Chinese Chan Theory (Chanlun Theory). It automatically identifies market structure through "strokes" (笔) and "central hubs" (中枢), providing traders with a systematic framework for understanding price movements, trend structure, and potential reversal zones.
Theoretical Foundation
Chan Theory is a sophisticated price action methodology that breaks down market movements into hierarchical structures:
Local Extremes: Swing highs and lows identified through lookback periods
Strokes (笔): Valid price movements between opposite extremes that meet specific criteria
Central Hubs (中枢): Consolidation zones formed by overlapping strokes, representing key support/resistance areas
Key Components
1. Local Extreme Detection
Identifies swing highs and lows using a configurable lookback period (default: 5 bars)
Only considers extremes within the specified calculation range
Forms the foundation for stroke construction
2. Stroke (笔) Identification
The indicator applies a multi-stage filtering process to identify valid strokes:
Stage 1 - Extreme Consolidation:
Merges consecutive extremes of the same type (high or low)
Keeps only the most extreme value (highest high or lowest low)
Stage 2 - Stroke Validation:
Ensures minimum bar gap between strokes (default: 4 bars)
Alternative validation: 2+ bars with >1% price change
Eliminates noise and insignificant price movements
Color Coding:
White Lines: Regular up/down strokes
Yellow Lines: Strokes that form part of a central hub
Customizable width and colors for different stroke types
3. Central Hub (中枢) Formation
A central hub forms when at least 3 consecutive strokes have overlapping price ranges:
Formation Rules:
Stroke 1:
Stroke 2:
Stroke 3:
Hub Upper = MIN(High1, High2, High3)
Hub Lower = MAX(Low1, Low2, Low3)
Valid if: Hub Upper > Hub Lower
Hub Extension:
Subsequent strokes that overlap with the hub extend it
Hub ends when a stroke no longer overlaps
Creates rectangular zones on the chart
Visual Representation:
Green rectangular boxes: Mark the time and price range of each central hub
Dashed extension lines: Show the latest hub boundaries extending to the right
Price labels on axis: Display exact hub upper and lower boundary values
4. Extreme Point Markers (Optional)
Red markers for tops (▼)
Green markers for bottoms (▲)
Marks every validated stroke extreme point
Useful for detailed structure analysis
5. Information Table (Optional)
Displays real-time statistics:
Symbol name
Current timeframe
Lookback period setting
Minimum gap setting
Total stroke count
Parameter Settings
Performance Settings
Max Bars to Calculate (3600): Limits historical calculation to improve performance
Local Extreme Lookback Period (5): Bars used to identify swing highs/lows
Min Gap Bars (4): Minimum bars required between valid strokes
Display Settings
Show Strokes: Toggle stroke line visibility
Show Central Hub: Toggle hub box visibility
Show Hub Extension Lines: Toggle dashed boundary lines
Show Extreme Point Marks: Toggle top/bottom markers
Show Info Table: Toggle statistics table
Color Settings
Full customization of:
Up/down stroke colors and widths
Hub stroke colors and widths
Hub border and background colors
Extension line colors
Trading Applications
Trend Structure Analysis
Uptrend: Series of higher highs and higher lows connected by strokes
Downtrend: Series of lower highs and lower lows connected by strokes
Consolidation: Formation of central hubs indicating range-bound movement
Support and Resistance Identification
Central Hub Zones: Act as strong support/resistance areas
Hub Upper Boundary: Resistance level in consolidation, support after breakout
Hub Lower Boundary: Support level in consolidation, resistance after breakdown
Price tends to react at these levels due to market structure memory
Breakout Trading
Bullish Breakout: Price closes above hub upper boundary
Previous resistance becomes support
Entry on retest of upper boundary
Stop loss below hub zone
Bearish Breakdown: Price closes below hub lower boundary
Previous support becomes resistance
Entry on retest of lower boundary
Stop loss above hub zone
Reversal Detection
Hub Formation After Trend: Signals potential trend exhaustion
Multiple Hub Levels: Create probability zones for reversals
Stroke Count: Excessive strokes within hub suggest weakening momentum
Position Management
Use hub boundaries for stop loss placement
Scale out positions at hub edges
Re-enter on retests of broken hub levels
Interpretation Guide
Strong Trending Market
Long, clear strokes with minimal overlap
Few or no central hubs forming
Strokes consistently in same direction
Wide spacing between extremes
Consolidating Market
Multiple central hubs forming
Short, overlapping strokes
Yellow hub strokes dominate the chart
Narrow price range
Trend Transition
Hub formation after extended trend
Stroke direction changes frequently
Hub boundaries being tested repeatedly
Potential reversal zone
Advanced Usage Techniques
Multi-Timeframe Analysis
Higher Timeframe: Identify major hub zones for overall market structure
Lower Timeframe: Find precise entry points within larger structure
Alignment: Trade when lower timeframe strokes align with higher timeframe hub breaks
Hub Quality Assessment
Wide Hubs: Strong consolidation, higher probability support/resistance
Narrow Hubs: Weak consolidation, may break easily
Extended Hubs: More strokes = stronger zone
Isolated Hubs: Single hub = potential pivot point
Stroke Analysis
Stroke Length: Longer strokes = stronger momentum
Stroke Speed: Fewer bars per stroke = explosive moves
Stroke Clustering: Many short strokes = indecision
Best Practices
Parameter Optimization
Adjust lookback period based on timeframe and volatility
Lower periods (3-4): More strokes, more noise, faster signals
Higher periods (7-10): Fewer strokes, cleaner structure, slower signals
Confirmation Strategy
Don't trade on strokes alone
Combine with volume analysis
Use candlestick patterns at hub boundaries
Wait for breakout confirmation
Risk Management
Always place stops outside hub zones
Use hub width to size positions (wider hub = smaller position)
Exit if price re-enters broken hub from wrong direction
Avoid Common Pitfalls
Don't trade within central hubs (range-bound, unpredictable)
Don't ignore higher timeframe hub structures
Don't chase strokes after they've extended far from hub
Don't trust single-stroke hubs (need 3+ strokes for validity)
Performance Considerations
Max Bars Limit: Set to 3600 to balance detail with performance
Safe Distance Calculation: Only draws objects within 2000 bars of current price
Object Cleanup: Automatically removes old drawing objects to prevent memory issues
Efficient Arrays: Uses indexed arrays for fast lookup and processing
Ideal Market Conditions
Best Performance:
Liquid markets with clear structure (major forex pairs, indices, large-cap stocks)
Trending markets with periodic consolidations
Medium to high volatility for clear stroke formation
Less Effective:
Extremely choppy, directionless markets
Very low timeframes (< 5 minutes) with excessive noise
Illiquid instruments with erratic price action
Integration with Other Indicators
Complementary Tools:
Volume Profile: Confirm hub significance with volume nodes
Moving Averages: Use for trend bias within stroke structure
RSI/MACD: Momentum confirmation at hub boundaries
Fibonacci Retracements: Hub levels often align with Fib levels
Advantages
✓ Objective Structure: Removes subjectivity from market structure analysis
✓ Visual Clarity: Color-coded strokes and clear hub zones
✓ Multi-Timeframe Applicable: Works on all timeframes from minutes to months
✓ Complete Framework: Provides entry, exit, and risk management levels
✓ Theoretical Foundation: Based on proven Chan Theory methodology
✓ Customizable: Extensive parameter and visual customization options
Limitations
⚠ Learning Curve: Requires understanding of Chan Theory principles
⚠ Lag Factor: Strokes confirm after price movements complete
⚠ Parameter Sensitivity: Different settings produce significantly different results
⚠ Choppy Market Struggles: Can generate excessive hubs in range-bound conditions
⚠ Computation Intensive: May slow down on lower-end systems with max bars setting
Optimization Tips
Timeframe Selection
Scalping: 5-15 minute charts, lookback period 3-4
Day Trading: 15-60 minute charts, lookback period 4-5
Swing Trading: 4-hour to daily charts, lookback period 5-7
Position Trading: Daily to weekly charts, lookback period 7-10
Volatility Adjustment
High volatility: Increase minimum gap bars to reduce noise
Low volatility: Decrease lookback period to capture smaller moves
Visual Optimization
Use contrasting colors for different market conditions
Adjust line widths based on chart resolution
Toggle markers off for cleaner appearance once familiar with structure
Quick Start Guide
For Beginners:
Start with default settings (5 lookback, 4 min gap)
Enable "Show Info Table" to track stroke count
Focus on identifying clear hub formations
Practice waiting for price to break hub boundaries before trading
For Advanced Users:
Optimize lookback and gap parameters for your instrument
Use hub strokes (yellow) to identify key consolidation zones
Combine with multiple timeframes for confirmation
Develop entry rules based on hub breakout/retest patterns
This indicator provides a complete structural framework for understanding market behavior through the lens of Chan Theory, offering traders a systematic approach to identifying high-probability trading opportunities.
