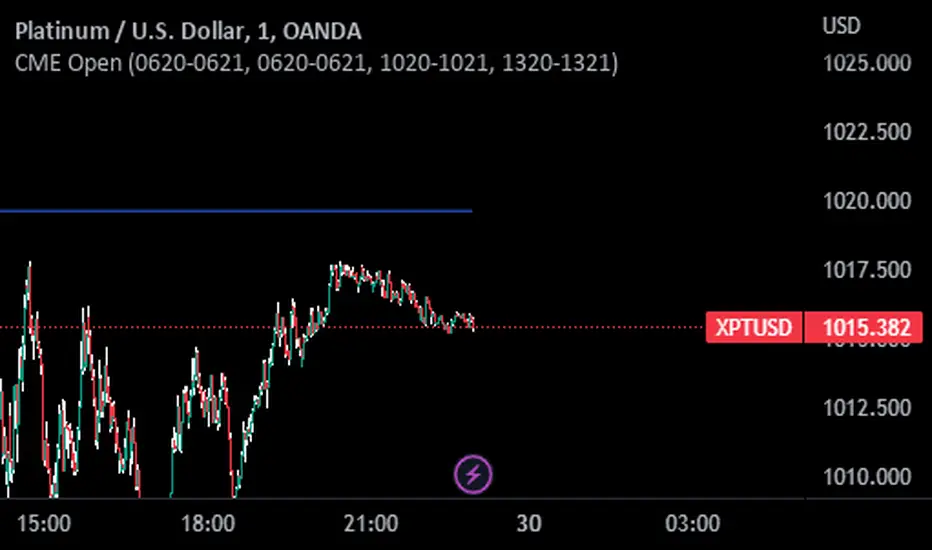
CME OpenThis indicator prints CME open line price on chart.
Please choose the right time to input depending on the broker you are using in Tradingview.
List of brokers:
OANDA 0620-0621
FOREX.COM 0620-0621
SAXO 0620-0621
GLOBALPRIME 0620-0621 (Working only on 1 minute chart)
VANTAGE 0620-0621
EASYMARKETS 0620-0621
PHILLIPNOVA 0620-0621
FXCM (FX) 0620-0621
CURRENCYCOM 0620-0621
CAPITALCOM 0620-0621
FXOPEN 1220-1221
PEPPERSTONE 1020-1021
SKILLING 1020-1021
EIGHTCAP 1320-1321
BLACKBULL 1320-1321
Recherche dans les scripts pour "forex"
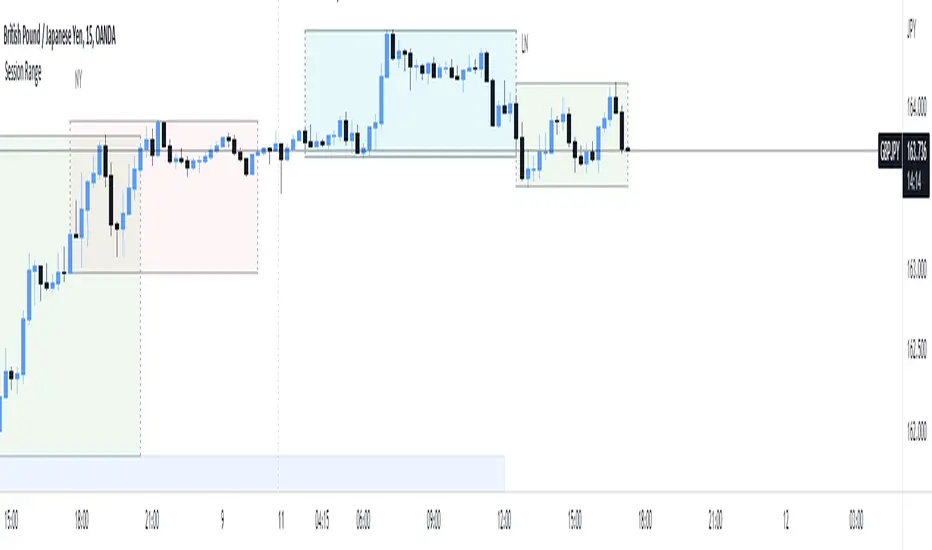
Fx Session RangeHello traders ,as you know the session timing plays a major role in trade execution.
I was searching for a good session indicator for a very long time but I was not satisfied with the indicators which are already available on Trading view. So I decided to code one my self.
This indicator is based on the timing provided by the website www.forex.timezoneconverter.com and time is set according to Ney York time zone.
I have added almost all major sessions including (Sydney , Tokyo and Frankfurt) and almost all features which I could.
I hope you guys 👍this indicator .
Incase you notice any bug or want any features added, let me know in comment section or you can Dm me as well.
Thank you all , enjoy :D
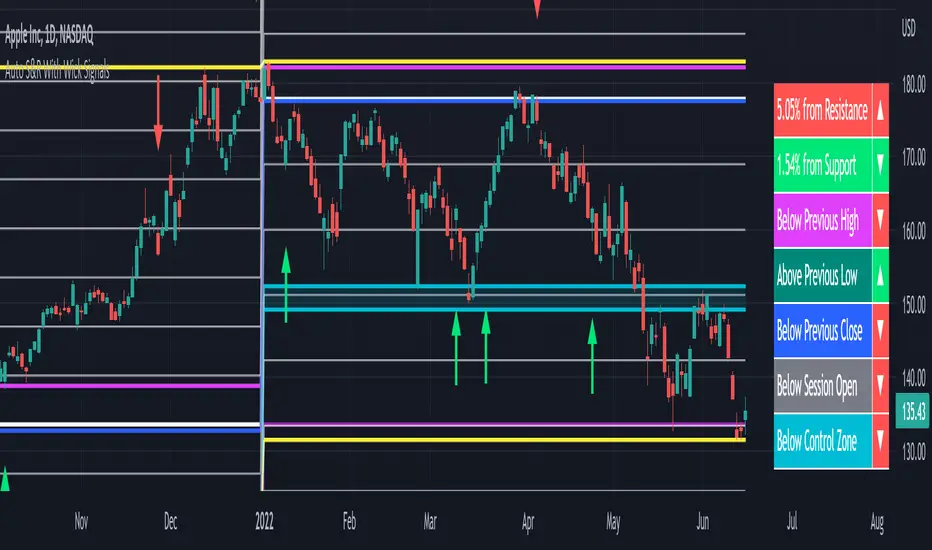
Auto Support & Resistance With Wick Signals & Percentage GapsThis auto support and resistance indicator uses percentage deviations from the previous session close to calculate levels. It provides arrows as signals when it detects 2 wicks in the last 5 bars from a support or resistance level. Includes alerts for price crossing any level as well as real time percentage gaps from current price to the next closest support and resistance level. You also have the option to set up to 3 major levels of your own for any levels that are very important on longer timeframes that you want included. Those will show on the chart as well as within your percentage gap table with color coded background. All features can be customized or turned off to suit your preferences.
SOURCE
This indicator uses the previous session close as a source by default but can be adjusted to use the previous session high or the previous session low. I find the close setting to provide the most accurate levels.
SESSION
The default setting for the previous session used is the daily session but can be adjusted to use the daily, weekly, monthly, quarterly or yearly session. Use longer sessions when looking at longer time frame charts.
SIGNALS
The signals by default are set to only show an arrow if there have been 2 bullish or bearish wicks off of a support or resistance level in the last 5 bars. This can be changed to one bullish wick off of support and one bearish wick off of resistance or it can be set to give a signal anytime a bar crosses a support or resistance level. This can be controlled in the indicator settings.
PERCENTAGE DEVIATION LEVELS
The default percentage deviation is set to 1% but can and should be adjusted according to whatever ticker you are using. For example use .25% or .5% when looking at forex intraday charts since they are not as volatile as other markets. For leveraged etfs used 1% multiplied by the leverage on the etf, so for SQQQ use 3% as it is a 3x leveraged etf. When looking at longer timeframes or highly volatile charts, set the percentage deviation to 2%, 5%, 10%, etc.
LINE COLORS
The color of the lines will change from red to green depending on if the price is above or below that level. You can customize these colors in the settings.
MAJOR LEVELS
If you have major levels of support and resistance from longer timeframes and your own charting, you can add up to 3 major levels that will show on the chart as well as show the percentage gaps in the table. The label for each major level will be colored to match the color of the line on the chart individually.
PERCENTAGE GAP TABLE
The gap table will update live with percentages to go from current price to the next closest support and resistance levels so you don’t have to calculate them manually. The position of the percentage gap table can also be changed within the indicator settings.
TURN FEATURES ON/OFF
There are 3 toggle switches so you can easily turn on or off certain features such as: the support and resistance lines, the percentage gaps table and the arrow signals.
LINE WIDTHS
You can also set the line width of all levels and the line width of the starting level within the indicator settings.
***MARKETS***
This indicator can be used as a signal on all markets, including stocks, crypto, futures and forex.
***TIMEFRAMES***
This automatic support and resistance indicator can be used on all timeframes as long as there is enough data for the session used.
***TIPS***
Try using numerous indicators of ours on your chart so you can instantly see the bullish or bearish trend of multiple indicators in real time without having to analyze the data. Some of our favorites are our Volume Spike Scanner, Volume Profile, Momentum and Trend Friend in combination with this auto support and resistance indicator. They all have real time Bullish and Bearish labels as well so you can immediately understand each indicator's trend.
Market Sector Scanner/Screener With MOM + RSI + MFI + DMI + MACDMARKET SECTOR SCANNER/SCREENER MOM + RSI + MFI + DMI + MACD FOR STOCKS CRYPTO & FOREX
This script scans 9 markets constantly and returns the values of 5 different popular indicators.
This indicator helps you see when one of your favorite stocks is bullish or bearish when you are not watching that chart so you can always catch the big moves as they happen.
***HOW TO USE***
A great way to use this market screener is to set up separate chart layouts for each sector you like to trade. Such as the top 9 stocks in the S & P 500, top 9 stocks in the XLF etf, etc. Make sure to set up separate chart layouts in Tradingview so you don’t have to change the symbols constantly. This will give you a good idea in real time if that entire sector is bullish, bearish or mixed. When the entire grid goes red or green, those are very strong signs of market direction across that entire sector, so trades in the corresponding direction are quite safe.
This can be done for crypto as well, using the top 9 cryptocurrencies by market cap. Watch the grid and wait for the entire lot to turn green or red and then take a position in that direction.
You can also use this with a variety of your favorite tickers so you can see when specific markets are looking strong in either direction, instead of constantly changing charts or missing good opportunities because you weren’t watching that specific chart.
This grid can also be used to determine how long to hold a position as well. If the entire grid is still green or red, according to your trade direction, you can usually expect price to continue in that direction until you see some conflicting colors start to pop up on the grid. As it starts to give mixed signals, you can expect the market to be indecisive or reverse which is a good time to get out.
If you have your scanner setup to show similar markets in one sector, be careful taking trades when the grid is very mixed in color. This shows signs of indecision and will likely have choppy price action until the market decides a direction so make sure to use caution when the grid is mixed. It is best to wait for the entire grid to turn green or red and then take position.
***COLOR MEANINGS***
When each indicator value is in bullish territory, the background of that value will turn green.
When each indicator value is in bearish territory, the background of that value will turn red.
When each indicator value is in neutral territory, the background of that value will turn blue.
When all 5 indicators for a ticker are bullish, the ticker background will turn green.
When all 5 indicators for a ticker are bearish, the ticker background will turn red.
When there is a mixture of bullish and bearish values, the ticker background will turn blue.
***CUSTOMIZATION***
You can customize which tickers are in your scanner including stocks, crypto, futures and forex, the source of the indicators, the length of the indicator settings and the smoothing parameters.
***INDICATORS USED***
The indicators used for each ticker are as follows:
Momentum(MOM) - Default length is 14. Bullish is above zero, bearish is below zero.
Relative Strength Index(RSI) - Default length is 14. Bullish is above 50, bearish is below 50.
Money Flow Index(MFI) - Default length is 14. Bullish is above 50, bearish is below 50.
Directional Movement Index(DMI) - Default length is 14 and smoothing is 14. Calculated by subtracting di minus from di plus. If the value is positive, it is bullish. If the value is negative, it is bearish.
Moving Average Convergence & Divergence(MACD) - Default settings are 12, 26, 9. If the short line is greater than the long line, then it is bullish. If the short line is less than the long line, it is bearish.
***MARKETS***
This market scanner can be used as a signal on all markets, including stocks, crypto, futures and forex.
***TIMEFRAMES***
This scanner can be used on all timeframes and pulls data from other tickers using the same timeframe as what your current chart is set to.
***TIPS***
Try using numerous indicators of ours on your chart so you can instantly see the bullish or bearish trend of multiple indicators in real time without having to analyze the data. Some of our favorites are Trend Friend Scalp & Swing Signals, Auto Fibonacci, Directional Movement Index, Volume Profile With Buy/Sell Pressure, Auto Support And Resistance and Money Flow Index in combination with this Scanner. They all have real time Bullish and Bearish labels as well so you can immediately understand each indicator's trend.

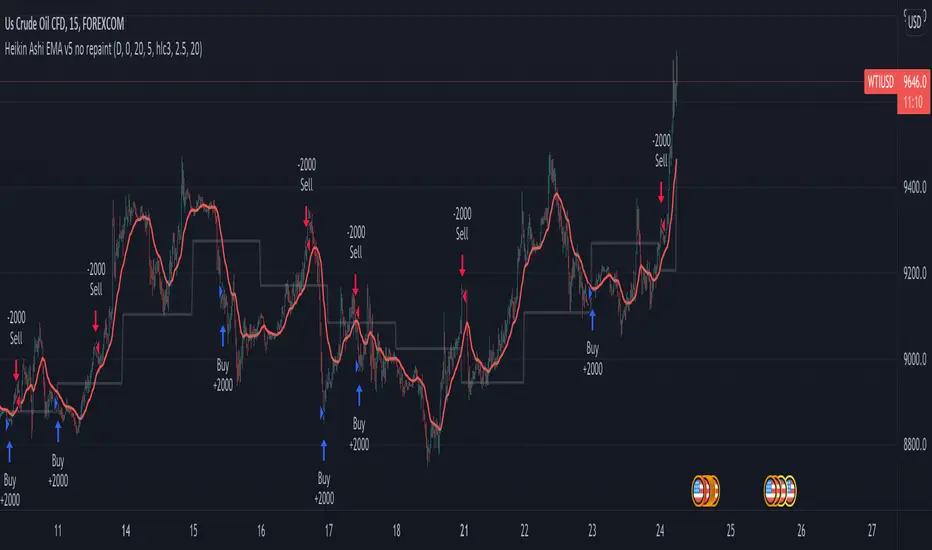
Heikin Ashi EMA v5 no repaint This script was inspired by the "Heikin/Kaufman Strategy" from marco valente built on v2.
The script was rebuilt on the v5 and most importantly removed the repaint function that was driving surrealistic backtesting inflated numbers.
This script is now fully functional and not repainting - At the time of testing worked efficiently 90% WR and 2x profit factor on CFD WTI OIL with a 15m time frame indexed on forex.com price.
You should utilize this script with caution, especially on high volatility cycles you can try plotting against a volatility relative index or stop.
I also strongly recommend understanding the fundamentals of WTI OIL to balance the indications of the strategy with fundamentals.
Thanks to Clovis Warlop and Nilesh Sharma for their contribution.
Cheers,
Gustavo Bramao
Reversal off EMA-XsEMA-Xs works mostly on Forex due to the small prices and price fluctuations. It does work on Gold, oddly enough, and some others like UKX 100...but mostly on forex. It doesn't work as well on JPY pairs but occasionally does; the JPY pairs give less signals, but when a JPY pair gives a signal, its a high probability setup. Another script EMA-XL works better on the higher priced instruments like S&P, DJI, OIL, BTC etc.
This script will show 3 moving averages: 13, 34, 200 and works on the 5m, 1hr, 4hr, daily charts. Signals "B" or "S" will be on the chart above or below the candles respectively.
When to open:
The script gives buy and sell signals based on a counter-trend move away from the MA's. When the price rises a specific percent above/below the EMA, it'll give a signal. It's best to take a trade when it gives a cluster of consecutive signals near the same price. If using on the 5m, definitely wait for consecutive signals. Also, use this in conjunction with support and resistance areas. Using with fibs for confirmation really makes this a good tool with high probability: IE, when price hits a fib and the script gives a signal, its a high probability setup.
When to close:
1. After a fast move up/down you may use this to counter trade a scalp 10+ pips, but you need to be quick; applies mostly to the 5m chart.
2. If you have the tenacity wait until you see an opposite signal. With this method you may be holding a loosing trade for a while. But what I've noticed is if it trends against you, price usually with come near to the first time it signaled. You may want to stack trades on each cluster of signals. IE first trade is 1000 units, next is 2000 units, etc... then close when prices comes near the first time it signaled. By this time, if you held, you should have profit. This strategy will really test your mental resilience.
3. Wait until it comes back to one of the trendlines; remember this is a counter trend signal so price is moving away from the MA and it always returns to touch one of the MA's...LOL eventually
4. Applying to scalping on the 5m, keep the stops tight because if the instrument trends hard and fast, you'll be upside-down quickly.
If you put a lot of time into using this signal generator, you can really make good profit. But with all tools, you need to master it. There are nuances to the simple logic of this script that can be both fun and frustrating. With all endeavors, if you put the time into it, you will reap the rewards.
Good luck and let me know if you have any questions/comments.

KayeDinero TrendSetter HFX NFXThis script combines my volume and trend indicators with an added flare.
The mindset for this strategy is a trending market, where price is moving in a consistent direction with some reversals.
The most unique concept of this script is the background calculator (divergent). This is different from other scripts on the platform because of the close tie in with the relative strength index as well as the on balance volume. The divergent lets you know of overbought and oversold conditions.
Another unique take, is the use of the Keltner Channels, which provides insight on volatility.
Best Traded during Hours 3am to 12am EST (NY Time).
This method works best in trending markets.
Time Frame, 1,3,5,15,30min
Currency Pairs: All Major, Exotic, Crypto
Here's The Strategy:
Oversold and Buy: When those are present, proceed to take a buy (call) option.
Overbought and Sell: When those are present, proceed to take a sell (put) option.
Keep in mind, timeframe will depend on your time of trading in the markets.
Morning typically 2-4min
Afternoon / Evening: 3-5min
Hint:
Best Trades on reversals at top and bottom of Keltner Channels.

FOTSI - Open sourceI WOULD LIKE TO SPECIFY TWO THINGS:
- The indicator was absolutely not designed by me, I do not take any credit and much less I want them, I am just making this fantastic indicator open source and accessible to all
- The script code was not recycled from other indicators, but was created from 0 following the theory behind it to the letter, thus avoiding copyright infringement
- Advices and improvements are accepted, as having very little programming experience in Pine Script I consider this work still rough and slow
WHAT IS THE FOTSI?
The FOTSI is an oscillator that measures the relative strength of the individual currencies that make up the 28 major Forex exchanges.
By identifying the currencies that are in the overbought (+50) and oversold (-50) areas, it is possible to anticipate the correction of a currency pair following a strong trend.
THE THEORY BEHIND
1) At the base of everything is the 1-period momentum (close-open) of the single currency pairs that contain a certain currency. For example, the momentum of the USD currency is composed of all the exchange rates that contain the US dollar inside it: mom_usd = - mom_eurusd - mom_gbpusd + mom_usdchf + mom_usdjpy - mom_audusd + mom_usdcad - mom_nzdusd. Where the base currency is in second position, the momentum is subtracted instead of adding it.
2) The IST formula is applied to the momentum of the individual currencies obtained. In this way we get an oscillator that oscillates between 0 and its overbought and oversold areas. The area between +25 and -25 is an area in which we can consider the movements of individual currencies to be neutral.
3) The TSI is nothing more than a double smoothing on the momentum of individual currencies. This particularity makes the indicator very reactive, minimizing the delays of the trend reversal.
HOW TO USE
1) A currency is identified that is in the overbought (+50) or oversold (-50) area. Example GBP = 50
2) The second currency is identified as the one most opposite to the first. Example USD = -25
3) The currency pair consisting of the two currencies opens. So GBP / USD
4) Considering that GBP is oversold, we anticipate its future devaluation. So in this case we are short on GBP / SUD. Otherwise if GBP had been oversold (-50) we expect its future valuation and therefore we enter long.
5) It is used on the H1, H4 and D1 timeframes
6) Closing conditions: the position on the 50-period exponential moving average is split / the position at target on the 100-period exponential moving average is closed
7) Stoploss: it is recommended not to use it, if you want to use it it is equivalent to 5 times the ATR on the reference timeframe
8) Position sizing: go very slow! Being a counter-trend strategy, it is very risky to position yourself heavily. Use common sense in everything!
9) To insert the alerts that warn you of an overbought and oversold condition, it is necessary to enter the signals called "Overbought Signal" and "Oversold Signal" for each chart used, in the specific Trading View window. like me using multiple charts in the same window.
I hope you enjoy my work. For any questions write in the comments.
Thanks <3
//--------------------------------------------------------------------------------------------------------------------------------------------------------------------------------------------------------------
TENGO A PRECISARE DUE COSE:
- L'indicatore non è stato assolutamente ideato da me, non mi assumo nessun merito e tanto meno li voglio, io sto solo rendendo questo fantastico indicatore open source ed accessibile a tutti
- Il codice dello script non è stato riciclato da altri indicatori, ma è stato creato da 0 seguendo alla lettere la teoria che sta alla sua base, evitando così di violare il copyright
- Si accettano consigli e migliorie, visto che avendo pochissima esperienza di programmazione in Pine Script considero questo lavoro ancora grezzo e lento
COS'È IL FOTSI?
Il FOTSI è un oscillatore che misura la forza relativa delle singole valute che compongono i 28 cambi major del Forex.
Individuando le valute che si trovano nelle aree di ipercomprato (+50) ed ipervenduto (-50) , è possibile anticipare la correzione di una coppia valutaria al seguito di un forte trend.
LA TEORIA ALLA BASE
1) Alla base di tutto c'è il momentum ad 1 periodo (close-open) delle singole coppie valutarie che contengono una determinata valuta. Ad esempio il momentum della valuta USD è composto da tutti i cambi che contengono il dollaro americano al suo interno: mom_usd = - mom_eurusd - mom_gbpusd + mom_usdchf + mom_usdjpy - mom_audusd + mom_usdcad - mom_nzdusd . Ove la valuta base si trova in seconda posizione si sottrae il momentum al posto che sommarlo.
2) Si applica la formula del TSI ai momentum delle singole valute ottenute. In questo modo otteniamo un oscillatore che oscilla tra lo 0 e le sue aree di ipercomprato ed ipervenduto. L'area compresa tra +25 e -25 è un area in cui possiamo considerare neutri i movimenti delle singole valute.
3) Il TSI non è altro che un doppio smoothing sul momentum delle singole valute. Questa particolarità rende l'indicatore molto reattivo, minimizzando i ritardi dell'inversione del trend.
COME SI USA
1) Si individua una valuta che si trova nell'area di ipercomprato (+50) o ipervenduto (-50) . Esempio GBP = 50
2) Si individua come seconda valuta quella più opposta alla prima. Esempio USD = -25
3) Si apre la coppia di valuta composta dalle due valute. Quindi GBP/USD
4) Considerando che GBP è in fase di ipervenduto prevediamo una sua futura svalutazione. Quindi in questo caso entriamo short su GBP/SUD. Diversamente se GBP fosse stato in fase di ipervenduto (-50) ci aspettiamo una sua futura valutazione e quindi entriamo long.
5) Si usa sui timeframe H1, H4 e D1
6) Condizioni di chiusura: si smezza la posizione sulla media mobile esponenziale a 50 periodi / si chiude la posizione a target sulla media mobile esponenziale a 100 periodi
7) Stoploss: è consigliato non usarlo, nel caso lo si voglia utilizzare esso equivale a 5 volte l'ATR sul timeframe di riferimento
8) Position sizing: andateci molto piano! Essendo una strategia contro trend è molto rischioso posizionarsi in modo pesante. Usate il buonsenso in tutto!
9) Per inserire gli allert che ti avvertono di una condizione di ipercomprato ed ipervenduto, è necessario inserire dall'apposita finestra di Trading View i segnali denominati "Segnale di ipercomprato" ed "Segnale di ipervenduto" per ogni grafico che si usa, nel caso come me che si utilizzano più grafici nella stessa finestra.
Spero che possiate apprezzare il mio lavoro. Per qualsiasi domanda scrivete nei commenti.
Grazie<3

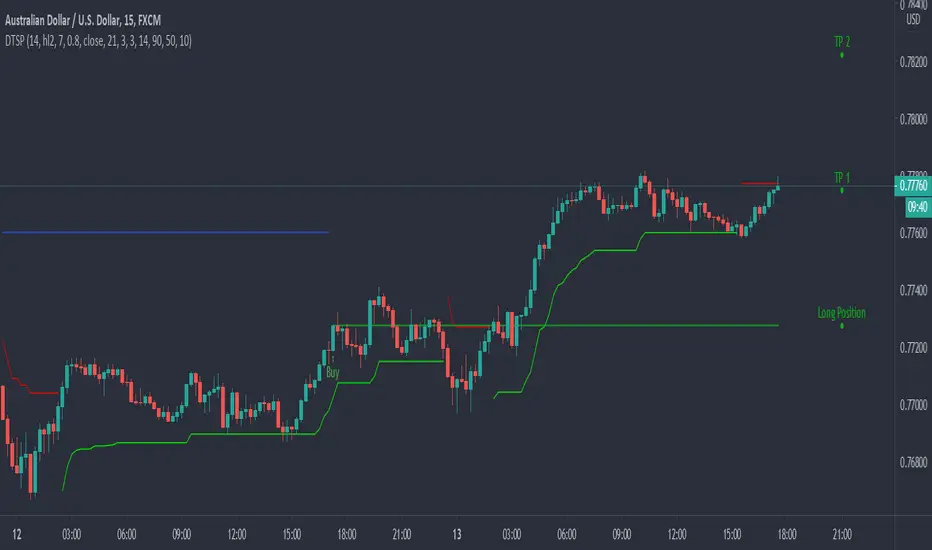
Dynamic Take Profit & Signals (AussieBogan)Dynamic Take Profit & Signals (DTS) help us to dynamically place potential take profit levels. These levels are measured based on standard deviation in conjunction with swing high and low points. Head over to the settings to control your take profit and multiplicative factor setting.
In short, higher values of either setting will return more spread out between tp's. The logic behind using the standard deviation is that a low value of it will return tp closer to where you entered the trade, as such it will have higher chances of the price reaching them.
The Indicator also has alert features for buy and sell so any trader can be aware of every potential signal the indicator produces.
scalping low lag tema etalCredit for original idea goes to 1 min forex scalping by mikegoryunov
Changes include several lower lag filters (See line 3 for a list)
and values for profit, loss, and trail_points (See lines 48:53)
a, b, & c represent fast, medium, and slow filters. Basic idea is to monitor
crossovers of the three filters to determine buy/sells. Exits occur quickly within
the next time interval.
Note that this may be used for stocks and forex. The time interval can vary widely.
I have concerns about how to incorporate transaction costs with so many transactions.

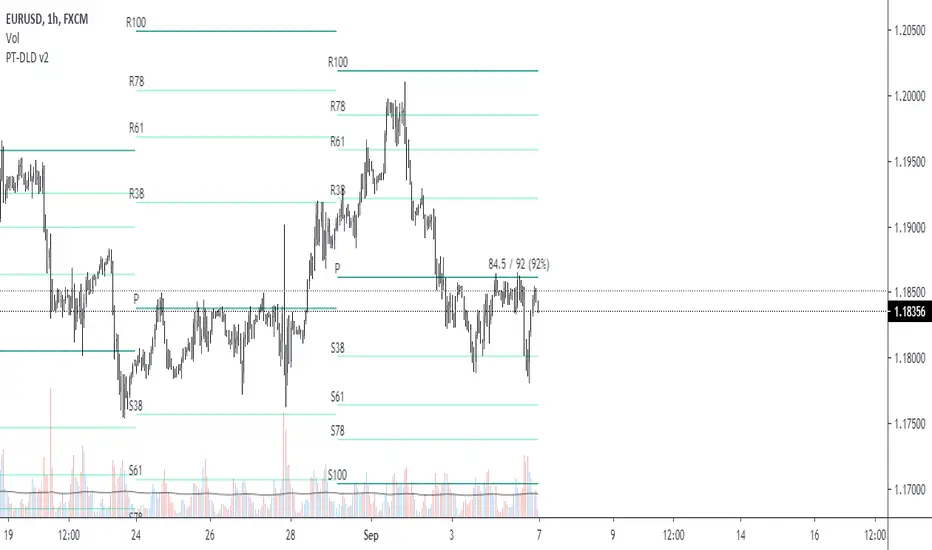
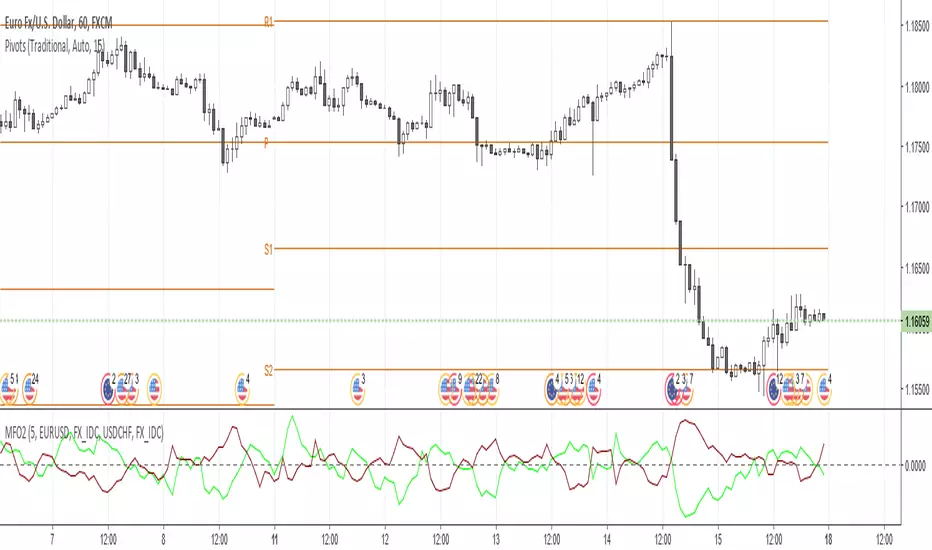
Pivot Fibonacci TradingWe use fibonacci in many things, why not the Pivot? Hey, it does works, price does reacts to the fibonacci off the pivot.
Pivots are road map for the price, fibonacci are just some stops or gas stations appear on the road, with these additional lines, there's more time for price to think about which way it'd move, therefore, more time for us traders to track and follow.
I know they usually use Daily pivot in H1, Weekly in H4 and Monthly in Daily timeframe, but since there are more lines now, price now needs space to travel between line. I recommend using Weekly Pivot for intraday(H1,...), Monthly for H4 and Yearly for Daily.
I also add some text that shows current day's range in pips (High - Low = range) and compare it to Average Daily Range. I thinks this is helpful if you use it for day trading.
I'll let this as a open sources as you may find something to customize in your own way.
Hope this helps you in someway, community :)
Happy trading!
#Thanks to @Davit on forexfactory for the idea
Bernoulli Process - Binary Entropy FunctionThis indicator is the Bernoulli Process or Wikipedia - Binary Entropy Function . Within Information Theory, Entropy is the measure of available information, here we use a binary variable 0 or 1 (P) and (1-P) (Bernoulli Function/Distribution), and combined with the Shannon Entropy measurement. As you can see below, it produces some wonderful charts and signals, using price, volume, or both summed together. The chart below shows you a couple of options and some critical details on the indicator. The best part about this is the simplicity, all of this information in a couple of lines of code.
Using the indicator:
The longer the Entropy measurement the more information you are capturing, so the analogy is, the shorter the signal, the less information you have available to utilize. You'll run into your Nyquist frequencies below a length of 5. I've found values between 9 and 22 work well to gather enough measurements. You also have an averaging summation that measures the weight or importance of the information over the summation period. This is also used for highlighting when you have an information signal above the 5% level (2 sigma) and then can be adjusted using the Percent Rank Variable. Finally, you can plot the individual signals (Price or Volume) to get another set of measurements to utilize. As can be seen in the chart below, the volume moves before price (but hopefully you already knew that)
At its core, this is taking the Binary Entropy measurement (using a Bernoulli distribution) for price and volume. I've subtracted the volume from the price so that you can use it like a MACD, also for shorter time frames (7, 9, 11) you can get divergences on the histogram. These divergences are primarily due to the weekly nature of the markets (5 days, 10 days is two weeks,...so 9 is measuring the last day of the past two weeks...so 11 is measuring the current day and the past two weeks).
Here are a couple of other examples, assuming you just love BTC, Stocks, or FOREX. I fashioned up a strategy to show the potential of the indicator.
BTC-Strategy
Stock-Strategy (#loveyouNFLX)
FOREX - (for everyone hopped up on 40X leverage)

Murrey Math Lines with labels updated the script from @ceyhun and added labels for reference...
For high probability setup pair it with higher timeframe (30 min, 60 min) and 5 min for support and resistance and use price action to go long or short... For more info on how to trade these lines you can search forexfactory . It is uncanny how these lines react to prices. Need to explore more on this subject...

MACD 4H StrategyThis strategy is a basic example of using MACD AND the instrument must be found an appropriate timeframe (4H recommended) before being tested with.

Baseline-C [ID: AC-P]The "AC-P" version of jiehonglim's NNFX Baseline script is my personal customized version of the NNFX Baseline concept as part of the NNFX Algorithm stack/structure for 1D Trend Trading for Forex. Everget's JMA implementation is used for the baseline smoothing method, with optional ATR bands at 1.0x and 1.5x from the baseline.
NNFX = No Nonsense Forex
Baseline = Component of the NNFX Algorithm that consists of a single moving average
Baseline ---> Meant to be used in conjunction with ATR/C1/C2/Vol Indicator/Exit Indicator as per NNFX Algorithm setup/structure. C1 is 1st Confirmation Indicator, C2 is 2nd Confirmation Indicator.
JMA (Jurik Moving Average) is used for the baseline and slow baseline.
A slow baseline option is included, but disabled by default.
The faint orange/purple lines are 1.0x/1.5x ATR from the Baseline, and are what I use as potential TP/SL targets or to evaluate when to stay out of a trade (chop/missed entry/exit/other/ATR breach), depending on the trade setup (in conjunction with C1/C2/Vol Indicator/Exit Indicator)
This script is heavily based upon jiehonglim's NNFX Baseline script for signaling, barcoloring, and ATR.
SSL Channel option included but disabled by default (Erwinbeckers SSL component)
POC (Point of Control) from Volume Profile is included/enabled by default for both the current timeframe and 12HR timeframe
03.freeman's InfoPanel Divergence Indicator was used a reference to replace the current/previous ATR information infopanel/info draw from jiehonglim's script. I'm not sure whether I like the previous way ATR info was displayed vs how I have it currently, but it's something that is completely optional:
Specifically: I am tuning this baseline/indicator for 1D trading as part of the NNFX system, for Forex.
DO NOT USE THIS INDICATOR WITHOUT PROPER TUNING/ADJUSTMENT for your timeframe and asset class.
Note about lack of alerts:
Alerts for baseline crosses (and other crosses) have been purposefully omitted for this version upon initial publication. While getting alerts for baseline crosses under certain conditions/filtered conditions that eliminate low-importance signals and crossover whipsaw would be great, it's something I'm still looking into.
SPECIFICALLY: There are entry, exit, take profit, and continuation signal components in relation to the Baseline to the rest of the NNFX Algorithm stack (ATR/C1/C2/Vol Indicator/Exit Indicator), including but limited to the "1 candle rule" and the "7 candle rule" as per NNFX.
Implementing alerts that are significant that also factor in these rules while reducing alert spam/false signals would be ideal, but it's also the HTF/Daily chart - visually, entry/exit/continuation signal alignment is easy to spot when trading 1D - alerts may be redundant/a pursuit in diminishing returns (for now).
//-------------------------------------------------------------------
// Acknowledgements/Reference:
// jiehonglim, NNFX Baseline Script - Moving Averages
//
// Fractured, Many Moving Averages
//
// everget, Jurik Moving Average/JMA
//
// 03.freeman, InfoPanel Divergence Indicator
//
// Ggqmna Volume stops
//
// Libertus RSI Divs
//
// ChrisMoody, CM_Price-Action-Bars-Price Patterns That Work
//
// Erwinbeckers SSL Channel
//

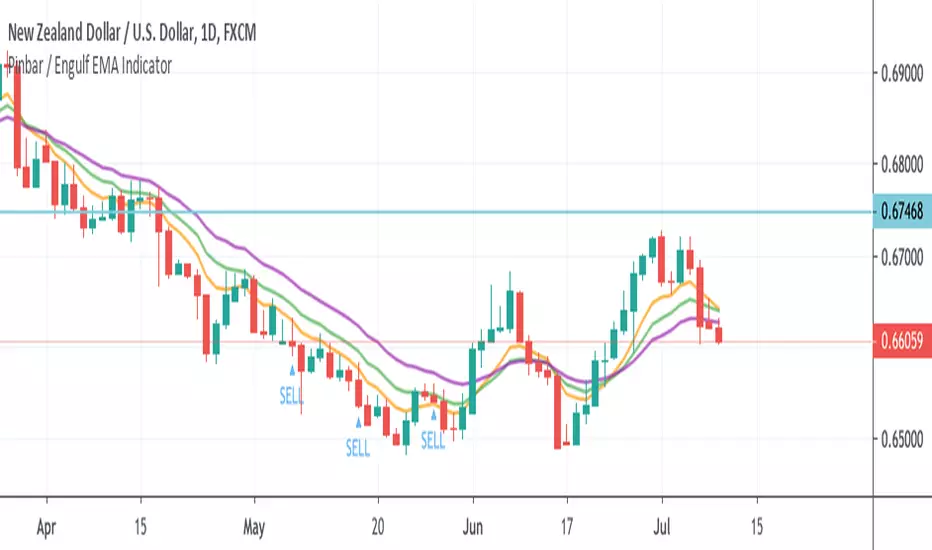
Pinbar / Engulf EMA IndicatorThis indicator is built based on the video by ForexSignals TV (no association on my part with them), published on July 5th, 2019 titled "SIMPLE & PROFITABLE Trend-following Forex Trading Strategy!"
The basic premiss is to use the 8,13,21 EMAs, make sure they have not crossed in the previous 3 bars, then look for engulfing bars or pinbars for the current direction. Meaning if the trend is up, look for bullish engulfer or pinbars, and bearish ones if the trend is down. Also, the pin must have crossed the 8EMA but not the 21EMA.
When determining to act on the signal, the video recommends only executing a buy/sell if the the current trend in the anchor chart is trending in the same direction (trending up only enter buys, trending down, only enter sells).
The script overlays a BUY or SELL tag under the bar that meets the above criteria.
FX Meter ScriptA while ago, we wrote* about the usefulness of using a currency strength meter and how you can build one from scratch.
See here: www.globalprime.com.au
Now we've taken this little project to the next level by visually spotting, via color signals in a dashboard and alerts, when a potential new trend might be developing in a currency pair.
*It's critical that you first read that article before you jump into reading this one or else you could get easily lost.
The script gives a trigger every time two currencies show diverging flows via opposing moving average slopes.
The signals originate from a first chart where currency indexes can be found, calculated through a formula, in various thin lines. Then a moving average to each currency index is applied so that it can smooth out the lines (what I call Micro moving averages – thicker lines -) and is usually a 4-5 period MA, with the key input to pay attention being the slope. One can perform their own tests on what works best for their particular trading style. The smaller the period in the moving average, the more responsive to changes in biases but the downside is that you will get a greater number of false moves. In the windows below the 1st chart, the stochRSI is calculated for each currency index (these values originate from the currency index and not from the applied MA). By default, a 25-period is applied to both RSI and Stoch length.
A 2nd chart that looks at the same logic is also accounted for to build this script, but instead of checking the micro trend, it applies a 25MA to the currency index, so it looks at what I call the slope of the macro trend. In this case, by default, a 125-period is applied to both RSI and Stoch length.
We had in mind to transition from just eye-balling and monitoring these charts manually to build a script via Tradingview that makes calculations real time (whenever the change in the moving average slope first occurs, and not when the bar/line closes), so that one can decide whether or not its a signal worth trading as part of a new trend emerging. Note, this is not so much a signal-triggering indicator but rather a tool to constantly be on the lookout monitoring what currencies might start to develop trends.
The actual script consists of a dashboard with different colored rectangles being triggered depending on the quality of the signal.
We will be happy to discuss it further with anyone who is interested in exploiting all the benefits that it can offer.
The way you add the script into your Tradingview chart is by first copy everything in the txt file. Then go to Pine editor (bottom middle-left) in your tradingview chart, delete everything there, then Paste the script. Then click Add to Chart (top right of the pine editor).
Note, you should add via the Anchored Text function the following list of pairs below, in this alphabetic order, on the right-hand side of the chart, as demonstrated above:
AUDCAD
AUDJPY
AUDNZD
AUDUSD
CADJPY
EURAUD
EURJPY
EURCAD
EURNZD
EURGBP
EURUSD
GBPAUD
GBPCAD
GBPJPY
GBPNZD
GBPUSD
NZDCAD
NZDJPY
NZDUSD
USDCAD
USDJPY
There are only 2 rules for the script to trigger a signal (see below). However, as I will elaborate further down, there are up to 6 different colors we can grade a signal
RULE 1 -> 2 moving averages, which are a calculation applied to a currency index as shown in the micro trend above, exhibit slopes in the opposite direction.
RULE 2 -> The Stoch RSI cannot be in overbought conditions if the slope of the moving average points higher or in oversold if the slope points lower.
Note 1: Even if the chart is a 60m timeframe by default (can be changed to any timeframe(, one gets the signal the moment the change of slope is identified, which means the indicator monitors changes in price tick by tick, and not on a candle close, otherwise one would get the trigger too late.
As an example of the highest-graded signal triggering (in green), a few hours ago we were given the visual cue that GBPCAD was experiencing a change of behavior. If we crosscheck the time the green-colored trigger was given with the actual GBPCAD chart, this is what we can observe. The pair is 30p higher since the trigger.
HOW TO SETUP ALERTS
One can easily setup a notification window each time the above rules are met, for example, if the EUR MA slope changes to bullish, and the AUD MA slope changes to bearish, and none of the 2 currency index values corresponding to these 2 moving averages (EUR and AUD) show a stoch RSI in overbought (above 80) in the case of the EUR, or oversold (below 20) in the case of the AUD, then the notification pop up would show a customized line: Long EURAUD
Note 1: Recording the slope of the macro moving average, which is usually a 25period MA applied to the currency index, is not included as part of the rules to trigger a signal, but it is taken into account to grade the quality of each signal.
Note 2: I recommend each signal to be triggered once or if you prefer, simply monitor the chart visually on the change of colors via the dashboard. The calculation resets and can appear again the moment that the slope changes to the opposite direction, so it’s a very dynamic indicator that will alert you the second a pair of currencies starts trending.
Note 3: When the signal is triggered, the indicator draws a colored rectangle. Each signal notification should be colored based on the following logic below.
LOGIC TO QUALIFY SIGNALS
-> Any long micro position with Macro MA in full agreement (ie/ Long EURAUD, Macro EUR up, Macro AUD down) is highlighted with green color
-> Any long micro position with macro moving averages in partial agreement (for example Long EURAUD, Macro EUR up AUD up) is highlighted with blue color
-> Any long micro position with macro moving averages in full disagreement (for example Long EURAUD, Macro EUR down AUD up) is highlighted with magenta color
-> Any short micro position with macro moving averages in full agreement (for example Short EURAUD, Macro EUR down AUD up) is highlighted with red color
-> Any short micro position with macro moving averages in partial agreement (for example Short EURAUD, Macro EUR up AUD up) is highlighted with orange color
-> Any short micro position with macro moving averages in full disagreement (for example Short EURAUD, Macro EUR up AUD down) is highlighted with purple color
PARAMETERS IN THE SCRIPT SETTINGS
Overbought/oversold: One can modify the stoch RSI level from which the indicator considers the value to be in overbought or oversold conditions. As a rule of thumb, consider 20/30 for oversold and 70/80 for oversold.
Slopes micro/macro MAs: One can edit the slope of the micro MA period (rule of thumb 4-5) and the macro MA (by default 25).
Value StochRSI: The default inputs are K 3, D 3, RSI Length 25, Stoch Length 25 for the micro and 125 period for the macro.
Change colors: One can edit the assigned colors in the signals dashboard.
Timeframe applied: The indicator has the flexibility to be applied to any timeframe, not just the 60m by default. Simply change the timeframe temporality.
CURRENCY INDEXES FORMULAS
It is the responsibility of the user to keep the values of the indexes updated. Find a recent sample below, as per values in early April. What this means is that at least once a week, in order to not let the values outdated, you should update the script with the latest valuations in the denominator.
NZD INDEX -> FX_IDC:NZDAUD/0.96+FX:NZDJPY/75.81+FX:NZDUSD/0.68+FX_IDC:NZDEUR/0.6+FX_IDC:NZDGBP/0.52+FX:NZDCHF/0.69+FX:NZDCAD/0.9
EUR INDEX -> FX:EURUSD/1.13+FX:EURJPY/125.5+FX:EURGBP/0.87+FX:EURCHF/1.135+FX:EURCAD/1.49+FX:EURNZD/1.655+FX:EURAUD/1.59
JPY INDEX -> 1/(FX:USDJPY/110.5+FX:EURJPY/125.5+FX:AUDJPY/79+FX:NZDJPY/75.5+FX:GBPJPY/144.5+FX:CHFJPY/110.5+FX:CADJPY/84)
USD INDEX -> FX_IDC:USDEUR/0.88+FX:USDJPY/110.5+FX_IDC:USDGBP/0.77+FX:USDCHF+FX:USDCAD/1.315+FX_IDC:USDNZD/1.46+FX_IDC:USDAUD/1.4
CAD INDEX-> FX_IDC:CADAUD/1.07+FX_IDC:CADNZD/1.11+FX:CADJPY/84.27+FX_IDC:CADUSD/0.76+FX_IDC:CADEUR/0.67+FX:CADCHF/0.76+FX_IDC:CADGBP/0.58
GBP INDEX -> FX:GBPAUD/1.83+FX:GBPNZD/1.91+FX:GBPJPY/144.5+FX_IDC:GBPEUR/1.15+FX:GBPCHF/1.31+FX:GBPUSD/1.31+FX:GBPCAD/1.71
Remember, I have provided a manual on how to build a currency strength meter. That’s what you will need to do first if you want to obtain the actual currency indexes other than just the indicator, which is just the visual cue to get you alerted when the slopes turn.
Once you’ve created your indexes via tradingview, you then apply a moving average to each index. Then apply the stochrsi 25 period to each index. For the macro trend, I make the same calculations, but the period of the MA is 25 instead of 4, while the stoch rsi is 125 periods vs 25 periods.
FINAL NOTE
This is a tool that should be interpreted as visual assistance, via the dashboard, to get that first cue when opposing micro slopes via the FX meter occur. However, you still need to check the technical context of the pair (levels marked, proj reached, etc.) but that first cue is a major time saver to constantly spot what's trending in FX. The permutations u can play with, as part of this script, are significant. You can tweak the timeframes you use, the periods of the moving averages, etc. I find the micro and macro trend combos when either a green or red signals is triggered the most reliable, with positions to be exploited via 15m and hourly under the right technical context.

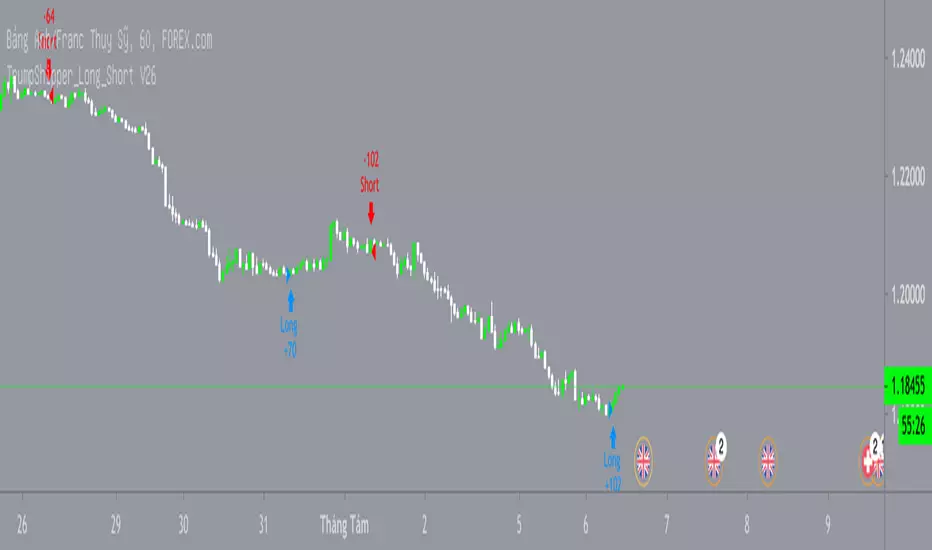
Amazing Crossover System - 100+ pips per day!I got the main concept for this system on another site. While I have made one important change, I must stress that the heart of this system was created by someone else! We must give credit where credit is due!
Y'all know baby pips. @ForexPhantom published about this system and did both back and forward test around 10 years ago.
I found it on the sit and now I put it to code to see how it performs. I assume 10 points spread for every trade. I use Renesource or AxiTrader to get the low spreads.
There are 2 mods, the single trades and constant trading on the direction.
Main concept
Indicators
5 EMA -- YELLOW
10 EMA -- RED
RSI (10 - Apply to Median Price: HL/2) -- One level at 50.
TIME FRAME
1 Hour Only (very important!)
PAIRS
Virtually any pair seems to work as this is strictly technical analysis.
I recommend sticking to the main currencies and avoiding cross currencies (just his preference).
WHEN TO ENTER A TRADE
Enter LONG when the Yellow EMA crosses the Red EMA from underneath.
RSI must be approaching 50 from the BOTTOM and cross 50 to warrant entry.
Enter SHORT when the Yellow EMA crosses the Red EMA from the top.
RSI must be approaching 50 from the TOP and cross 50 to warrant entry.
I've attached a picture which demonstrates all these conditions.
That's it!
f.bpcdn.co


Daily OHLPlots the daily open high low for any chart on any market.
Work very well for all crypto exchanges.
When using for Traditional markets, please use data from Forex.com due to various exchanges running on different time zones.

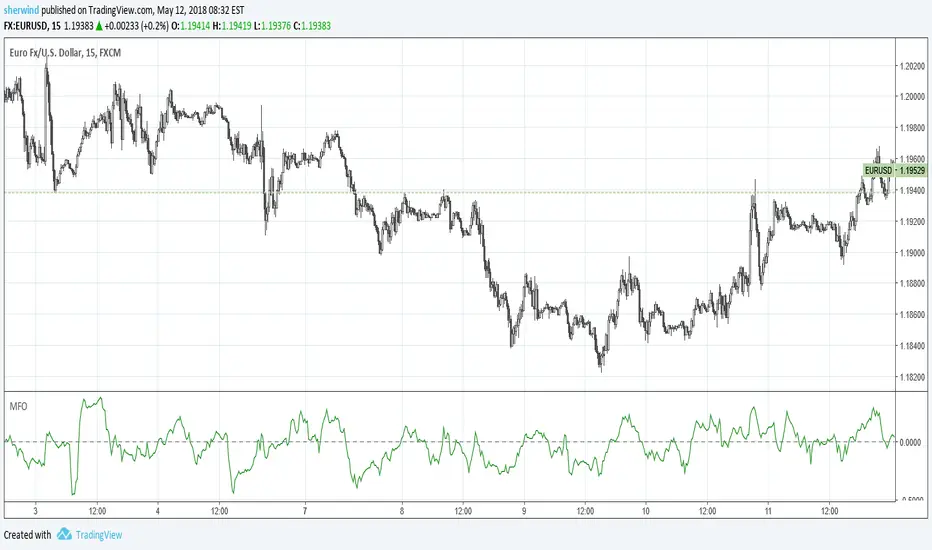
Money Flow Oscillator 2A volume indicator that measures buying and selling pressure over a given lookback period.
As described at traders.com
See also:
- Are price updates a good proxy for actual traded volume in FX?
- Using Tick Volume in Forex: A Clear NVO Based Example
Money Flow OscillatorMeasures buying and selling pressure over a given lookback period.
As described at traders.com
See also:
- Are price updates a good proxy for actual traded volume in FX?
- Using Tick Volume in Forex: A Clear NVO Based Example