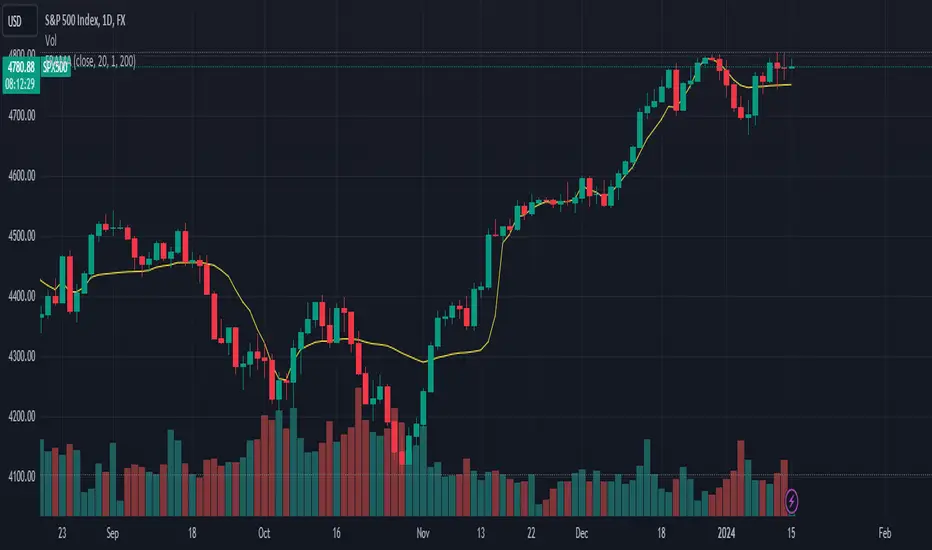
Volume-supported Fractal SRModified version of SynapticEX's Volume-supported Fractal S/R with EMA instead of SMA, pinescript 4 port, and EMA20/EMA50 defaults for support and resistance.
EMA20 = red/green
EMA50 = orange/yellow
Recherche dans les scripts pour "fractals"

[PX] Level & TrendlinesThe indicator identifies the intermediate fractal pattern, where neighboring fractals are either higher or lower. It plots horizontal level and trendlines based on those fractals and comes with a variety of settings.
If you are looking for someone to develop your on indicator or trading strategy, don't hesitate to get in touch with me here on TradingView or below.
Contact:
www.pascal-simon.de
info@pascal-simon.de


Uncle Mo's Ultimate Ichimoku V1Main features:
2 x Ichimoku Cloud
5 x EMA
2 x MA
1 x HullMA
Williams Fractals
Study is based around trader @br0qn 's Ichimoku script.
Credits also go to:
@RicardoSantos for the Bill Williams Fractals
@EmilianoMesa for the EMAs/MAs
@mohamed982 for the HullMA
The script is open source so please feel free to change it around. I'd greatly appreciate it if you could suggest ways to improve it.
Happy trading!

Fractal Regression Bands [DW]This study is an experimental regression curve built around fractal and ATR calculations.
First, Williams Fractals are calculated, and used as anchoring points.
Next, high anchor points are connected to negative sloping lines, and low anchor points to positive sloping lines. The slope is a specified percentage of the current ATR over the sampling period.
The median between the positive and negative sloping lines is then calculated, then the best fit line (linear regression) of the median is calculated to generate the basis line.
Lastly, a Golden Mean ATR is taken of price over the sampling period and multiplied by 1/2, 1, 2, and 3. The results are added and subtracted from the basis line to generate the bands.
Williams Fractals are included in the plots. The color scheme indicated whether each fractal is engulfing or non-engulfing.
Custom bar color scheme is included.

FRAMA (Ehlers true modified calculation)Credit goes to Shizaru for the original calculation. I made just a few fixes, so that the calculation is really that of Ehlers.
Fixed H2 and L2 period, fixed w natural logarithm
FibADX MTF Dashboard — DMI/ADX with Fibonacci DominanceFibADX MTF Dashboard — DMI/ADX with Fibonacci Dominance (φ)
This indicator fuses classic DMI/ADX with the Fibonacci Golden Ratio to score directional dominance and trend tradability across multiple timeframes in one clean panel.
What’s unique
• Fibonacci dominance tiers:
• BULL / BEAR → one side slightly stronger
• STRONG when one DI ≥ 1.618× the other (φ)
• EXTREME when one DI ≥ 2.618× (φ²)
• Rounded dominance % in the +DI/−DI columns (e.g., STRONG BULL 72%).
• ADX column modes: show the value (with strength bar ▂▃▅… and slope ↗/↘) or a tier (Weak / Tradable / Strong / Extreme).
• Configurable intraday row (30m/1H/2H/4H) + D/W/M toggles.
• Threshold line: color & width; Extended (infinite both ways) or Not extended (historical plot).
• Theme presets (Dark / Light / High Contrast) or full custom colors.
• Optional panel shading when all selected TFs are strong (and optionally directionally aligned).
How to use
1. Choose an intraday TF (30/60/120/240). Enable D/W/M as needed.
2. Use ADX ≥ threshold (e.g., 21 / 34 / 55) to find tradable trends.
3. Read the +DI/−DI labels to confirm bias (BULL/BEAR) and conviction (STRONG/EXTREME).
4. Prefer multi-TF alignment (e.g., 4H & D & W all strong bull).
5. Treat EXTREME as a momentum regime—trail tighter and scale out into spikes.
Alerts
• All selected TFs: Strong BULL alignment
• All selected TFs: Strong BEAR alignment
Notes
• Smoothing selectable: RMA (Wilder) / EMA / SMA.
• Percentages are whole numbers (72%, not 72.18%).
• Shorttitle is FibADX to comply with TV’s 10-char limit.
Why We Use Fibonacci in FibADX
Traditional DMI/ADX indicators rely on fixed numeric thresholds (e.g., ADX > 20 = “tradable”), but they ignore the relationship between +DI and −DI, which is what really determines trend conviction.
FibADX improves on this by introducing the Fibonacci Golden Ratio (φ ≈ 1.618) to measure directional dominance and classify trend strength more intelligently.
⸻
1. Fibonacci as a Natural Strength Threshold
The golden ratio φ appears everywhere in nature, growth cycles, and fractals.
Since financial markets also behave fractally, Fibonacci levels reflect natural crowd behavior and trend acceleration points.
In FibADX:
• When one DI is slightly larger than the other → BULL or BEAR (mild advantage).
• When one DI is at least 1.618× the other → STRONG BULL or STRONG BEAR (trend conviction).
• When one DI is 2.618× or more → EXTREME BULL or EXTREME BEAR (high momentum regime).
This approach adds structure and consistency to trend classification.
⸻
2. Why 1.618 and 2.618 Instead of Random Numbers
Other traders might pick thresholds like 1.5 or 2.0, but φ has special mathematical properties:
• φ is the most irrational ratio, meaning proportions based on φ retain structure even when scaled.
• Using φ makes FibADX naturally adaptive to all timeframes and asset classes — stocks, crypto, forex, commodities.
⸻
3 . Trading Advantages
Using the Fibonacci Golden Ratio inside DMI/ADX has several benefits:
• Better trend filtering → Avoid false DI crossovers without conviction.
• Catch early momentum shifts → Spot when dominance ratios approach φ before ADX reacts.
• Consistency across markets → Because φ is scalable and fractal, it works everywhere.
⸻
4. How FibADX Uses This
FibADX combines:
• +DI vs −DI ratio → Measures directional dominance.
• φ thresholds (1.618, 2.618) → Classifies strength into BULL, STRONG, EXTREME.
• ADX threshold → Confirms whether the move is tradable or just noise.
• Multi-timeframe dashboard → Aligns bias across 4H, D, W, M.
⸻
Quick Blurb for TradingView
FibADX uses the Fibonacci Golden Ratio (φ ≈ 1.618) to classify trend strength.
Unlike classic DMI/ADX, FibADX measures how much one side dominates:
• φ (1.618) = STRONG trend conviction
• φ² (2.618) = EXTREME momentum regime
This creates an adaptive, fractal-aware framework that works across stocks, crypto, forex, and commodities.
⚠️ Disclaimer : This script is provided for educational purposes only.
It does not constitute financial advice.
Use at your own risk. Always do your own research before making trading decisions.
Created by @nomadhedge

KST Strategy [Skyrexio]Overview
KST Strategy leverages Know Sure Thing (KST) indicator in conjunction with the Williams Alligator and Moving average to obtain the high probability setups. KST is used for for having the high probability to enter in the direction of a current trend when momentum is rising, Alligator is used as a short term trend filter, while Moving average approximates the long term trend and allows trades only in its direction. Also strategy has the additional optional filter on Choppiness Index which does not allow trades if market is choppy, above the user-specified threshold. Strategy has the user specified take profit and stop-loss numbers, but multiplied by Average True Range (ATR) value on the moment when trade is open. The strategy opens only long trades.
Unique Features
ATR based stop-loss and take profit. Instead of fixed take profit and stop-loss percentage strategy utilizes user chosen numbers multiplied by ATR for its calculation.
Configurable Trading Periods. Users can tailor the strategy to specific market windows, adapting to different market conditions.
Optional Choppiness Index filter. Strategy allows to choose if it will use the filter trades with Choppiness Index and set up its threshold.
Methodology
The strategy opens long trade when the following price met the conditions:
Close price is above the Alligator's jaw line
Close price is above the filtering Moving average
KST line of Know Sure Thing indicator shall cross over its signal line (details in justification of methodology)
If the Choppiness Index filter is enabled its value shall be less than user defined threshold
When the long trade is executed algorithm defines the stop-loss level as the low minus user defined number, multiplied by ATR at the trade open candle. Also it defines take profit with close price plus user defined number, multiplied by ATR at the trade open candle. While trade is in progress, if high price on any candle above the calculated take profit level or low price is below the calculated stop loss level, trade is closed.
Strategy settings
In the inputs window user can setup the following strategy settings:
ATR Stop Loss (by default = 1.5, number of ATRs to calculate stop-loss level)
ATR Take Profit (by default = 3.5, number of ATRs to calculate take profit level)
Filter MA Type (by default = Least Squares MA, type of moving average which is used for filter MA)
Filter MA Length (by default = 200, length for filter MA calculation)
Enable Choppiness Index Filter (by default = true, setting to choose the optional filtering using Choppiness index)
Choppiness Index Threshold (by default = 50, Choppiness Index threshold, its value shall be below it to allow trades execution)
Choppiness Index Length (by default = 14, length used in Choppiness index calculation)
KST ROC Length #1 (by default = 10, value used in KST indicator calculation, more information in Justification of Methodology)
KST ROC Length #2 (by default = 15, value used in KST indicator calculation, more information in Justification of Methodology)
KST ROC Length #3 (by default = 20, value used in KST indicator calculation, more information in Justification of Methodology)
KST ROC Length #4 (by default = 30, value used in KST indicator calculation, more information in Justification of Methodology)
KST SMA Length #1 (by default = 10, value used in KST indicator calculation, more information in Justification of Methodology)
KST SMA Length #2 (by default = 10, value used in KST indicator calculation, more information in Justification of Methodology)
KST SMA Length #3 (by default = 10, value used in KST indicator calculation, more information in Justification of Methodology)
KST SMA Length #4 (by default = 15, value used in KST indicator calculation, more information in Justification of Methodology)
KST Signal Line Length (by default = 10, value used in KST indicator calculation, more information in Justification of Methodology)
User can choose the optimal parameters during backtesting on certain price chart.
Justification of Methodology
Before understanding why this particular combination of indicator has been chosen let's briefly explain what is KST, Williams Alligator, Moving Average, ATR and Choppiness Index.
The KST (Know Sure Thing) is a momentum oscillator developed by Martin Pring. It combines multiple Rate of Change (ROC) values, smoothed over different timeframes, to identify trend direction and momentum strength. First of all, what is ROC? ROC (Rate of Change) is a momentum indicator that measures the percentage change in price between the current price and the price a set number of periods ago.
ROC = 100 * (Current Price - Price N Periods Ago) / Price N Periods Ago
In our case N is the KST ROC Length inputs from settings, here we will calculate 4 different ROCs to obtain KST value:
KST = ROC1_smooth × 1 + ROC2_smooth × 2 + ROC3_smooth × 3 + ROC4_smooth × 4
ROC1 = ROC(close, KST ROC Length #1), smoothed by KST SMA Length #1,
ROC2 = ROC(close, KST ROC Length #2), smoothed by KST SMA Length #2,
ROC3 = ROC(close, KST ROC Length #3), smoothed by KST SMA Length #3,
ROC4 = ROC(close, KST ROC Length #4), smoothed by KST SMA Length #4
Also for this indicator the signal line is calculated:
Signal = SMA(KST, KST Signal Line Length)
When the KST line rises, it indicates increasing momentum and suggests that an upward trend may be developing. Conversely, when the KST line declines, it reflects weakening momentum and a potential downward trend. A crossover of the KST line above its signal line is considered a buy signal, while a crossover below the signal line is viewed as a sell signal. If the KST stays above zero, it indicates overall bullish momentum; if it remains below zero, it points to bearish momentum. The KST indicator smooths momentum across multiple timeframes, helping to reduce noise and provide clearer signals for medium- to long-term trends.
Next, let’s discuss the short-term trend filter, which combines the Williams Alligator and Williams Fractals. Williams Alligator
Developed by Bill Williams, the Alligator is a technical indicator that identifies trends and potential market reversals. It consists of three smoothed moving averages:
Jaw (Blue Line): The slowest of the three, based on a 13-period smoothed moving average shifted 8 bars ahead.
Teeth (Red Line): The medium-speed line, derived from an 8-period smoothed moving average shifted 5 bars forward.
Lips (Green Line): The fastest line, calculated using a 5-period smoothed moving average shifted 3 bars forward.
When the lines diverge and align in order, the "Alligator" is "awake," signaling a strong trend. When the lines overlap or intertwine, the "Alligator" is "asleep," indicating a range-bound or sideways market. This indicator helps traders determine when to enter or avoid trades.
The next indicator is Moving Average. It has a lot of different types which can be chosen to filter trades and the Least Squares MA is used by default settings. Let's briefly explain what is it.
The Least Squares Moving Average (LSMA) — also known as Linear Regression Moving Average — is a trend-following indicator that uses the least squares method to fit a straight line to the price data over a given period, then plots the value of that line at the most recent point. It draws the best-fitting straight line through the past N prices (using linear regression), and then takes the endpoint of that line as the value of the moving average for that bar. The LSMA aims to reduce lag and highlight the current trend more accurately than traditional moving averages like SMA or EMA.
Key Features:
It reacts faster to price changes than most moving averages.
It is smoother and less noisy than short-term EMAs.
It can be used to identify trend direction, momentum, and potential reversal points.
ATR (Average True Range) is a volatility indicator that measures how much an asset typically moves during a given period. It was introduced by J. Welles Wilder and is widely used to assess market volatility, not direction.
To calculate it first of all we need to get True Range (TR), this is the greatest value among:
High - Low
abs(High - Previous Close)
abs(Low - Previous Close)
ATR = MA(TR, n) , where n is number of periods for moving average, in our case equals 14.
ATR shows how much an asset moves on average per candle/bar. A higher ATR means more volatility; a lower ATR means a calmer market.
The Choppiness Index is a technical indicator that quantifies whether the market is trending or choppy (sideways). It doesn't indicate trend direction — only the strength or weakness of a trend. Higher Choppiness Index usually approximates the sideways market, while its low value tells us that there is a high probability of a trend.
Choppiness Index = 100 × log10(ΣATR(n) / (MaxHigh(n) - MinLow(n))) / log10(n)
where:
ΣATR(n) = sum of the Average True Range over n periods
MaxHigh(n) = highest high over n periods
MinLow(n) = lowest low over n periods
log10 = base-10 logarithm
Now let's understand how these indicators work in conjunction and why they were chosen for this strategy. KST indicator approximates current momentum, when it is rising and KST line crosses over the signal line there is high probability that short term trend is reversing to the upside and strategy allows to take part in this potential move. Alligator's jaw (blue) line is used as an approximation of a short term trend, taking trades only above it we want to avoid trading against trend to increase probability that long trade is going to be winning.
Almost the same for Moving Average, but it approximates the long term trend, this is just the additional filter. If we trade in the direction of the long term trend we increase probability that higher risk to reward trade will hit the take profit. Choppiness index is the optional filter, but if it turned on it is used for approximating if now market is in sideways or in trend. On the range bounded market the potential moves are restricted. We want to decrease probability opening trades in such condition avoiding trades if this index is above threshold value.
When trade is open script sets the stop loss and take profit targets. ATR approximates the current volatility, so we can make a decision when to exit a trade based on current market condition, it can increase the probability that strategy will avoid the excessive stop loss hits, but anyway user can setup how many ATRs to use as a stop loss and take profit target. As was said in the Methodology stop loss level is obtained by subtracting number of ATRs from trade opening candle low, while take profit by adding to this candle's close.
Backtest Results
Operating window: Date range of backtests is 2023.01.01 - 2025.05.01. It is chosen to let the strategy to close all opened positions.
Commission and Slippage: Includes a standard Binance commission of 0.1% and accounts for possible slippage over 5 ticks.
Initial capital: 10000 USDT
Percent of capital used in every trade: 60%
Maximum Single Position Loss: -5.53%
Maximum Single Profit: +8.35%
Net Profit: +5175.20 USDT (+51.75%)
Total Trades: 120 (56.67% win rate)
Profit Factor: 1.747
Maximum Accumulated Loss: 1039.89 USDT (-9.1%)
Average Profit per Trade: 43.13 USDT (+0.6%)
Average Trade Duration: 27 hours
These results are obtained with realistic parameters representing trading conditions observed at major exchanges such as Binance and with realistic trading portfolio usage parameters.
How to Use
Add the script to favorites for easy access.
Apply to the desired timeframe and chart (optimal performance observed on 1h BTC/USDT).
Configure settings using the dropdown choice list in the built-in menu.
Set up alerts to automate strategy positions through web hook with the text: {{strategy.order.alert_message}}
Disclaimer:
Educational and informational tool reflecting Skyrexio commitment to informed trading. Past performance does not guarantee future results. Test strategies in a simulated environment before live implementation.

Rally Base Drop SND Pivots Strategy [LuxAlgo X PineIndicators]This strategy is based on the Rally Base Drop (RBD) SND Pivots indicator developed by LuxAlgo. Full credit for the concept and original indicator goes to LuxAlgo.
The Rally Base Drop SND Pivots Strategy is a non-repainting supply and demand trading system that detects pivot points based on Rally, Base, and Drop (RBD) candles. This strategy automatically identifies key market structure levels, allowing traders to:
Identify pivot-based supply and demand (SND) zones.
Use fixed criteria for trend continuation or reversals.
Filter out market noise by requiring structured price formations.
Enter trades based on breakouts of key SND pivot levels.
How the Rally Base Drop SND Pivots Strategy Works
1. Pivot Point Detection Using RBD Candles
The strategy follows a rigid market structure methodology, where pivots are detected only when:
A Rally (R) consists of multiple consecutive bullish candles.
A Drop (D) consists of multiple consecutive bearish candles.
A Base (B) is identified as a transition between Rallies and Drops, acting as a pivot point.
The pivot level is confirmed when the formation is complete.
Unlike traditional fractal-based pivots, RBD Pivots enforce stricter structural rules, ensuring that each pivot:
Has a well-defined bullish or bearish price movement.
Reduces false signals caused by single-bar fluctuations.
Provides clear supply and demand levels based on structured price movements.
These pivot levels are drawn on the chart using color-coded boxes:
Green zones represent bullish pivot levels (Rally Base formations).
Red zones represent bearish pivot levels (Drop Base formations).
Once a pivot is confirmed, the high or low of the base candle is used as the reference level for future trades.
2. Trade Entry Conditions
The strategy allows traders to select from three trading modes:
Long Only – Only takes long trades when bullish pivot breakouts occur.
Short Only – Only takes short trades when bearish pivot breakouts occur.
Long & Short – Trades in both directions based on pivot breakouts.
Trade entry signals are triggered when price breaks through a confirmed pivot level:
Long Entry:
A bullish pivot level is formed.
Price breaks above the bullish pivot level.
The strategy enters a long position.
Short Entry:
A bearish pivot level is formed.
Price breaks below the bearish pivot level.
The strategy enters a short position.
The strategy includes an optional mode to reverse long and short conditions, allowing traders to experiment with contrarian entries.
3. Exit Conditions Using ATR-Based Risk Management
This strategy uses the Average True Range (ATR) to calculate dynamic stop-loss and take-profit levels:
Stop-Loss (SL): Placed 1 ATR below entry for long trades and 1 ATR above entry for short trades.
Take-Profit (TP): Set using a Risk-Reward Ratio (RR) multiplier (default = 6x ATR).
When a trade is opened:
The entry price is recorded.
ATR is calculated at the time of entry to determine stop-loss and take-profit levels.
Trades exit automatically when either SL or TP is reached.
If reverse conditions mode is enabled, stop-loss and take-profit placements are flipped.
Visualization & Dynamic Support/Resistance Levels
1. Pivot Boxes for Market Structure
Each pivot is marked with a colored box:
Green boxes indicate bullish demand zones.
Red boxes indicate bearish supply zones.
These boxes remain on the chart to act as dynamic support and resistance levels, helping traders identify key price reaction zones.
2. Horizontal Entry, Stop-Loss, and Take-Profit Lines
When a trade is active, the strategy plots:
White line → Entry price.
Red line → Stop-loss level.
Green line → Take-profit level.
Labels display the exact entry, SL, and TP values, updating dynamically as price moves.
Customization Options
This strategy offers multiple adjustable settings to optimize performance for different market conditions:
Trade Mode Selection → Choose between Long Only, Short Only, or Long & Short.
Pivot Length → Defines the number of required Rally & Drop candles for a pivot.
ATR Exit Multiplier → Adjusts stop-loss distance based on ATR.
Risk-Reward Ratio (RR) → Modifies take-profit level relative to risk.
Historical Lookback → Limits how far back pivot zones are displayed.
Color Settings → Customize pivot box colors for bullish and bearish setups.
Considerations & Limitations
Pivot Breakouts Do Not Guarantee Reversals. Some pivot breaks may lead to continuation moves instead of trend reversals.
Not Optimized for Low Volatility Conditions. This strategy works best in trending markets with strong momentum.
ATR-Based Stop-Loss & Take-Profit May Require Optimization. Different assets may require different ATR multipliers and RR settings.
Market Noise May Still Influence Pivots. While this method filters some noise, fake breakouts can still occur.
Conclusion
The Rally Base Drop SND Pivots Strategy is a non-repainting supply and demand system that combines:
Pivot-based market structure analysis (using Rally, Base, and Drop candles).
Breakout-based trade entries at confirmed SND levels.
ATR-based dynamic risk management for stop-loss and take-profit calculation.
This strategy helps traders:
Identify high-probability supply and demand levels.
Trade based on structured market pivots.
Use a systematic approach to price action analysis.
Automatically manage risk with ATR-based exits.
The strict pivot detection rules and built-in breakout validation make this strategy ideal for traders looking to:
Trade based on market structure.
Use defined support & resistance levels.
Reduce noise compared to traditional fractals.
Implement a structured supply & demand trading model.
This strategy is fully customizable, allowing traders to adjust parameters to fit their market and trading style.
Full credit for the original concept and indicator goes to LuxAlgo.

MMXM ICT [TradingFinder] Market Maker Model PO3 CHoCH/CSID + FVG🔵 Introduction
The MMXM Smart Money Reversal leverages key metrics such as SMT Divergence, Liquidity Sweep, HTF PD Array, Market Structure Shift (MSS) or (ChoCh), CISD, and Fair Value Gap (FVG) to identify critical turning points in the market. Designed for traders aiming to analyze the behavior of major market participants, this setup pinpoints strategic areas for making informed trading decisions.
The document introduces the MMXM model, a trading strategy that identifies market maker activity to predict price movements. The model operates across five distinct stages: original consolidation, price run, smart money reversal, accumulation/distribution, and completion. This systematic approach allows traders to differentiate between buyside and sellside curves, offering a structured framework for interpreting price action.
Market makers play a pivotal role in facilitating these movements by bridging liquidity gaps. They continuously quote bid (buy) and ask (sell) prices for assets, ensuring smooth trading conditions.
By maintaining liquidity, market makers prevent scenarios where buyers are left without sellers and vice versa, making their activity a cornerstone of the MMXM strategy.
SMT Divergence serves as the first signal of a potential trend reversal, arising from discrepancies between the movements of related assets or indices. This divergence is detected when two or more highly correlated assets or indices move in opposite directions, signaling a likely shift in market trends.
Liquidity Sweep occurs when the market targets liquidity in specific zones through false price movements. This process allows major market participants to execute their orders efficiently by collecting the necessary liquidity to enter or exit positions.
The HTF PD Array refers to premium and discount zones on higher timeframes. These zones highlight price levels where the market is in a premium (ideal for selling) or discount (ideal for buying). These areas are identified based on higher timeframe market behavior and guide traders toward lucrative opportunities.
Market Structure Shift (MSS), also referred to as ChoCh, indicates a change in market structure, often marked by breaking key support or resistance levels. This shift confirms the directional movement of the market, signaling the start of a new trend.
CISD (Change in State of Delivery) reflects a transition in price delivery mechanisms. Typically occurring after MSS, CISD confirms the continuation of price movement in the new direction.
Fair Value Gap (FVG) represents zones where price imbalance exists between buyers and sellers. These gaps often act as price targets for filling, offering traders opportunities for entry or exit.
By combining all these metrics, the Smart Money Reversal provides a comprehensive tool for analyzing market behavior and identifying key trading opportunities. It enables traders to anticipate the actions of major players and align their strategies accordingly.
MMBM :
MMSM :
🔵 How to Use
The Smart Money Reversal operates in two primary states: MMBM (Market Maker Buy Model) and MMSM (Market Maker Sell Model). Each state highlights critical structural changes in market trends, focusing on liquidity behavior and price reactions at key levels to offer precise and effective trading opportunities.
The MMXM model expands on this by identifying five distinct stages of market behavior: original consolidation, price run, smart money reversal, accumulation/distribution, and completion. These stages provide traders with a detailed roadmap for interpreting price action and anticipating market maker activity.
🟣 Market Maker Buy Model
In the MMBM state, the market transitions from a bearish trend to a bullish trend. Initially, SMT Divergence between related assets or indices reveals weaknesses in the bearish trend. Subsequently, a Liquidity Sweep collects liquidity from lower levels through false breakouts.
After this, the price reacts to discount zones identified in the HTF PD Array, where major market participants often execute buy orders. The market confirms the bullish trend with a Market Structure Shift (MSS) and a change in price delivery state (CISD). During this phase, an FVG emerges as a key trading opportunity. Traders can open long positions upon a pullback to this FVG zone, capitalizing on the bullish continuation.
🟣 Market Maker Sell Model
In the MMSM state, the market shifts from a bullish trend to a bearish trend. Here, SMT Divergence highlights weaknesses in the bullish trend. A Liquidity Sweep then gathers liquidity from higher levels.
The price reacts to premium zones identified in the HTF PD Array, where major sellers enter the market and reverse the price direction. A Market Structure Shift (MSS) and a change in delivery state (CISD) confirm the bearish trend. The FVG then acts as a target for the price. Traders can initiate short positions upon a pullback to this FVG zone, profiting from the bearish continuation.
Market makers actively bridge liquidity gaps throughout these stages, quoting continuous bid and ask prices for assets. This ensures that trades are executed seamlessly, even during periods of low market participation, and supports the structured progression of the MMXM model.
The price’s reaction to FVG zones in both states provides traders with opportunities to reduce risk and enhance precision. These pullbacks to FVG zones not only represent optimal entry points but also create avenues for maximizing returns with minimal risk.
🔵 Settings
Higher TimeFrame PD Array : Selects the timeframe for identifying premium/discount arrays on higher timeframes.
PD Array Period : Specifies the number of candles for identifying key swing points.
ATR Coefficient Threshold : Defines the threshold for acceptable volatility based on ATR.
Max Swing Back Method : Choose between analyzing all swings ("All") or a fixed number ("Custom").
Max Swing Back : Sets the maximum number of candles to consider for swing analysis (if "Custom" is selected).
Second Symbol for SMT : Specifies the second asset or index for detecting SMT divergence.
SMT Fractal Periods : Sets the number of candles required to identify SMT fractals.
FVG Validity Period : Defines the validity duration for FVG zones.
MSS Validity Period : Sets the validity duration for MSS zones.
FVG Filter : Activates filtering for FVG zones based on width.
FVG Filter Type : Selects the filtering level from "Very Aggressive" to "Very Defensive."
Mitigation Level FVG : Determines the level within the FVG zone (proximal, 50%, or distal) that price reacts to.
Demand FVG : Enables the display of demand FVG zones.
Supply FVG : Enables the display of supply FVG zones.
Zone Colors : Allows customization of colors for demand and supply FVG zones.
Bottom Line & Label : Enables or disables the SMT divergence line and label from the bottom.
Top Line & Label : Enables or disables the SMT divergence line and label from the top.
Show All HTF Levels : Displays all premium/discount levels on higher timeframes.
High/Low Levels : Activates the display of high/low levels.
Color Options : Customizes the colors for high/low lines and labels.
Show All MSS Levels : Enables display of all MSS zones.
High/Low MSS Levels : Activates the display of high/low MSS levels.
Color Options : Customizes the colors for MSS lines and labels.
🔵 Conclusion
The Smart Money Reversal model represents one of the most advanced tools for technical analysis, enabling traders to identify critical market turning points. By leveraging metrics such as SMT Divergence, Liquidity Sweep, HTF PD Array, MSS, CISD, and FVG, traders can predict future price movements with precision.
The price’s interaction with key zones such as PD Array and FVG, combined with pullbacks to imbalance areas, offers exceptional opportunities with favorable risk-to-reward ratios. This approach empowers traders to analyze the behavior of major market participants and adopt professional strategies for entry and exit.
By employing this analytical framework, traders can reduce errors, make more informed decisions, and capitalize on profitable opportunities. The Smart Money Reversal focuses on liquidity behavior and structural changes, making it an indispensable tool for financial market success.

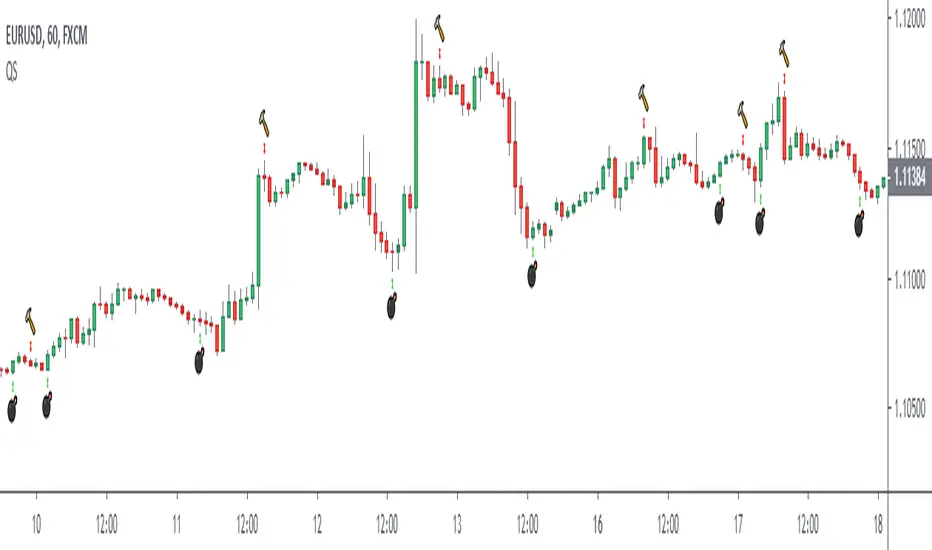
Trend Trader-Remastered StrategyOfficial Strategy for Trend Trader - Remastered
Indicator: Trend Trader-Remastered (TTR)
Overview:
The Trend Trader-Remastered is a refined and highly sophisticated implementation of the Parabolic SAR designed to create strategic buy and sell entry signals, alongside precision take profit and re-entry signals based on marked Bill Williams (BW) fractals. Built with a deep emphasis on clarity and accuracy, this indicator ensures that only relevant and meaningful signals are generated, eliminating any unnecessary entries or exits.
Please check the indicator details and updates via the link above.
Important Disclosure:
My primary objective is to provide realistic strategies and a code base for the TradingView Community. Therefore, the default settings of the strategy version of the indicator have been set to reflect realistic world trading scenarios and best practices.
Key Features:
Strategy execution date&time range.
Take Profit Reduction Rate: The percentage of progressive reduction on active position size for take profit signals.
Example:
TP Reduce: 10%
Entry Position Size: 100
TP1: 100 - 10 = 90
TP2: 90 - 9 = 81
Re-Entry When Rate: The percentage of position size on initial entry of the signal to determine re-entry.
Example:
RE When: 50%
Entry Position Size: 100
Re-Entry Condition: Active Position Size < 50
Re-Entry Fill Rate: The percentage of position size on initial entry of the signal to be completed.
Example:
RE Fill: 75%
Entry Position Size: 100
Active Position Size: 50
Re-Entry Order Size: 25
Final Active Position Size:75
Important: Even RE When condition is met, the active position size required to drop below RE Fill rate to trigger re-entry order.
Key Points:
'Process Orders on Close' is enabled as Take Profit and Re-Entry signals must be executed on candle close.
'Calculate on Every Tick' is enabled as entry signals are required to be executed within candle time.
'Initial Capital' has been set to 10,000 USD.
'Default Quantity Type' has been set to 'Percent of Equity'.
'Default Quantity' has been set to 10% as the best practice of investing 10% of the assets.
'Currency' has been set to USD.
'Commission Type' has been set to 'Commission Percent'
'Commission Value' has been set to 0.05% to reflect the most realistic results with a common taker fee value.

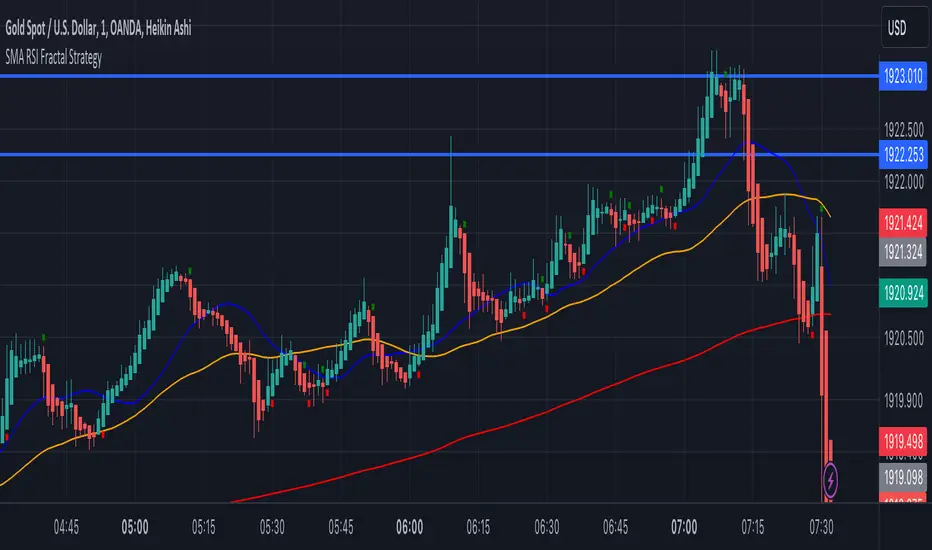
SMA RSI Fractal Strategy V4 Edit 1Made from RSI, SMA, and fractals. With the bands and signals for buy and sell entry. The colors are of opposite.
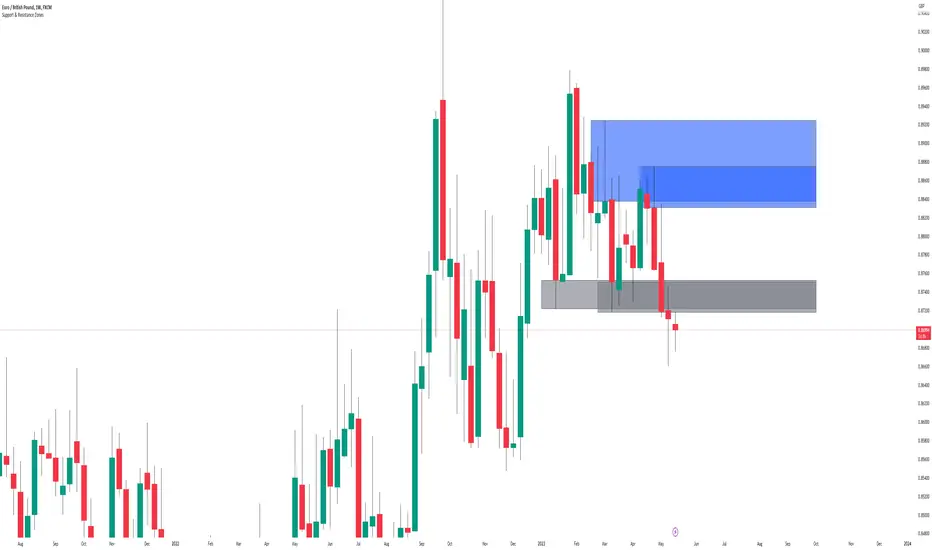
Support & Resistance ZonesTitle: A Comprehensive Guide to the Support & Resistance Zones Indicator
Introduction
In the world of technical analysis, the Support & Resistance Zones indicator plays a crucial role in identifying potential trading opportunities. These zones are essential for traders looking to capitalize on bounces or break and retests. In this article, we will delve into the specifics of the Support & Resistance Zones indicator, outlining how it works, how it finds and marks zones, and the various options available for traders.
What the indicator is about
The Support & Resistance Zones indicator, developed by @HarryCTC, is a powerful tool for detecting areas of potential price reversal or consolidation in a financial market. These zones are significant as they can act as a guide for traders to make informed decisions on entering or exiting positions. Specifically, the indicator helps identify:
1. Support Zones: Areas where the price has a tendency to bounce back up after falling, indicating a potential buying opportunity.
2. Resistance Zones: Areas where the price has a tendency to reverse after rising, indicating a potential selling opportunity.
How the indicator finds its zones
The Support & Resistance Zones indicator utilizes pivot points to identify potential support and resistance levels. By analyzing the fractal structure of the price chart, the indicator identifies key turning points, known as bull and bear fractals. The bull fractal is a high pivot point, while the bear fractal is a low pivot point.
The fractal structure is determined by the 'Switch Zone Period' input, which can be adjusted to suit the trader's preferences. A higher value will result in fewer zones being identified, while a lower value will result in more zones.
How it marks zones and why it marks zones
The indicator marks the support and resistance zones by creating rectangular boxes around the identified fractal points. The zones are extended horizontally from the fractal point, allowing traders to visualize the potential areas of price reversal.
The zones are marked for the following reasons:
1. To provide a clear visual representation of potential support and resistance levels.
2. To help traders identify potential entry and exit points based on the price's reaction to these zones.
3. To serve as a reference for stop-loss and take-profit levels when planning trades.
The indicator's for traders trading bounces or break and retests
Traders who focus on trading bounces or break and retests can benefit immensely from the Support & Resistance Zones indicator. By providing a visual representation of key support and resistance levels, the indicator enables traders to:
1. Identify potential buying opportunities at support zones where the price is likely to bounce back up.
2. Identify potential selling opportunities at resistance zones where the price is likely to reverse after rising.
3. Make informed decisions on stop-loss and take-profit levels based on the price's proximity to support and resistance zones.
4. Monitor the market for potential breakouts or breakdowns when the price breaches these zones.
Indicator options
The Support & Resistance Zones indicator offers several customizable options to suit the trader's preferences. These options include:
1. Switch Zone Period: Adjusts the number of periods used to calculate the fractal structure, influencing the number of identified zones.
2. No. of Displayed Zones: Determines the maximum number of zones displayed on the chart, ranging from 1 to 8.
3. Zone Extension: Adjusts the horizontal extension of the support and resistance zones.
4. Resistance Zone Color: Customizes the color of the resistance zone boxes.
5. Support Zone Color: Customizes the color of the support zone boxes.
6. Zone Border Color: Customizes the color of the zone box borders.
Conclusion
The Support & Resistance Zones indicator is a valuable tool for traders looking to identify potential trading opportunities based on the price's interaction with support and resistance levels. By providing a clear visual representation of these zones, the
indicator allows traders to make informed decisions on entry and exit points, stop-loss, and take-profit levels. With customizable options, the indicator can be tailored to suit individual trading preferences and strategies.
Trading ChannelTrading Channel aims to be a canvas on which to develop any strategy that the user feels comfortable with.
The greatest utility of the script lies in the fact that it plots a channel over the price action, as a support and resistance pivot, within which the price action develops.
It is a script of maximum simplicity in concept and development, but at the same time presents robust support to the price action and a quick visual aid complementary to any indicators that the user works with, feels comfortable with, and uses as a basis for their strategies.
The script includes the following features (most of them disabled by default, available for potential use without the need to add additional indicators):
Fast SMA
Medium SMA
Slow SMA (disabled)
Fast EMA (disabled)
Medium EMA (disabled)
Slow EMA (disabled)
Pivot
Pivot SMA
P Multiplier
Set of resistance and support pivots according to the studies of John L. Person (R3, R2, R1, S1, S2, S3 and midpoints) (disabled by default)
Channel for the current time period in use
Channels for extended time periods (disabled by default)
Various trend, momentum, and overbought/oversold indicating labels (note that the calculations for their representation are based on SMA's even though EMA's are visualized).
SMA's/EMA's
Both are available as both are used as basic indicators for different types of strategies. The default selection of SMA's in this case is based on the fact that the script development is largely based on the studies shared by John L. Person in the area of pivots and by Bill Williams in the area of fractals. Note also that for that same reason the various trend, momentum, and overbought/oversold indicating labels are calculated based on them.
Set of resistance and support pivots
They are included as a consultation tool especially for the higher time periods. They can be used to mark the most interesting supports/resistances and not lose sight of them while operating in lower time periods. Marking monthly, weekly, and daily pivots can be very useful. Additionally, marking S1 and R2 for bullish trends, S1 and R1 for ranges, and S2 and R1 for bearish trends can provide an even more precise framework to work on.
P Multiplier
It is set by default at 4, and is the basis for being able to consider during the use of a specific time frame, the price action with respect to higher time frames. It is the multiplier used for the generation of channels for extended time periods.
Channel for the current time period in use
It is a channel formed by the maximum and minimum closing of the last 21 periods. This value is modifiable and its adjustment depends on the asset under study. 24/7 markets show good results with this adjustment (in the case of BTC really good).
This channel represents a pivot in the form of a yellow middle line, with its support and resistance extremes on the upper green and lower red lines. The same green and red lines, referenced this time to the maximum, are added and serve as possible stop-loss marks.
Channels for extended time periods
Enabling the maximum and minimum channels for extended periods can provide a better idea of the price situation (it is recommended to disable the channel in use and enable the upper one for consultation, it provides a better vision).
Identifying labels:
Following a summary explanation for possible long entries, the same but opposite should be considered for possible short entries:
Small green arrow under candle: indicates possible upward trend (pivot above pivot SMA)
Large green arrow under candle: indicates upward trend (pivot above pivot SMA and above fast SMA)
Green triangle over candle: indicates channel breakout, possible upward momentum (represented as a fractal as its concept is the same)
Green/red arrows at the bottom of the chart: intended to confirm the validity of a signal (should doubt green indications with red lower arrow and vice versa)
Green/red dots at the bottom of the chart: red represents areas of strong resistance and green signals of strong support (with red dots, proceed with caution despite green signals, and vice versa)
Comments
It is emphasized that the basic and most useful functionality of this script is to provide a reliable base on which to develop any strategy, as a framework for working.
If the identifying labels are used, it should be taken into account that the earliest will always be the most reliable and valuable, but their confirmation will always depend on the user's strategy.
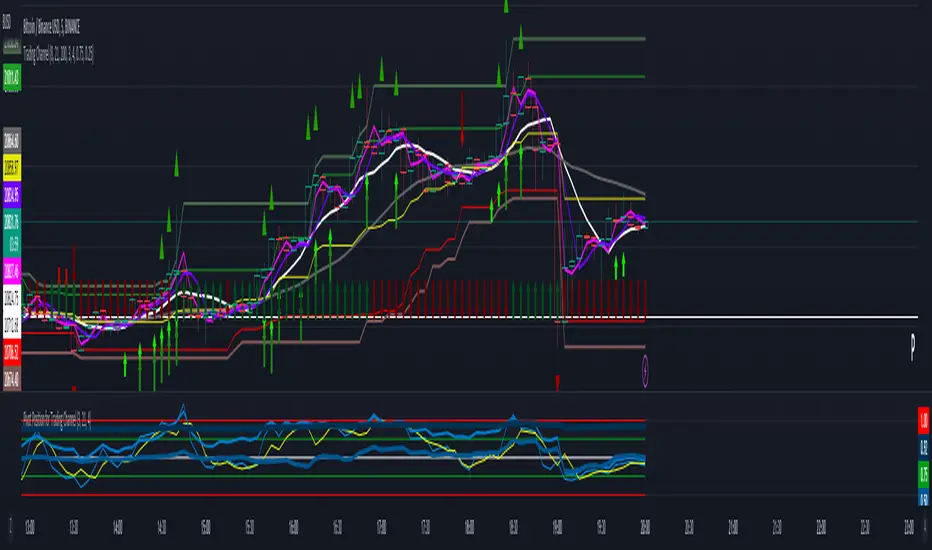
Its use in conjunction with the "Pivot Position for Trading Channel" indicator can serve as a base for the development of different strategies, by providing indication of the relative position of the price within the channel.
This script is just a consultation tool with didactic goals, it should not be used as an investment recommendation and the information provided should not be relied upon as such.
------------------------
Trading Channel pretende ser un lienzo sobre el que desarrollar cualquiera que sea la estrategia con la que el usuario se sienta más cómodo.
La mayor utilidad del script radica en que se traza sobre la acción del precio un canal, a modo de pivotes de soporte y resistencia, dentro del cual se desarrolla la acción del precio.
Se trata de un script de máxima sencillez en concepto y desarrollo, pero que a la vez presenta un soporte robusto a la acción del precio y una ayuda rápida visual complementaria a cualquieras que sean los indicadores con los que el usuario trabaje, se sienta más cómodo y utilice como base de sus estrategias.
El script incluye las siguientes funcionalidades (la mayoría desactivadas por defecto, disponibles para su potencial uso sin necesidad de añadir indicadores adicionales):
- SMA rápida
- SMA media
- SMA lenta (desactivada)
- EMA rápida (desactivada)
- EMA media (desactivada)
- EMA lenta (desactivada)
- Pivote
- SMA de pivote
- Multiplicador de P
- Conjunto de pivotes resistencia y soporte de acuerdo a los estudios de John L. Person (R3, R2, R1, S1, S2, S3 y puntos medios) (desactivados por defecto)
- Canal para el periodo temporal en uso
- Canales para periodos temporales extendidos (desactivados por defecto)
- Diversas etiquetas indicativas de cambios de tendencia, de impulso y de sobrecompra y sobreventa (nótese que los cálculos para su representación están basados en SMA's aunque se visualicen EMA's).
SMA's/EMA's
Ambas disponibles pues tanto unas como otras son utilizadas como indicadores básicos para diferentes tipos de estrategias. La selección de SMA's por defecto en este caso se basa en que las bases para desarrollo del script son en gran medida los estudios compartidos por John L. Person en el área de pivotes y de Bill Williams en el área de los fractales. Nótese también que por esa misma razón las diversas etiquetas indicativas de cambios de tendencia, impulso y sobrecompra/sobreventa se calculan en base a ellas.
Conjunto de pivotes resistencia y soporte
Se incluyen como herramienta de consulta sobre todo para los periodos temporales más altos. Pueden utilizarse para marcar los soportes/resistencias de más interés y no perderlos de vista mientras se opera en periodos de tiempo más bajos. De acuerdo a los estudios de John L. Person, marcarse los pivotes mensuales, semanales y diarios puede resultar de mucha utilidad. Adicionalmente, marcar S1 y R2 para tendencias alcistas, S1 y R1 para rangos, y S2 y R1 para tendencias bajistas puede proporcionar un marco aún más preciso sobre el que trabajar.
Multiplicador de p
Está fijado por defecto en 4, y es la base para poder considerar durante el uso de una franja temporal concreta, la acción del precio respecto a franjas temporales superiores. Es el multiplicador utilizado para la generación de los canales para periodos temporales extendidos.
Canal para el periodo temporal en uso
Se trata de un canal conformado por los cierres máximos y mínimos de los últimos 21 periodos. Este valor es modificable y su ajuste depende del activo en estudio. Mercados 24/7 muestran buenos resultados con este ajuste (en el caso de BTC realmente buenos).
Este canal representa en cierta manera un pivote en forma de línea intermedia amarilla, con sus extremos de soporte y resistencia en las líneas verdes superior y roja inferior. Se añaden las mismas líneas verdes y rojas, referenciadas esta vez a los máximos, que sirven como posibles marcas de stop-loss.
Canales para periodos temporales extendidos
Habilitar los máximos y mínimos de canales de periodos extendidos puede proporcionar una mejor idea de la situación del precio (se recomienda deshabilitar el canal en uso y habilitar el superior para consulta, proporciona una mejor visión).
Etiquetas identificativas:
A continuación explicación resumida para posibles entradas en largo, lo mismo pero de modo opuesto debería considerarse para posibles entradas en corto:
Flecha verde pequeña bajo vela: indica inicio de tendencia en alza (pivote por encima de SMA de pivote y ambos por encima de SMA rápida)
Flecha verde grande bajo vela: indica tendencia en alza (pivote por encima de SMA de pivote y ambos por encima de SMA rápida y media)
Triángulo verde sobre vela: indica rotura de canal, posible impulso al alza (representado a modo de fractal pues su concepto es el mismo)
Flechas verdes/rojas a pie de gráfico: pretenden confirmar la validez de una señal (debería dudarse de las indicaciones verdes con flecha inferior roja y viceversa)
Puntos verdes/rojos a pie de gráfico: los rojos representan áreas de fuerte resistencia y los verdes de fuerte soporte (con puntos rojos, proceder con cautela pese a señales verdes, y viceversa)
Comentarios
Se insiste en que la funcionalidad básica y de mayor utilidad de este script es proporcionar una base confiable sobre la que desarrollar cualquier estrategia, a modo de marco de trabajo.
Si se hace uso de las etiquetas identificativas, debe tenerse en cuenta que las más prematuras siempre serán las más confiables y valiosas, pero que su confirmación siempre dependerá de la estrategia por parte del usuario.
Su uso en conjunción al indicador "Pivot Position for Trading Channel" puede servir de base para el desarrollo de diferentes estrategias, al proporcionar indicación de la posición relativa del precio dentro del canal.
Este script es solo una herramienta de consulta con objetivos didácticos, no debe ser utilizado como recomendación de inversión y no se debe confiar en ella como tal.
PivotThis library was designed to create three different datasets using Bill Williams fractals. The goal is to spot trends in reversal data and ultimately use these datasets to help predict future price reversals.
First, the pivot() function is used to initialize and populate three separate arrays (high pivot , low pivot , all pivots ). Since each high/low price depends on the bar_index, the bar_index, pivot direction(high/low), and high/low values are compressed into a string to maintain the data's integrity ("__"). Once each string array is populated and organized by bar_index, all three are returned inside a tuple. The return value must be deconstructed H,L,A =pivot() for each array's values to be accessed using getPivot() . This boilerplate allows for data to be accessed more efficiently in a recursive environment. getPivot() was designed to be used inside of a for or while block to populate matrices for further analyses. Again, getPivot() return values must be exposed through deconstruction. x,d,y =getPivot(). See code for more details.
pivot(int XLR) initializes and populates arrays
Parameters
XLR - number of bars to the left and right that must be lower for a high to be considered a pivotHigh, or vice versa. This number will drastically change the size and scope of the returned datasets. smaller values will produce much larger datasets, which might model short term price activity well. In contrast, larger values will produce smaller datasets which might model longer term price activity well.
Returns - tuple [string ]
getPivot(string arrayID, int index) accesses array data
Parameters
arrayID - the variable name for one of the three arrays returned by pivot().
index - the index of the provided array, with 0 being the most recent pivot point. can be set to " i " in a loop to access values recursively
Returns - tuple

Support & Ressistance by @kaleboraciy [REUPLOAD]█ OVERVIEW
Support & Resistance levels are important in trading as we all know.
█ WARNING
This version is beta, maybe sometimes it will plot wrong levels, but i will try to to eliminate these issues. And please note, that you should find your own ideal settings for every ticker you use.
█ FEATURES
This is the first script in Pine Community which plots levels using the last two points/ pivots /fractals.
It also stops plotting levels when there is a breakout on the particular level.
█ SETTINGS
1. Pivot Points Length - defines pivot points length. Using to find points where market is reversed. If you set lower value, there will be more points but less useful. As I said you should find your optimal parameters.
2. Inaccuracy in % - defines maximal possible inaccuracy between 2 pivot points .
3. Linewidth - width of line(level)
4. Start Calculations from - if you use low timeframe (1m - 30m) there are a lot of calculations, and PineScript can't process it. This parameter defines start date of calculations and now there are less data and Pine can process it better.
█ HOW IT WORKS
When a new pivot appears, it draws invisible line starting in this pivot . when the second pivots gets created, it checks all lines in array. When inaccuracy is smaller than defined, the line becomes visible.
If price breaks trough the pivots , the lines stop and a new cycle begins.
I hope that this script will be helpful in your trading🙂

taLibrary "ta"
█ OVERVIEW
This library holds technical analysis functions calculating values for which no Pine built-in exists.
Look first. Then leap.
█ FUNCTIONS
cagr(entryTime, entryPrice, exitTime, exitPrice)
It calculates the "Compound Annual Growth Rate" between two points in time. The CAGR is a notional, annualized growth rate that assumes all profits are reinvested. It only takes into account the prices of the two end points — not drawdowns, so it does not calculate risk. It can be used as a yardstick to compare the performance of two instruments. Because it annualizes values, the function requires a minimum of one day between the two end points (annualizing returns over smaller periods of times doesn't produce very meaningful figures).
Parameters:
entryTime : The starting timestamp.
entryPrice : The starting point's price.
exitTime : The ending timestamp.
exitPrice : The ending point's price.
Returns: CAGR in % (50 is 50%). Returns `na` if there is not >=1D between `entryTime` and `exitTime`, or until the two time points have not been reached by the script.
█ v2, Mar. 8, 2022
Added functions `allTimeHigh()` and `allTimeLow()` to find the highest or lowest value of a source from the first historical bar to the current bar. These functions will not look ahead; they will only return new highs/lows on the bar where they occur.
allTimeHigh(src)
Tracks the highest value of `src` from the first historical bar to the current bar.
Parameters:
src : (series int/float) Series to track. Optional. The default is `high`.
Returns: (float) The highest value tracked.
allTimeLow(src)
Tracks the lowest value of `src` from the first historical bar to the current bar.
Parameters:
src : (series int/float) Series to track. Optional. The default is `low`.
Returns: (float) The lowest value tracked.
█ v3, Sept. 27, 2022
This version includes the following new functions:
aroon(length)
Calculates the values of the Aroon indicator.
Parameters:
length (simple int) : (simple int) Number of bars (length).
Returns: ( [float, float ]) A tuple of the Aroon-Up and Aroon-Down values.
coppock(source, longLength, shortLength, smoothLength)
Calculates the value of the Coppock Curve indicator.
Parameters:
source (float) : (series int/float) Series of values to process.
longLength (simple int) : (simple int) Number of bars for the fast ROC value (length).
shortLength (simple int) : (simple int) Number of bars for the slow ROC value (length).
smoothLength (simple int) : (simple int) Number of bars for the weigted moving average value (length).
Returns: (float) The oscillator value.
dema(source, length)
Calculates the value of the Double Exponential Moving Average (DEMA).
Parameters:
source (float) : (series int/float) Series of values to process.
length (simple int) : (simple int) Length for the smoothing parameter calculation.
Returns: (float) The double exponentially weighted moving average of the `source`.
dema2(src, length)
An alternate Double Exponential Moving Average (Dema) function to `dema()`, which allows a "series float" length argument.
Parameters:
src : (series int/float) Series of values to process.
length : (series int/float) Length for the smoothing parameter calculation.
Returns: (float) The double exponentially weighted moving average of the `src`.
dm(length)
Calculates the value of the "Demarker" indicator.
Parameters:
length (simple int) : (simple int) Number of bars (length).
Returns: (float) The oscillator value.
donchian(length)
Calculates the values of a Donchian Channel using `high` and `low` over a given `length`.
Parameters:
length (int) : (series int) Number of bars (length).
Returns: ( [float, float, float ]) A tuple containing the channel high, low, and median, respectively.
ema2(src, length)
An alternate ema function to the `ta.ema()` built-in, which allows a "series float" length argument.
Parameters:
src : (series int/float) Series of values to process.
length : (series int/float) Number of bars (length).
Returns: (float) The exponentially weighted moving average of the `src`.
eom(length, div)
Calculates the value of the Ease of Movement indicator.
Parameters:
length (simple int) : (simple int) Number of bars (length).
div (simple int) : (simple int) Divisor used for normalzing values. Optional. The default is 10000.
Returns: (float) The oscillator value.
frama(source, length)
The Fractal Adaptive Moving Average (FRAMA), developed by John Ehlers, is an adaptive moving average that dynamically adjusts its lookback period based on fractal geometry.
Parameters:
source (float) : (series int/float) Series of values to process.
length (int) : (series int) Number of bars (length).
Returns: (float) The fractal adaptive moving average of the `source`.
ft(source, length)
Calculates the value of the Fisher Transform indicator.
Parameters:
source (float) : (series int/float) Series of values to process.
length (simple int) : (simple int) Number of bars (length).
Returns: (float) The oscillator value.
ht(source)
Calculates the value of the Hilbert Transform indicator.
Parameters:
source (float) : (series int/float) Series of values to process.
Returns: (float) The oscillator value.
ichimoku(conLength, baseLength, senkouLength)
Calculates values of the Ichimoku Cloud indicator, including tenkan, kijun, senkouSpan1, senkouSpan2, and chikou. NOTE: offsets forward or backward can be done using the `offset` argument in `plot()`.
Parameters:
conLength (int) : (series int) Length for the Conversion Line (Tenkan). The default is 9 periods, which returns the mid-point of the 9 period Donchian Channel.
baseLength (int) : (series int) Length for the Base Line (Kijun-sen). The default is 26 periods, which returns the mid-point of the 26 period Donchian Channel.
senkouLength (int) : (series int) Length for the Senkou Span 2 (Leading Span B). The default is 52 periods, which returns the mid-point of the 52 period Donchian Channel.
Returns: ( [float, float, float, float, float ]) A tuple of the Tenkan, Kijun, Senkou Span 1, Senkou Span 2, and Chikou Span values. NOTE: by default, the senkouSpan1 and senkouSpan2 should be plotted 26 periods in the future, and the Chikou Span plotted 26 days in the past.
ift(source)
Calculates the value of the Inverse Fisher Transform indicator.
Parameters:
source (float) : (series int/float) Series of values to process.
Returns: (float) The oscillator value.
kvo(fastLen, slowLen, trigLen)
Calculates the values of the Klinger Volume Oscillator.
Parameters:
fastLen (simple int) : (simple int) Length for the fast moving average smoothing parameter calculation.
slowLen (simple int) : (simple int) Length for the slow moving average smoothing parameter calculation.
trigLen (simple int) : (simple int) Length for the trigger moving average smoothing parameter calculation.
Returns: ( [float, float ]) A tuple of the KVO value, and the trigger value.
pzo(length)
Calculates the value of the Price Zone Oscillator.
Parameters:
length (simple int) : (simple int) Length for the smoothing parameter calculation.
Returns: (float) The oscillator value.
rms(source, length)
Calculates the Root Mean Square of the `source` over the `length`.
Parameters:
source (float) : (series int/float) Series of values to process.
length (int) : (series int) Number of bars (length).
Returns: (float) The RMS value.
rwi(length)
Calculates the values of the Random Walk Index.
Parameters:
length (simple int) : (simple int) Lookback and ATR smoothing parameter length.
Returns: ( [float, float ]) A tuple of the `rwiHigh` and `rwiLow` values.
stc(source, fast, slow, cycle, d1, d2)
Calculates the value of the Schaff Trend Cycle indicator.
Parameters:
source (float) : (series int/float) Series of values to process.
fast (simple int) : (simple int) Length for the MACD fast smoothing parameter calculation.
slow (simple int) : (simple int) Length for the MACD slow smoothing parameter calculation.
cycle (simple int) : (simple int) Number of bars for the Stochastic values (length).
d1 (simple int) : (simple int) Length for the initial %D smoothing parameter calculation.
d2 (simple int) : (simple int) Length for the final %D smoothing parameter calculation.
Returns: (float) The oscillator value.
stochFull(periodK, smoothK, periodD)
Calculates the %K and %D values of the Full Stochastic indicator.
Parameters:
periodK (simple int) : (simple int) Number of bars for Stochastic calculation. (length).
smoothK (simple int) : (simple int) Number of bars for smoothing of the %K value (length).
periodD (simple int) : (simple int) Number of bars for smoothing of the %D value (length).
Returns: ( [float, float ]) A tuple of the slow %K and the %D moving average values.
stochRsi(lengthRsi, periodK, smoothK, periodD, source)
Calculates the %K and %D values of the Stochastic RSI indicator.
Parameters:
lengthRsi (simple int) : (simple int) Length for the RSI smoothing parameter calculation.
periodK (simple int) : (simple int) Number of bars for Stochastic calculation. (length).
smoothK (simple int) : (simple int) Number of bars for smoothing of the %K value (length).
periodD (simple int) : (simple int) Number of bars for smoothing of the %D value (length).
source (float) : (series int/float) Series of values to process. Optional. The default is `close`.
Returns: ( [float, float ]) A tuple of the slow %K and the %D moving average values.
supertrend(factor, atrLength, wicks)
Calculates the values of the SuperTrend indicator with the ability to take candle wicks into account, rather than only the closing price.
Parameters:
factor (float) : (series int/float) Multiplier for the ATR value.
atrLength (simple int) : (simple int) Length for the ATR smoothing parameter calculation.
wicks (simple bool) : (simple bool) Condition to determine whether to take candle wicks into account when reversing trend, or to use the close price. Optional. Default is false.
Returns: ( [float, int ]) A tuple of the superTrend value and trend direction.
szo(source, length)
Calculates the value of the Sentiment Zone Oscillator.
Parameters:
source (float) : (series int/float) Series of values to process.
length (simple int) : (simple int) Length for the smoothing parameter calculation.
Returns: (float) The oscillator value.
t3(source, length, vf)
Calculates the value of the Tilson Moving Average (T3).
Parameters:
source (float) : (series int/float) Series of values to process.
length (simple int) : (simple int) Length for the smoothing parameter calculation.
vf (simple float) : (simple float) Volume factor. Affects the responsiveness.
Returns: (float) The Tilson moving average of the `source`.
t3Alt(source, length, vf)
An alternate Tilson Moving Average (T3) function to `t3()`, which allows a "series float" `length` argument.
Parameters:
source (float) : (series int/float) Series of values to process.
length (float) : (series int/float) Length for the smoothing parameter calculation.
vf (simple float) : (simple float) Volume factor. Affects the responsiveness.
Returns: (float) The Tilson moving average of the `source`.
tema(source, length)
Calculates the value of the Triple Exponential Moving Average (TEMA).
Parameters:
source (float) : (series int/float) Series of values to process.
length (simple int) : (simple int) Length for the smoothing parameter calculation.
Returns: (float) The triple exponentially weighted moving average of the `source`.
tema2(source, length)
An alternate Triple Exponential Moving Average (TEMA) function to `tema()`, which allows a "series float" `length` argument.
Parameters:
source (float) : (series int/float) Series of values to process.
length (float) : (series int/float) Length for the smoothing parameter calculation.
Returns: (float) The triple exponentially weighted moving average of the `source`.
trima(source, length)
Calculates the value of the Triangular Moving Average (TRIMA).
Parameters:
source (float) : (series int/float) Series of values to process.
length (int) : (series int) Number of bars (length).
Returns: (float) The triangular moving average of the `source`.
trima2(src, length)
An alternate Triangular Moving Average (TRIMA) function to `trima()`, which allows a "series int" length argument.
Parameters:
src : (series int/float) Series of values to process.
length : (series int) Number of bars (length).
Returns: (float) The triangular moving average of the `src`.
trix(source, length, signalLength, exponential)
Calculates the values of the TRIX indicator.
Parameters:
source (float) : (series int/float) Series of values to process.
length (simple int) : (simple int) Length for the smoothing parameter calculation.
signalLength (simple int) : (simple int) Length for smoothing the signal line.
exponential (simple bool) : (simple bool) Condition to determine whether exponential or simple smoothing is used. Optional. The default is `true` (exponential smoothing).
Returns: ( [float, float, float ]) A tuple of the TRIX value, the signal value, and the histogram.
uo(fastLen, midLen, slowLen)
Calculates the value of the Ultimate Oscillator.
Parameters:
fastLen (simple int) : (series int) Number of bars for the fast smoothing average (length).
midLen (simple int) : (series int) Number of bars for the middle smoothing average (length).
slowLen (simple int) : (series int) Number of bars for the slow smoothing average (length).
Returns: (float) The oscillator value.
vhf(source, length)
Calculates the value of the Vertical Horizontal Filter.
Parameters:
source (float) : (series int/float) Series of values to process.
length (simple int) : (simple int) Number of bars (length).
Returns: (float) The oscillator value.
vi(length)
Calculates the values of the Vortex Indicator.
Parameters:
length (simple int) : (simple int) Number of bars (length).
Returns: ( [float, float ]) A tuple of the viPlus and viMinus values.
vzo(length)
Calculates the value of the Volume Zone Oscillator.
Parameters:
length (simple int) : (simple int) Length for the smoothing parameter calculation.
Returns: (float) The oscillator value.
williamsFractal(period)
Detects Williams Fractals.
Parameters:
period (int) : (series int) Number of bars (length).
Returns: ( [bool, bool ]) A tuple of an up fractal and down fractal. Variables are true when detected.
wpo(length)
Calculates the value of the Wave Period Oscillator.
Parameters:
length (simple int) : (simple int) Length for the smoothing parameter calculation.
Returns: (float) The oscillator value.
█ v7, Nov. 2, 2023
This version includes the following new and updated functions:
atr2(length)
An alternate ATR function to the `ta.atr()` built-in, which allows a "series float" `length` argument.
Parameters:
length (float) : (series int/float) Length for the smoothing parameter calculation.
Returns: (float) The ATR value.
changePercent(newValue, oldValue)
Calculates the percentage difference between two distinct values.
Parameters:
newValue (float) : (series int/float) The current value.
oldValue (float) : (series int/float) The previous value.
Returns: (float) The percentage change from the `oldValue` to the `newValue`.
donchian(length)
Calculates the values of a Donchian Channel using `high` and `low` over a given `length`.
Parameters:
length (int) : (series int) Number of bars (length).
Returns: ( [float, float, float ]) A tuple containing the channel high, low, and median, respectively.
highestSince(cond, source)
Tracks the highest value of a series since the last occurrence of a condition.
Parameters:
cond (bool) : (series bool) A condition which, when `true`, resets the tracking of the highest `source`.
source (float) : (series int/float) Series of values to process. Optional. The default is `high`.
Returns: (float) The highest `source` value since the last time the `cond` was `true`.
lowestSince(cond, source)
Tracks the lowest value of a series since the last occurrence of a condition.
Parameters:
cond (bool) : (series bool) A condition which, when `true`, resets the tracking of the lowest `source`.
source (float) : (series int/float) Series of values to process. Optional. The default is `low`.
Returns: (float) The lowest `source` value since the last time the `cond` was `true`.
relativeVolume(length, anchorTimeframe, isCumulative, adjustRealtime)
Calculates the volume since the last change in the time value from the `anchorTimeframe`, the historical average volume using bars from past periods that have the same relative time offset as the current bar from the start of its period, and the ratio of these volumes. The volume values are cumulative by default, but can be adjusted to non-accumulated with the `isCumulative` parameter.
Parameters:
length (simple int) : (simple int) The number of periods to use for the historical average calculation.
anchorTimeframe (simple string) : (simple string) The anchor timeframe used in the calculation. Optional. Default is "D".
isCumulative (simple bool) : (simple bool) If `true`, the volume values will be accumulated since the start of the last `anchorTimeframe`. If `false`, values will be used without accumulation. Optional. The default is `true`.
adjustRealtime (simple bool) : (simple bool) If `true`, estimates the cumulative value on unclosed bars based on the data since the last `anchor` condition. Optional. The default is `false`.
Returns: ( [float, float, float ]) A tuple of three float values. The first element is the current volume. The second is the average of volumes at equivalent time offsets from past anchors over the specified number of periods. The third is the ratio of the current volume to the historical average volume.
rma2(source, length)
An alternate RMA function to the `ta.rma()` built-in, which allows a "series float" `length` argument.
Parameters:
source (float) : (series int/float) Series of values to process.
length (float) : (series int/float) Length for the smoothing parameter calculation.
Returns: (float) The rolling moving average of the `source`.
supertrend2(factor, atrLength, wicks)
An alternate SuperTrend function to `supertrend()`, which allows a "series float" `atrLength` argument.
Parameters:
factor (float) : (series int/float) Multiplier for the ATR value.
atrLength (float) : (series int/float) Length for the ATR smoothing parameter calculation.
wicks (simple bool) : (simple bool) Condition to determine whether to take candle wicks into account when reversing trend, or to use the close price. Optional. Default is `false`.
Returns: ( [float, int ]) A tuple of the superTrend value and trend direction.
vStop(source, atrLength, atrFactor)
Calculates an ATR-based stop value that trails behind the `source`. Can serve as a possible stop-loss guide and trend identifier.
Parameters:
source (float) : (series int/float) Series of values that the stop trails behind.
atrLength (simple int) : (simple int) Length for the ATR smoothing parameter calculation.
atrFactor (float) : (series int/float) The multiplier of the ATR value. Affects the maximum distance between the stop and the `source` value. A value of 1 means the maximum distance is 100% of the ATR value. Optional. The default is 1.
Returns: ( [float, bool ]) A tuple of the volatility stop value and the trend direction as a "bool".
vStop2(source, atrLength, atrFactor)
An alternate Volatility Stop function to `vStop()`, which allows a "series float" `atrLength` argument.
Parameters:
source (float) : (series int/float) Series of values that the stop trails behind.
atrLength (float) : (series int/float) Length for the ATR smoothing parameter calculation.
atrFactor (float) : (series int/float) The multiplier of the ATR value. Affects the maximum distance between the stop and the `source` value. A value of 1 means the maximum distance is 100% of the ATR value. Optional. The default is 1.
Returns: ( [float, bool ]) A tuple of the volatility stop value and the trend direction as a "bool".
Removed Functions:
allTimeHigh(src)
Tracks the highest value of `src` from the first historical bar to the current bar.
allTimeLow(src)
Tracks the lowest value of `src` from the first historical bar to the current bar.
trima2(src, length)
An alternate Triangular Moving Average (TRIMA) function to `trima()`, which allows a
"series int" length argument.

Support & Resistance LevelsPlots support and resistance levels based on occurrence of fractals.
Line width indicates historical significance of the level.
Decreasing the proximity multiplier input increases the sensitivity/ increases the frequency of level changes.
If price closes above a resistance level, the level becomes a support level and its color on the chart changes to green (& vice-versa).

Quadratic SemaphoreThe quadratic semaphore indicator is an indicator that find confirmed market u-turn with the help of 2 quadratic regression calculated with Highs and Lows over the last “length” periods.
- “p” setting is candlesticks quantity to confirmed the quadratic regression has formed a High or Low parabola, such as Fractals. Consecutive same signals can happen due to the use of different price values for upper and lower semaphore.
- Adjust the settings to your instrument and time frame.
- Alerts included.
Success with your trade¡¡
Support-Resistance breakoutStrategy based on longing resistance breakout and shorting support breakout.
It defines highs and lows using fractal with 2 bars for confirming high/lows. So it has 2 bars lag.
It calculates the difference between sma with defined length (21 by default) of highs and of lows and uses it as alt SR level. This idea I took from synapticEx's indicator Nebula-Advanced-Dynamic-Support-Resistance.
Position enter is the breakout of SR, defined by fractals.
Position exit is: bar change in opposite to position direction > difference is sma of highs and of lows.
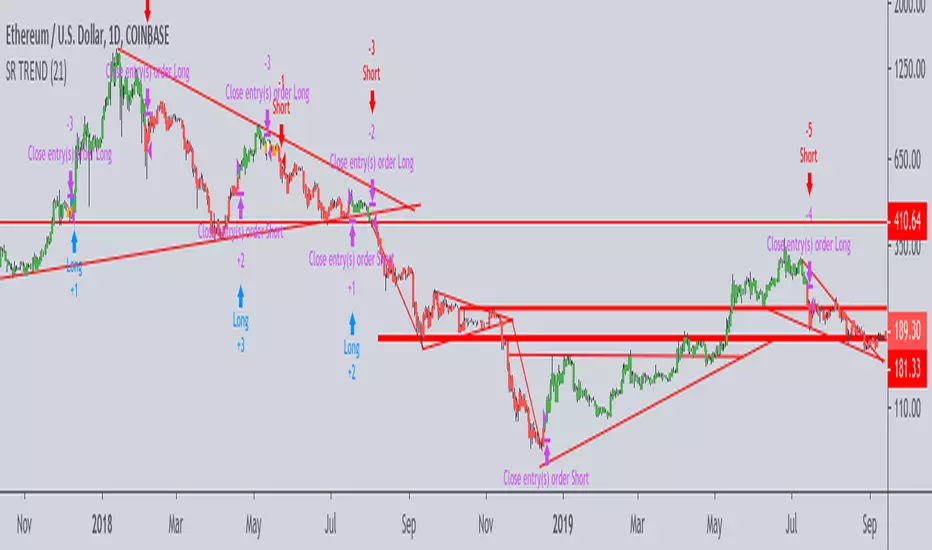
Highs&LowsShows Higher Highs, Higher Lows, Lower Lows & Lower Highs based off of Bill Williams fractals.
I use this mainly by shorting a break of the higher lows marked in yellow.
A long signal would be a candle close above a lower high (less reliable)
Alerts can be set with the secondary indicator below the chart.
Higher Lows / Lower Highs Alerts -https://www.tradingview.com/script/Ka1yXqRj-Higher-Lows-Lower-Highs-Alerts/
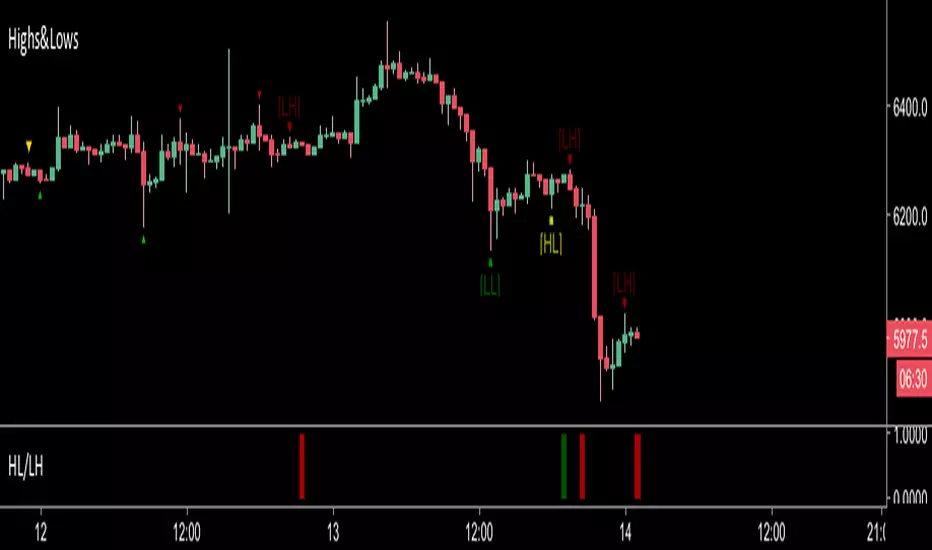
Guerrilla AdvancedThis indicator was designed with people without Pro License in mind (Including many of my close friends).
Basically, you will get a combo of few different tools in one box, with ability to turn them on and off with a single check mark, also, you have total control over the input numbers that was used in calculations if you so want to, for example, sometimes when i see a massive bullish up trend, i reduce the short rally from 12 to 8 even 6 to get faster signal for selling the trend.
So, what will you get in this pack?
1- Ichimoko. Yes, you heard it right, although we have it in the default tools but hey, it will use one indicator slot and if you don't have a pro license, you will use that slot
2- Rally. This is an old yet very powerful system for getting buy or sell signals, basically, you get two lines and for making the life easier i draw a cloud between them. when the trend passes above the cloud and it was bellow it in past, right after the very first candle that gets above the cloud you can put the buy order, and vice versa, the moment a candle body enters the cloud, if you want an aggressive signal, you can sell, if not, you may want to wait to see if the candles drop bellow the cloud or not then decide.
3- Resistance Support Cloud. Most of us always heard about resistance and support "lines" but many of us don't know that, in each trend, the trend line itself is a resistance or support line, and when you are going in a bullish or bearish tunnel, the floor and roof of tunnels are again resistance and supports, using this part of the tool, just like rally, you get a cloud that shows you the resistance / support "zone"
4- William Fractals. To be honest, I got this part of the code from another source available around. Why? looking at those fractal indicators, you can easily eyeball the trend line or existence of a tunnel.
5- Different EMA lines. If you are one of those people that use EMA lines for their trading, have fun with them, there are few different standard ones and even a custom one that you can put your desired number for it.
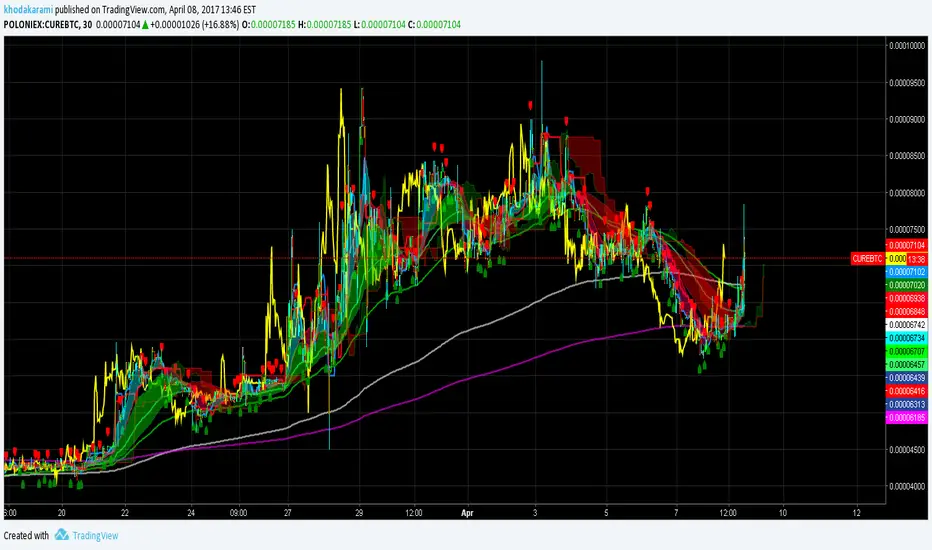
PAE - Price Action Essential**PAE - Price Action Essential** indicator.
This system is engineered to provide high-fidelity market structure readings, blending moving average harmony with algorithmic volume analysis at critical turning points.
---
## 1. Indicator Philosophy
**PAE** operates under the **"Signal over Noise"** principle. Its goal is to declutter the chart of visual distractions, highlighting only the areas where true confluence exists between price action and institutional effort (volume).
---
## 2. Moving Average Dynamics & Action Zone
The system utilizes a hierarchy of four moving averages to segment market flow:
### A. The Action Zone (Short-Term)
This is generated via a dynamic shading between the **Fast MA (9)** and the **Base MA (20)**.
* **Configuration:** Allows the user to select the calculation type (EMA, SMA, WMA, HMA) for both averages simultaneously.
* **Fast MA Colors:**
* `#a5d6a7` (Soft Green) during ascending values.
* `#faa1a4` (Soft Red) during descending values.
* **Purpose:** The shaded area acts as a "value band." Pullbacks into this zone during defined trends often offer the highest probability entry opportunities.
### B. Structural MAs (Mid & Long-Term)
These averages are fixed to **SMA** type to maintain stability in trend analysis:
* **Medium SMA (40):** Uses vibrant colors (**#3179f5** Blue / **#ffee58** Yellow) to clearly mark the primary direction of the current swing.
* **Slow SMA (200):** Uses pastel tones (**#90bff9** / **#fff9c4**) and a dotted style to define the long-term institutional bias.
---
## 3. Pivot Analysis with Smart Volume
**PAE** identifies fractals (Highs and Lows) and automatically classifies them based on their **Relative Volume** compared to the previous 20 candles.
### Visual Classification by Color
To ensure rapid interpretation, labels are set to **Tiny** size, with color serving as the primary data indicator:
| Pivot Type | Color | Volume Condition | Interpretation |
| --- | --- | --- | --- |
| **Strength (MAX)** | `#ff001e` (Bright Red) | `> 160%` of Avg | High-conviction resistance. |
| **Strength (MIN)** | `#0fa600` (Bright Green) | `> 160%` of Avg | High-conviction support. |
| **Base (MAX)** | `#f1adad` (Soft Rose) | Between `30%` - `160%` | Standard market structure. |
| **Base (MIN)** | `#bee7c0` (Soft Mint) | Between `30%` - `160%` | Standard market structure. |
| **Noise** | `#ffffff` (White 67% Transp.) | `< 30%` of Avg | Weak pivots or lack of interest. |
---
## 4. Contextual Information (Tooltips)
Every Pivot label is interactive. By hovering the cursor over the triangles, the trader obtains precise data:
* **Price:** Indicates the exact **Closing** value of the candle that triggered the pivot (MAX or Min).
* **Vol:** Displays the exact percentage of relative volume. For example, a value of **200%** confirms that the candle had double the average volume, validating the strength of that support or resistance level.
---
## 5. Recommended Configuration Parameters
* **Left/Right Bars (3):** The ideal balance between early detection and swing confirmation.
* **Strength Factor (1.60):** Filters for movements backed by professional intent.
* **Noise Factor (0.30):** Identifies exhaustion or lack of participation.
---
### Operational Summary
The **PAE** helps traders stop guessing. If the price reaches the **Action Zone** (shading) and coincides with a **Strength Pivot** (bright color), the probability of a reaction in favor of the trend is significantly high. It is a precision tool designed for traders seeking absolute clarity in their decision-making process.
