Recherche dans les scripts pour "fvg"
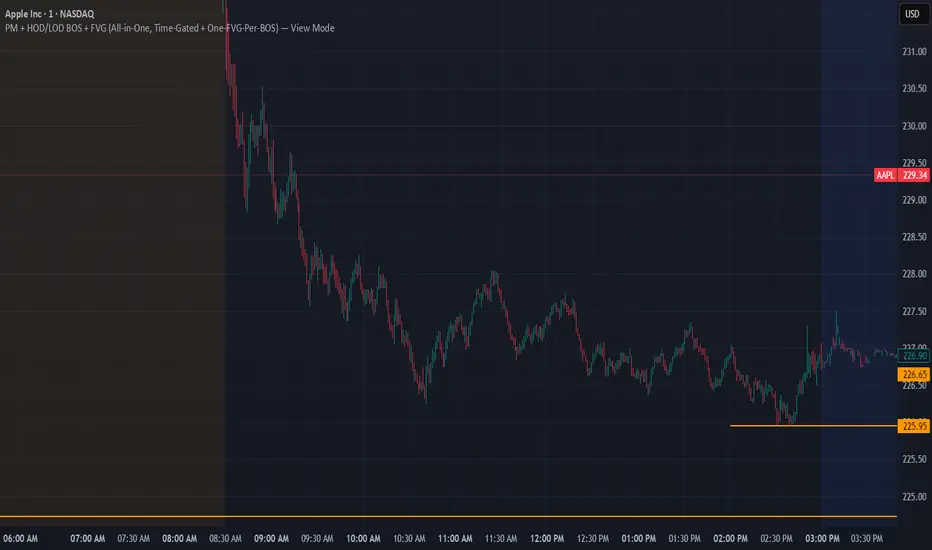
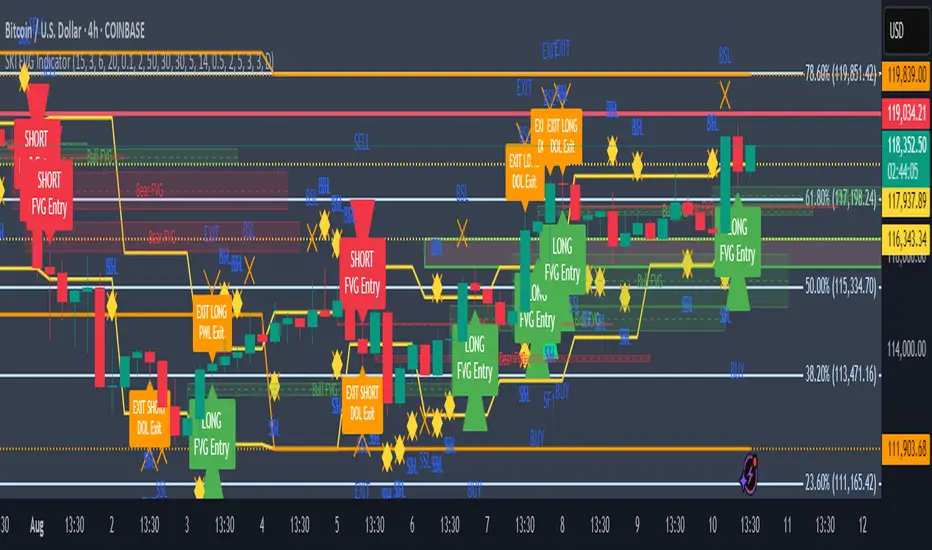
SKI FVG IndicatorIt uses ICT concepts and takes entries and exits. Identifies good FVG and shows an entry to buy or short and also exits at swing high or low , discount areas, primary areas, DOL (draw on liquidity)
Order Blocks & FVG con Mitigación CRISVASPERIdentifica Bloques de ordenes y FVG, pero muestra el porcentaje de mitigaciones
Advanced Liquidity & FVG Detector With Entry/Exit SignalsThe Advanced Liquidity & FVG Detector is more than just an indicator—it's a complete trading system that brings institutional-grade market analysis to individual traders. By combining liquidity detection, fair value gap analysis, sweep/grab pattern recognition, and intelligent risk management, this indicator provides everything needed for sophisticated market analysis and high-probability trading opportunities.
Whether you're a day trader, swing trader, or position trader, this indicator adapts to your style and timeframe, providing the insights needed to make informed trading decisions with confidence. The Pine Script v6 compatibility ensures future-proof performance and seamless integration with the latest TradingView features.
Transform your trading experience with professional-grade market structure analysis—tradable insights delivered in real-time, right on your chart.

[T] FVG Size MarkerThis scripts marks the size of the FVG on the chart. As well as lets you place custom text based on gap size. Custom text lets you overlay contract size risk based on the gap size.

POC-Candle-EMA-ATR-LongShadow-50percCandleThis is a script for those who trade based on volume and smart money strategies.
Some of the features of this script:
- Display "Time Price Opportunity Chart". These points help traders to identify price opportunities over time and have a better analysis of the market.
- Mark candles that have traded more volume than previous candles.
- Mark candles whose body is at least and not more than 50% of the total candle size, these candles can be found more easily in smart money strategies.
- Mark spike candles to find FVG faster
- Mark candles that have a shadow of at least more than 380 points and can be good reversal points.
- EMA indicator to check the market trend
- DonchianChannel indicator to check the price trend on the chart
Regards

Order Block Overlapping Drawing [TradingFinder]🔵 Introduction
Technical analysis is a fundamental tool in financial markets, helping traders identify key areas on price charts to make informed trading decisions. The ICT (Inner Circle Trader) style, developed by Michael Huddleston, is one of the most advanced methods in this field.
It enables traders to precisely identify and exploit critical zones such as Order Blocks, Breaker Blocks, Fair Value Gaps (FVGs), and Inversion Fair Value Gaps (IFVGs).
To streamline and simplify the use of these key areas, a library has been developed in Pine Script, the scripting language for the TradingView platform. This library allows you to automatically detect overlapping zones between Order Blocks and other similar areas, and visually display them on your chart.
This tool is particularly useful for creating indicators like Balanced Price Range (BPR) and ICT Unicorn Model.
🔵 How to Use
This section explains how to use the Pine Script library. This library assists you in easily identifying and analyzing overlapping areas between Order Blocks and other zones, such as Breaker Blocks and Fair Value Gaps.
To add "Order Block Overlapping Drawing", you must first add the following code to your script.
import TFlab/OrderBlockOverlappingDrawing/1
🟣 Inputs
The library includes the "OBOverlappingDrawing" function, which you can use to detect and display overlapping zones. This function identifies and draws overlapping zones based on the Order Block type, trigger conditions, previous and current prices, and other relevant parameters.
🟣 Parameters
OBOverlappingDrawing(OBType , TriggerConditionOrigin, distalPrice_Pre, proximalPrice_Pre , distalPrice_Curr, proximalPrice_Curr, Index_Curr , OBValidGlobal, OBValidDis, MitigationLvL, ShowAll, Show, ColorZone) =>
OBType (string)
TriggerConditionOrigin (bool)
distalPrice_Pre (float)
proximalPrice_Pre (float)
distalPrice_Curr (float)
proximalPrice_Curr (float)
Index_Curr (int)
OBValidGlobal (bool)
OBValidDis (int)
MitigationLvL (string)
ShowAll (bool)
Show (bool)
ColorZone (color)
In this example, various parameters are defined to detect overlapping zones and draw them on the chart. Based on these settings, the overlapping areas will be automatically drawn on the chart.
OBType : All order blocks are summarized into two types: "Supply" and "Demand." You should input your Current order block type in this parameter. Enter "Demand" for drawing demand zones and "Supply" for drawing supply zones.
TriggerConditionOrigin : Input the condition under which you want the Current order block to be drawn in this parameter.
distalPrice_Pre : Generally, if each zone is formed by two lines, the farthest line from the price is termed Pervious "Distal." This input receives the price of the "Distal" line.
proximalPrice_Pre : Generally, if each zone is formed by two lines, the nearest line to the price is termed Previous "Proximal" line.
distalPrice_Curr : Generally, if each zone is formed by two lines, the farthest line from the price is termed Current "Distal." This input receives the price of the "Distal" line.
proximalPrice_Curr : Generally, if each zone is formed by two lines, the nearest line to the price is termed Current "Proximal" line.
Index_Curr : This input receives the value of the "bar_index" at the beginning of the order block. You should store the "bar_index" value at the occurrence of the condition for the Current order block to be drawn and input it here.
OBValidGlobal : This parameter is a boolean in which you can enter the condition that you want to execute to stop drawing the block order. If you do not have a special condition, you should set it to True.
OBValidDis : Order blocks continue to be drawn until a new order block is drawn or the order block is "Mitigate." You can specify how many candles after their initiation order blocks should continue. If you want no limitation, enter the number 4998.
MitigationLvL : This parameter is a string. Its inputs are one of "Proximal", "Distal" or "50 % OB" modes, which you can enter according to your needs. The "50 % OB" line is the middle line between distal and proximal.
ShowAll : This is a boolean parameter, if it is "true" the entire order of blocks will be displayed, and if it is "false" only the last block order will be displayed.
Show : You may need to manage whether to display or hide order blocks. When this input is "On", order blocks are displayed, and when it's "Off", order blocks are not displayed.
ColorZone : You can input your preferred color for drawing order blocks.
🟣 Output
Mitigation Alerts : This library allows you to leverage Mitigation Alerts to detect specific conditions that could lead to trend reversals. These alerts help you react promptly in your trades, ensuring better management of market shifts.
🔵 Conclusion
The Pine Script library provided is a powerful tool for technical analysis, especially in the ICT style. It enables you to detect overlapping zones between Order Blocks and other significant areas like Breaker Blocks and Fair Value Gaps, improving your trading strategies. By utilizing this tool, you can perform more precise analysis and manage risks effectively in your trades.

Cuck WickAcknowledgement
This indicator is dedicated to my friend Alexandru who saved me from one of these scam cuck wicks which almost liquidated me.
Alexandru is one of the best scalpers out there and he always nails his entries at the tip of these wicks.
This inspired me to create this indicator.
What's a cuck wick?
It's that fast stop-hunting wick that cucks everyone by triggering their stop-loss and liquidation.
Liquidity is the lifeblood of stock market and liquidation is the process that moves price.
This indicator will identify when a liquidity pool is getting raided to trigger buy or sell stops, they are also know as stop-hunts.
How does it work?
When market consolidates in one direction, it builds up liquidity zones.
Market maker will break out of these consolidation phases by having dramatic price action to either pump or dump to raid these liquidity zones.
This is also called stop-hunts or liquidity raids. After that it will start reversing back to the opposite direction.
This is most noticeable by the length of the wick of a given candle in a very short amount of time and the total size of the candle.
This indicator highlights them accordingly.
Settings
Wick and Candle ratio works with default values but finetune will enhance user experience and usability.
Wick Ratio: Size of the wick compared to body of a candle.
Adjust this to higher ratio on smaller timeframe or smaller ratio on bigger timeframe to your trading style to spot a trend reversal.
Candle Ratio: The size of the candle, by default it is 0.75% of the current price.
For example, if BTC is at 20,000 then the size of the candle has to be minimum 150.
This can be fine tuned to bigger candle size on higher time frames or smaller for shorter timeframe depending on the trade type.
How to use it?
This indicator will identify when a liquidity pool is getting raided to trigger buy or sell stops, they are also know as stop-hunts. It can be used of its own for scalping but there are also a good few indicators which would most definitely help to confluence bigger timeframe trades.
Scalp
This indicator shows the most chaotic moments in price action; therefore it works best on smaller timeframes, ideally 3 or 5 minute candle.
- Wait for the market to start pumping or dumping.
- Current candle will change colour (Bullish/Bearish).
- Enter trade as soon as price starts to reverse back.
- Place the stop-loss outside of the current candle.
- Wait for the cuck wick to appear as confirmation.
Price is very chaotic during a liquidity stop-hunt raid but there is a saying:
"In the midst of chaos, there is also opportunity" - Sun-Tzu
Since this is a very high risk, high reward strategy; it is advised to practice on paper trade first.
Practice until perfection and this indicator would be the perfect bread and butter scalp confirmation.
Fair Value Gap
FVG strategy is the most accurate in conjunction with this indicator.
Normally price would reverse after consuming fair value gaps but often it's difficult to know when and where.
This indicator would identify those crucial entry points for reverse course direction of the price action.
Support and Resistance
This indicator can also be used in conjunction with support and resistance lines.
Generally the cuck will go deep below the support or spike much further up the resistance lines to liquidate positions.
Bollinger Bands
Bolling Bands strategy would be to wait until the price breaks out of the band.
Once the wick is formed, it would be an ideal entry point.
Script change
This is an open-source script and feel free to modify according to your need and to amplify your existing strategy.

ICT Implied Fair Value Gap (IFVG) [LuxAlgo]An Implied Fair Value Gap (IFVG) is a three candles imbalance formation conceptualized by ICT that is based on detecting a larger candle body & then measuring the average between the two adjacent candle shadows.
This indicator automatically detects this imbalance formation on your charts and can be extended by a user set number of bars.
The IFVG average can also be extended until a new respective IFVG is detected, serving as a support/resistance line.
Alerts for the detection of bullish/bearish IFVG's are also included in this script.
🔶 SETTINGS
Shadow Threshold %: Threshold percentage used to filter out IFVG's with low adjacent candles shadows.
IFVG Extension: Number of bars used to extend highlighted IFVG's areas.
Extend Averages: Extend IFVG's averages up to a new detected respective IFVG.
🔶 USAGE
Users of this indicator can primarily find it useful for trading imbalances just as they would for trading regular Fair Value Gaps or other imbalances, which aims to highlight a disparity between supply & demand.
For trading a bullish IFVG, users can find this imbalance as an area where price is likely to fill or act as an area of support.
In the same way, a user could trade bearish IFVGs by seeing it as a potential area to be filled or act as resistance within a downtrend.
Users can also extend the IFVG averages and use them as longer-term support/resistances levels. This can highlight the ability of detected IFVG to provide longer term significant support and resistance levels.
🔶 DETAILS
Various methods have been proposed for the detection of regular FVG's, and as such it would not be uncommon to see various methods for the implied version.
We propose the following identification rules for the algorithmic detection of IFVG's:
🔹 Bullish
Central candle body is larger than the body of the adjacent candles.
Current price low is higher than high price two bars ago.
Current candle lower shadow makes up more than p percent of its total candle range.
Candle upper shadow two bars ago makes up more than p percent of its total candle range.
The average of the current candle lower shadow is greater than the average of the candle upper shadow two bars ago.
where p is the user set threshold.
🔹 Bearish
Central candle body is larger than the body of the adjacent candles.
Current price high is higher than low price two bars ago.
Current candle upper shadow makes up more than p percent of its total candle range.
Candle lower shadow two bars ago makes up more than p percent of its total candle range.
The average of the candle lower shadow 2 bars ago is greater than the average of the current candle higher shadow.
where p is the user set threshold.
🔶 SUPPLEMENTARY MATERIAL
You can see our previously posted script that detects various imbalances as well as regular Fair Value Gaps which have very similar usability to Implied Fair Value Gaps here:

Gaps + Imbalances + Wicks (MTF) - By LeviathanThis script will identify and draw price gaps, wicks and imbalances with customizable fill conditions, multi-timeframe function, zone size filtering, volume comparison, lookback filtering, as well as highly customizable appearance and settings.
I’ve made this indicator to combine the three similar but different elements that occur in price movements and serve as significant zones of interest or way of PA interpretation in various different strategies.
Imbalances (or Fair Value Gap/FVG/Inefficiency/whatever)
- The Imbalance “pattern” consists of 3 candles (1- candle before the sharp move, 2 - sharp move candle and 3- candle after the sharp move). When price makes a move downwards, the imbalance zone is defined as the area between the low of 1 and the high of 3 When price makes a move upwards, the imbalance zone is defined as the area between the high of 1 and the low of 3.
Gaps
A price gap is an area on a chart where no trading activity has taken place. A gap up means that the low of the current candle is higher than the high of the previous candle and a gap down means that the high of the current candle is lower than the low of the previous candle.
Wicks (or shadows/tails/whatever)
Wicks are used to indicate where the price has fluctuated relative to the opening and closing price of the candle. An upper wick is the zone between candle high and candle close/open (whichever is higher) and a lower wick is the zone between candle’s low and candle’s close/open (whichever is lower).
Settings Overview
“Zone Type” - This input lets you decide which zones should the script plot and on which timeframe. You should always pick a timeframe higher than your chat’s.
“Middle Line, Top Line, Bottom Line” - Show or hide the Middle Line (horizontal level in the middle of each zone), Show or hide Top Line (horizontal level at the top of the zone), Show or hide Bottom Line (horizontal level at the bottom of the zone)
“UP/DOWN Zones" - This input lets you show/hide UP Zones or DOWN Zones an pick their color, border color and label color.
”Fill Condition” - If turned ON, the zones will end drawing when your prefered Fill Condition is met (Full Filll = price mitigates the whole zone, Half Fill = zone is at least halfway mitigated and Touch = zone is touched by price). If turned OFF, the zones will only be plotted for the amount of bars defined it “Zone Length”.
”Lookback (D)” - This input lets you limit the amount of zones plotted on the chart by choosing how many days back in time should the script go to find and plot zones. For example, input 1 will only show you the zones of the past day, input 7 will only show you the zones of the past week.
”Hide Filled Zones” - If turned ON, the zones that have been filled will be removed from the chart.
”Show Boxes” - Show or hide the boxes that represent the zones. This is useful for those who want the zones to be visualized by just lines.
“Filter Type” - this input lets you create a filter that will make the script only show zones that are larger than ATR or larger than a certain percentage. You can choose the ATR Length and the multiplier (higher multiplier → larger zone required), as well as the Percentage (%) and its multiplier (higher percentage → larger zone required). If you choose “None”, the zones of all sizes will be plotted.
”Zone Labels” - this part of the settings lets you: show/hide labels, decide on the size of the labels and their positions, choose a custom name for each zone, choose the data that the labels present (Type of the zone/Timeframe/ Volume ).
”Other settings” - ‘Stop/Delete zone after X number of candles’ will force stop/delete the zone if it’s plotted for more than prefered number of bars. ‘Line Style’ lets you choose the style and the color of the lines, ‘Zone Length’ defines the length of the zone if Fill Condition is “None”.
More settings, modifications and improvements coming in future updates. This script is a bit old so I will clean up and optimize the code once I have more time.

Liquidity Hunter - FattyTradesThis indicator is used to automatically identify and plot two forms of liquidity that will be targeted by market makers.
The first form of liquidity is based on multi-time fame highs and lows. It plots 1H, 4H, D, W, & M liquidity on an intraday chart to make it easier to identify. I believe hat liquidity is what drives the market and the most common form of this liquidity can be identified through higher time frame highs and lows. You can use whatever method you prefer to determine which liquidity pool will be targeted. When the liquidity is purged, it will be shown as dotted lines. This should not be used as traditional support/resistance, but rather as targets for the market.
The second form of liquidity is in the form of imbalances or fair value gaps. You can select a higher time frame to be plotted along with the current time frame you're viewing to identify imbalances that will likely be targeted intraday. We know that higher time frame fair value gaps work equally well as targets for market makers. When a higher time frame FVG is broken into, it can also act as a very powerful form of support and resistance. By default, when a fair value gap has been mitigated it will be removed from the chart, however this can be disabled.
Between these two forms of market maker liquidity targets on the chart, it will be easier to formulate a thesis intraday to determine where the market will move. It can help minimize the amount of switching between higher time frames that needs to be done, allowing you to identify targets while trading on your favorite intraday time frame for optimal risk/reward.
In the near future, I will build in alerting mechanism to alert when liquidity on higher time frames as been purged/mitigated.

FVG_Liquidity_SignalFVGs: classic 3-bar gaps (bullish when low > high , bearish when high < low ). Zones are drawn and auto-pruned.
Liquidity sweep: price takes out the last swing low/high (pivot) and then reclaims it on the close.
Signals:
BUY when we get a bull sweep and the bar taps a recent bull FVG and closes back above its upper edge.
SELL is the mirror image.
SL/TP guides: SL at swept swing; TP = RR × risk (visual only).

phx_fvgfvg generator 4h and current time frame
library to import fvg from 4h with midle line and proximity support and resistance
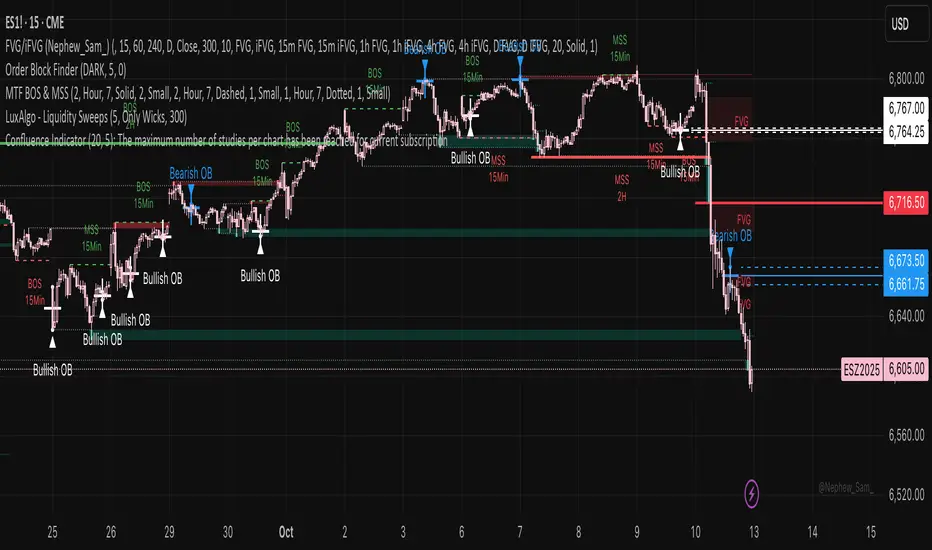
FVG (1MLuva) - Multi-TimeframeTook something that was cool that Nephew Sam made and added some more awesome-sauce! Make dat dinero!

Fair Value Gaps (40+ Points) with NY Session AlertsFVG with alerts. This works for the NY session only.

FVG BearishThis indicator identified negetive Fair Value Gap based on the following creteria:
1. Gap between the last but 1 candle low and current candle high
2. The width of the gap is at least 0.3% of current close
3. The previous candle is a bearish candle with body at least 0.7% of current close
4. Value of the previous candle is greater tha equal to 30 M
5. The candle is marked with red dot on top

FVG BullishThis indicator marks the formation of Positive fair value gap in 1 min chart based on the following conditions:
1. Low of current candle is higher than last but one candle
2. The gap between the two is atleast 0.3% of current closing
3. The middle candle oftren called as the expansion candle is at least 0.7% of current close
4. Valune of the expansion candle is greater than 30M indicating institutional participation
5. Such candle are indicated by Green curcles at the bottome


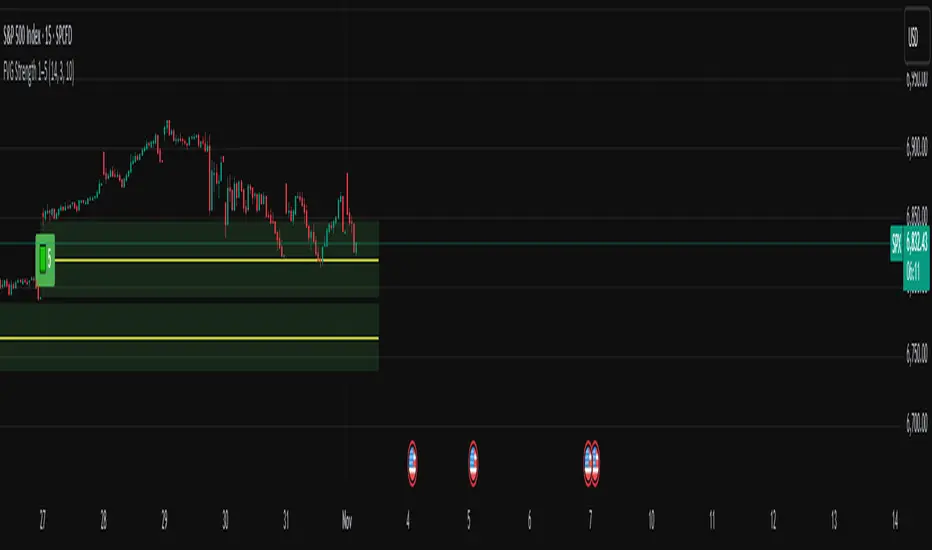
FVG Strength Detector (1–5)shows you fair value gaps with a rating score of 5 strongest to 1 weakest so if u see a 4 thats a good area
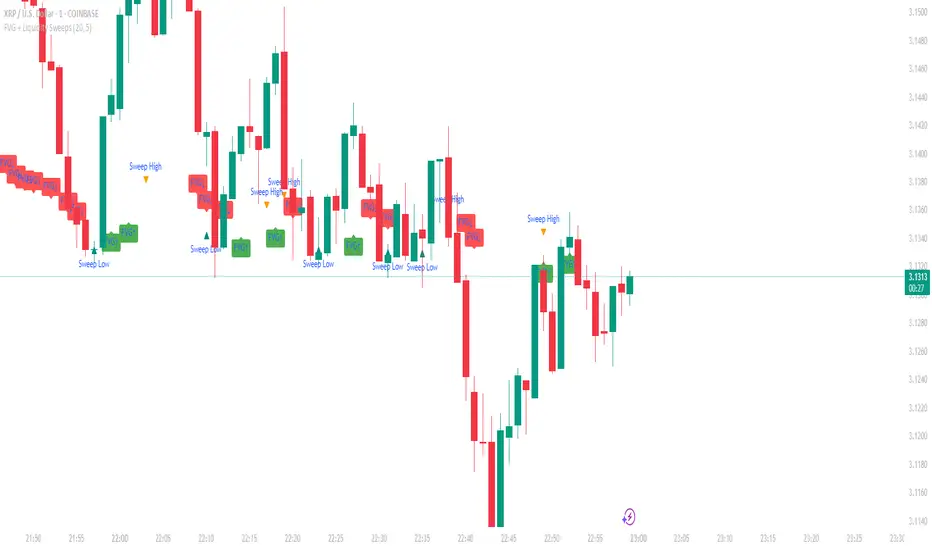
FVG + Liquidity Sweepsthis is a test and i don't know if it is gonna actually work but let me know if it does.
FVG + IFVG Gap (ULTRA) by Aditya NejeThis Indicator shows Fair Value Gap and Inverse Fair Value gaps

SMC Liquidity Engine Pro SMC Liquidity Engine Pro - Complete Trading Guide & Documentation
📊 Introduction: Understanding Smart Money Concepts
The SMC Liquidity Engine Pro is a comprehensive, institutional-grade trading indicator that brings professional Smart Money Concepts (SMC) methodology directly to your TradingView charts. This isn't just another technical indicator—it's a complete framework for understanding how institutional traders, market makers, banks, and hedge funds manipulate and move the markets.
What Makes This Different?
While most retail traders rely on lagging indicators like moving averages or RSI, this indicator reveals the real-time footprints of institutional activity. It shows you:
Where large players are accumulating or distributing positions
How they engineer liquidity to trigger retail stop losses
When they're shifting from one directional bias to another
Where price inefficiencies exist that institutions will likely revisit
The markets don't move randomly—they move based on liquidity. Understanding this fundamental truth is what separates consistently profitable traders from those who struggle. This indicator decodes that liquidity-driven behavior and presents it in clear, actionable visual signals.
The Philosophy Behind Smart Money Concepts
Smart Money Concepts is built on several core principles:
1. Liquidity is King: Price doesn't move because of patterns or indicators—it moves to collect liquidity (stop losses and pending orders). Institutions need massive liquidity to fill their large positions, so they engineer price movements to create that liquidity before making their real directional move.
2. Market Structure Reveals Intent: The way price forms highs and lows tells a story about who's in control. When structure breaks, it signals a shift in institutional positioning.
3. Inefficiencies Get Filled: When price moves too quickly in one direction, it leaves behind "fair value gaps"—areas of imbalance. Institutions frequently return to these areas to fill orders and restore balance.
4. Manipulation Precedes True Moves: The most explosive directional moves are often preceded by liquidity sweeps in the opposite direction—trapping retail traders before the real move begins.
This indicator automates the identification of all these concepts, allowing you to trade alongside the smart money rather than being their exit liquidity.
🎯 Core Features - Deep Dive
1. Market Structure Detection & Visualization
What It Is: Market structure forms the foundation of all Smart Money analysis. This indicator automatically identifies and tracks swing highs and swing lows using a sophisticated pivot detection algorithm. These aren't just any price points—they represent areas where the market showed a significant shift in supply and demand dynamics.
How It Works: The indicator uses a customizable lookback period to identify valid swing points. A swing high must have lower highs on both sides within the lookback period, and a swing low must have higher lows on both sides. This ensures that only significant structural points are marked, filtering out minor noise and consolidation.
Visual Presentation:
Bullish Structure (Cyan Lines): Horizontal lines extending from each identified swing high, showing resistance levels that price previously respected
Bearish Structure (Red Lines): Horizontal lines extending from each identified swing low, showing support levels where buying pressure emerged
Trading Application: These structure levels serve multiple purposes:
Target Zones: Previous highs become targets in uptrends; previous lows become targets in downtrends
Invalidation Levels: If expecting a bullish move, breaking below the last swing low invalidates the setup
Context for Other Signals: All BOS, CHOCH, and liquidity sweep signals gain meaning from their relationship to structure
Multi-Timeframe Anchors: Higher timeframe structure provides context for lower timeframe entries
Advanced Tip: When multiple timeframe structures align (e.g., a daily swing low coincides with a 4-hour swing low), these levels carry significantly more weight and are more likely to be defended or, when broken, lead to explosive moves.
2. Break of Structure (BOS) - Trend Confirmation
What It Is: A Break of Structure occurs when price definitively closes beyond a previous swing high (bullish BOS) or swing low (bearish BOS). This signals that the current trend maintains its momentum and is likely to continue in the same direction.
The Institutional Perspective: When institutions want to continue pushing price in a direction, they need to break through previous resistance or support. A clean BOS indicates that:
There's sufficient institutional buying/selling to overcome the supply/demand at previous structure
The trend has enough momentum to attract more participants
Stop losses above/below structure have been triggered, providing liquidity for continuation
Signal Characteristics:
Bullish BOS Label: Appears below the bar that closes above the previous swing high
Bearish BOS Label: Appears above the bar that closes below the previous swing low
Confirmation: Requires a full candle close, preventing false signals from wicks
Trading Strategies:
Trend Continuation Entries: After a BOS, wait for a pullback to a Fair Value Gap or minor structure, then enter in the direction of the break
Breakout Trading: Enter immediately on BOS confirmation with a stop below the broken structure
Momentum Confirmation: Use BOS to confirm that your existing position is aligned with institutional flow
Scaling Strategy: Add to positions on each successive BOS in trending markets
What to Watch For:
Volume: Strong BOS movements should be accompanied by above-average volume
Speed: Rapid price movement through structure suggests institutional urgency
Follow-Through: The best BOS signals see price continue strongly without immediately reversing
Higher Timeframe Alignment: BOS on higher timeframes (4H, Daily) carry more weight than lower timeframe breaks
Common Pitfalls:
Not all structure breaks are equal—BOS during ranging markets are less reliable
A BOS immediately followed by a reversal back into the range may indicate a failed breakout
During major news events, structure can be broken temporarily without institutional intent
3. Liquidity Sweep Detection - Spotting Manipulation
What It Is: Liquidity sweeps (also called "stop hunts" or "liquidity grabs") occur when price temporarily breaks beyond a key level to trigger stop losses and pending orders, then immediately reverses back. This is one of the most important concepts in SMC trading because it reveals intentional manipulation.
Why Institutions Do This: Large institutional orders can't be filled at a single price point—they need massive liquidity. The biggest pools of liquidity sit just beyond obvious highs and lows where retail traders place their stops. By briefly pushing price into these zones, institutions:
Trigger retail stop losses (creating market orders)
Activate pending buy/sell orders
Fill their large positions at favorable prices
Trap late breakout traders before reversing
Detection Methodology: The indicator identifies sweeps using multiple criteria:
Price must penetrate beyond the structural high/low (creating the sweep)
The candle must close back on the opposite side of the structure (confirming rejection)
The sweep distance is measured against ATR to distinguish manipulation from normal volatility
The sweep multiplier setting allows you to adjust sensitivity based on market conditions
Visual Indicators:
Orange Down Arrows: Mark liquidity sweeps above structural highs
Lime Up Arrows: Mark liquidity sweeps below structural lows
Liquidity Zone Boxes: Semi-transparent colored boxes highlight the exact range of the swept area
Persistent Display: Zones remain visible for several bars to maintain context
Trading Applications:
Reversal Trading: Liquidity sweeps often mark excellent reversal points. After a sweep:
Wait for the sweep to complete (candle closes back inside structure)
Look for a Change of Character signal for confirmation
Enter in the direction opposite to the sweep
Place stops beyond the sweep high/low
Target the opposite side of the range or next structural level
Continuation Filtering: Not all sweeps lead to reversals. During strong trends:
Sweeps of minor structure in a trending market often precede continuation
Use higher timeframe structure to determine if a sweep is counter-trend (likely reversal) or with-trend (likely continuation)
Entry Refinement: In ranging markets, trade from swept lows to highs and vice versa, as institutions accumulate at the extremes.
Advanced Sweep Analysis:
Double Sweeps: When both sides of a range are swept, expect a strong breakout
Sweep Rejection Quality: Fast, strong rejections of sweeps are more reliable than slow grinding returns
Timeframe Consideration: Daily timeframe sweeps are significantly more important than 15-minute sweeps
Volume Profile: Sweeps with low volume followed by high volume reversals confirm manipulation
What Makes a High-Quality Sweep Signal: ✅ Penetrates structure by at least 0.5-1x ATR
✅ Strong rejection candle (long wick, decisive close)
✅ Occurs at a higher timeframe structural level
✅ Creates a Change of Character on the following move
✅ Sweeps an obvious level where retail stops cluster
4. Change of Character (CHOCH) - Major Reversal Signals
What It Is: A Change of Character represents the most significant shift in market dynamics—when the entire structural bias of the market flips from bullish to bearish or bearish to bullish. CHOCH signals are the crown jewel of SMC trading because they identify the exact moment when institutional positioning fundamentally changes.
The Anatomy of a CHOCH: A valid CHOCH requires a specific sequence:
Established Trend: A clear directional bias with multiple BOS in one direction
Liquidity Engineering: A sweep of structure in the current trend direction (the manipulation phase)
Structural Break: Price then breaks structure in the OPPOSITE direction (the revelation phase)
This combination shows that institutions have:
Completed their accumulation/distribution at favorable prices (via the sweep)
Shifted their positioning from bullish to bearish (or vice versa)
Begun a new directional campaign
Visual Presentation:
Bullish CHOCH (Cyan Triangle Up): Appears when bearish structure is broken after a low sweep, signaling the shift to bullish control
Bearish CHOCH (Red Triangle Down): Appears when bullish structure is broken after a high sweep, signaling the shift to bearish control
Prominent Markers: Larger and more visually distinct than BOS signals, reflecting their importance
Why CHOCH Signals Are So Powerful:
Trend Reversal Identification: They mark the earliest possible confirmation of a trend change
High Win Rate: When combined with proper risk management, CHOCH signals have among the highest success rates in SMC trading
Risk-Reward Ratio: Entering at CHOCH gives you the best possible risk-reward since you're entering at the beginning of a new trend
Institutional Confirmation: The sequence of sweep + structure break proves institutional repositioning, not just retail sentiment
Trading CHOCH Signals:
The Perfect CHOCH Setup:
Identify the Sweep: Watch for a liquidity sweep of structural lows (for bullish) or highs (for bearish)
Wait for the Break: Don't enter on the sweep—wait for structure to break in the opposite direction
CHOCH Confirmation: The indicator fires the CHOCH signal—this is your entry trigger
Entry Execution:
Aggressive: Enter immediately on CHOCH confirmation
Conservative: Wait for a pullback to the first Fair Value Gap or broken structure (now turned support/resistance)
Stop Placement: Beyond the swept liquidity point
Target Selection: Previous swing in the opposite direction, or let it run to the next CHOCH
Multiple Timeframe CHOCH Strategy: The most powerful setups occur when CHOCHs align across timeframes:
Daily CHOCH: Signals major institutional trend change, target 500+ pips (Forex) or significant point moves
4H CHOCH: Confirms daily direction, provides swing trade opportunities
1H CHOCH: Offers precise entry timing within the higher timeframe trend
15M CHOCH: Used for position scaling and intraday management
Example Trade Flow:
Daily Chart: Bullish CHOCH appears after weeks of downtrend
↓
4H Chart: Wait for pullback after the daily CHOCH, then catch the 4H bullish CHOCH
↓
1H Chart: Enter on the 1H bullish CHOCH that aligns with both higher timeframes
↓
Result: You've entered at the beginning of a major trend with multiple confirmations
CHOCH Quality Grading:
A-Grade CHOCH (Highest Probability):
Occurs at major higher timeframe structure
Following a clear liquidity sweep
Volume spike on the structural break
Multiple timeframe alignment
Creates a large Fair Value Gap on the break
B-Grade CHOCH (Good Probability):
Valid sweep and structure break
Single timeframe signal
Moderate volume
Occurs at minor structure
C-Grade CHOCH (Lower Probability):
Choppy, ranging market context
Weak sweep or unclear structure
Counter to higher timeframe trend
Low volume confirmation
Common Mistakes with CHOCH Trading: ❌ Entering on the sweep instead of waiting for the structure break
❌ Ignoring higher timeframe context
❌ Taking every CHOCH regardless of quality
❌ Not waiting for pullbacks on aggressive trends
❌ Placing stops too tight, getting caught in volatility
Advanced CHOCH Concepts:
Failed CHOCH: Occasionally, what appears to be a CHOCH will fail (price reverses back into the previous trend). This often indicates:
Insufficient institutional conviction for the reversal
Fake-out to grab liquidity in the opposite direction
Need to wait for a higher timeframe CHOCH for confirmation
When a CHOCH fails, it often sets up an even stronger continuation of the original trend.
CHOCH vs BOS Decision Matrix:
If in doubt about trend direction → wait for CHOCH
If confident in trend → trade BOS continuations
After a CHOCH → next signals in the new direction are BOS
5. Fair Value Gaps (FVG) - Institutional Retracement Zones
What It Is: Fair Value Gaps represent price imbalances where the market moved so quickly that it left behind inefficient pricing. These gaps form when there's no overlap between the current candle's wick and the candle from two bars ago—a void in the price action that creates a "gap" in the order flow.
The Institutional Logic: When institutions execute large market orders, they can push price rapidly through levels without allowing normal two-way trading. This creates unfilled orders and imbalanced order books. Institutions often return to these gaps to:
Fill additional orders at more favorable prices
Allow the market to "breathe" before the next push
Create support/resistance at the gap for the next move
Restore balance to the order book
FVG Formation Criteria: This indicator uses enhanced FVG detection logic:
Bullish FVG (Upward Gap):
Current candle's low is above the high from 2 candles ago
Creates a visible gap where no trading occurred
Gap size must exceed 30% of ATR (filtering minor gaps)
Typically forms on strong bullish momentum candles
Market moved up so fast it left unfilled sell orders
Bearish FVG (Downward Gap):
Current candle's high is below the low from 2 candles ago
Creates a visible gap where no trading occurred
Gap size must exceed 30% of ATR
Typically forms on strong bearish momentum candles
Market moved down so fast it left unfilled buy orders
Visual Presentation:
Bullish FVG Zones: Semi-transparent cyan boxes extending from gap bottom to top
Bearish FVG Zones: Semi-transparent red boxes extending from gap top to bottom
Dynamic Management: Gaps automatically removed when filled or expired
Clean Display: Only active, unfilled gaps shown to prevent chart clutter
FVG Trading Strategies:
Strategy 1: FVG Retracement Entries After a CHOCH or strong BOS, wait for price to retrace into the FVG for entry:
Identify trend direction via CHOCH or BOS
Locate the nearest FVG in the direction of the trend
Set limit orders within the FVG zone
Stop loss beyond the FVG
Target the next structural level or previous swing
Strategy 2: FVG Breakout Confirmation When price breaks through an FVG without filling it:
Signals extreme institutional urgency
Indicates the move is likely to continue strongly
The unfilled gap becomes a "no-go zone" for counter-trend entries
Strategy 3: Multiple FVG Management When multiple FVGs form in sequence:
The first FVG is most likely to be filled
If price skips the first FVG, it signals exceptional strength
Sequential gaps create a "gap ladder" for scaling into positions
FVG Quality Assessment:
High-Quality FVGs (Best Trading Zones):
Large gap size (1.5x+ ATR)
Formed on high volume impulse moves
Aligned with higher timeframe structure
Created during CHOCH or strong BOS
Positioned between current price and key structure
Low-Quality FVGs (Use Caution):
Small gaps (< 0.5 ATR)
Formed during choppy, ranging conditions
Multiple overlapping gaps in the same area
Counter to higher timeframe trend
Very old gaps (50+ bars ago)
FVG Lifecycle Management:
The indicator intelligently manages FVG zones:
Gap Filling:
Bullish FVG is "filled" when price touches the bottom of the gap
Bearish FVG is "filled" when price touches the top of the gap
Filled gaps are automatically removed from the chart
Partial fills count as complete fills (institutions got their orders)
Gap Expiration:
Gaps older than the extension period (default 10 bars) are removed
This keeps the chart clean and focuses on relevant levels
Adjustable from 5-50 bars based on timeframe and trading style
Gap Priority: When multiple gaps exist, closest gap to current price is most relevant
Advanced FVG Concepts:
Nested FVGs: Sometimes FVGs form within larger FVGs. The smaller, more recent gap typically gets filled first, providing a secondary entry within the larger gap.
FVG Clusters: When 3+ FVGs stack in the same zone, this area becomes a major institutional reaccumulation zone—excellent for swing entries.
Inverted FVGs: Bullish FVGs in downtrends or bearish FVGs in uptrends can act as resistance/support where rallies/dips fail.
FVG + Liquidity Sweep Combination: The ultimate entry setup:
Liquidity sweep occurs
CHOCH confirms reversal
Price retraces into FVG created during the CHOCH move
Enter with exceptional risk-reward ratio
FVG Statistics & Probabilities:
Research on FVG behavior shows:
Approximately 70% of FVGs get filled within 20 bars
FVGs formed during CHOCH have 80%+ fill rate
Larger gaps (2x+ ATR) have lower but higher-quality fill rates
Higher timeframe FVGs are more magnetic than lower timeframe
Timeframe Considerations:
Daily FVGs:
Can remain unfilled for weeks
Major institutional zones
Often mark the absolute best entry prices for swing trades
When filled, usually result in strong reactions
4H FVGs:
Typically fill within 3-7 days
Excellent for swing trading
Balance between frequency and reliability
1H FVGs:
Usually fill within 1-3 days
Good for short-term position trading
More frequent signals
15M FVGs:
Often fill same day
Best used for intraday refinement
Should align with higher timeframe gaps
🔧 Customization & Settings Guide
Structure Detection Settings
Swing Lookback Period (3-50 bars): This is arguably the most important setting as it determines what the indicator considers "structure."
Low Values (3-7):
Identifies minor swings and frequent structure points
More BOS and CHOCH signals
Better for scalping and day trading
Risk: More false signals in choppy markets
Best for: 15M-1H charts, active traders
Medium Values (8-15):
Balanced approach capturing meaningful swings
Default setting works well for most traders
Good signal-to-noise ratio
Best for: 1H-4H charts, swing traders
High Values (16-50):
Only major structural points identified
Fewer but higher-quality signals
Cleaner charts with less noise
Better for trending markets
Best for: 4H-Daily charts, position traders
ATR Period (1-50): Controls how volatility is measured for liquidity sweep detection.
Shorter Periods (7-14):
More responsive to recent volatility changes
Better during high volatility events
May overreact to short-term spikes
Longer Periods (15-30):
Smoother, more stable volatility measurement
Better for swing trading
Reduces sensitivity to short-term noise
Liquidity Sweep Multiplier (0.5-3.0): Determines how far beyond structure price must move to qualify as a sweep.
Low Multiplier (0.5-0.9):
Catches smaller, more frequent sweeps
More signals but lower reliability
Good for scalping or high-frequency trading
Use in ranging markets
Medium Multiplier (1.0-1.5):
Balanced sensitivity
Default 1.2 works for most situations
Good signal quality
High Multiplier (1.6-3.0):
Only major, obvious sweeps detected
Fewer but very high-quality signals
Best for trending markets
Use when you want only the clearest setups
Display Options
Toggle Controls: Each component can be individually enabled/disabled:
Show Market Structure:
Turn off when chart becomes too cluttered
Essential for understanding context, generally keep ON
Disable only when you know structure from higher timeframe
Show Liquidity Zones:
Highlights swept areas with boxes
Can be disabled if you prefer cleaner charts
Keep ON when learning to spot manipulation
Show Break of Structure:
BOS labels can be disabled if trading only reversals
Keep ON for trend following strategies
Show Change of Character:
Core SMC signal, usually keep ON
Only disable if focusing purely on continuation trading
Show Fair Value Gaps:
OFF by default to prevent overwhelming new users
Turn ON once comfortable with basic structure
Can generate many zones on lower timeframes
FVG Extension Period (5-50 bars): Determines how long unfilled gaps remain displayed.
Short Extension (5-10):
Keeps charts very clean
Only shows very recent gaps
Good for day trading
May remove gaps before they fill
Medium Extension (11-25):
Balanced approach
Captures most gap fills
Good for swing trading
Long Extension (26-50):
Shows historical gap context
Better for position trading
Higher timeframe analysis
Can make charts busy on lower timeframes
Color Scheme Customization
Why Colors Matter: Visual clarity is crucial for quick decision-making. The color scheme should:
Clearly distinguish bullish vs bearish elements
Work well with your chart background (dark/light mode)
Be visible but not distracting
Match your personal preference for aesthetics
Default Colors:
Bullish: Cyan (
#00ffff) - visibility and association with "cool" buying
Bearish: Red (
#ff0051) - visibility and universal danger/selling association
FVG Bullish: 85% transparent cyan - visible but not overpowering
FVG Bearish: 85% transparent red - visible but not overpowering
Customization Tips:
Increase transparency if zones overwhelm price action
Use higher contrast colors on light backgrounds
Keep bullish/bearish colors visually distinct
Test colors across different market conditions
Optimization by Market Type
Forex (24-hour markets):
Structure Lookback: 10-15
ATR Period: 14-21
Sweep Multiplier: 1.0-1.5
Best Timeframes: 15M, 1H, 4H
Stocks (Session-based):
Structure Lookback: 8-12
ATR Period: 14
Sweep Multiplier: 1.2-1.8
Best Timeframes: 5M, 15M, 1H, Daily
Note: Gaps at market open/close aren't FVGs
Cryptocurrency (High volatility):
Structure Lookback: 12-20 (filter noise)
ATR Period: 10-14 (responsive to volatility)
Sweep Multiplier: 1.5-2.5 (larger sweeps)
Best Timeframes: 15M, 1H, 4H
Indices (Moderate volatility):
Structure Lookback: 10-15
ATR Period: 14-20
Sweep Multiplier: 1.0-1.5
Best Timeframes: 1H, 4H, Daily
📈 Complete Trading System & Strategies
The Complete SMC Trading Process
Step 1: Higher Timeframe Analysis (Daily/4H) Begin every trading session by analyzing higher timeframes:
Identify the prevailing market structure (bullish or bearish)
Mark key swing highs and lows
Note any recent CHOCHs that signal trend changes
Identify major Fair Value Gaps that could act as targets or entry zones
Determine areas of liquidity (obvious highs/lows where stops cluster)
Step 2: Trading Timeframe Setup (1H/4H) Move to your primary trading timeframe:
Wait for alignment with higher timeframe bias
Look for CHOCH signals if expecting reversal
Look for BOS signals if expecting continuation
Identify liquidity sweeps that create trading opportunities
Note nearby FVGs for entry refinement
Step 3: Entry Timeframe Execution (15M/1H) Use lower timeframe for precise entry:
After higher timeframe signal, wait for lower timeframe confirmation
Enter on FVG fills, structure breaks, or CHOCH signals
Place stop beyond swept liquidity or broken structure
Set targets at next structure level or opposite side of range
Step 4: Management Active trade management increases profitability:
Move stop to breakeven after price moves 1R (risk unit)
Take partial profits at first target (structure level)
Let remainder run to major targets
Trail stop using FVGs or structure breaks in your direction
Exit if a counter-trend CHOCH appears
High-Probability Trading Setups
Setup 1: The Classic CHOCH Reversal
Market Context:
Extended trend in one direction
Price reaching obvious highs/lows where liquidity pools
Setup Requirements:
Liquidity sweep of the high/low
CHOCH signal fires
(Optional) Wait for pullback to FVG
Entry: On CHOCH confirmation or FVG fill
Stop: Beyond swept liquidity
Target: Previous swing in opposite direction
Example (Bullish):
Market in downtrend for 2 weeks
Price sweeps below obvious daily low
Bullish CHOCH fires (breaks previous lower high)
Enter immediately or wait for pullback to bullish FVG
Stop below swept low
Target: Previous lower high, then previous high
Risk-Reward: Typically 1:3 to 1:5+
Setup 2: BOS Continuation with FVG Entry
Market Context:
Established trend with recent CHOCH
Strong momentum in trend direction
Setup Requirements:
Recent CHOCH established trend direction
BOS signal confirms continuation
Wait for pullback into FVG created on the BOS move
Entry: Limit order within FVG zone
Stop: Beyond FVG (invalid if exceeded)
Target: Next structural level
Example (Bearish):
Bearish CHOCH 2 days ago
Price makes BOS breaking new low
Large bearish FVG created during the break
Price retraces into FVG zone
Enter short at FVG fill
Stop above FVG
Target: Next major low or daily FVG below
Risk-Reward: 1:2 to 1:4
Setup 3: Liquidity Sweep Fade
Market Context:
Ranging market between defined highs/lows
Obvious liquidity on both sides of range
Setup Requirements:
Clear range established (minimum 20-30 bars)
Price sweeps one side of range (high or low)
Strong rejection back into range
Entry: After sweep rejection confirmed
Stop: Beyond swept level
Target: Opposite side of range
Example:
Range between 1.0850-1.0920 (EUR/USD)
Price sweeps above 1.0920 to 1.0935
Strong bearish rejection candle back below 1.0920
Enter short at 1.0915
Stop at 1.0940 (above sweep high)
Target: 1.0850 (range low)
Risk-Reward: 1:2.6
Setup 4: Multi-Timeframe CHOCH Alignment
Market Context:
Major trend change occurring
Multiple timeframes showing reversal signals
Setup Requirements:
Daily timeframe shows CHOCH
Wait for 4H CHOCH in same direction
Enter on 1H CHOCH that aligns
Entry: 1H CHOCH confirmation
Stop: Below 4H structure
Target: Daily structural level
Example (Bullish):
Daily bearish trend for months
Daily bullish CHOCH appears
4H shows bullish CHOCH next day
1H bullish CHOCH provides entry
Enter long on 1H signal
Stop: Below 4H swing low
Target: Daily previous high
Risk-Reward: 1:5 to 1:10+
Position: Larger size due to alignment
Setup 5: Failed CHOCH Continuation
Market Context:
Strong trend temporarily looks like reversing
"False" CHOCH creates trap for counter-trend traders
Setup Requirements:
Apparent CHOCH against main trend
Price fails to follow through
Original trend resumes with strong BOS
Entry: On BOS in original trend direction
Stop: Recent swing
Target: Extension of original trend
Example:
Strong daily uptrend
Bearish CHOCH appears (potential reversal)
Price consolidates but doesn't follow through down
Bullish BOS breaks above recent consolidation
Enter long on BOS
Stop: Below failed CHOCH low
Target: New high extension
Risk-Reward: 1:3 to 1:6
Note: Failed reversals often lead to explosive continuations
Risk Management Framework
Position Sizing: Never risk more than 1-2% of account per trade, even on A+ setups.
Risk Calculation:
Position Size = (Account Size × Risk %) / (Entry - Stop Loss in pips/points)
Example:
Account: $10,000
Risk: 1% = $100
Entry: 1.0900
Stop: 1.0870 (30 pips)
Position Size: $100 / 30 pips = $3.33 per pip
Lot Size (Forex): 0.33 lots
Stop Loss Placement:
For CHOCH Reversals:
Place stop 5-10 pips beyond swept liquidity
Gives room for volatility while protecting capital
If swept liquidity is violated, setup is invalidated
For BOS Continuations:
Place stop beyond the FVG or structure that provided entry
Typically tighter stops (closer to entry)
Can trail stop to breakeven quickly
For Range Trading:
Stop beyond the swept level
Generally tight stops work well in ranges
Exit quickly if range boundaries break
Take Profit Strategy:
Scaling Out Method (Recommended):
First Target (50% of position): First structural level (1:1 to 1:2)
Second Target (30% of position): Major structure (1:3 to 1:5)
Trail Stop (20% of position): Let run to full extension
Full Exit Method:
Hold entire position to predetermined target
Requires more discipline
Higher reward but also higher risk of giveback
Trade Management Rules:
Breakeven Rule: Move stop to breakeven after 1R profit
Partial Profit Rule: Take partials at structure levels
Trailing Rule: Trail stop
