Position Size Calculator + Live R/R Panel — SMC/ICT (@PueblaATH)Position Size + Live R/R Panel — SMC/ICT (@PueblaATH)
Position Size + Live R/R Panel — SMC/ICT (@PueblaATH) is a professional-grade risk management and execution module built for Smart Money Concepts (SMC) and ICT Traders who require accurate, repeatable, institution-style trade planning.
This tool delivers precise position sizing, R:R modeling, leverage and margin projections, fee-adjusted PnL outcomes, and real-time execution metrics—all directly on the chart. Optimized for crypto, forex, and futures, it provides scalpers, day traders, and swing traders with the clarity needed to execute high-quality trades with confidence and consistency.
What the Indicator Does
Institutional Position Sizing Engine
Calculates position size based on account balance, % risk, and SL distance.
Supports custom minimum lot size rounding across crypto, FX, indices, and derivatives.
Intelligent direction logic (Auto / Long / Short) based on SMC/ICT structure.
Advanced Risk/Reward & Profit Modeling
Real-time R:R ratio using actual rounded position size.
Live PnL readout that updates with price movements.
Gross & net profit projections with full fee deduction.
Execution Planning with Draggable Levels
Entry, SL, and TP levels fully draggable for fast scenario modeling.
Automatic projected lines backward/forward with clean label alignment.
TP and SL tags include % movement from Entry, ideal for SMC/ICT journaling.
Precise modeling of real exchange fee structures
Maker fee per side
Taker fee per side
Mixed fee modes (Maker entry, Taker exit, Average, etc.)
Leverage & Margin Forecasting
Margin requirements displayed for 3 customizable leverage settings.
Helps traders understand capital commitment before executing the trade.
Useful for futures, crypto perps, and CFD setups.
Clean HUD Panel for Rapid Decision-Making
A full professional trading panel displays:
Target & actual risk
Position size
Entry / SL / TP
TP/SL percentage distance
Gross profit
Net profit (after fees)
Fees @ TP and @ SL
Live PnL
Margin requirements
Optimized for SMC & ICT Workflows
Perfect for traders using:
Breakers, FVGs, OBs
Liquidity sweeps
Session models
Precision entries (OTE, Displacement, Rebalancing)
Leverage-based execution (crypto perps, futures)
How to Use It
Attach the indicator to your chart.
Set account balance, risk %, fee model, and leverage presets.
Drag Entry, SL, and TP to shape the setup.
View instant calculations of: Position size; R:R; Net PnL after fees; Margin required
Use it as your pre-trade checklist & execution model.
Originality & Credits
This script is an original creation by @PueblaATH, released under the MPL 2.0 license.
It does not copy, modify, or repackage any existing TradingView code.
All logic—including the fee engine, margin calculator, responsive HUD, dynamic risk model, and visual execution system—is authored specifically for this indicator.
Recherche dans les scripts pour "fvg"

PDH/PDL Sweep & Rejection - sudoPDH/PDL Sweep + Rejection
This indicator identifies classic liquidity sweeps of the previous day's high or low, then confirms whether price rejected that level with force. It is built to highlight moments when the market takes liquidity and immediately snaps back in the opposite direction, a behavior often linked to failed breakouts, engineered stops, or clean reversals. The tool marks these events directly on the chart so you can see them without manually watching the daily levels.
What it detects
The indicator focuses on two events:
PDH sweep and rejection
Price breaks above the previous day's high, overshoots the level by a meaningful amount, and then closes back below the high.
PDL sweep and rejection
Price breaks below the previous day's low, overshoots, and then closes back above the low.
These are structural liquidity events, not random wicks. The script checks for enough overshoot and strong bar range to confirm it was a genuine stop grab rather than noise.
How it works
The indicator evaluates each bar using the following logic:
1. Previous day levels
It pulls yesterday's high and low directly from the daily timeframe. These act as the PDH and PDL reference points for intraday trading.
2. Overshoot measurement
After breaking the level, price must push far enough beyond it to qualify as a sweep. Instead of using arbitrary pips, the required overshoot is scaled relative to ATR. This keeps the logic stable across different assets and volatility conditions.
3. Range confirmation
The bar must be larger than normal compared to ATR. This ensures the sweep happened with momentum and not because of small, choppy price movement.
4. Rejection close
A valid signal only prints if price closes back inside the previous day's range.
For a PDH sweep, the bar must close below PDH.
For a PDL sweep, the bar must close above PDL.
This confirms a failed breakout and a rejection.
What gets placed on the chart
Red downward triangle above the bar: Previous Day High sweep and rejection
Lime upward triangle below the bar: Previous Day Low sweep and rejection
The markers appear exactly on the bar where the sweep and rejection occurred.
How traders can use this
Identify potential reversals
Sweeps often occur when algorithms target liquidity pools. When followed by a strong rejection, the market may be preparing for a reversal or rotation.
Avoid chasing breakouts
A clear sweep warns that a breakout attempt failed. This can prevent traders from entering at the worst possible location.
Time entries at extremes
The markers help you see where the market grabbed stops and immediately turned. These areas can become high quality entry zones in both trend continuation and countertrend setups.
Support liquidity based models
The indicator aligns naturally with trading frameworks that consider liquidity, displacement, failed breaks, and microstructure shifts.
Add confidence to confluence-based setups
Combine sweeps with displacement, FVGs, or higher timeframe levels to refine entry timing.
Why this indicator is helpful
It automates a pattern that traders often identify manually. Sweeps are easy to miss in fast markets, and this tool eliminates the need to constantly monitor daily levels. By marking only the events that show overshoot plus rejection plus significant range, it filters out the weak or false signals and leaves only meaningful liquidity events.

MTF Market Structure Pro [Elykia]MTF Market Structure Pro - Fractal Flow System
Overview
The MTF Market Structure Pro is a comprehensive trading system designed to decode the fractal nature of the markets.
Most traders fail because they focus on a single timeframe, missing the "Big Picture". This algorithm simultaneously maps market structure (Highs/Lows) across 3 distinct timeframes overlaid on your chart.
It automatically identifies trends, pivot points, and price inefficiencies (EPA/FVG), giving you an X-ray vision of institutional order flow.
💎 The Strategy: "Fractal Alignment"
This tool is optimized for the "Triple Sync" strategy. Never trade against the macro trend.
1. The Bias (Sequence C / TF3): Look at the highest structure (e.g., H4). If the markers are Green/Ascending (HH/HL), the flow is Bullish. Look for buys only.
2. The Retracement (Sequence B / TF2): On the intermediate timeframe (e.g., M15), wait for price to pull back into an inefficiency zone (dashed "EPA" lines) or test a previous structural level.
3. The Entry (Sequence A / TF1): This is your trigger (e.g., M1 or M5). Wait for the structure to realign with Sequence C.
Buy Signal: TF3 is Bullish + Price retraces + TF1 breaks structure to the upside (creating a new HH).
Key Features
⚡ Multi-Timeframe Analysis (3-Layer): Displays 3 independent structures (A, B, C) with distinct colors for instant readability.
📊 Smart Dashboard: A summary panel shows real-time Trend (Bull/Bear) and Market State (Balanced or Open Gap) for each Timeframe.
🎯 Inefficiency Lines (EPA): Automatically plots unvisited price zones (Imbalances) that act as magnets for price action.
⚙️ 100% Customizable: Choose your timeframes, colors, and dashboard position.
Settings Guide
Sequence A: Your execution timeframe (e.g., Current Chart or M5).
Sequence B: Your intraday trend (e.g., M15 or H1).
Sequence C: Your macro bias (e.g., H4 or Daily).
Tip: Ensure you use distinct colors for each sequence to keep the chart clean.
⚠️ DISCLAIMER
This indicator is a technical analysis support tool and does not constitute financial advice. Trading involves a risk of capital loss. Past performance does not guarantee future results.

Square of Nine Levels [RC] Advance📐 Square of Nine Levels — Precision Market Geometry for Dynamic Price Targets
The Square of Nine Levels indicator is a powerful price-projection and level-mapping tool based on W.D. Gann’s legendary Square of Nine mathematical system. This indicator transforms market prices into geometric rotations and harmonic levels—revealing price zones where markets historically accelerate, pause, or reverse with uncanny accuracy.
Unlike static Fibonacci tools, Square of Nine levels expand radially around a chosen base price, creating concentric price cycles that align with vibrational mathematics, planetary motion analogies, and cyclical market resonance. When price interacts with these rotational degrees, traders often witness structural reactions that are invisible to standard indicators.
🧭 What This Indicator Does
Once a trader inputs (or clicks) a Base Price, the indicator automatically:
✔️ Computes Square of Nine projections in upward and downward directions
✔️ Plots concentric price circles (levels of expansion)
✔️ Highlights rotational harmonics and midpoint attractors
✔️ Shows Golden Ratio (0.618 / 0.382) cyclic divisions
✔️ Provides clear visual level markers & labels for analysis
✔️ Adjusts dynamically as price trends evolve
These levels act as mathematical magnets, where price frequently:
Finds hidden support or resistance
Creates fair value rejection zones
Forms breakout thresholds
Completes wave and time cycles
Resonates with prior swing pivots
🔍 Key Features
Feature Benefit
_________________________________________________________________________
Auto Square-of-Nine Level Calculation Zero manual computation—instant geometry
Adjustable Circles & Points Model Gann expansions as per your theory
Golden Ratio & Midpoint Zones Adds confluence for precision entries
Multi-color Cycle Layers Instantly differentiate price cycles
Minimal UI Designed for professional clean charts
🧠 Why the Square of Nine Matters
Gann believed that price does not move randomly—it rotates through degrees, harmonics, and vibrational frequencies. The Square of Nine captures this rotation mathematically:
Price in time equals price in space.
This tool reveals those rotational levels, allowing traders to anticipate when price is likely to pivot or continue—with mathematically predictable targets.
🎯 Best Use-Cases
Identifying major support/resistance levels
Timing cycle inflection points
Confluence with Wave Theory, SMC, FVGs, and geometry
Swing, positional, and index-level forecasting
If you trade using Gann methods, cycles, harmonics, Square of 9, or astro-geometry, this indicator becomes a foundational timing and projection engine.
🚀 Take Your Charting to the Next Dimension
The Square of Nine Levels is not just a level plotter—it is a market resonance system. Once you understand how price vibrates around these circles, you gain a structural edge that most traders never discover.

Market Maker EngineThe Core Concept: "Weighted Probability"
Most indicators just look for one thing (like lines crossing). This indicator is different. It acts like a judge scoring a gymnastics competition. It looks at 5 different factors simultaneously and assigns points to them.
It only gives you a CALL or PUT signal if the total confidence score is 80% or higher.
The "Brain"; Scoring Trades
1. Smart Money Concept; (30pts)
What it looks for: ICT Fair Value Gaps (FVG).
Why: This is the most heavily weighted factor because it identifies where institutions (banks/hedge funds) have left a "footprint" of aggressive buying or selling.
Logic: If price creates a gap that isn't filled by the next candle, it signals a strong imbalance.
2.Volume Anomalies (25 Points)
What it looks for: Is the volume statistically unusual? (Z-Score > 2.0).
Why: Retail traders trade with standard volume. "Smart Money" trades with massive volume spikes.
Logic: If volume is 2x higher than the average and price is moving in your direction, it adds 25 points.
3.Momentum Alignment (20 Points)
What it looks for: RSI and MACD working together.
Why: You don't want to catch a falling knife.
Logic:
Bull: RSI > 50 AND MACD Line > Signal Line.
Bear: RSI < 50 AND MACD Line < Signal Line.
4.Trend Filter (15 Points)
What it looks for: The 50-period Exponential Moving Average (EMA).
Why: "The trend is your friend."
Logic: It checks if the price is simply above (Bullish) or below (Bearish) the 50 EMA.
5.The "Squeeze" (10 Points)
What it looks for: Bollinger Bands contracting inside Keltner Channels.
Why: This signals "pent-up energy." When volatility gets low (squeeze), a violent explosive move usually follows.
HOW TO READ AND USE THIS INDICATOR
🟢 GREEN ARROW (CALL): The algorithm is at least 80% confident that price is going UP. (Structure + Volume + Momentum are aligned).
🔴 RED ARROW (PUT): The algorithm is at least 80% confident that price is going DOWN.
🟡 YELLOW CANDLES: These are "Whale Alerts." The volume on this specific candle is statistically abnormal. Even if there is no arrow, pay attention—big money is active here.
⚫ BLACK SCOREBOARD: On the very last candle, you will see a text box (e.g., Bull: 65%). This shows you the live calculation. If you see it climbing (40%... 60%... 75%...), a signal might be imminent.
Recommend Strategy;
This script should be favorable to Day Trade
Timeframe: Stick to the 10-minute or 15-minute chart. (The noise on the 1-minute might trigger false 80% scores).
The "Yellow" Rule: If you see a Yellow Candle without an arrow, wait. It means volume is high, but the trend/structure isn't ready yet.
Exit Strategy: Since this is an entry indicator, you should look to take profits at the next logical Support/Resistance level or when the Momentum (RSI) reverses.

Liquidity FinderFinds Liquidity inside FVG's, and utilizes an ema to decide if it should look for bullish or bearish liquidity.

SCOTTGO ORB V1SCOTTGO ORB (Opening Range Breakout) Indicator
The ORB Indicator is a powerful tool for day traders and scalpers, designed to automatically identify and project key price levels based on the market's initial trading activity—the Opening Range (OR).
It helps you quickly visualize the market structure, potential breakout zones, and price targets for the day.
🔑 Key Features & Customization
1. Dynamic Opening Range Calculation
Flexible Time Periods: Easily define your Opening Range using preset times of 5, 15, or 30 minutes. You can also use the International Overrides to set a custom start and end time with a specified timezone.
Visual Range: The indicator automatically calculates and shades the range between the ORB High and ORB Low prices. The Opacity of this shaded box is fully adjustable.
2. Comprehensive Price Targets
The indicator projects multiple levels of price targets (PTs) based on the size of the initial Opening Range, enabling you to set profit targets and manage risk. Targets are grouped for easy toggling:
Default Targets (50%): Visualize the immediate $50\%$ price extension above and below the ORB.
Extended Targets (75%, 100%): View the $75\%$ and full $100\%$ extension levels.
Further Targets (150%, 200%): Explore extended targets for volatile or trending days.
Mid Point: Optional line to display the $50\%$ retracement/midpoint of the ORB itself.
3. Fibonacci Extensions
Access highly relevant price projections using classic Fibonacci ratios:27.2% and 61.8% Extensions: These provide additional high-probability price targets for breakout scenarios.
4. Breakout & Retest Signaling
Entry Signals: Displays on-chart labels for potential ORB Breakouts and subsequent
Retests (BRB), helping you identify high-probability entry points.
Alert Options: Set alerts for simple ORB level crosses or restrict alerts only to confirmed breakout scenarios (Alert only on ORB breakouts).
🎨 Style Customization
All main ORB lines, target levels, and Fibonacci lines can be individually styled (color, thickness, line type) directly within the TradingView Style tab for a personalized chart experience. Dedicated inputs are available for setting colors for 50%, 75%, 100%, and Fibonacci 27.2% / 61.8% levels.
💡 How to Use
1. Set Your ORB Period: Choose the time frame that best suits your market (e.g., 15 minutes is common for US indices).
2. Monitor the Breakout: Once the ORB session ends, wait for the price to break above the ORB High or below the ORB Low.
3. Target and Risk: Use the projected Price Targets to define your potential profit zones, and place stop-losses just inside the ORB range.
SCOTTGO

NQ × ES SMT Panel — Ace v3.5NQ × ES SMT Panel — Ace v3.5 (6-Year Model)
This panel reads the 10:45 → 11:00 ET window on NQ and checks for sweeps of the 10:45 candle with SMT confirmation from ES.
It then shows you direction, quality of the signal, and 6-year follow-through stats.
🕒 Recommended Use
Chart: NQ / MNQ
Timeframe: 15-minute
Session: New York (focus on 10:45 and 11:00 ET)
ES symbol input: default ES1! (can be changed in settings)
The script only “makes decisions” on the 11:00 candle close.
🔍 What the Model Looks For
1. NQ Sweep of 10:45 Candle
Bull Sweep (Long bias)
11:00 low < 10:45 low
11:00 close > 10:45 low
Bear Sweep (Short bias)
11:00 high > 10:45 high
11:00 close < 10:45 high
This means: price took liquidity beyond 10:45, then closed back inside.
2. ES SMT Filter (Confirmation)
Bullish SMT
NQ does a bull sweep (takes the low)
ES does NOT make a lower low vs its own 10:45 low
Bearish SMT
NQ does a bear sweep (takes the high)
ES does NOT make a higher high vs its own 10:45 high
If NQ sweeps but ES doesn’t follow, you have SMT and a stronger signal.
📋 Panel Fields (What You See)
The panel is 4 rows, 1 column:
Header
NQ × ES SMT — Ace v3.5 | | Score:
Status can be:
BULLISH SMT
BEARISH SMT
Bull Sweep
Bear Sweep
No Signal
Sweep Direction
Sweep Direction: LONG ↑
Sweep Direction: SHORT ↓
- when no signal
Follow-Through Text
For SMT:
Bullish → High Odds 60-100 Handle Move
Bearish → High Odds 40-80 Handle Move
For pure sweeps:
Normal Follow-through
For no signal: blank
6-Year Stats Line
Shows how often the move reached 40/60/80 handles in the modeled direction:
Example (Bullish SMT):
SMT Stats (6y): 40h=64%, 60h=51%, 80h=41%
Example (Bearish SMT):
SMT Stats (6y): 40h=58%, 60h=42%, 80h=29%
Sweeps without SMT show Sweep Stats (6y): …
No signal: Stats: n/a
⭐ Score Meaning
5★ → SMT present (A+ setup)
3★ → Clean sweep, no SMT (B setup)
0★ → No valid sweep (NO-GO)
Use the score + stats line to decide if the idea deserves risk today.
📈 How to Trade It (Conceptual)
Wait for 11:00 candle to close.
Check panel:
If BULLISH SMT, 5★ → bias long.
If BEARISH SMT, 5★ → bias short.
If Bull/Bear Sweep, 3★ → optional, lower priority.
If No Signal, 0★ → stand aside.
Use your own execution model for entries:
Look for FVG/OB setups in the direction the panel confirms.
Targets can be based on your handle objectives (e.g., 40–80 handles) and intraday structure.
⚠️ Important Notes
Panel is a bias and stats tool, not an auto-entry system.
Works best on regular trading days (avoid major news spikes if you choose).
All stats are based on a 6-year historical lookback on NQ vs ES in this exact 10:45→11:00 structure.

ZynIQ Order Block Master Pro v2 - (Pro Plus Pack)Overview
ZynIQ Order Block Master Pro v2 identifies areas where price showed strong displacement and left behind significant zones of interest. It highlights potential reaction areas, continuation blocks and mitigation zones based on structural behaviour and directional flow.
Key Features
• Automatic detection of bullish and bearish order block zones
• Optional refinement filters for higher-quality zones
• Displacement-aware logic to reduce weak signals
• Optional mitigation markers when price revisits a zone
• Configurable sensitivity for different markets and timeframes
• Clean labels and minimal chart clutter
• Complements structure, liquidity and FVG tools
Use Cases
• Highlighting key reaction areas based on previous strong moves
• Tracking potential continuation or reversal zones
• Combining order blocks with BOS/CHOCH and liquidity mapping
• Building confluence with breakout or volume tools
Notes
This tool provides contextual price zones based on displacement and structural movement. It is not a standalone trading system. Use with your own confirmation and risk management.

ZynIQ Liquidity Master Pro v2 - (Pro Pack)Overview
ZynIQ Liquidity Master v2 (Pro) identifies key liquidity pools and sweep zones using automated swing logic, equal-high/low detection and multi-level liquidity mapping. It provides a clear view of where liquidity may be resting above or below price, helping traders understand potential sweep or mitigation behaviour.
Key Features
• Automatic detection of EQH/EQL (equal highs/lows)
• Mapping of major swing liquidity zones
• Optional PDH/PDL (previous day high/low) and weekly levels
• Detection of potential liquidity sweep areas
• Clean labels for swing points and liquidity clusters
• Configurable sensitivity for different markets or timeframes
• Lightweight visuals with minimal clutter
Use Cases
• Identifying major liquidity pools above or below price
• Spotting potential sweep conditions before reversals
• Anchoring market structure or FVG tools with liquidity context
• Understanding where price may target during expansion moves
Notes
This tool identifies areas of resting liquidity based on swing and equal-high/low logic. It is not a standalone trading system. Use with your preferred confirmation and risk management.

ZynIQ Market Structure Master v2 - (Pro Pack)Overview
ZynIQ Market Structure Master v2 (Pro) maps structural shifts in price action using automated BOS/CHOCH detection, swing analysis and directional flow. It provides a clear view of when the market transitions between expansion, pullback and reversal phases.
Key Features
• Automated BOS (Break of Structure) and CHOCH detection
• Swing high/low mapping with optional filtering
• Directional flow logic for identifying trend vs reversal phases
• Optional EQ levels and mitigation markers
• Configurable structure sensitivity for different timeframes
• Clean labels and minimal clutter for fast interpretation
• Suitable for intraday and swing structure analysis
Use Cases
• Identifying key structural shifts in trend
• Spotting early reversal signals via CHOCH
• Assessing trend continuation vs distribution/accumulation
• Combining structure with liquidity, FVG or breakout tools
Notes
This tool provides structural context using break-of-structure and swing logic. It is not a trading system by itself. Use alongside your own confirmation and risk management.

CS Institutional X-Ray (Perfect Sync)Title: CS Institutional X-Ray
Description:
CS Institutional X-Ray is an advanced Order Flow and Market Structure suite designed to reveal what happens inside Japanese candles.
Most traders only see open and close prices. This indicator utilizes VSA (Volume Spread Analysis) algorithms and Synthetic Footprint Logic to detect institutional intervention, liquidity manipulation, and market exhaustion.
🧠 1. The Mathematical Engine: Synthetic Footprint
The core of this indicator is not based on moving average crossovers, but on market physics: Effort vs. Result.
The script scans every candle and calculates:
Buy/Sell Pressure: Analyzes the close position relative to the total candle range and weights it by volume.
Synthetic Delta: Calculates the net difference between buyer and seller aggression.
Volume Anomalies: Detects when volume is abnormally high (Institutional) or low (Retail).
The Absorption Logic: The indicator hunts for divergences between candle color and internal flow.
Example: If price drops hard (Red Candle) with massive volume, but the close moves away from the low, the algorithm detects that massive LIMIT orders absorbed the selling pressure. Result: Institutional Buy Signal.
📊 2. The Institutional Semaphore (Visual Guide)
The indicator automatically recolors candles to show the real state of the auction:
🔵 CYAN (Whale Buy): Bullish Absorption. Institutions buying aggressively or absorbing selling pressure at support.
🟣 MAGENTA (Whale Sell): Bearish Absorption. Institutions selling into strength or stopping a rally with sell walls.
⚪ GREY (Exhaustion/Zombie): "No-Trade" Zone. Volume is extremely low. The movement lacks institutional backing and is prone to failure.
🟢/🔴 Normal: Market in equilibrium.
🛡️ 3. Smart Zone System (Market Memory)
The indicator draws and manages Support and Resistance levels based on volume events, not just pivots.
Virgin Zones (Bright): When a "Whale" appears, a solid line is projected. If price has not touched it again, it is a high-probability bounce zone.
Automatic Mitigation: The exact moment price touches a line, the indicator detects the mitigation. The line turns Grey and Dotted, and the label dims. This keeps the chart clean, showing only what is relevant now.
☠️ 4. Manipulation Detector (Liquidity Grabs)
The system distinguishes between a normal reversal and a "Stop Hunt".
Signal: ☠️ GRAB
Logic: If price breaks a previous Low/High to sweep liquidity and closes with an absorption candle (Whale), it is marked as a "Grab." This is the system's most powerful reversal signal.
🧱 5. FVG with Liquidity Score
The indicator draws Fair Value Gaps (Imbalances) and assigns them a volume score.
"Vol: 3.0x": Indicates that the gap was created with 3 times the average volume, making it a much stronger price magnet than a standard FVG.
🚀 How to Trade with CS Institutional X-Ray
Identify the Footprint: Wait for a Cyan or Magenta candle to appear.
Validate the Trap: If the signal comes with a "☠️ GRAB" label, the probability of success increases drastically.
The Retest (Entry): Do not chase price. Place a Limit order on the generated Zone Line or at the edge of the FVG.
Management: Use opposite zones or mitigated zones (grey) as Take Profit targets.
Included Settings:
Fully configurable Alerts for Whales, Grabs, and Retests.
Total customization of colors and styles.

Prime-Time × Vortex (3/6/9) — Ace (clean v3)1️⃣ Prime-Time Index (PT)
A bar becomes Prime-Time when the count satisfies the formula:
4·n − 3 is a perfect square
This generates the sequence:
1, 3, 7, 13, 21, 31, 43, 57, 73, 91, …
These are time windows where price is more likely to form:
Shifts in market structure
Impulses
Reversals
Liquidity expansions
These PT bars are drawn as small circles above the candle.
If labels are enabled, the counter value (n) is also shown.
2️⃣ Vortex 3/6/9 Digital-Root Timing
Every bar also has a digital root, calculated from the counter:
If n → digitalRoot(n) = 3, 6, or 9,
the bar is considered a Vortex bar.
These moments often align with:
Swing highs / swing lows
Micro shifts
Mini-reversals
Minor liquidity grabs
When a Prime-Time bar is also a 3/6/9 bar → high-probability timing.
These bars are highlighted in green by default.
3️⃣ Filters & Display
You can customize:
Anchor time → when counting begins
Reset daily → restart counter each new trading day
Show only 3/6/9 → hides normal PT hits
Label offset → distance above the candle
Color themes
This makes the indicator usable on:
1Min
5Min
15Min
1H
Any timeframe you want
4️⃣ How To Apply It in Trading
Use it as a time confluence tool, not a signal generator.
✔ Best ways to use:
Look for MSS, sweeps, OB retests, FVG reactions when
they occur on or near a Prime-Time or 3/6/9 bar
Expect volatility increases after PT bars
Use 3/6/9 hits to anticipate internal turning points
Combine with:
Session High/Low
Killzones (London, NYO, PM)
Purge Protocol
MMXM Execution
✔ Example:
If price sweeps a level and prints a 3/6/9 vortex bar inside a PT window →
you have a very strong timing alignment for reversal.
5️⃣ Simple Summary
Feature Meaning
Prime-Time Hit (PT) Major time window where price often shifts
3/6/9 Vortex Bar Micro-timing for internal swings
PT + 3/6/9 together High-probability timing for entries
Reset Daily Perfect for intraday models like NYO & London
Anchor Time Defines the entire cycle structure

CRT MTF + HTF Candles - Milana TradesCRT MTF + HTF Candles is an educational tool that helps you visualize higher-timeframe CRT and HTF candles on your intraday chart
The script automatically tracks key HTF levels and shows three types of CRT events:
1. Pending CRT
When a higher-timeframe candle breaks the previous high or low, the indicator marks this as a “pending” CRT.
This helps you see potential liquidity grabs and where price is currently trapped inside the HTF range
2. Completed CRT
A CRT becomes “completed” when price reaches the opposite side of the previously broken level
3. Invalid CRT
If price closes outside the HTF range before completion, the CRT is marked as invalid.
This helps you identify failed breaks and possible reversals.
Multi-Timeframe HTF Candles
The script draws clean higher-timeframe candles directly on your lower timeframe chart.
Each candle includes:
Body and wicks
HTF open & close
Swing high/low markers
Timeframe labels
Optional timers (showing time remaining in the candle)
Optional imbalances (FVG / volume imbalance)
Optional Midpont line (0.5)
HTF candle spacing
You can adjust candle width, spacing, and alignment so HTF candles fit nicely over lower-TF bars.
Gaps & Imbalances
The tool can highlight:
Fair value gaps
Volume imbalance
Swing Sweep line
When price tried update swing but closed inside the candle cange
Equlibrium line (Midpoint 0.5)
Timeframe tags & timers
Shows clear labels for each HTF candle
You can choose which timeframes to show (1H, 2H, 4H, Daily, etc.) and how many candles should be displayed
Trade smart, stay disciplined, and keep improving every day
Enjoy :)

MM Trap Reversal System [TradeHawk]MM TRAP REVERSAL SYSTEM by Timmy741
The only indicator that doesn't just show arrows — it gives you the full battle plan.
Detects real Market Maker stop hunts (liquidity sweeps) and tells you exactly:
WHAT TO DO → BUY / SELL / WAIT
WHEN TO ENTER → Exact trigger candle
WHERE TO ENTER → Current close (or better on pullback)
WHERE YOUR STOP GOES → ATR or wick-based
YOUR TARGETS → 1:2, 1:3, 1:4+ calculated automatically
CONFIDENCE → Filtered by volume, trend, chop, overextension
NO TRADE ZONES → When to stay the hell out (this saves accounts)
FEATURES
• Real swing high/low breach + rejection detection
• Strong wick requirement (default 50%+ of candle)
• Volume confirmation option
• Smart filters: kills trades in chop, low volume, overextended moves
• ADX + VWAP + deviation filters
• Full risk:reward calculation per trade
• Clean trade instruction panel (no clutter)
This is the system professional prop traders use to catch reversals after stop runs.
Works on all markets: Forex, Stocks, Futures, Crypto
Best on 15m – 4H timeframes
No repainting | No future leak | No magic
Just pure price action + liquidity concepts.
Released under MPL 2.0 — fully open source because real traders share the real stuff.
#mmtrap #stophunt #liquidity #reversal #smartmoney #ict #orderblock #fairvaluegap #fvg #propfirm #proptrading #reversalsystem

Support Line [by rukich]🟠 OVERVIEW
The indicator displays a floating line that acts as a support level. It's important to remember that any support level can be broken.
🟠 COMPONENTS
The indicator is based on the percentage difference between the closes of the n-th bar back and the current bar. The resulting percentage is smoothed to remove noise.
The indicator is displayed as a green-red line (the colors don’t carry meaning — they are used just for visual variety). When the price touches the support level, the bar background turns green.
For convenience, there is a label on the right side of the indicator showing the current value of the line.
🟠 HOW TO USE
The indicator includes several settings that can be adjusted, though optimal defaults are provided.
Settings:
Timeframe — specifies which timeframe’s data is used to calculate the line.
Candles back — specifies how many bars back from the current one are used.
The indicator should be used according to general support-zone logic. Since no support zone guarantees a price bounce, the optimal approach is to confirm the reaction after the price touches the line.
Example of use:
In the current example, the Timeframe in the indicator settings is set to 1 hour, and the currently open chart is 5 minutes. This means that on the 5-minute chart we see a 1-hour line. After the price touches the support line, you need to see a confirmation of the reaction to understand whether the support zone is holding the price.
In the examples, reaction confirmation is shown through: the formation of an M5 shift and the invalidation of an FVG M5- (the latter is more risky than the M5 shift):
🟠 CONCLUSION
The indicator shows a floating support zone, and when tested, you should confirm the reaction on a lower timeframe.

4H EMA 21/30 Cloud on 15mThis indicator displays the 4-hour EMA 21 and EMA 30 as a dynamic cloud directly on the 15-minute chart, providing a clean and reliable higher-timeframe trend filter for intraday and scalping setups.
The cloud turns:
Green when EMA21 > EMA30 → bullish HTF trend
Red when EMA21 < EMA30 → bearish HTF trend
Because the 4H EMA 21/30 combination tracks mid-term momentum and trend structure extremely well, this indicator helps traders avoid counter-trend trades, time pullbacks more effectively, and align entries with dominant higher-timeframe flow.
Perfect for traders using:
Price Action
FVG / Imbalance concepts
CHOCH/BOS structure
Liquidity-based models
ICT-style intraday execution
Use the 4H cloud as your HTF bias anchor, and execute trades using your own entry model on the 15m timeframe.

Ryan Liquidity Hunt Algo Premium Liquidity Hunt Algo — detects institutional swing liquidity, order blocks, and premium/discount zones.
Shows auto-drawn swing boxes, liquidity lines (daily/weekly/monthly), FVG gaps, and optional OI/volume filters to highlight high-probability areas — designed for clear structure-based trade decisions and visual clarity.

Forex Sessions [Fax Academy]Forex Sessions — Precision Session Mapping for Professional Traders
Overview
Highlights the four major FX sessions — Sydney, Tokyo, London, New York — directly on your chart.
Kill Zones: high-impact windows around the session open (default 10 minutes).
Timezone-aware with full DST support — sessions that cross midnight shade correctly.
Engineered for clean intraday context, overlap visibility, and professional session-based execution.
What It Shows
Kill Zones — bold-tinted windows around each session's open.
Full Session Shading — lighter background for the entire active window.
London–New York Overlap highlight for maximum-liquidity hours.
Inputs
Timezone
Exchange • UTC • Europe/London • America/New_York • Asia/Tokyo • Australia/Sydney
Use Exchange to automatically align with instrument time.
Per-Session Controls for Sydney, Tokyo, London, New York:
Kill Zone toggle + custom minutes (default 10)
Full Session toggle
Start/End hour (24h format)
How To Use
Set the Timezone first — regional options auto-adjust for DST (London/New York).
Enable Kill Zones to expose opening-volatility spikes and liquidity sweeps.
Tune session hours to match your broker if schedules differ from the global standard.
Watch the London–NY overlap for directional moves, breakouts, and trend continuation.
Practical Tips
Intraday Bias : Favor setups inside or shortly after Kill Zones that align with higher-timeframe structure.
Overlap Hours : Often produce the day’s key breakout/continuation legs.
Combine with:
EMA — pullback precision inside session windows.
FVG — imbalance-based entries during high-liquidity periods.
Defaults
Kill Zones: 10 minutes at each session open.
Full sessions: standard global FX windows (fully adjustable).
Color scheme: bold tint for Kill Zones, subtle tint for session ranges.
Notes
Non-repainting — all shading is based on confirmed chart bars.
Works on any instrument and any timeframe.
If a session’s opening bar is missing (holiday/limited trading), shading is automatically skipped.
Brand
Built by Fax Academy to elevate timing, clarity, and execution in the FX markets.
For educational and analytical use only — always validate with backtesting and disciplined risk management.

Josh FXJoshFX Multi-Timeframe Levels & Fair Value Gap Indicator
This powerful TradingView indicator provides a comprehensive view of key market levels and trends across multiple timeframes. Designed for traders who want precise entries and market context, it includes:
Previous Daily Levels: Automatically marks the previous day’s High, Low, and 50% midpoint.
Multi-Timeframe Trend: Displays the trend direction for 5-minute, 15-minute, 1-hour, and 4-hour charts directly on your current chart.
Daily Candle Display: Shows the current daily candle for quick visual reference.
Pivot Points: Accurately marks technical highs and lows (pivot points) to the exact unit on the chart.
Fair Value Gaps (FVGs): Highlights areas of imbalance for potential high-probability trade setups.
JoshFX Telegram Watermark: Includes branding for the JoshFX community.
This all-in-one tool is perfect for traders combining price action, liquidity concepts, and multi-timeframe analysis to find high-quality setups efficiently.

Arkham ORB Indicator 3.815-Minute ORB Breakout Indicator with Volume Confirmation & Dynamic Risk Management
This closed-source indicator identifies high-probability breakout opportunities during the New York session open (8:30-9:30 AM ET) using a systematic Opening Range Breakout methodology combined with volume validation and adaptive volatility-based risk management.
Core Methodology - How It Works
Opening Range Framework
The indicator establishes the Opening Range by tracking the high and low of the first 15 minutes of the trading session (8:30-8:45 AM ET). This range represents the initial price discovery zone where early participants establish equilibrium. Breakouts above the high or below the low signal potential directional moves as liquidity enters the market during the full NY session.
Volume-Based Breakout Validation
To distinguish genuine breakouts from false moves, the indicator employs a rolling volume analysis system. It calculates a 12-period median of volume and applies a 1.2x threshold multiplier. Only price movements accompanied by volume exceeding this threshold are flagged as valid breakout signals. This approach filters out low-conviction breakouts that often occur in choppy, low-participation conditions and significantly reduces false signals at ORB levels.
Adaptive Volatility-Based Stop Loss Calculation
Unlike fixed-point stop losses, this indicator uses a dynamic calculation based on a 10-day lookback of historical ORB ranges. The stop loss is derived by analyzing recent Opening Range sizes and applying a 0.5x multiplier to the average. This creates three key advantages:
Compression adaptation: When recent ORBs shrink (low volatility), stops automatically tighten to reduce risk exposure
Expansion adaptation: When recent ORBs expand (high volatility), stops widen to prevent premature exits on legitimate moves
Hybrid intelligence: The system detects outlier volatility days by comparing current ORB size to the 10-day average. When divergence exceeds 50%, it recognizes abnormal conditions and adjusts stop placement accordingly rather than blindly using historical averages
Multi-Entry Risk Framework
The indicator recognizes that different traders enter at different points relative to the ORB level. It provides simultaneous risk calculations for three entry strategies:
Direct ORB Entry (0-point offset): Immediate breakout entries at the ORB high/low
Pullback Entry 1 (default 5.5 points): Conservative entries waiting for initial retracements
Pullback Entry 2 (default 11.0 points): Deeper retest entries for very conservative approaches
Each entry type displays independently calculated metrics (stop loss distance, contract sizing, take profit levels) that account for the actual entry point's distance from the ORB level. This ensures accurate position sizing and risk/reward ratios regardless of which entry method you use.
Smart Volatility Detection & Alerts
The indicator continuously compares the current day's ORB size against the 10-day historical average. When divergence exceeds a configurable threshold (default 50%), it alerts you to abnormal market conditions:
Compression warnings: When today's ORB is 50%+ smaller than average (potential low-volatility trap)
Expansion warnings: When today's ORB is 50%+ larger than average (potential news event or unusual volatility)
This allows you to adjust expectations and position sizing based on whether current conditions match your backtested historical environment.
Risk Management Safeguards
Min/Max Stop Loss Caps
To prevent extreme stop placements in unusual conditions:
Minimum stop: 35 points (prevents overly tight stops that get hit by noise)
Maximum stop: 75 points (caps risk exposure during extreme volatility events)
Both caps are fully adjustable and can be toggled on/off
Contract Rounding & Risk Display
The indicator automatically rounds to whole contracts and displays real-time risk metrics including:
Suggested stop loss level (adjusted for entry offset + volatility)
Number of contracts (sized to your account risk parameters)
Suggested take profit level (maintains your configured risk/reward ratio)
Dollar risk and potential profit for each entry type
What Makes This Original
This indicator combines several methodological elements that work together as a cohesive risk management system:
Volume confirmation prevents trading every ORB breakout indiscriminately
Adaptive volatility stops ensure your risk scales with current market conditions, not fixed assumptions
Multi-entry framework provides accurate calculations for various entry styles without requiring separate indicators
Outlier detection warns when today's conditions deviate significantly from your backtested norms
Integrated position sizing removes the mental math from determining contracts and risk/reward
Rather than simply plotting ORB levels or using fixed stops, this system adapts to changing volatility while validating breakouts with participation metrics.
How to Use It
Apply to a 5-minute chart of futures instruments (optimized for MNQ/NQ)
Set your account risk parameters in settings (account size, risk per trade %)
Monitor the ORB formation period (8:30-8:45 AM ET) - levels will be drawn
Watch for breakout signals during 8:45-9:30 AM ET with volume confirmation
Choose your entry style from the three displayed options based on your risk tolerance
Use the suggested stops and targets from the real-time risk table
Pay attention to volatility warnings - adjust position sizing if conditions are abnormal
Fully Customizable Settings
All parameters used in the indicator's calculations are user-adjustable, allowing you to adapt the system to your trading style and risk tolerance:
ORB Configuration
ORB formation period start/end times
Entry offset distances (Entry 1 and Entry 2 point values)
Display toggles for each entry type
Volume Analysis
Volume lookback period (default: 12)
Volume multiplier threshold (default: 1.2x)
Toggle volume filtering on/off
Stop Loss Calculation
Historical lookback period (default: 10 days)
Stop loss multiplier (default: 0.5x)
Calculation method: Historical Average, Current Day ORB, or Hybrid
Minimum stop cap (default: 35 points)
Maximum stop cap (default: 75 points)
Toggle min/max caps on/off
Volatility Alerts
Divergence threshold for outlier detection (default: 50%)
Alert display toggles
Risk Management
Account size
Risk percentage per trade
Risk/reward ratio for take profit calculations
Display Options
Table positions and sizes (compact mode)
Color schemes
Show/hide individual components
This flexibility allows you to backtest different parameter combinations and optimize the indicator for current market conditions or your specific trading approach. You are in full control of the calculations - the indicator simply automates the math based on your inputs.
Ideal For
Futures traders (MNQ/NQ) seeking a systematic, rule-based approach to NY session open breakouts with pre-calculated risk parameters that automatically adapt to changing market volatility. Particularly useful for traders who want to eliminate emotional decision-making around stop placement and position sizing.
Important Disclaimers
No Financial Advice
This indicator is provided for educational and informational purposes only. It does not constitute financial advice, investment advice, trading advice, or any other sort of advice. You should not treat any of the indicator's content, outputs, or signals as such. The author is not a licensed financial advisor.
Risk Warning
Trading futures and derivatives involves substantial risk of loss and is not suitable for all investors. Past performance of any trading system or methodology is not necessarily indicative of future results. You should carefully consider whether trading is appropriate for you in light of your experience, objectives, financial resources, and other relevant circumstances.
No Performance Guarantees
While this indicator is designed to identify high-probability setups based on historical analysis, there is no guarantee of profitable results. Market conditions change, and what worked in backtesting may not work in live trading. Due to the leveraged nature of futures trading, losses can significantly exceed your initial investment.
Use at Your Own Risk
All trading decisions made based on this indicator are your sole responsibility. The author assumes no responsibility for your trading results, losses, or any damages resulting from the use of this indicator. Always use proper risk management and never risk more than you can afford to lose.
Backtesting vs. Live Trading
Results generated from backtesting may not reflect actual trading performance due to factors including but not limited to: slippage, commissions, market liquidity, emotional decision-making, and differences between historical and real-time data.
Not a Guarantee of Accuracy
While efforts have been made to ensure the indicator functions as described, no software is perfect. You are responsible for verifying the indicator's calculations and outputs before making any trading decisions.

Daily Weekly Highs & LowsOverview
This indicator automatically plots the previous day’s and previous week’s Highs and Lows, giving you instant clarity on the most important market liquidity levels. These levels often act as magnets for price and serve as key decision zones for intraday and swing traders.
Whether you're looking for liquidity sweeps, breakout confirmations, or simple bias alignment — this tool gives you an immediate visual edge.
Features
Precise anchoring from HH/LL
Lines begin exactly at the previous High/Low with no delays or offsets, ensuring clean and accurate structure visualization.
Visual breakout detection
The indicator highlights where price has broken above or below the previous day/week levels, helping you instantly spot liquidity grabs and market intent.
How It Works
Automatically detects the previous day’s High/Low.
Automatically detects the previous week’s High/Low.
Plots clean horizontal levels starting from the original HH/LL point.
Monitors price in real time and marks the exact candle that breaks the level.
Optionally highlights sweeps or simple breaks, depending on your trading style.
How to Use
Use previous day High/Low for intraday bias, liquidity sweeps, and breakout plays.
Use previous week High/Low for swing bias and higher-timeframe liquidity targets.
Combine breaks with your entry model (FVG, BOS/CHOCH, displacement, etc.).
Watch for fakeouts (liquidity sweeps) followed by reversal signals on lower timeframes.
Monitor alert notifications to avoid staring at the chart all day.
Alerts
Receive notifications the moment price interacts with key levels:
Previous Day High Break
Previous Day Low Break
Previous Week High Break
Previous Week Low Break
(Alerts trigger exactly at the level break — no repainting.)

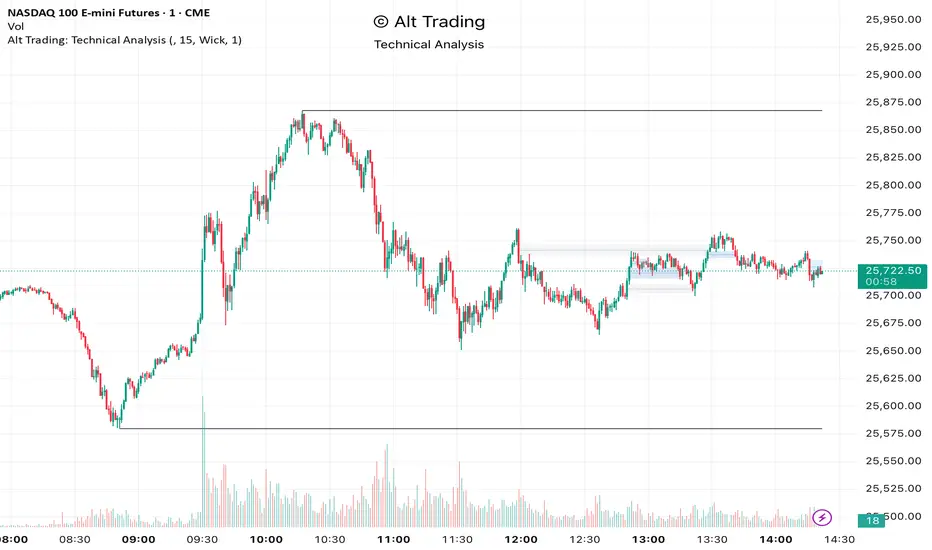
Alt Trading: Technical Analysis
A streamlined, high-quality indicator that displays the essential intraday levels. It highlights the Current Day High/Low (CDH/CDL), Previous Day High/Low (PDH/PDL), Current Week High/Low (CWH/CWL), and the most recent Fair Value Gaps (FVGs or iFVGs) on any selected timeframe—providing clear structural context for informed intraday decision-making.