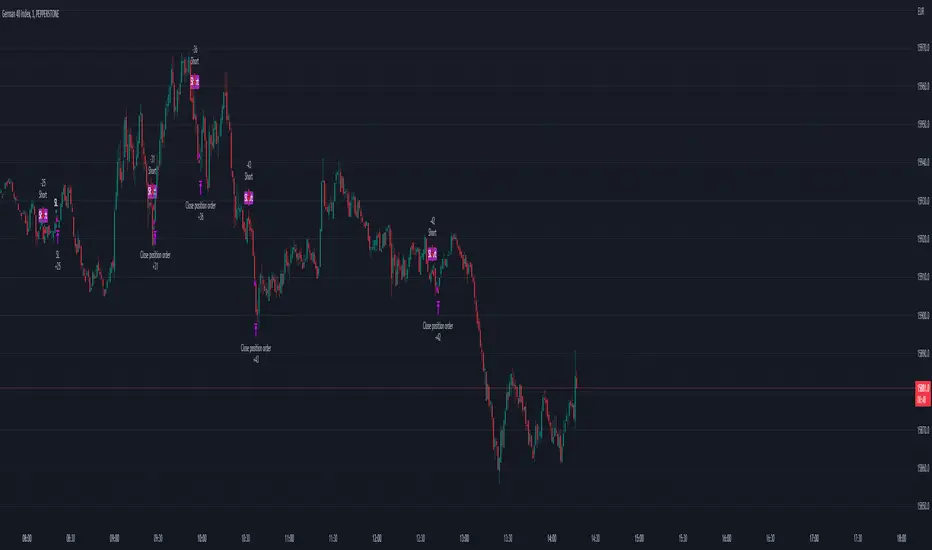
FVG Strategy - Fair Value GapThe Fair Value Gap Strategy (FVG) is a trading approach that relies on price action analysis and involves identifying market inefficiencies or imbalances.
The strategy offers a variety of customizable settings to match your preferences and includes an entry and exit strategy to guide you through trades.
The script operates in the following manner:
It begins by searching for fair-value-gaps and subsequently identifies a break in structure.
The next step involves waiting for the price to retrace within the previously established fair value gap.
Within this gap, there is a Fibonacci retracement that must be reached before placing a stop-order.
Example: GER40, 1min Chart
STOP LOSS & RISK MANAGEMENT
FVG : The stop loss will be set at the end of the fair value gap
Last Swing : The stop loss will be at the last swing high/low
ATR (Average True Range) : The stop loss will be placed one 'Average True Range' away from the entry
TAKE PROFIT
Pips/Points : The stop loss will be set at the chosen amount of pips/points.
RiskReward TP : This is a fixed take profit where you can set a specific risk-to-reward ratio for the trade. For example, you can set a 1:3 risk-to-reward ratio.
Trailing Stop : This is a flexible stop that moves with the market price, allowing you to capture more profit as the trade moves in your favor.
Both : This option combines both the RiskReward TP and Trailing Stop. If the price target is set at a 1:3 risk-to-reward ratio, the trailing stop will move with the price until either the stop or take profit is reached, and the position will be closed completely.
THE FVG SECTION
In the FVG section, you will have the ability to customize your settings based on your specific requirements.
Firstly, you will have the choice of two possible entry options:
Candle Close : This option triggers the order once the candle has completely closed and all the set requirements are met.
Stop Orders : This option triggers the order once all the set requirements are met, even if the candle is still active and has not yet closed.
On top, you can activate the "Pinbar-Trading", that will allow you to take a trade on a pinbar, even when the candle just dipped into the FVG and snapped back.
FAIR VALUE GAP TYPE
On volatile market, it may happen that a massive FVG is created. Thats why we have separated the FVG into 2 different variables.
FVG Type: Normal : This is all regular FVG that meet the requirement of you minimum size range. As example FVG must be minimum 5$ big.
FVG Type: Big : This are all big FVG that meet the minimum set size range. The difference to the "normal" type, the stop loss will be set at 50% of the Big-FVG.
FIBONACCI RETRACEMENT & MARKET STRUCTURE
To refine the FVG strategy, you have three options:
Fibonacci Retracement Value (%) : The FVG strategy employs a Fibonacci retracement, which allows you to trade in the direction of the market movement. To initiate the order, the price must reach a predetermined Fibonacci level and then rebound.
Formation-to-Retracement Countdown: : This option provides you with a specified number of candles to meet the necessary conditions. For example, if the order is not triggered within 20 candles, delete the FVG-Zone and skip the trade to avoid getting caught in a sideways ranging trend.
Structure Lookback : This feature filters out older FVG Zones. You can specify the number of candles that should mark the FVG Zones. Keep in mind that newer and fresher zones will automatically conceal older ones.
Recherche dans les scripts pour "high low"
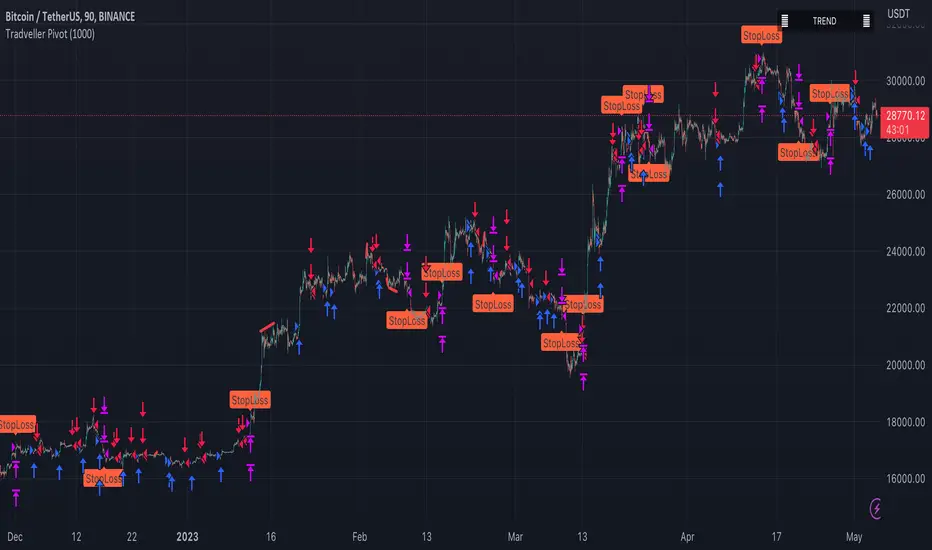
Tradveller PivotA pivot strategy is a trading technique that involves identifying key price levels, called pivot points, where a financial instrument is likely to experience a change in direction. Pivot points serve as potential support and resistance levels, which can help traders make informed decisions on when to enter or exit positions, set stop-loss or take-profit orders, and gauge market sentiment.
The pivot point itself is calculated using the high, low, and closing prices of the previous trading period (usually daily, but it can be applied to any timeframe). Once the pivot point is determined, additional support and resistance levels can be calculated around it. There are several methods to calculate these levels, with the most common being the classic, Woodie's, Camarilla, and Fibonacci methods.
A pivot strategy usually involves the following steps:
Calculate the pivot point and support and resistance levels using one of the methods mentioned above.
Observe the market price action and identify if the price is trading above or below the pivot point. If the price is above the pivot point, it indicates bullish sentiment, while trading below the pivot point suggests bearish sentiment.
Use the support and resistance levels to identify potential entry and exit points. Traders might consider buying when the price approaches a support level and selling when it approaches a resistance level.
Set stop-loss orders and take-profit targets based on the calculated levels, ensuring proper risk management.
Pivot strategies can be used in various market conditions and timeframes, and they often work well in combination with other technical analysis tools and indicators. However, like any trading strategy, it's essential to use proper risk management techniques and understand that no strategy guarantees success in every trade.
Strategy Myth-Busting #13 - MultiEMA+BXTrender - [SP/MYN]#13 on the Myth-Busting bench, we are automating the "I Found The Highest Win Rate 15 Minute Scalping Trading Strategy Ever" strategy from "TradeIQ" who claims to have backtested this manually and achieved 410% profit over 100 trades within 6 months on Natural Gas with 79 Wins / 21 Losses with an astounding 3.96% Max Drawdown.
It was quite challenging emulating the same subjective EMA pullback logic along with the dependent sequencing of events necessary to enter a trade and we might improve on this to make it better in the future. Super kudos to @spdoinkal who helped with this strategy. If you have ideas on how this could be improved on, would love to hear about them.
As is, we were unable to substantiate similar results to what was manually backtested by TradeIQ, we do however see potential here. Given some optimizations and improvements to the the entry logic accommodating for a wider more variable margin after pullbacks reestablish above/below the fast EMA we think the performance of this strategy could certainly be improved upon. So not sure if we have totally myth busted this completely at this point in time.
This strategy uses a combination of 2 open-source public indicators:
3 EMA's (Trading View Internal)
B-Xtrender by Puppytherapy
Three separate (21), (89) and (200) EMA's are used as a means to confirm and keep entry out of ranged markets. When the 3 EMA's are all clumped up together with no distance it's indicative of a flat or ranged market. This is then used in conjunction with B-XTrender as a means to detect the trend direction. B-XTrender which is a trend following indicator originally published in the IFTA Journal by Bharat Jhunjhunwala. It uses both a short and long term lengths along with a compound EMA used as a means to smooth and sample trend direction.
Trading Rules
15 min candles but other lower time-frames
Stop Loss on previous swing high/low
No Take Profit, Exit on new red/green circles from BX-Trender
Long
EMA Green (21) on top, White (89)in middle and red (200) on bottom and there is distance between EMA's need to be spaced, otherwise in a ranged market
Price action must pull back into 89 EMA (White line) either close or touching it.
Once pullback occurs wait for BX Trender to issue a new green circle and BX Trend line must be green and above 0
Price action must also pull up back above the (Green Line) EMA 21
Short
EMA Red (200) on top, White (89) in middle and Green (21) on bottom and there is distance between EMA's need to be spaced, otherwise in a ranged market
Price action must pull back into 89 EMA (White line) either close or touching it.
Once pullback occurs wait for BX Trender to issue a new red circle and BX Trend line must be red and below 0
Price action must also pull up back below the (green Line) EMA 21
If you know of or have a strategy you want to see myth-busted or just have an idea for one, please feel free to message me.

Strategy Myth-Busting #12 - OSGFC+SuperTrend - [MYN]This is part of a new series we are calling "Strategy Myth-Busting" where we take open public manual trading strategies and automate them. The goal is to not only validate the authenticity of the claims but to provide an automated version for traders who wish to trade autonomously.
Our 12th one is an automated version of the "The Most Powerful Tradingview Buy Sell Signal Indicator " strategy from "Power of Trading" who doesn't make any official claims but watching how he trades with this, it on the surface looked promising. The strategy author uses this on the 15 min strategy on mostly FOREX. Unfortunately as indicated by the backtest results below, we were not able to substantiate any good positive trading metrics from this, be it Profit, Markdown, Num Of Trades etc. This does seem to do okay with some entries but perhaps adding another indicator to this to filter out more noise might make it better. At least how this strategy is presented now, this is not something I recommend anyone use.
This strategy uses a combination of 2 open-source public indicators:
SuperTrend by TradingView Internal
One-Sided Gaussian Filter w/ Channels By Loxx
The SuperTrend indicator and the One-Sided Gaussian Filter complement each other by providing a more complete and accurate picture of market trends. The SuperTrend indicator is used to identify trends. It does this by calculating a moving average of the underlying securities price and then comparing the current price to the moving average. When the current price is above the moving average, the trend is considered bullish, and when it is below, the trend is considered bearish.
The One-Sided Gaussian Filter is a mathematical tool that is used to smooth out fluctuations in financial data. It does this by removing random noise from the data, making it easier to identify patterns and trends.
When the SuperTrend indicator is used in conjunction with the One-Sided Gaussian Filter, the smoothed price data generated by the filter is used as the input for the SuperTrend calculation. This provides a more accurate representation of market trends and helps to eliminate false signals generated by short-term price movements. As a result, the SuperTrend indicator is able to more accurately identify the underlying trend in the market and provide traders with a cleaner and more reliable signal to act upon.
In summary, the SuperTrend indicator and the One-Sided Gaussian Filter complement each other by providing a more accurate and reliable representation of market trends, resulting in improved performance for traders.
If you know of or have a strategy you want to see myth-busted or just have an idea for one, please feel free to message me.
Trading Rules
15 min candles
FOREX or Crypto
Stop loss at swing high/low | 1.5 risk/ratio
Long Condition
SuperTrend and OSGFC generate buy signal
Close Buy on Gaussian generating a sell signal
Short Condition
SuperTrend and OSGFC generate sell signal
Close Buy on Gaussian generating a buy signal

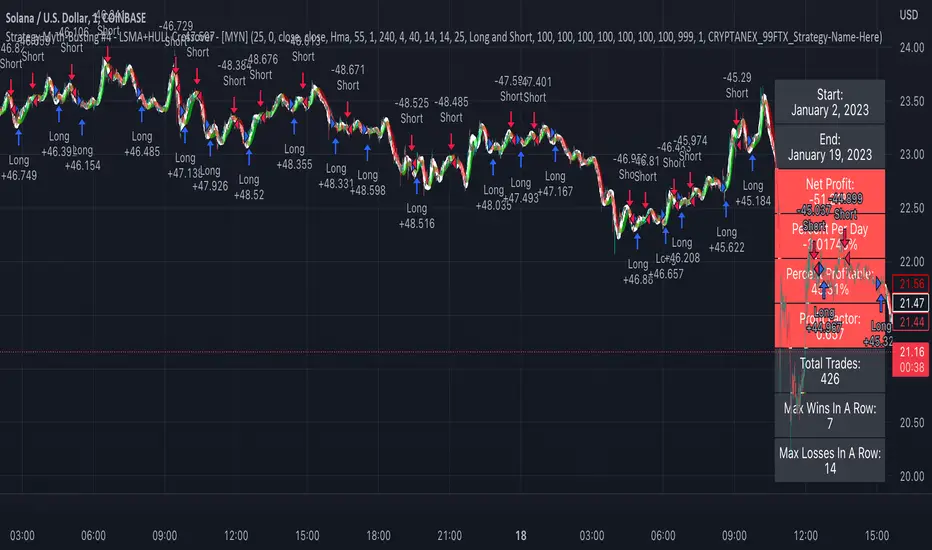
Strategy Myth-Busting #4 - LSMA+HULL Crossover - [MYN]This is part of a new series we are calling "Strategy Myth-Busting" where we take open public manual trading strategies and automate them. The goal is to not only validate the authenticity of the claims but to provide an automated version for traders who wish to trade autonomously.
Our fourth one we are automating is one of the strategies from "I Found The Best 1 Minute Scalping Strategy That Actually Works! ( Beginner Friendly )" from "Trade Domination" who claims to have made 366% profit on the 1 min chart of Solona despite having a 31% win rate in just a few weeks. As you can see from the backtest results below, I was unable to substantiate anything close to that that claim on the same symbol ( SOLUSD ), timeframe (1m) with identical instrument settings that "Trade Domination" was demonstrating with. Strategy Busted.
If you know of or have a strategy you want to see myth-busted or just have an idea for one, please feel free to message me.
This strategy uses a combination of 2 open-source public indicators:
LSMA
Hull Suite by InSilico
Trading Rules
1 min candles
Stop Loss on recent swing High/Low
1:5 Risk Ratio
Enter Long
LSMA cross above Red Hull Suite line
Price has to be above Hull Suite Line
Enter Short
LSMA crosses under green Hull Suite Line
Price has to be below Hull Suite Line
APIBridge Advanced RSI + EMAUsing Pinescript, we will use charts of Cash/Future to trade in Options. Note this strategy works well with even the free version of TradingView.
The Relative Strength Index ( RSI ). Is a momentum oscillator that measures the speed and change of price movements. The RSI oscillates between zero and 100. Increasing RSI shows increasing bullish momentum. Decreasing RSI shows increasing bearish momentum. We take RSI upper bound as 80 to indicate bullish momentum and RSI lower bound as 20 to indicate bearish momentum.
Since this strategy uses underlying data (cash/future) to place trades in Options, please ignore the backtest of this strategy given by TradingView. TradingView does not provide options data but this strategy bypasses it.
Strategy Premise
The Relative Strength Index ( RSI ) is a momentum oscillator that measures the speed and change of price movements. The RSI oscillates between zero and 100. Increasing RSI shows increasing bullish momentum. Decreasing RSI shows increasing bearish momentum. We take RSI upper bound as 80 to indicate bullish momentum and RSI lower bound as 20 to indicate bearish momentum.
apibridge rsi + ema options / futures / commodity algo strategy logic
Long Entry: When RSI crosses over oversold level and fast ema crosses over slow ema , send LE .
Long Exit: When price hit Stop loss or Target .If SL/ TGT is not hit and reverse signal is sent by strategy then exit the Long
Short Entry : When RSI crosses under overbought level and fast ema crosses under slow ema , send SE
Short Exit : When price hit Stop loss or Target. If SL/ TGT is not hit and reverse signal is sent by strategy then exit Short
TradingView Parameters
1. Start Date(Mandatory) : The strategy does not take trade before this date
2. End Date(Mandatory) : The strategy does not take trade after this trade
3.RSI Length(Mandatory): Number of bars used to calculated RSI .
4.Fast Ema Length(Mandatory): Length for fast ema
5.Slow Ema Length(Mandatory): Length for slow ema
6.Source for rsi and ema calculation(Mandatory): Source to use for rsi and ema like close , open , high , low , hl2 etc
7.Overbought(Mandatory): To specify upper band of RSI .
8.Oversold(Mandatory): For specifying lower band of RSI .
9.plot ema or rsi (Mandatory) : Due to difference in scales of rsi and ema , strategy can only plot one of both precisely (the strategy logic which is based on both esi and ema is unaffected by this choice)
10.Quantity: We use this to specify the trade quantity (for Nifty min 75)
11.Custom Stop Loss in Points: Movement in chart price against the momentum which will trigger exit in options positions
12.Custom Target in Points: Movement in chart price against the momentum which will trigger exit in options positions
13.Base symbol: This is the base instrument symbol like NIFTY or BANK NIFTY .
14.Strike distance from ATM: Our default strike selection is considered as first ATM option (with nearest distance, only 100s are considered ). This strike
distance allows to calculate ATM options which are at fixed distance.
15.Expiry: Expiry of option. Weekly and monthly both expiry are allowed.
16.Instrument: For index instrument will be OPTIDX, for stock instrument will be OPTSTK
17.Strategy Tag: The Strategy of Nifty options configured in Api bridge.

Backtests Are BrokenThis script demonstrates a fatal flaw with Trading View backtests involving trailing stops. Trading View assumes the most optimistic case for trailing stops, always giving you the best case high/low of a bar instead of the worst or average case. Within a bar, the price could reverse against your position after the open and trigger your trailing stop for a loss before the price goes in your favor, but Trading View backtests do not consider this and instead always give you the best case returns. This allows a trivial strategy to appear as though it would perform miracles.
This strategy enters on a random bar and sets a trailing stop triggered one tick better than the current price with 0 trailing distance. Trading View then generously gives this strategy the difference between the open price and best possible wick as a profit. The only way this strategy can lose money in simulation is if the price goes straight down after entry and never retraces. It works on all symbols on all timeframes due to this systematic problem with the Trading View backtester.

Range Strat - MACD/RSIThis strategy uses a trend based indicator (MACD) for entry/exit signals with a momentum oscillator (RSI) to act as confirmation. Although relying on a trend based indicator this has been created for range bound crypto markets, which have been in a period of chop since June 2022.
Long/Short signals are generated from MACD with the RSI oscillator thresholds suppressing entries at price extremes. This is not a mean reversion RSI strategy! As the indicators are contrary to each other you will need to be generous with the RSI settings in order for signals to trigger.
Strategy is designed for use on the 4h timeframe, it may work well on higher timeframes, but lower time frames will lead to false signals. Use fixed percentage of equity for order size to capture the compounding effect. As a reversal strategy bear in mind that should market trend strongly in either direction stops will be required.
The RSI thresholds can be tailored to provide higher frequency or safer signals. Similarly tweaking MACD settings will provide earlier/more frequent or safer signals. As this is intended to enter near range high / low you should check the visual cues to ensure a ping-pong effect is observed, so that peaks and troughs are captured. Once an observable range is established the strategy works well across a range of crypto markets,
The script is open source, so feel free to amend as you wish. Using a different momentum oscillator may provide better results. I have prior coding experience, but first time using PineScript was last night, so it's not very tidy. I will update this with some additional customisation and TP/SL in the near future.
Usage: Range bound markets
Markets: Cryptocurrency Alts/BTC/ETH
Timeframe: 4h

[MT Trader] Backtest template w/ Supertrend Strategy---EN: In this strategy template you will find some functions already pre-programmed to be used in your strategies to speed up the programming process, among them we can highlight the default stop loss and take profit functions, which will help to set easily and quickly, defining the price range in which we want to prevent large losses or protect our profits from unexpected market movements.
🔴 Stop Loss: Among the functions of the stop loss are the 4 most known, first we have the fixed percentage range (%) and price ($), when the price reaches this fixed price will limit the losses of the operation avoiding larger losses, then we have the average true range (ATR), a moving average of true range and X period that can give us good reference points to place our stop loss, finally the last point higher or lower is the most used by traders to place their stop loss.
In addition, the price range between the entry and stop loss can be converted into a trailing stop loss.
🟢 Take Profit: We have 3 options for take profit, just like stop loss, the fixed range of percentage(%) and price($), are available, in addition to this we have the 1:# ratio option, which multiplies by X number the range between the entry and stop loss to use it as take profit, perfect for strategies that use ATR or last high/low point for their strategy.
📈 Heikin Ashi Entrys: The heikin ashi entries are trades that are calculated based on heikin ashi candles but their price is executed in Japanese candles, thus avoiding the false results that occur in heikin candlestick charts, making that in certain cases better results are obtained in the strategies that are executed with this option compared to Japanese candlesticks.
📊 Dashboard: A more visual and organized way to see the results and data needed for our strategy.
Feel free to use this template to program your own strategies, if you find bugs or want to request a new feature let me know in the comments or through my telegram @hvert_mt
__________________________________________________________________________________________________________________________________________________
---ES: En esta plantilla de estrategia podrás encontrar algunas funciones ya pre-programadas para ser usadas en tus estrategias para acelerar procesos de programación, entre ellas podemos destacar las funciones por defecto de stop loss y take profit, que ayudaran a establecer de manera fácil y rápida, definiendo los rango de precio en los que queremos prevenirnos de perdidas grandes o proteger nuestras ganancias de movimientos inesperados del mercado.
🔴 Stop Loss: Entre las funciones del stop loss están las 4 más conocidas, en primer lugar tenemos el rango de porcentaje fijo(%) y el precio($), cuando el precio alcance este precio fijo se limitaran las perdidas de la operación evitando perdidas mas grandes, después tenemos el promedio de rango verdadero(ATR), una media móvil del rango verdadero y X periodo que nos puede dar buenos puntos de referencia para colocar nuestro stop loss, por ultimo el ultimo punto mas alto o mas bajo es de los mas usados por los traders para colocar su stop loss.
Adicional a esto, el rango de precio entre la entrada y el stop loss se puede convertir en un trailing stop loss.
🟢 Take Profit: Tenemos 3 opciones para take profit, al igual que en el stop loss, el rango fijo de porcentaje(%) y precio($) se encuentran disponibles, adicional a esto tenemos la opción de ratio 1:#, que multiplica por X numero el rango entre la entrada y el stop loss para usarlo como take profit, perfecto para estrategias que usen ATR o ultimo punto alto/bajo.
📈 Entradas Heikin Ashi: Las entradas Heikin Ashi son trades que son calculados en base a las velas Aeikin Ashi pero su precio esta ejecutado a velas japonesas, evitando así los falsos resultados que se producen en graficas de velas Heikin, esto haciendo que en ciertos casos se obtengan mejores resultados en las estrategias que son ejecutadas con esta opción en comparación con las velas japonesas.
📊 Panel de Control: Una manera mas visual y organizada de ver los resultados y datos necesarios de nuestra estrategia.
Siéntete libre de usar esta plantilla para programar tus propias estrategias, si encuentras errores o quieres solicitar una nueva función házmelo saber en los comentarios o a través de mi Telegram: @hvert_mt

Directional Movement IndexADX is an oscillating indicator, displayed as a single line, ranging from 0 to 100, it only indicates the strength of the trend and does not indicate its direction. In other words, the ADX is non-directional, meaning that it measures the strength of a trend, but doesn’t distinguish between uptrend and downtrends. So, during a strong uptrend, the ADX rises and during a strong downtrend, the ADX also rises.
Here is how you correctly read what ADX is saying about the market. Here are 5 aspects regarding the interpretation of the ADX:
1- When ADX is above 25, trend strength is strong. Usually, once the ADX gets above 25 this signals the beginning of a trend. Big moves (upwards or downwards) tend to happen when ADX is right around this number. You can experiment with this number, some traders that want faster signals, tend to use a 20 threshold when trading with the ADX.
2- When ADX is below 25, traders must avoid trend trading strategies as the market is in accumulation or distribution phase. So, when we see the ADX line below 20 or 25 level, we forget about trend following strategies and we apply strategies suitable for a ranging market.
3- When ADX is above 25 and Positive Directional Movement Indicator (+DMI) is above the Negative Directional Movement Indicator (-DMI). ADX measures the strength of an uptrend. The crossover between the 2 Directional Movement Indicator, as the ADX line is well above 25 can result in an excellent bullish move.
4- The Positive Directional Movement Indicator (+DMI) should be above the Negative Directional Movement and the ADX should be above 25 signals for a strong upward trend for long opportunities. When ADX is above 25 and Positive Directional Movement Indicator is below the Negative Directional Movement Indicator, ADX measures the strength of a downtrend and short opportunities.
5- Values over 50 of the ADX indicate a very strong trend
There are pros and cons of ADX.
So, why is the ADX useful for traders: First, is excellent at quantifying trend strength. Also, it allows traders to see the strength of bulls and bears at the same time. It is good at filtering out trades, during accumulation periods and is good at identifying trending conditions.
But the ADX also has its limitations. The most important disadvantage is the fact that ADX is a lagging indicator that follows the price, so we must be very careful when we apply this indicator, because we might miss the inception of the trend and join it when it’s nearly over.
Also, it offers many false signals when used on shorter time frames, so it’s advisable to trade it on higher time frames Also, the ADX does not contain all of the data necessary a for proper analysis of price action, so it must be used in combination with other tools or indicators.
Now that we fully covered the good and the bad regarding ADX, let’s see how it is used in a trading strategy.
The trading strategy involves a DMI crossover, confirmed by ADX above consolidation threshold. If +DMI crossover, we take long position and if -DMI crosses over, we take a short position.
Candles are re-colored for easy demonstration of uptrend, downtrend and consolidation periods.
Green candles – ADX > Consolidation Threshold and +DMI > -DMI
Red candles – ADX > Consolidation Threshold and +DMI < -DMI
Black candles – ADX < Consolidation Threshold
Repaint – This is a non-repainting strategy - All the signals are generated at candle closing. All the calculations are made on previous candle’s open, high, low, close. No request security function is used. No data is being used from higher time frame. Trade exit uses close function instead of exit to avoid limit orders. Only one long trade at a time (no pyramiding) is allowed.
Strategy Time frame – D (To filter out false signals, higher time frame is recommended)
Strategy For – Swing Traders
Assets – Cryptocurrencies + Stocks

Scalping Support Resistance StrategyScalping strategy for BTC using one line: Support Resistance.
The strategy draws a line based on the minimum value of the average of High, Low, and Close for a given bar. The entries are carried out on the breakdown of this line. Exits are managed by the specified in the script's inputs take-profit and stop-loss percentages.
From Stream:
www.tradingview.com

Price action: Double top/bottom StrategyDouble top and bottom patterns are chart patterns that occur when the underlying investment moves in a similar pattern to the letter "W" (double bottom) or "M" (double top).
In this strategy, I use Pivot High/Low to find Double top and bottom.
Entry long: when Double bottom occur.
Entry short: when Double top occur.
Risk: Reward: You can change % Stop loss and Target pfofit.

Boom Trading: EMA Channel StrategyVersion 1
Add EMA 50 high, low, and 200 close
Filter trend by EMA 200
Crossing by EMA 50 channel with EMA 20 fast

Combo 2/20 EMA & Bill Williams Averages. 3Lines This is combo strategies for get a cumulative signal.
First strategy
This indicator plots 2/20 exponential moving average. For the Mov
Avg X 2/20 Indicator, the EMA bar will be painted when the Alert criteria is met.
Second strategy
This indicator calculates 3 Moving Averages for default values of
13, 8 and 5 days, with displacement 8, 5 and 3 days: Median Price (High+Low/2).
The most popular method of interpreting a moving average is to compare
the relationship between a moving average of the security's price with
the security's price itself (or between several moving averages).
WARNING:
- For purpose educate only
- This script to change bars colors.

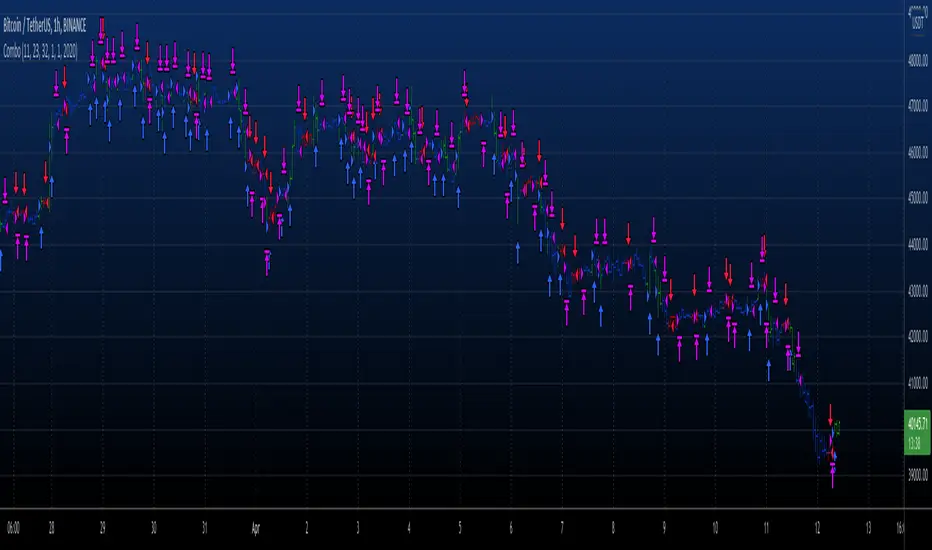
Combo 2/20 EMA & (H-L)/C Histogram This is combo strategies for get a cumulative signal.
First strategy
This indicator plots 2/20 exponential moving average. For the Mov
Avg X 2/20 Indicator, the EMA bar will be painted when the Alert criteria is met.
Second strategy
This histogram displays (high-low)/close
Can be applied to any time frame.
WARNING:
- For purpose educate only
- This script to change bars colors.
TTC2022NVDA15mThis is version 1.0 "TTC2022NVDA15m" Strategy. This has only been back tested for the ticker "NVDA" on the 15m ext hour chart for the year 2022. The reason I isolated this strategy to 2022 is because NVDA's chart patterns have changed from the previous 2 years. So, I wanted to develop an indicator-based strategy that was consistent with current market conditions. I will adjust any variables that make this TTC2022NVDA15m Strategy more accurate in the future as more 2022 data comes out.
It's based on my TTC: Triangular Trend Channel script that dynamically creates a trend channel on the move. It uses open, high, low, close, simple moving average inputs for its plot lines and ema11 for calculation purposes. The default trend channel line settings are based off sma128.
Default color coded in top to bottom price order:
green = top
orange
blue
white = center (128sma)
purple
yellow
red = bottom
Please excuse me if this appears scrunched up. I had to set my browser to 50% size to fit in the YTD 15 minute ext chart.
• Remember * This has only been back tested for the ticker "NVDA" on the 15m ext chart for the year 2022 to date. *

TTC2022TSLA15mThis is version 1.0 "TTC2022TSLA15m" Strategy. This has only been back tested for the ticker "TSLA" on the 15m chart for the year 2022. The reason I isolated this strategy to 2022 is because TSLA's chart patterns have changed from the previous 2 years. So, I wanted to develop an indicator-based strategy that was consistent with current market conditions. The default setting for percent of equity is set to 5% risk. I will adjust any variables that make this TTC2022TSLA15m Strategy more accurate in the future as more 2022 data comes out.
It's based on my TTC: Triangular Trend Channel script that dynamically creates a trend channel on the move. It uses open, high, low, close, simple moving average inputs for its plot lines and sma9 & ema5 for calculation purposes. The default trend channel line settings are based off sma64.
Default color coded in top to bottom price order:
green = top
orange
blue
white = center (64sma)
purple
yellow
red = bottom
• Remember * This has only been back tested for the ticker "TSLA" on the 15m chart for the year 2022 to date. *

TTC2022SPY4hrThis is version 1.0 "TTC2022SPY4hr" Strategy. This has only been back tested for the ticker "SPY" on the 4hr ext chart for the year 2022. The reason I isolated this strategy to 2022 is because SPY's chart patterns have changed from the previous 2 years. So, I wanted to develop an indicator-based strategy that was consistent with current market conditions. The default setting for percent of equity is set to 5% risk. I will adjust any variables that make this TTC2022SPY4hr Strategy more accurate in the future as more 2022 data comes out.
It's based on my TTC: Triangular Trend Channel script that dynamically creates a trend channel on the move. It uses open, high, low, close, simple moving average inputs for its plot lines and ema1 & a hard coded ema5 for calculation purposes. The default trend channel line settings are based off sma7.
Default color coded in top to bottom price order:
green = top
orange
blue
white = center (7sma)
purple
yellow
red = bottom
• Remember * This has only been back tested for the ticker "SPY" on the 4hr ext chart for the year 2022 to date. *

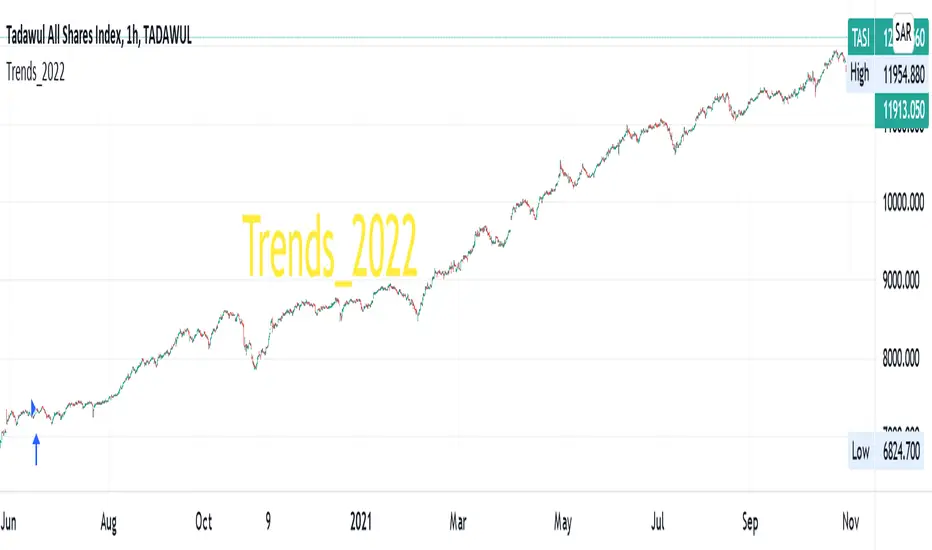
Trends_2022Hello everyone,
we are developing a strategy which is suited for people that likes to trade in small time frames.
Our strategy uses many indications for entries. These indicators can be used individually or better solution we combined them together for best prediction.
These indications like True Range, Average True Range , moving averages also previous bars highs, lows and closes values and finally mathematical equations to decide close price wave movement. Most of the work is in scaling price data and comparing them with the indicators to decide trend
The strategy is planned to go only long direction..
now we will discuss how each indicator is used to decide trend
* According to ATR trend prediction ...
it is up when the scaled bar price greater than ATR value
it turns down when the scaled bar price is less than ATR value
* According to MAs trend prediction ...
we use SMA and previous bar data averages then apply linReg ( Linear regression curve) this result in curve up and down zero
it is up when the value is up zero
it turns down when the value is down zero
* According to close price wave movement ...
we applied cos function on previous bars close data to get the sloping wave of close movement
If the slope is increasing ... this means the current wave value is greater than the previous value
If the slope is decreasing ... this means the current wave value is less than the previous value
Now as we mentioned before... The strategy goes only long direction.
LONG ENTRY Conditions (ANDing condition not ORing):
we can use any one of these indicators individually, or mix any two of them or use them all simultaneously
So... LONG ENTRY Conditions are as below:
if ATR trend is used .. it should be UP.
if MAs trend used .. it should be > 0.
if close wave slope is used .. it should be increasing.
On the other side… the Exit conditions are also (ANDing condition not ORing):
So... LONG Exit Conditions are as below:
if ATR trend is used .. it should be down.
if MAs trend used .. it should be < 0.
if close wave slope is used .. it should be decreasing.
Please send me private message for script authorization.
Happy trading everyone!
RSI + MA StrategyHello, everyone!
We have just released an innovative strategy for TradingView. It allows you to facilitate the trading process when you have to use both indicators.
This strategy is:
User-friendly
Configurable
Equipped with the combination of Relative Strength Index (RSI) and Moving Average (MA) indicators
Designed with all required functions to manage positions
Features
The RSI+MA strategy can:
Identify entry points for Long and Short positions.
Depict RSI and MA values concerning each other.
Reduce visual congestion and import usability thanks to using a combo of 2 indicators.
Allow using pivot trading. The RSI+MA strategy will enter a Long position according to the Short position conditions. And vice versa.
Note! If you want to open a Long position, the RSI line should cross MA from top to bottom. If you want to open a Short position, RSI has to cross MA from bottom to top.
Parameters
We have equipped our strategy with more than 14 additional parameters. So, you can configure the EA according to your needs!
Inputs :
Use Reverse Trade — allows swapping Long and Short positions opening conditions.
Resolution — allows you to view an indicator with data on a higher or lower timeframe on the current chart.
RSI Length
RSI Source: Open, High, Low, Close, HL2, HLC3, OHLC4
Show MA — allows you to enable or disable MA displaying.
MA Length
MA Offset
Style:
RSI — RSI indicator line color and style settings.
MA — MA indicator line color and style configuration.
Upper Band — allows customizing line style, color, and RSI upper bound value.
Lower Band — allows you to customize line style, color, and RSI lower bound value.
Background — background color setting within the RSI upper and lower borders.
Precision — number of decimals for RSI values.
Note! Try RSI+MA on your demo account first before going live.

Bollinger Bands Fibonacci Ratios StrategyHello, everyone!
We have just released an innovative strategy for TradingView. It allows you to identify price pivot points and volatility.
This strategy is:
User-friendly
Configurable
Equipped with Bollinger Bands and smoothed ATR to measure volatility
Features
Thanks to the BB Fibo strategy, you can:
Trade stocks and commodities.
Identify price pivot points.
Choose any band for trading Long or Short positions.
Swap upper and lower bands applying Use Reverse Buy/Sell parameters.
Note! The upper bands are for the Long position. The lower bands are for the Short positions.
Parameters
We have equipped our strategy with more than 14 additional parameters. So, you can configure the EA according to your needs!
Inputs:
Length
Source: Open, High, Low, Close, HL2, HLC3, OHLC4
Offset
Fibonacci Ratio 1 — a Fibonacci factor for the 1st upper and lower indicator lines calculating.
Fibonacci Ratio 2 — a Fibonacci factor for the 2nd upper and lower indicator lines calculating.
Fibonacci Ratio 3 — a Fibonacci factor for the 3d upper and lower indicator lines calculating.
Use Reverse Buy — the strategy will use lower Bollinger bands instead of upper ones.
Fibonacci Buy — band selection for opening Long positions conditions.
Use Reverse Sell — the strategy will use upper Bollinger bands instead of lower ones.
Fibonacci Sell — band selection for opening Short positions conditions.
Style:
Basis — baseline color and style settings.
Upper 3 — the 3d upper line color and style.
Upper 2 — the 2nd upper line color and style.
Upper 1 — the 1st upper line color and style.
Lower 1 — the 1st lower line color and style.
Lower 2 — the 2nd lower line color and style.
Lower 3 — the 3d upper line color and style.
Background — the background color within the 3d upper and 3d lower indicator band.
Precision — the number of decimals for BB Fibo values.
Note! Try BB Fibo on your demo account first before going live.

US 10 Yr Yield Fair ValueI calculate a fair value of the US 10 year yield applying a rolling regression (default 15 periods) with 2 different ratios.
Entry of long and short are based on differ and exit are based if yield high/low price is below/above the fair value -/+ 1 std dev.
Exit when long is based on if short is indicated or yield is inside the boundary of the FV value (+/-5% of FV for example)
Exit when short is when long is indicated.

Moving Stop-Loss mechanism + alerts to MT4/MT5"How to code moving stop-loss mechanism", is one of the most often repeating questions in private messages I receive, so just to focus on this mechanism, I made a spin-off from my previous script: TradingView-Alerts-to-MT4-MT5-dynamic-variables-NON-REPAINTING .
The logic here moves the stop-loss each time a trade is running and a new pivot high/low is detected. When such event occurs (UpdateLongStopLoss or UpdateShortStopLoss), stoploss_long or stoploss_short mutable variable is modified. And it needs to be coded inside strategy.exit() line as "stop=stoploss_long" or "stop=stoploss_short". Entries are pretty straightforward - on Stoch crosses.
Last lines of the script show how to wrap information about such updates and send send alerts to MetaTrader via TradingConnector for execution in Forex/indices/commodities/crypto markets via MetaTrader. Please note that "tradeid=" variable must be passed with each alert, to let MetaTrader know which trade to modify. SLMOD, TPMOD are recently added commands, along with BE (as in "move stop-loss to breakeven" - but that's another topic).
Please disregard strategy backtest results, as this script is for coding education purposes only. However, it seems with the stop-loss mechanism enabled, the results are even better, than in original version of the script :)
