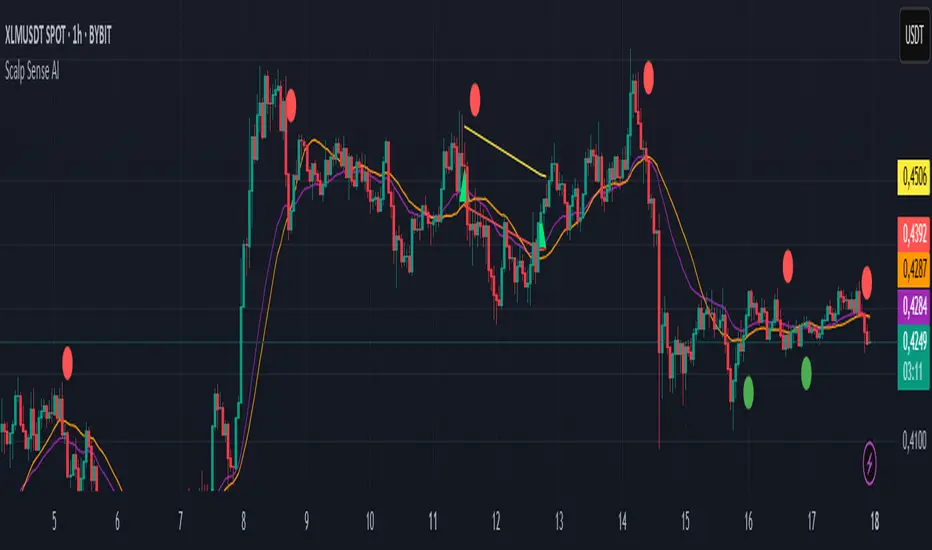
Scalp Sense AI# Scalp Sense AI (No Repaint)
**Adaptive trend & reversal detector with an AI-driven score, multi-timeframe confirmations, robust volume filters, and a purpose-built Scalping Mode.**
Signals are generated **only on bar close** (no repaint), include structured alert payloads for webhooks, and come with optional ATR-based TP/SL visualization for study and validation.
---
## What it is (in one paragraph)
**Scalp Sense AI** combines classic market structure (DI/ADX, EMA, SMA, Keltner, ATR) with a continuous **AI Score** that fuses RSI normalization, EMA distance (in ATR units), and DI edge into a single, volatility-aware signal. It adaptively gates **trend** and **reversal** entries, applies **HTF confirmation** without lookahead, and enforces **guard rails** (e.g., strong-trend reversal blocking) unless a high-confidence AI override and volume confirmation are present. **Scalping Mode** compresses reaction times and adds micro price-action cues (wick rejections, micro-EMA crosses, small engulfing) to surface more—but disciplined—opportunities.
---
## Non-Repainting Design
* All signals, markers, state, and alerts are computed **after bar close** using `barstate.isconfirmed`.
* HTF data are requested with `lookahead_off`.
* No “future-peeking” constructs are used.
* Result: signals do **not** change after the candle closes.
---
## How the engine works (pipeline overview)
1. **Base metrics**
* **RSI**, **EMA**, **ATR** (+ ATR SMA for regime/volatility), **SMA long & short**, **Keltner** (EMA ± ATR×mult).
* **Manual DI/ADX** for fine control (DM+, DM−, true range smoothing).
2. **Volatility regime**
* Compares ATR to its SMA and scales thresholds by √(ATR/ATR\_SMA) → robust “high\_vol” gating.
3. **Volume & flow**
* **Volume Z-score**, **OBV slope**, and **MFI** (all computed manually) to confirm impulses and filter weak reversals.
4. **Higher-Timeframe confirmation (optional)**
* Imports HTF **PDI/MDI/ADX** and **SMA** (no lookahead) to require alignment when enabled.
5. **AI Score**
* Weighted fusion of **RSI (normalized around 0)**, **EMA distance (in ATR)**, and **DI edge**.
* Smoothed; then its **mean (μ)** and **volatility (σ)** are estimated to form **adaptive bands** (hi/lo), with optional **hysteresis**.
* **Debounce** (M in N bars) avoids flicker; **bias state** persists until truly invalidated.
6. **Signal logic**
* **Trend entries** require AI bias + trend confirmations (DI/ADX/SMA, HTF if enabled), volatility OK, and **anti-breakout** filter.
* **Reversal entries** come in **core**, **early**, and **scalp** flavors (progressively more frequent), guarded by strong-trend blocks that an **AI+volume+ADX-cooling override** can bypass.
7. **Scalping Mode**
* Adaptive parameter contraction (shorter lengths), gentler guards, micro-patterns (wick/engulf/micro-EMA cross), and reduced cooldown to increase high-quality opportunities.
8. **Cooldown & state**
* One signal per side after a configurable spacing in bars; internal “last direction” avoids clustering.
9. **Visualization & alerts**
* **Triangles** for trend, **circles** for reversals (offset by ATR to avoid overlap).
* **Single-line alert payload** (BUY/SELL, reason, AI, volZ, ADX) ready for webhooks.
---
## Signals & visualization
* **Trend Long/Short** → triangle markers (above/below) when:
* AI bias aligns with trend confirmations (DI edge, ADX above threshold, price vs long SMA, optional HTF alignment).
* Volatility regime agrees; **anti-breakout** prevents entries exactly at lookback highs/lows.
* **Reversal Long/Short** → circular markers when:
* **Core**: AI near “loose” band, OBV/MFI/volZ supportive, ADX cooling, DI spread relaxed, PA confirms (crosses/div).
* **Early**: anticipatory patterns (Keltner exhaustion, simple RSI “quasi-divergence”).
* **Scalp**: micro-EMA cross, wick rejection, mini-engulfing, with relaxed guards but AI/volume still in the loop.
* **Markers appear only on the bar that actually emitted the signal** (no repaint); offsets use ATR so shapes don’t overlap.
---
## Alerts (ready for webhooks)
Enable “**Any alert() function call**” and you’ll receive compact, single-line payloads once per bar:
```
action=BUY;reason=reversal-early;ai=0.1375;volZ=0.82;adx=27.5
action=SELL;reason=trend;ai=-0.2210;volZ=0.43;adx=31.9
```
* `action`: BUY / SELL
* `reason`: `trend` | `reversal-core` | `reversal-early` | `reversal-scalp`
* `ai`: current smoothed AI Score at signal bar
* `volZ`: volume Z-score
* `adx`: current ADX
---
## Inputs (exhaustive)
### 1) Core Inputs
* **RSI Length (Base)** (`rsi_length_base`, int)
Base RSI lookback. Shorter = more reactive; longer = smoother.
* **RSI Overbought Threshold** (`rsi_overbought`, int)
Informational for context; RSI is used normalized in the AI fusion.
* **RSI Oversold Threshold** (`rsi_oversold`, int)
Informational; complements visual context.
* **EMA Length (Base)** (`ema_length_base`, int)
Primary adaptive mean; also used for Keltner mid and distance metric.
* **ATR Length (Base)** (`atr_length_base`, int)
Volatility unit for Keltner, SL/TP (debug), and regime detection.
* **ATR SMA Length** (`atr_sma_len`, int)
Smooth baseline for ATR regime; supports “high\_vol” logic.
* **ATR Multiplier Base** (`atr_mult_base`, float)
Scales volatility gating (sqrt-scaled); higher = tighter high-vol requirement.
* **Disable Volatility Filter** (`disable_volatility_check`, bool)
Bypass volatility gating if true.
* **Price Change Period (bars)** (`price_change_period_base`, int)
Simple momentum check (+/−% over N bars) used in trend validation.
* **Base Cooldown Bars Between Signals** (`signal_cooldown_base`, int ≥ 0)
Minimum bars to wait between signals (per side).
* **Trend Confirmation Bars** (`trend_confirm_bars`, int ≥ 1)
Require persistence above/below long SMA for this many bars.
* **Use Higher Timeframe Confirmation** (`use_higher_tf`, bool)
Turn on/off HTF alignment (no repaint).
* **Higher Timeframe for Confirmation** (`higher_tf`, timeframe)
E.g., “60” to confirm M15 with H1; used for HTF PDI/MDI/ADX and SMA.
* **TP as ATR Multiple** (`tp_atr_mult`, float)
For **visual debug** only (drawn after entries); not an order manager.
* **SL as ATR Multiple** (`sl_atr_mult`, float)
For visual debug only.
* **Enable Scalping Mode** (`scalping_mode`, bool)
Compresses lengths/thresholds, unlocks micro-PA modules, reduces cooldown.
* **Show Debug Lines** (`show_debug`, bool)
Plots AI bands, DI/ADX, EMA/SMA, Keltner, vol metrics, and TP/SL (debug).
### 2) AI Score & Thresholds
* **AI Score Smooth Len** (`ai_len`, int)
EMA smoothing over the raw fusion.
* **AI Volatility Window** (`ai_sigma_len`, int)
Window to estimate AI mean (μ) and standard deviation (σ).
* **K High (sigma)** (`ai_k_hi`, float)
Upper band width (σ multiplier) for strong threshold.
* **K Low (sigma)** (`ai_k_lo`, float)
Lower band width (σ multiplier) for loose threshold.
* **Debounce Window (bars)** (`ai_debounce_m`, int ≥ 1)
Rolling window length used by the confirm counter.
* **Min Bars>Thr in Window** (`ai_debounce_n`, int ≥ 1)
Minimum confirmations inside the debounce window to validate a state.
* **Use Hysteresis Thresholds** (`ai_hysteresis`, bool)
Requires crossing back past a looser band to exit bias → fewer whipsaws.
* **Weight DI Edge (0–1)** (`ai_weight_di`, float)
Importance of DI edge within the fusion.
* **Weight EMA Dist (0–1)** (`ai_weight_ema`, float)
Importance of EMA distance (in ATR units).
* **Weight RSI Norm (0–1)** (`ai_weight_rsi`, float)
Importance of normalized RSI.
* **Sensitivity (0–1)** (`sensitivity`, float)
Contracts/expands bands (higher = more sensitive).
### 3) Volume Filters
* **Volume MA Length** (`vol_ma_len`, int)
Baseline for volume Z-score.
* **Volume Z-Score Window** (`vol_z_len`, int)
Std-dev window for Z-score; larger = fewer volume “spikes”.
* **Reversal: Min Volume Z for confirm** (`vol_rev_min_z`, float)
Minimum Z required to validate reversals (adaptively relaxed in scalping).
* **OBV Slope Lookback** (`obv_slope_len`, int)
Rising/falling OBV over this window supports bull/bear confirmations.
* **MFI Length** (`mfi_len`, int)
Money Flow Index lookback (manual calculation).
### 4) Filters (Breakout / ADX / Reversal)
* **Enable Breakout Filter** (`enable_breakout_fil`, bool)
Avoid trend entries at lookback highs/lows.
* **Breakout Lookback Bars** (`breakout_lookback`, int ≥ 1)
Window for the anti-breakout guard.
* **Base ADX Length** (`adx_length_base`, int)
Lookback for DI/ADX smoothing (also adapted in Scalping Mode).
* **Base ADX Threshold** (`adx_threshold_base`, float)
Minimum ADX to validate trend context (scaled in Scalping Mode).
* **Enable Reversal Filter** (`enable_rev_filter`, bool)
Master switch for reversal logic.
* **Max ADX for Reversal** (`rev_adx_max`, float)
Hard cap: above this ADX, reversals are blocked (unless overridden by AI if allowed in Guards).
### 5) Reversal Guard (regime protection & overrides)
* **Strong Trend: ADX add-above Thr** (`guard_adx_add`, float)
Extra ADX above `adx_threshold` to mark “strong” trend.
* **Strong Trend: min DI spread** (`guard_spread_min`, float)
Minimum DI separation to consider a trend “dominant”.
* **Require ADX drop from window max (%)** (`guard_adx_drop_min_pct`, float 0–1)
ADX must drop at least this fraction from its window maximum to consider “cooling”.
* **Regime Window (bars)** (`guard_regime_len`, int ≥ 10)
Window over which ADX max is measured for the “cooling” check.
* **EMA Slope Lookback** (`guard_slope_len`, int ≥ 2)
EMA slope horizon used alongside Keltner for strong-trend identification.
* **Keltner Mult (ATR)** (`guard_kc_mult`, float)
Keltner width for strong trend bands and exhaustion checks.
* **HTF Reversal Block Mode** (`htf_block_mode`, string: `Off` | `On` | `AI-controlled`)
* `Off`: never block by HTF.
* `On`: block reversals whenever HTF is strong.
* `AI-controlled`: block **unless** AI+volume+ADX-cooling override criteria are met.
* **AI-controlled: allow AI override** (`ai_htf_override`, bool)
Enables the override mechanism in `AI-controlled` mode.
* **AI override multiplier (vs band\_hi)** (`ai_override_mult`, float)
Strength needed beyond the high band to count as “strong AI”.
* **AI override: min bars beyond strong thr** (`ai_override_min_bars`, int ≥ 1)
Debounce on the override itself.
### 6) Markers
* **Reversal Circle ATR Offset** (`rev_marker_offset_atr`, float ≥ 0)
Vertical offset for reversal circles; trend triangles use a separate (internal) offset.
### 7) Scalping Mode Tuning
* **Reversal aggressiveness (0–1)** (`scalp_rev_aggr`, float)
Higher = looser guards and stronger AI sensitivity.
* **Wick: body multiple (bull/bear)** (`scalp_wick_body_mult`, float)
Wick must be at least this multiple of body to count as rejection.
* **Wick: ATR multiple (min)** (`scalp_wick_atr_mult`, float)
Minimal wick length in ATR units.
* **Micro EMA factor (vs EMA base)** (`scalp_ema_fast_factor`, float 0.2–0.9)
Fast EMA length = base EMA × factor (rounded/int).
* **Relax breakout filter in scalping** (`scalp_breakout_relax`, bool)
Lets more trend entries through in scalping context.
### 8) ICT-style SMA (bases)
* **ICT SMA Long Length (Base)** (`sma_long_len_base`, int)
Long-term baseline for regime/trend.
* **ICT SMA Short1 Length (Base)** (`sma_short1_len_base`, int)
Short baseline for price-action crosses.
* **ICT SMA Short2 Length (Base)** (`sma_short2_len_base`, int)
Companion short baseline used in PA cross checks.
> **Adaptive “effective” values:** When **Scalping Mode** is ON, the script internally shortens multiple lengths (RSI/EMA/ATR/ADX/μσ windows, SMAs) and gently relaxes guards (ADX drop %, DI spread, volume Z, override thresholds), reduces cooldown/confirm bars, and optionally relaxes the breakout filter—so you get **more frequent but still curated** signals.
---
## Plots & debug (optional)
* DI+/DI−, ADX (curr + HTF), EMA, long SMA, Keltner up/down (when strong), AI Score, AI mean, AI bands (hi/lo; low plots only when hysteresis is on), Volume MA and Z-score, and ATR-based TP/SL guide (after entries).
* These are **study aids**; the indicator does not manage trades.
---
## Recommended use
* **Timeframes**:
* Scalping Mode: M1–M15.
* Standard Mode: M15–H1 (or higher).
* **Markets**: Designed for liquid FX, indices, metals, and large-cap crypto.
* **Chart type**: Standard candles recommended (Heikin-Ashi alters inputs and hence signals).
* **Alerts**: Use “Any alert() function call”. Parse the key/value payloads server-side.
---
## Good to know
* **Why some alerts don’t draw shapes retroactively**: markers are drawn **only on** the bar that emitted the signal (no repaint by design).
* **Why a reversal didn’t fire**: strong-trend guards + HTF block may have been active; check ADX, DI spread, Keltner position, EMA slope, and whether AI override criteria were met.
* **Too many / too few signals**: tune **Scalping Mode**, `signal_cooldown_base`, AI bands (`ai_k_hi/lo`, `sensitivity`), volume Z (`vol_rev_min_z`), and guards (`rev_adx_max`, `guard_*`).
---
## Disclaimer
This is an **indicator**, not a strategy or an execution system. It does not place, modify, or manage orders. Markets carry risk—validate on historical data and demo before any live decisions. No performance claims are made.
---
### Version
**Scalp Sense AI v11.5** — Adaptive AI bands with hysteresis/debounce, HTF no-lookahead confirmations, guarded reversal logic with AI override, full volume suite (Z, OBV slope, MFI), anti-breakout filter, and a dedicated Scalping Mode with micro-PA cues.
Recherche dans les scripts pour "ict"
AI Strat ATR Dinamico + ADX + Trend Adaptivo (No Repaint)Below is a fully self-contained, English-language description of every input, function, and logical block inside the “AI Strat ATR Dinamico + ADX + Trend Adaptivo (No Repaint)” indicator. You can copy and paste this into TradingView’s “Description” field when you publish, without exposing any Pine code.
---
## Indicator Name and Purpose
**Name (Short Title):**
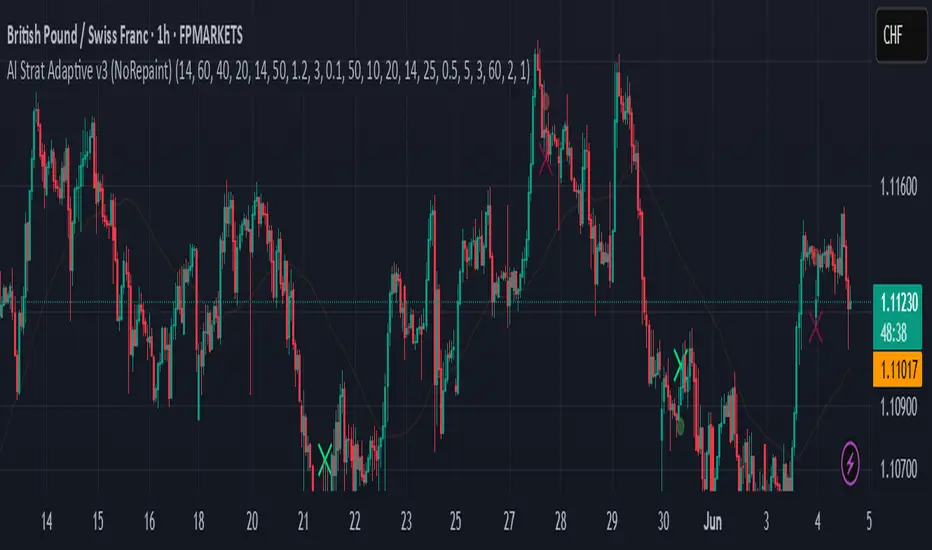
AI Strat Adaptive v3 (NoRepaint)
**Overview:**
This indicator combines multiple technical tools—RSI, EMA, ATR (with a dynamic multiplier), ADX/DI, and an “AI‐style” scoring mechanism—to generate trend-filtered and reversal signals. It also optionally confirms signals on a higher timeframe, dynamically adjusts its sensitivity based on volatility, and plots intrabar stop‐loss (SL) and take‐profit (TP) levels derived from ATR. Special care has been taken to ensure that no signals “repaint” (i.e., once drawn on a closed bar, they never disappear or shift).
---
## 1. Main Inputs
All of the inputs appear in the Settings dialog for the published indicator. Below is a detailed explanation of each input, grouped by logical category.
### A. RSI & EMA Base Parameters
1. **RSI Length (Base)**
* **Input type:** Integer (default 14)
* **Description:** Number of bars used to calculate the Relative Strength Index (RSI). A shorter RSI reacts more quickly to price changes; a longer RSI is smoother.
2. **RSI Overbought Threshold**
* **Input type:** Integer (default 60)
* **Description:** If the RSI value rises above this level, it contributes a “sell” signal component. You can adjust this (e.g., 70) to make your system more conservative.
3. **RSI Oversold Threshold**
* **Input type:** Integer (default 40)
* **Description:** If the RSI falls below this level, it contributes a “buy” signal component. Raising this threshold (e.g., 50) makes the strategy more aggressive in seeking reversals.
4. **EMA Length (Base)**
* **Input type:** Integer (default 20)
* **Description:** Number of bars for the Exponential Moving Average (EMA). A shorter EMA will produce more frequent crossovers, a longer EMA is smoother.
### B. ATR & Volatility Filter Parameters
5. **ATR Length (Base)**
* **Input type:** Integer (default 14)
* **Description:** Number of bars to calculate Average True Range (ATR). The ATR is used both for measuring volatility and for dynamic SL/TP levels.
6. **ATR SMA Length**
* **Input type:** Integer (default 50)
* **Description:** Number of bars to compute a Simple Moving Average of the ATR itself. This gives a baseline of “normal” volatility. If ATR rises significantly above this SMA, the indicator treats the market as “high volatility.”
7. **ATR Multiplier Base**
* **Input type:** Float (default 1.2, step 0.1)
* **Description:** Base multiplier for ATR when filtering for volatility. The actual threshold is computed as `ATR_SMA × (ATR_Multiplier Base) × sqrt(current_ATR / ATR_SMA)`. In other words, the multiplier becomes larger if volatility is rising, and smaller if volatility is falling.
8. **Disable Volatility Filter**
* **Input type:** Boolean (default false)
* **Description:** If enabled (true), the indicator will ignore any volatility‐based filtering, using signals regardless of ATR behavior. If disabled (false), signals only fire when ATR > (ATR\_SMA × dynamic multiplier).
### C. Price-Change & “AI Score” Parameters
9. **Price Change Period (bars)**
* **Input type:** Integer (default 3)
* **Description:** The number of bars back to measure percentage price change. Used to ensure that a “trend” signal is accompanied by a sufficiently positive (for longs) or negative (for shorts) price movement over this many bars.
10. **Base AI Score Threshold**
* **Input type:** Float (default 0.1)
* **Description:** The indicator computes a composite “AI-style” score by combining the RSI signal (overbought/oversold) and an EMA crossover signal. Only if the absolute value of that composite score exceeds this threshold will a trend signal be eligible. Raising it makes signals rarer but (potentially) higher-conviction.
### D. SMA “ICT” Trend Filter Parameters
11. **ICT SMA Long Length (Base)**
* **Input type:** Integer (default 50)
* **Description:** Number of bars for the “long” Simple Moving Average (SMA) used in the internal trend filter. Typically, price must be above this SMA (and ADX must be strong) to confirm an uptrend, or below it (and ADX strong) to confirm a downtrend.
12. **ICT SMA Short1 Length (Base)**
* **Input type:** Integer (default 10)
* **Description:** Secondary “fast” SMA used both for reversal logic (e.g., price crossing above it can count as a bullish reversal) and part of the internal trend confirmation.
13. **ICT SMA Short2 Length (Base)**
* **Input type:** Integer (default 20)
* **Description:** A second “medium” SMA used for reversal triggers (e.g., crossovers or crossunders alongside RSI conditions).
### E. ADX & DI Parameters
14. **Base ADX Length**
* **Input type:** Integer (default 14)
* **Description:** Number of bars for the ADX (Average Directional Index) moving averages, which measure trend strength. The same length is used for +DI and –DI smoothing.
15. **Base ADX Threshold**
* **Input type:** Float (default 25.0, step 0.5)
* **Description:** If ADX > this threshold and +DI > –DI, we consider an uptrend; if ADX > this threshold and –DI > +DI, we consider a downtrend. Raising this value demands stronger trends to qualify.
### F. Sensitivity & Cooldown
16. **Sensitivity (0–1)**
* **Input type:** Float between 0.0 and 1.0 (default 0.5)
* **Description:** A general “mixture” parameter used internally to weight how aggressively the indicator leans into trend versus reversal. In practice, the code uses it to fine-tune exact thresholds for switching between trend and reversal conditions. You can leave it at 0.5 unless you want to bias more heavily toward either regime.
17. **Base Cooldown Bars Between Signals**
* **Input type:** Integer (default 5, min 0)
* **Description:** Once a long or short signal fires, the indicator will wait at least this many bars before allowing a new signal in the same direction. Prevents “signal flipping” on each bar. A higher number forces fewer, more spaced-out entries.
18. **Trend Confirmation Bars**
* **Input type:** Integer (default 3, min 1)
* **Description:** After the directional filters (+DI/–DI cross, price vs. SMA), the indicator still requires that price remains on the same side of the long SMA for at least this many consecutive bars before confirming “trend up” or “trend down.” Larger values smooth out false breakouts but may lag signals.
### G. Higher Timeframe Confirmation
19. **Use Higher Timeframe Confirmation**
* **Input type:** Boolean (default true)
* **Description:** If true, the indicator will request a block of values (SMA, +DI, –DI, ADX) from a higher timeframe (default 60 minutes) and require that the higher timeframe is also in agreement (strong uptrend or strong downtrend) before confirming your current-timeframe trend. This helps filter out lower-timeframe noise.
20. **Higher Timeframe (TF) for Confirmation**
* **Input type:** Timeframe (default “60”)
* **Description:** The chart timeframe (e.g., 5, 15, 60 minutes) whose trend conditions must also be true. It’s sent through a `request.security(..., lookahead=barmerge.lookahead_off)` call so that it never “paints ahead.”
### H. Dynamic TP/SL Parameters
21. **TP as ATR Multiple**
* **Input type:** Float (default 2.0, step 0.1)
* **Description:** When a trade is open, the “take-profit” price is determined by looking at the highest high (for longs) or lowest low (for shorts) observed since entry, and then plotting a cross (“X”) at that level when the trend finally flips. This is purely for display. However, separate from that, this parameter can be adapted if you want a strictly ATR–based TP. In the “Minimal” version, TP is ≈ (highest high) once trend inverts, but you could rewrite it to use `entry_price + ATR×TP_Multiplier`.
22. **SL as ATR Multiple**
* **Input type:** Float (default 1.0, step 0.1)
* **Description:** While in a trade, a trailing SL line is plotted each bar. Its value is always `entry_price ± (ATR × SL_Multiplier)`. When the trend inverts, the SL no longer updates, and you see it on the chart.
### I. Display and Mode Options
23. **Show Debug Lines**
* **Input type:** Boolean (default true)
* **Description:** When enabled, the indicator will plot all intermediate lines—ATR SMA, ATR Threshold, +DI, –DI, ADX (current and HTF), HTF SMA, etc.—so that you can diagnose exactly what’s happening. Turn this off to hide all debug information and only see entry/exit shapes.
24. **Enable Scalping Mode**
* **Input type:** Boolean (default false)
* **Description:** If true, many of the “base” parameters are halved (e.g., RSI length becomes 7 instead of 14, ATR length becomes 7 instead of 14, ADX length becomes 7, etc.), and the ADX threshold is multiplied by 0.8. This makes all oscillators and moving averages more reactive, suited for very short-term (scalping) setups.
---
## 2. Core Calculation Blocks
Below is a high-level description of each logical block (in code order), translated from Pine into conceptual steps.
### A. Adjust Inputs if “Scalping Mode” Is On
If **Scalping Mode** = true, then:
* `RSI_Length` becomes `max(1, round(Base_RSI_Length / 2))`
* `EMA_Length` becomes `max(1, round(Base_EMA_Length / 2))`
* `ATR_Length` becomes `max(1, round(Base_ATR_Length / 2))`
* `Price_Change_Period` becomes `max(1, round(Base_Price_Change_Period / 2))`
* `SMA_Long_Length`, `SMA_Short1_Length`, and `SMA_Short2_Length` are each halved (minimum 1).
* `ADX_Length` = `max(1, round(Base_ADX_Length / 2))`
* `ADX_Threshold` = `Base_ADX_Threshold × 0.8`
* `Cooldown_Bars` = `max(0, round(Base_Cooldown_Bars / 2))`
Otherwise, all adjusted lengths = their base values.
### B. RSI, EMA & “AI Score” on Current Timeframe
1. **Compute RSI:**
* Uses the (possibly adjusted) `RSI_Length`.
* Denote this as `RSI_Value`.
2. **Compute ATR & Its SMA:**
* `ATR_Value` = `ta.atr(ATR_Length)`.
* `ATR_SMA` = `ta.sma(ATR_Value, ATR_SMA_Length)`.
* Then define `Volatility_Increase` = (`ATR_Value > ATR_SMA`).
* If the volatility has increased, the weighting of RSI vs. EMA changes.
3. **Compute Weights:**
* If `Volatility_Increase == true`, then:
* `RSI_Weight = 0.7`
* `EMA_Weight = 0.3`
* Otherwise:
* `RSI_Weight = 0.3`
* `EMA_Weight = 0.7`
4. **RSI Signal Component (`RSI_Sig`):**
* If `RSI_Value > RSI_Overbought`, then `RSI_Sig = –1`.
* Else if `RSI_Value < RSI_Oversold`, then `RSI_Sig = +1`.
* Otherwise, `RSI_Sig = 0`.
5. **EMA Value & Signal Component (`EMA_Sig`):**
* `EMA_Value` = `ta.ema(close, EMA_Length)`.
* `EMA_Sig = +1` if the current close crosses **above** the EMA; `EMA_Sig = –1` if the current close crosses **below** the EMA; else `0`.
6. **Compute Raw “AI Score”:**
$$
Raw\_AI = (RSI\_Sig \times RSI\_Weight)\;+\;(EMA\_Sig \times EMA\_Weight)
$$
Then,
$$
AI\_Score = \frac{Raw\_AI}{(RSI\_Weight + EMA\_Weight)}
$$
(This normalization ensures the score always ranges between –1 and +1 if both weights sum to 1.)
### C. Dynamic ATR Multiplier & Volatility Filter
1. **Volatility Factor:**
$$
Volatility\_Factor = \frac{ATR\_Value}{ATR\_SMA}
$$
2. **Dynamic ATR Multiplier:**
$$
ATR\_Multiplier = ATR\_Multiplier\_Base \times \sqrt{Volatility\_Factor}
$$
3. **High Volatility Condition (`High_Volatility`):**
* If `Disable_Volatility_Filter == true`, then treat `High_Volatility = true` always.
* Else, `High_Volatility = (ATR_Value > ATR_SMA × ATR_Multiplier)`.
### D. Price Change Percentage
* **Compute Price Change:**
$$
Price\_Change = \frac{(Close - Close )}{Close } \times 100
$$
* This is the percent return from `Price_Change_Period` bars ago to now.
* For a valid long‐trend signal, we require `Price_Change > 0`; for a short trend, `Price_Change < 0`.
### E. Local SMAs for Trend/Reversal Filters
* `SMA_Close_Long` = `ta.sma(close, SMA_Long_Length)`.
* `SMA_Close_Short1` = `ta.sma(close, SMA_Short1_Length)`.
* `SMA_Close_Short2` = `ta.sma(close, SMA_Short2_Length)`.
These three SMAs help define the “local trend” and reversal breakout points:
* **Primary Trend Filter:**
* Price must be above `SMA_Close_Long` for an uptrend filter, or below `SMA_Close_Long` for a downtrend filter.
* **Reversal Filter:**
* A bullish reversal is detected if **(RSI < Oversold AND close crosses above EMA)** OR **(RSI < Oversold AND close crosses above SMA\_Close\_Short1)**.
* A bearish reversal is detected if **(RSI > Overbought AND close crosses below EMA)** OR **(RSI > Overbought AND close crosses below SMA\_Close\_Short1)**.
### F. Manual +DI, –DI & ADX on Current Timeframe
Instead of relying on the built-in `ta.adx`, the script calculates DI and ADX manually. This makes it easier to replicate the exact logic on a higher timeframe via `request.security`. The steps are:
1. **Directional Movement (DM) Components:**
* `Up_Move` = `high – high `
* `Down_Move` = `low – low`
* `Plus_DM` = `Up_Move` if (`Up_Move > Down_Move` AND `Up_Move > 0`), else `0`
* `Minus_DM` = `Down_Move` if (`Down_Move > Up_Move` AND `Down_Move > 0`), else `0`
2. **True Range (TR) Components:**
* `TR1` = `high – low`
* `TR2` = `abs(high – close )`
* `TR3` = `abs(low – close )`
* `True_Range` = `max(TR1, TR2, TR3)`
3. **Smoothed Averages (RMA):**
* `Sm_TR` = `ta.rma(True_Range, ADX_Length)`
* `Sm_Plus` = `ta.rma(Plus_DM, ADX_Length)`
* `Sm_Minus`= `ta.rma(Minus_DM, ADX_Length)`
4. **Compute DI%:**
$$
Plus\_DI = \frac{Sm\_Plus}{Sm\_TR} \times 100,\quad
Minus\_DI = \frac{Sm\_Minus}{Sm\_TR} \times 100
$$
5. **DX and ADX:**
$$
DX = \frac{|Plus\_DI - Minus\_DI|}{Plus\_DI + Minus\_DI} \times 100,\quad
ADX = ta.rma(DX, ADX_Length)
$$
These values are referred to as `(plus_di, minus_di, adx_val)` for the current timeframe.
---
## 3. Higher Timeframe (HTF) Confirmation Function
If **Use Higher Timeframe Confirmation** is enabled, the script calls a single helper (Pine) function `f_htf` with two parameters: the ADX length and the SMA length (both taken from the “base” or “scaled” values). Internally, `f_htf` simply reruns the manual DI/ADX logic (same as above) on the higher timeframe’s bar data, and also includes that timeframe’s closing price and its SMA for trend comparison.
* **Request.Security Call:**
```
= request.security(
syminfo.tickerid,
higher_tf,
f_htf(adx_length, sma_long_len),
lookahead=barmerge.lookahead_off
)
```
* `lookahead=barmerge.lookahead_off` ensures that no HTF value “paints” early; you always see only confirmed HTF bars.
* The returned tuple provides:
1. `ht_close` = HTF closing price
2. `ht_sma` = HTF SMA of length `sma_long_len`
3. `ht_pdi` = HTF +DI percentage
4. `ht_mdi` = HTF –DI percentage
5. `ht_adx` = HTF ADX value
---
## 4. Trend & Reversal Filters (Current & HTF)
### A. Current-Timeframe Trend Filter
1. **Uptrend\_Basic (Current TF)**
$$
(plus\_di > minus\_di)\;\land\;(adx\_val > ADX\_Threshold)\;\land\;(close > SMA\_Close\_Long)
$$
2. **Downtrend\_Basic (Current TF)**
$$
(minus\_di > plus\_di)\;\land\;(adx\_val > ADX\_Threshold)\;\land\;(close < SMA\_Close\_Long)
$$
3. **Trend Confirmation by Bars:**
* `Bars_Since_Below` = number of bars since `close <= SMA_Close_Long`.
* `Bars_Since_Above` = number of bars since `close >= SMA_Close_Long`.
* If `Uptrend_Basic == true` AND `Bars_Since_Below ≥ Trend_Confirmation_Bars` → mark `Uptrend_Confirm = true`.
* If `Downtrend_Basic == true` AND `Bars_Since_Above ≥ Trend_Confirmation_Bars` → mark `Downtrend_Confirm = true`.
### B. Reversal Filters (Current TF)
1. **Bullish Reversal (`Rev_Bullish`):**
* If `(RSI < RSI_Oversold AND close crosses above EMA_Value)` OR
`(RSI < RSI_Oversold AND close crosses above SMA_Close_Short1)`
→ then `Rev_Bullish = true`.
2. **Bearish Reversal (`Rev_Bearish`):**
* If `(RSI > RSI_Overbought AND close crosses below EMA_Value)` OR
`(RSI > RSI_Overbought AND close crosses below SMA_Close_Short1)`
→ then `Rev_Bearish = true`.
### C. Higher-Timeframe Trend Filter (HTF)
1. **HTF Uptrend (`HT_Uptrend`):**
$$
(ht\_pdi > ht\_mdi)\;\land\;(ht\_adx > ADX\_Threshold)\;\land\;(ht\_close > ht\_sma)
$$
2. **HTF Downtrend (`HT_Downtrend`):**
$$
(ht\_mdi > ht\_pdi)\;\land\;(ht\_adx > ADX\_Threshold)\;\land\;(ht\_close < ht\_sma)
$$
3. **Combine Current & HTF:**
* If **Use\_HTF\_Confirmation == true**, then:
* `Uptrend_Confirm := Uptrend_Confirm AND HT_Uptrend`
* `Downtrend_Confirm := Downtrend_Confirm AND HT_Downtrend`
* Otherwise, just use the current timeframe’s `Uptrend_Confirm` and `Downtrend_Confirm`.
4. **Define `CurrentTrend` (Integer):**
* `CurrentTrend = +1` if `Uptrend_Confirm == true`.
* `CurrentTrend = –1` if `Downtrend_Confirm == true`.
* Otherwise, `CurrentTrend = 0`.
5. **Reset “One Trade Per Trend”:**
* There is a persistent variable `LastTradeTrend`.
* Every time `CurrentTrend` flips (i.e., `CurrentTrend != CurrentTrend `), the code sets `LastTradeTrend := 0`.
* That allows one new entry once the detected trend has changed.
---
## 5. One‐Time “Cooldown” Logic
* **`LastSignalBar`**
* A persistent integer (initially undefined).
* After each confirmed long or short entry, `LastSignalBar` is set to the bar index where that signal fired.
* **`Bars_Since_Signal`**
* If `LastSignalBar` is undefined, treat as a very large number (so that initial signals are always allowed).
* Otherwise, `Bars_Since_Signal = bar_index – LastSignalBar`.
* **Cooldown Check:**
* A new long (or short) can only be generated if `(Bars_Since_Signal > Signal_Cooldown)`.
* This prevents multiple signals in rapid succession.
---
## 6. Entry Conditions (No Repaint)
All of the conditions below are calculated “intrabar,” but the script only actually registers a **signal** on **bar close** (`barstate.isconfirmed`) so that signals never repaint.
### A. Trend‐Based “Raw” Conditions
1. **Trend\_Long\_Raw:**
$$
(AI\_Score > AI\_Score\_Threshold)\;\land\;Uptrend\_Confirm\;\land\;High\_Volatility\;\land\;(Price\_Change > 0)
$$
2. **Trend\_Short\_Raw:**
$$
(AI\_Score < -AI\_Score\_Threshold)\;\land\;Downtrend\_Confirm\;\land\;High\_Volatility\;\land\;(Price\_Change < 0)
$$
### B. Reversal “Raw” Conditions
1. **Rev\_Long\_Raw:**
$$
Rev\_Bullish\;\land\;(CurrentTrend \neq +1)
$$
2. **Rev\_Short\_Raw:**
$$
Rev\_Bearish\;\land\;(CurrentTrend \neq -1)
$$
### C. Combine Raw Signals
* `Raw_Long = Trend_Long_Raw OR Rev_Long_Raw`.
* `Raw_Short = Trend_Short_Raw OR Rev_Short_Raw`.
### D. Confirmed Long/Short Signal Flags
On each new bar **close** (`barstate.isconfirmed == true`):
* **Long\_Signal\_Confirmed** can fire if:
1. `Raw_Long == true`
2. `LastTradeTrend != +1` (we haven’t already taken a long in this same trend)
3. `Bars_Since_Signal > Signal_Cooldown`
If all three hold, then on this bar close the code sets:
* `Long_Signal = true`
* `LastTradeTrend := +1`
* `LastSignalBar := bar_index`
Otherwise, `Long_Signal := false` on this bar.
* **Short\_Signal\_Confirmed** works the same way but with `Raw_Short`, `LastTradeTrend != -1`, etc.
If triggered, it sets `Short_Signal = true`, `LastTradeTrend := -1`, and `LastSignalBar := bar_index`. Otherwise `Short_Signal := false`.
* **Important:** If the bar is still forming (`else` branch of `barstate.isconfirmed`), then both `Long_Signal` and `Short_Signal` are forced to `false`. This guarantees that no shape or alert appears until the bar actually closes.
---
## 7. Plotting Entry/Exit Shapes
1. **Trend Long Signal (Triangle Up)**
* Condition: `Long_Signal == true` **AND** `Trend_Long_Raw == true`.
* Appearance: A small, semi-transparent lime green triangle drawn **below** the bar.
2. **Trend Short Signal (Triangle Down)**
* Condition: `Short_Signal == true` **AND** `Trend_Short_Raw == true`.
* Appearance: A small, semi-transparent maroon triangle drawn **above** the bar.
3. **Reversal Long Signal (Circle)**
* Condition: `Long_Signal == true` **AND** `Rev_Long_Raw == true`.
* Appearance: A tiny, more transparent green circle drawn **below** the bar.
4. **Reversal Short Signal (Circle)**
* Condition: `Short_Signal == true` **AND** `Rev_Short_Raw == true`.
* Appearance: A tiny, more transparent red circle drawn **above** the bar.
Since `Long_Signal` and `Short_Signal` only ever become true at bar close, these shapes are never repainted or removed once drawn.
---
## 8. Unified Alert Message
* As soon as a new bar closes with either `Long_Signal` or `Short_Signal == true`, an alert message is sent:
* If `Long_Signal`, then `alert_msg = "action=BUY"`.
* If `Short_Signal`, then `alert_msg = "action=SELL"`.
* If neither, `alert_msg = ""` (no alert).
* The code calls `alert(alert_msg, freq=alert.freq_once_per_bar)` only if `barstate.isconfirmed` and `alert_msg` is non‐empty. This ensures exactly one alert per confirmed bar, no intrabar pops.
---
## 9. Dynamic TP/SL Logic (Minimal Implementation)
Once a long or short position is “open,” the script tracks these variables:
1. **Persistent Flags and Prices** (all persist between bars until reset):
* `InLong` (Boolean)
* `InShort` (Boolean)
* `Long_Max` (Float)
* `Short_Min` (Float)
* `Entry_Price` (Float)
2. **On Bar Close:**
* If `Long_Signal == true` →
* Set `InLong := true`,
* `Entry_Price := close` of that bar,
* `Long_Max := high ` (last bar’s high, so that we’re not using “future” data).
* If `Short_Signal == true` →
* Set `InShort := true`,
* `Entry_Price := close`,
* `Short_Min := low `.
3. **While `InLong == true`:**
* Continuously update `Long_Max = max(Long_Max, current high)` on each bar (intrabar, but finalized each close).
* Compute a dynamic SL:
$$
SL_{Long} = Entry\_Price - (ATR \times SL\_ATR\_Multiplier).
$$
* If **current trend** flips to non-uptrend (`CurrentTrend != +1`), mark `ExitLong = true`.
* Then the routine plots `TP_Long = Long_Max` as a cross (“X”) at that level.
* Set `InLong := false` so that no further changes to `Long_Max` or `Entry_Price` happen on future bars.
4. **While `InShort == true`:**
* Continuously update `Short_Min = min(Short_Min, current low)`.
* Compute a dynamic SL:
$$
SL_{Short} = Entry\_Price + (ATR \times SL\_ATR\_Multiplier).
$$
* If trend flips to non-downtrend (`CurrentTrend != –1`), mark `ExitShort = true`.
* Then the routine plots `TP_Short = Short_Min`.
* Set `InShort := false` to freeze those values.
5. **Plotting TP/SL if “Show Debug” is On:**
* **TP Shapes:**
* When `ExitLong == true`, plot a solid lime “X” at `TP_Long` (highest high).
* When `ExitShort == true`, plot a solid maroon “X” at `TP_Short` (lowest low).
* **SL Lines:**
* If still `InLong`, draw a thin red line at `SL_Long` on each bar.
* If still `InShort`, draw a thin green line at `SL_Short`.
Thus, your charts visually show the highest‐high take-profit cross for longs, the lowest-low take-profit cross for shorts, and a continuously updating trailing SL until the trend flips. Because all of this is triggered on confirmed bars, nothing “jumps around” after the fact.
---
## 10. Debug‐Only Plot Lines (When Enabled)
When **Show Debug Lines** = true, the indicator will also plot:
1. **ATR SMA (Orange):**
* The simple moving average of ATR over `ATR_SMA_Length`.
2. **ATR Threshold (Yellow):**
* `ATR_SMA × ATR_Multiplier` (the dynamically scaled threshold).
3. **+DI & –DI (Current TF):**
* +DI plotted as a green line, –DI plotted as a red line (opacity \~70%).
4. **ADX (Current TF, Blue):**
* A blue line for the present timeframe’s ADX.
5. **ADX Threshold (Gray):**
* A horizontal gray line showing `ADX_Threshold`.
6. **+DI & –DI (HTF, Darker Colors):**
* If HTF confirmation is on, “HTF +DI” is a greener but more transparent line; “HTF –DI” is a redder but more transparent line.
7. **ADX (HTF, Blue but Transparent):**
* HTF ADX plotted in blue (high transparency).
8. **HTF SMA (Orange, Transparent):**
* The higher timeframe’s SMA (same length as `SMA_Long_Length`), drawn in fainter orange.
9. **Volatility Zone Fill (Yellow Tinted Area):**
* Fills the area between `ATR_SMA` and `ATR_SMA × ATR_Multiplier`.
* Indicates “normal” versus “high‐volatility” regimes.
These debug lines are purely visual aids. Disable them if you want a cleaner chart.
---
## 11. Putting It All Together — Step-By-Step Flow
1. **Read Inputs** (RSI lengths, EMA length, ATR settings, etc.).
2. **Optionally Halve All Lengths** if “Scalping Mode” is checked.
3. **Calculate Current TF Indicators:**
* RSI, ATR, ATR\_SMA, EMA, price change, various SMAs, DI/ADX.
4. **Compute “AI Score”** (weighted sum of RSI and EMA signals).
5. **Compute Dynamic ATR Multiplier** and decide if “High Volatility” is true.
6. **Compute Raw Trend/Reversal Conditions** on the current timeframe (without triggering yet).
7. **Fetch HTF Values** in one `request.security` call (SMAs, DI/ADX).
8. **Combine Current & HTF Trend Filters** to confirm `Uptrend_Confirm` or `Downtrend_Confirm`.
9. **Check Reversal Conditions** (price crossing EMA or SMA short, in overbought/oversold zones).
10. **Enforce “One Trade Per Trend”** (clear `LastTradeTrend` whenever `CurrentTrend` flips).
11. **Enforce Cooldown** (must wait at least `Signal_Cooldown` bars since the prior signal).
12. **On Bar Close:**
* If `Raw_Long` AND not already in a long trend AND cooldown met, then fire `Long_Signal`.
* Else if `Raw_Short` AND not already in a short trend AND cooldown met, then fire `Short_Signal`.
* Otherwise, no new signal on this bar.
13. **Plot Long/Short Entry Shapes** according to whether it was a Trend signal or a Reversal signal.
14. **Send Alert** (“action=BUY” or “action=SELL”) exactly once per confirmed bar.
15. **If New Long/Short Signal, Set `InLong`/`InShort`, Record Entry Price, Initialize `Long_Max`/`Short_Min`.**
16. **While `InLong` is true:** Update `Long_Max = max(previous Long_Max, current high)`. Compute `SL_Long`. If the current trend flips (no longer uptrend), set `ExitLong = true`, plot a “TP X,” and close the position logic.
17. **While `InShort` is true:** Similarly update `Short_Min`, compute `SL_Short`, and if trend flips, set `ExitShort = true`, plot a “TP X,” and close the position logic.
18. **Optionally Display Debug Lines** (ATR SMA, ATR threshold, DI/ADX, HTF DI/ADX, etc.).
---
## 12. How to Use in TradingView Community
When you publish this indicator to the TradingView community—choosing “Protected” or “Invite-only” visibility—you can paste the above description into the “Description” field. Users will see exactly what each input does, how signals are generated, and what the various plotted lines represent, **without ever seeing the script source**. In this way, the code itself remains hidden but the logic is fully documented.
1. **Go to “Create New Indicator”** on TradingView.
2. **Paste Your Pine Code** (the full indicator script) in the Pine editor and save it.
3. **Set Visibility = Protected** (or Invite-only).
4. **In the “Description” Text Box, paste the entirety of this document** (steps 1–11).
5. **Click “Publish Script.”**
Users who view your indicator will see its name (“AI Strat Adaptive v3 (NoRepaint)”), a list of all inputs (with default values), and the detailed English description above. They can then load it on any chart, adjust inputs, and see the plotted signals, TP/SL lines, and optional debug overlays—without accessing the underlying Pine code.
---
### Summary of Key Points
* **RSI, EMA, ATR, DI/ADX, and “AI Score”** work together to define “trend vs. reversal.”
* **Dynamic volatility filter** uses ATR and ATR\_SMA to adapt the weighting of RSI vs. EMA and decide whether “volatility is high enough” to permit a trend trade.
* **One trade per detected trend** and a **cooldown period** prevent over‐trading.
* **Higher timeframe confirmation** (optional) further filters out noise.
* **No-repaint logic**:
* All signals only appear at bar close (`barstate.isconfirmed`).
* HTF values are fetched with `lookahead=barmerge.lookahead_off`.
* **Entry shapes** (triangles and circles) clearly mark trend vs. reversal entries.
* **Dynamic TP/SL**: highest‐high (or lowest‐low) since entry is used as TP, ATR×multiplier as SL.
* **Debug mode** (optional) shows every intermediate line for full transparency.
Use this description verbatim (or adapt it slightly for your personal style) when publishing. That way, your community sees exactly how each component works—inputs, functions, filters—while the Pine source code remains private.
CandelaCharts - Turtle Soup Model📝 Overview
The ICT Turtle Soup Model indicator is a precision-engineered tool designed to identify high-probability reversal setups based on ICT’s renowned Turtle Soup strategy.
The Turtle Soup Model is a classic reversal setup that exploits false breakouts beyond previous swing highs or lows. It targets areas where retail traders are trapped into breakout trades, only for the price to reverse sharply in the opposite direction.
Price briefly breaks a previous high (for short setups) or low (for long setups), triggering stop orders and pulling in breakout traders. Once that liquidity is taken, smart money reverses price back inside the range, creating a high-probability fade setup.
📦 Features
Liquidity Levels: Projects forward-looking liquidity levels after a Turtle Soup model is formed, highlighting potential price targets. These projected zones act as magnet levels—areas where price is likely to reach based on the liquidity draw narrative. This allows traders to manage exits and partials with more precision.
Market Structure Shift (MSS): Confirms reversal strength by detecting a bullish or bearish MSS after a sweep. Acts as a secondary confirmation to filter out weak setups.
Custom TF Pairing: Choose your own combination of entry timeframe and context timeframe. For example, trade 5m setups inside a 1h HTF bias — perfect for aligning microstructure with macro intent.
HTF & LTF PD Arrays: Displays HTF PD Arrays (e.g., Fair Value Gaps, Inversion Fair Value Gaps) to serve as confluence zones.
History: Review and backtest past Turtle Soup setups directly on the chart. Toggle historical models on/off to study model behavior across different market conditions.
Killzone Filter: Limit signals to specific trading sessions or time blocks (e.g., New York AM, London, Asia, etc). Avoid signals in low-liquidity or choppy environments.
Standard Deviation: Calculates and projects four levels of standard deviation from the point of model confirmation. These zones help identify overextended moves, mean-reversion opportunities, and confluence with liquidity or PD arrays.
Dashboard: The dashboard displays the active model type, remaining time of the HTF candle, current bias, asset name, and date—providing real-time context and signal clarity at a glance.
⚙️ Settings
Core
Status: Filter models based on status
Bias: Controls what model type will be displayed, bullish or bearish
Fractal: Controls the timeframe pairing that will be used
High Probability Models: Detects and plots only the high-probability models
Sweeps
Sweep: Shows the sweep that forms a model
I-sweep: Controls the visibility of invalidated sweeps
D-purge: Plots the double purge sweeps
S-area: Highlights the sweep area
Liquidity
Liquidity: Displays the liquidity levels that belong to the model
MSS
MSS: Displays the Market Structure Shift for a model
History
History: Controls the number of past models displayed on the chart
Filters
Asia: Filter models based on Asia Killzone hours
London: Filter models based on London Killzone hours
NY AM: Filter models based on NY AM Killzone hours
NY Launch: Filter models based on NY Launch Killzone hours
NY PM: Filter models based on NY PM Killzone hours
Custom: Filter models based on user Custom hours
HTF
Candles: Controls the number of HTF candles that will be visible on the chart
Candles T: Displays the model’s third timeframe candle, which serves as a confirmation of directional bias
NY Open: Display True Day Open line
Offset: Controls the distance of HTF from the current chart
Space: Controls the space between HTF candles
Size: Controls the size of HTF candles
PD Array: Displays ICT PD Arrays
CE Line: Style the equilibrium line of PD Array
Border: Style the border of the PD Array
LTF
H/L Line: Displays on the LTF chart the High and Low of each HTF candle
O/C Line: Displays on the LTF chart the Open and Close of each HTF candle
PD Array: Displays ICT PD Arrays
CE Line: Style the equilibrium line of PD Array
Border: Style the border of the PD Array
Standard Deviation
StDev: Controls standard deviation of available levels
Labels: Controls the size of standard deviation levels
Lines: Controls the line widths and color of standard deviation levels
Dashboard
Panel: Display information about the current model
💡 Framework
The Turtle Soup Model is designed to detect and interpret false breakout patterns by analyzing key price action components, each playing a vital role in identifying liquidity traps and generating actionable reversal signals.
The model incorporates the following timeframe pairing:
15s - 5m - 15m
1m - 5m - 1H
2m - 15m - 2H
3m - 30m - 3H
5m - 60m - 4H
15m - 1H - 8H
30m - 3H - 12H
1H - 4H - 1D
4H - 1D - 1W
1D - 1W - 1M
1W - 1M - 6M
1M - 6M - 12M
Below are the key components that make up the model:
Sweep
D-purge
MSS
Liquidity
Standard Deviation
HTF & LTF PD Arrays
The Turtle Soup Model operates through a defined lifecycle that identifies its current state and determines the validity of a trade opportunity.
The model's lifecycle includes the following statuses:
Formation (grey)
Invalidation (red)
Pre-Invalidation (purple)
Success (green)
By incorporating the phases of Formation, Invalidation, and Success, traders can effectively manage risk, optimize position handling, and capitalize on the high-probability opportunities presented by the Turtle Soup Model.
⚡️ Showcase
Introducing the Turtle Soup Model — a powerful trading tool engineered to detect high-probability false breakout reversals. This indicator helps you pinpoint liquidity sweeps, confirm market structure shifts, and identify precise entry and exit points, enabling more confident, informed, and timely trading decisions.
LTF PD Array
LTF PD Arrays are essential for model formation—a valid Turtle Soup setup will only trigger if a qualifying LTF PD Array is present near the sweep zone.
HTF PD Array
HTF PD Arrays provide macro-level context and are used to validate the direction and strength of the potential reversal.
Timeframe Alignment
In the Turtle Soup trading model, timeframe alignment is an essential structural component. The model relies on multi-timeframe context to identify high-probability reversal setups based on failed breakouts.
High-Probability Model
A high-probability setup forms when key elements align: a Sweep, Market Structure Shift (MSS), LTF and HTF PD Arrays.
Killzone Filters
Filter Turtle Soup Models based on key market sessions: Asia, London, New York AM, New York Launch, and New York PM . This allows you to focus on high-liquidity periods where smart money activity is most likely to occur, improving both the quality and timing of your trade setups.
Unlock your trading edge with the Turtle Soup Model — your go-to tool for sharper insights, smarter decisions, and more confident execution in the markets.
🚨 Alerts
This script offers alert options for all model types. The alerts need to be set up manually from TradingView.
Bearish Model
A bearish model alert is triggered when a model forms, signaling a high sweep, MS,S and LTF PD Array.
Bullish Model
A bullish model alert is triggered when a model forms, signaling a low sweep, MSS and LTF PD Array.
⚠️ Disclaimer
These tools are exclusively available on the TradingView platform.
Our charting tools are intended solely for informational and educational purposes and should not be regarded as financial, investment, or trading advice. They are not designed to predict market movements or offer specific recommendations. Users should be aware that past performance is not indicative of future results and should not rely on these tools for financial decisions. By using these charting tools, the purchaser agrees that the seller and creator hold no responsibility for any decisions made based on information provided by the tools. The purchaser assumes full responsibility and liability for any actions taken and their consequences, including potential financial losses or investment outcomes that may result from the use of these products.
By purchasing, the customer acknowledges and accepts that neither the seller nor the creator is liable for any undesired outcomes stemming from the development, sale, or use of these products. Additionally, the purchaser agrees to indemnify the seller from any liability. If invited through the Friends and Family Program, the purchaser understands that any provided discount code applies only to the initial purchase of Candela's subscription. The purchaser is responsible for canceling or requesting cancellation of their subscription if they choose not to continue at the full retail price. In the event the purchaser no longer wishes to use the products, they must unsubscribe from the membership service, if applicable.
We do not offer reimbursements, refunds, or chargebacks. Once these Terms are accepted at the time of purchase, no reimbursements, refunds, or chargebacks will be issued under any circumstances.
By continuing to use these charting tools, the user confirms their understanding and acceptance of these Terms as outlined in this disclaimer.

CVD Candlestick - Milana TradesThe CVD Candlestick indicator visualizes Cumulative Volume Delta (CVD) in the form of candlesticks, providing a deeper insight into intrabar buying and selling pressure.
Instead of plotting CVD as a simple line, this indicator displays it as a candle chart, allowing traders to analyze the momentum of volume delta just like price action.
How it Works
Delta is calculated as the difference between the bar’s close and open: delta = close - open.
Divergence + ICT-Based Confirmation
This indicator can be used effectively to detect CVD-price divergences, which may signal early signs of weakness in the current trend. When integrated with ICT (Inner Circle Trader) concepts, it becomes a powerful tool for precision-based trading setups.
CVD Divergence Logic:
A bearish divergence occurs when price makes a higher high while CVD makes a lower high — suggesting weakening buyer aggression.
A bullish divergence occurs when price makes a lower low while CVD makes a higher low — signaling potential seller exhaustion.
ICT Confirmation Methods:
After identifying divergence on CVD, traders may look for confirmation using ICT techniques, such as:
1) Liquidity sweeps (e.g. price takes out a prior high/low into a divergence zone)
2) Breaker blocks or order blocks aligning with the divergence area
3) Market structure shifts following divergence
4) Optimal Trade Entry (OTE) levels confluencing with CVD-based signals
Example Setup:
Identify divergence between price and CVD.
Wait for liquidity sweep or market structure break in the same zone.
Confirm entry with lower time frame precision, if needed.
Data Candle
CVD is computed as the cumulative sum of delta over time.
For each bar, a synthetic candlestick is generated based on:
CVD Open = previous CVD value
CVD Close = current CVD value
High/Low = relative range based on Open/Close
Candlestick color indicates whether buyers (green) or sellers (red) dominated the bar.
Note : This implementation uses price-based delta for simplicity and works universally across assets. For bid/ask-based delta, a feed with order book data is required, which is not accessible in Pine Script.
Use Cases
Identify divergences between price and volume delta
Confirm or question breakouts and trend strength
Use in combination with VWAP, volume profile, or liquidity zones
Analyze intrabar sentiment in a candlestick format
Features
CVD represented as full candlesticks
Clear color distinction for delta direction
Works on all symbols and timeframes
Lightweight and responsive
Weekly Open (Current Week Only)📘 Indicator Name: Weekly Open (Current Week Only)
📝 Description:
This indicator plots a horizontal line representing the weekly open price, visible only during the current trading week. At the beginning of each new week (based on TradingView’s weekly time segmentation), the indicator captures the open price of the first candle and draws a constant line across the chart until the week ends. Once the new week begins, the line resets and updates with the new weekly open.
🎯 How to Use – ICT Concepts Integration (Weekly Profile):
This tool is designed to complement ICT (Inner Circle Trader) trading strategies, particularly within the weekly profile framework, by offering a clear and persistent visual of the weekly open, which is a critical reference point in ICT’s market structure theory.
✅ Use Cases:
Directional Bias:
According to ICT concepts, price trading above the weekly open suggests a bullish bias for the week, while trading below it implies bearish conditions.
Traders can use the weekly open line to align their intraweek trades with higher timeframe directional bias.
Dealing Ranges:
Weekly open helps frame the weekly dealing range, especially when combined with other levels like weekly high/low or previous week’s range.
It allows traders to identify potential liquidity pools or areas where price may seek to rebalance.
Mean Reversion Entries:
Price often reverts to or reacts from the weekly open. Traders may use this as a target or entry level, particularly during Monday/Tuesday setups.
Works well in conjunction with concepts like OTE (Optimal Trade Entry) and Judas Swings.
Risk Management:
Acts as a clean and visual anchor to structure stop losses or take-profits based on weekly bias shifts.

Inner Circle Toolkit [TakingProphets]Inner Circle Toolkit — A Complete ICT Trading Companion
The Inner Circle Toolkit is a closed-source, all-in-one trading tool designed for traders following ICT (Inner Circle Trader) and Smart Money Concepts strategies. Every part of this script is built with purpose — not just a mashup of indicators, but a structured framework to help you follow price through the lens of institutional behavior and liquidity theory.
Let’s walk through what it does and how it can help you:
🕒 Session Liquidity Levels (Asia, London, New York, NY Lunch)
The indicator automatically marks the highs and lows of the major trading sessions:
-Asian Session
-London Session
-New York AM Session
-New York Lunch
These levels are important because price often returns to these points to grab liquidity before making a move. This gives traders clear areas to watch for potential sweeps, rejections, or reversals — without having to manually track session timings every day.
REQHs and REQLs — Equal Highs and Lows
This script detects Relatively Equal Highs and Lows (REQHs/REQLs), which are often used by institutions as stop-run targets.
It’s not just looking for copy-paste double tops or bottoms — it uses a tolerance-based algorithm that checks for clusters of similar highs or lows over a given time period. These are likely to hold stops and become magnets for price. When you see these on the chart, you’ll know where the “juice” is sitting.
Fair Value Gaps (FVG) — Multi-Timeframe
The script automatically plots Fair Value Gaps (FVGs) on both:
-Your current chart timeframe
-One or more higher timeframes (like H1 or H4)
These are three-candle gaps that form when price moves aggressively without filling in value. Price often comes back to these areas to rebalance. Seeing both local and higher-timeframe FVGs on your chart gives better context and helps with entries and exits.
The script is optimized so your chart doesn’t get messy — higher timeframe FVGs show up in a cleaner format with visual labels and lighter shading.
SMT Divergence — With Session Logic
This tool includes a real-time SMT divergence detector, based on the behavior of correlated markets like ES vs. NQ.
Here’s how it works:
If ES sweeps a liquidity level (like Asia Low), but NQ doesn’t, the script detects and marks that divergence.
This often signals institutional accumulation or distribution — a high-probability setup.
You won’t have to flip between charts or manually compare — the SMT logic runs automatically and only fires when it matters (at key session levels). It’s a smarter, more focused way to track intermarket divergences.
Daily Highs and Lows — Week-to-Week Structure
The indicator keeps track of the high and low for each day of the week — Monday through Friday — helping you understand how price is evolving across the week.
This helps build a weekly profile:
Did Monday set the high of the week?
Are we sweeping Tuesday’s low on Thursday?
These levels stay visible and labeled, helping you frame daily setups inside the bigger picture.
🕛 Midnight Open & 8:30 AM Open Levels
These two levels are core ICT concepts used to judge whether price is in premium or discount:
Midnight Open (00:00 EST): Used to determine daily bias
New York Open (08:30 EST): Often a launch point for key moves
Both are drawn automatically and extend throughout the day. This helps you align your trades with potential algorithmic bias, especially during NY session volatility.
⏰ 9:45 AM Vertical Marker — Macro Time Reminder
The script draws a subtle vertical line at 9:45 AM EST, which is the start of the NY AM macro session — one of the most likely times to see setups play out.
This is more than just a timer — it’s a visual cue that something important might be setting up soon, especially if you’re already watching SMT, FVGs, or liquidity zones from earlier.
How It All Connects — A Workflow, Not a Mashup
Every feature in this script is connected to the same goal: helping you trade with the Smart Money.
Here’s how the pieces work together:
Session levels → potential stop hunts
Equal highs/lows → targets
FVGs → entry points
SMT divergence → confirmation or warning
Daily highs/lows → Weekly structure frames bias
Open levels → premium vs. discount
Macro line → timing clue for execution
It’s built to help you flow with price action and trade the story, not just random signals.
Why It’s Closed Source — and Original
This script is closed-source because it contains:
A proprietary system for real-time SMT logic (with intermarket sweep detection)
Multi-timeframe FVG detection that auto-filters overlaps
Smart equal-high/low detection using range-based clustering
Optimized UI that shows a lot without overwhelming the chart
There are no moving averages, no public-domain indicators, and no mashup of standard tools. Everything here is purpose-built for traders who follow ICT strategies.
Let us know how we can improve!

Dynamic Customizable 50% Line & Daily High/Low + True Day OpenA Unique Indicator for Precise Market-Level Analysis
This indicator is a fully integrated solution that automates complex market-level calculations and visualizations, offering traders a tool that goes beyond the functionality of existing open-source alternatives. By seamlessly combining several trading concepts into a single script, it delivers efficiency, accuracy, and customization that cater to both novice and professional traders.
Key Features: A Breakdown of What Makes It Unique
1. Adaptive Daily Highs and Lows
Automatically detects and plots daily high and low levels based on the selected time frame, dynamically updating in real time.
Features session-based adjustments, allowing traders to focus on levels that matter for specific trading sessions (e.g., London, New York).
Fully customizable styling, visibility, and alerts tailored to each trader’s preferences.
How It Works:
The indicator calculates daily high and low levels directly from price data, integrating session-specific time offsets to account for global trading hours. These levels provide traders with clear visual markers for key liquidity zones.
2. Automated ICT 50% Range Line
A pioneering implementation of ICT’s mid-range concept, this feature dynamically calculates and displays the midpoint of the daily range.
Offers traders a visual guide to identify premium and discount zones, aiding in determining market bias and potential trade setups.
How It Works:
The script calculates the range between the day’s high and low, dividing it by two to generate the midline. This line updates in real-time, ensuring that traders always see the most current premium and discount levels as price action evolves.
3. Dynamic Market Open Levels
Plots session opens (e.g., Asia, London, New York) and the True Day Open to provide actionable reference points for intra-day trading strategies.
Enhances precision in identifying liquidity shifts and aligning trades with institutional price movements.
How It Works:
The indicator uses predefined session times to calculate and display the opening levels for key trading sessions. It dynamically adjusts for time zones, ensuring accuracy regardless of the trader’s location.
4. Custom Watermark for Enhanced Visualization
Includes an optional watermark feature that allows users to display custom text on their charts.
Ideal for personalization, branding, or highlighting session notes without disrupting the clarity of the chart.
Why This Indicator Stands Out
First-to-Market Automation:
While the ICT 50% range line is a widely recognized concept, this is the first script to automate its calculation, combining it with other pivotal trading levels in a single tool.
All-in-One Functionality:
Unlike open-source alternatives that focus on individual features, this script integrates daily highs/lows, mid-range levels, session opens, and customizable watermarks into one cohesive system. The consolidation reduces the need for multiple indicators and ensures a clean, efficient chart setup.
Dynamic Customization:
Every feature can be adjusted to align with a trader’s strategy, time zone, or aesthetic preferences. This level of adaptability is unmatched in existing tools.
Proprietary Logic:
The indicator’s underlying calculations are built from scratch, leveraging advanced programming techniques to ensure accuracy and reliability. These proprietary methods differentiate it from similar open-source scripts.
How to Use This Indicator
Apply the Indicator:
Add it to your TradingView chart from the library.
Configure Settings:
Use the intuitive settings panel to adjust plotted levels, colors, styles, and visibility. Tailor the indicator to your trading strategy.
Incorporate into Analysis:
Combine the plotted levels with your preferred trading approach to identify liquidity zones, establish market bias, and pinpoint potential reversals or entries.
Stay Focused:
With all key levels automated and updated in real time, traders can focus on execution rather than manual plotting.
Originality and Justification for Closed Source
This script is closed-source due to its unique combination of features and proprietary logic that automates complex trading concepts like the ICT 50% range line and session-specific levels. Open-source alternatives lack this level of integration and customization, making this indicator a valuable and original contribution to the TradingView ecosystem.
What Sets It Apart from Open-Source Scripts?
Unlike open-source tools, this indicator doesn’t just replicate individual features—it enhances and integrates them into a seamless, all-in-one solution that offers traders a more efficient and effective way to analyze the market.

Pure Price Action Structures [LuxAlgo]The Pure Price Action Structures indicator is a pure price action analysis tool designed to automatically identify real-time market structures.
The indicator identifies short-term, intermediate-term, and long-term swing highs and lows, forming the foundation for real-time detection of shifts and breaks in market structure.
Its distinctive/unique feature lies in its reliance solely on price patterns, without being limited by any user-defined input, ensuring a robust and objective analysis of market dynamics.
🔶 USAGE
Market structure is a crucial aspect of understanding price action. The script automatically identifies real-time market structure, enabling traders to comprehend market trends more easily. It assists traders in recognizing both trend changes and continuations.
Market structures are constructed from three sets of swing points, short-term swings, intermediary swings, and long-term swings. Market structures associated with longer-term swing points are indicative of longer-term trends.
A market structure shift (MSS), also known as a change of character (CHoCH), is a significant event in price action analysis that may signal a potential shift in market sentiment or direction. Conversely, a break of structure (BOS) is another significant event in price action analysis that typically indicates a continuation of the prevailing trend.
However, it's important to note that while an MSS can be the first indication of a trend reversal and a BOS signifies a continuation of the prevailing trend, they do not guarantee a complete reversal or continuation of the trend.
In some cases, MSS and BOS levels may also act as liquidity zones or areas of price consolidation, rather than indicating a definitive change in market direction or continuation. Traders should approach them with caution and consider additional factors to confirm the validity of the signal before making trading decisions.
🔶 DETAILS
🔹 Market Structures
Market structures are based on the analysis of price action and aim to identify key levels and patterns in the market, where swing point detection is one of the core concepts within ICT trading methodologies and teachings.
Swing points are automatically detected solely based on market movements, without any reliance on user-defined input.
🔹 Utilizing Swing Points
Swing points are not identified in real time as they occur. While short-term swing points may be displayed with a delay of at most one bar, the identification of intermediate and long-term swing points depends entirely on market movements. Furthermore, detection is not limited by any user-defined input but relies solely on pure price action. Consequently, swing points are not typically utilized in real-time trading scenarios.
Traders often analyze historical swing points to discern market trends and pinpoint potential entry and exit points for their trades. By identifying swing highs and lows, traders can:
Recognize Trends: Swing highs and lows help traders identify the direction of the trend. Higher swing highs and higher swing lows indicate an uptrend, while lower swing highs and lower swing lows indicate a downtrend.
Identify Support and Resistance Levels: Swing highs often serve as resistance levels, known in ICT terminology as Buyside Liquidity Levels, while swing lows function as support levels, also referred to in ICT terminology as Sellside Liquidity Levels. Traders can utilize these levels to strategize entry and exit points for their trades.
Spot Reversal Patterns: Swing points can form various reversal patterns, such as double tops or bottoms, head and shoulders patterns, and triangles. Recognizing these patterns can signal potential trend reversals, allowing traders to adjust their strategies accordingly.
Set Stop Loss and Take Profit Levels: In the context of ICT teachings, swing levels represent specific price levels where a concentration of buy or sell orders is anticipated. Traders can target these liquidity levels/pools to accumulate or distribute their positions, essentially using swing points to establish stop loss and take profit levels for their trades.
Overall, swing points provide valuable information about market dynamics and can assist traders in making more informed trading decisions.
🔶 SETTINGS
🔹 Structures
Swings and Size: Toggles the visibility of the structure's highs and lows, assigns an icon corresponding to the structures, and controls the size of the icons.
Market Structures: Toggles the visibility of the market structures.
Market Structure Labels: Controls the visibility of labels that highlight the type of market structure.
Line Style and Width: Customizes the style and width of the lines representing the market structure.
Swing and Line Colors: Customizes colors for the icons representing highs and lows, and the lines and labels representing the market structure.
🔶 RELATED SCRIPTS
Market-Structures-(Intrabar).
Buyside-Sellside-Liquidity.

Daye's Quarterly TheoryDaye's Quarterly Theory Indicator
Description
The Daye's Quarterly Theory Indicator divides trading time into smaller units to help traders identify potential accumulation, manipulation, distribution, and reversal/continuation phases within a day. It applies these time divisions to your charts, offering visual guidance aligned with ICT's PO3 concept:
Accumulation (A): The phase where positions are accumulated.
Manipulation (M): The phase where the market moves against the prevailing trend to trap traders.
Distribution (D): The phase where accumulated positions are distributed.
Reversal/Continuation (X): The phase indicating either a reversal or continuation of the trend.
This indicator breaks down time into quarters at different levels:
Daily Quarters:
Q1: 18:00 - 00:00 (Asia)
Q2: 00:00 - 06:00 (London)
Q3: 06:00 - 12:00 (NY AM)
Q4: 12:00 - 18:00 (NY PM)
90-Minute Quarters:
Q1: 18:00 - 19:30
Q2: 19:30 - 21:00
Q3: 21:00 - 22:30
Q4: 22:30 - 00:00
Micro Quarters (22.5 minutes) (Displayed on 7-minute TF or lower):
Q1: 18:00 - 18:22:30
Q2: 18:22:30 - 18:45
Q3: 18:45 - 19:07:30
Q4: 19:07:30 - 19:30
Features
Time Box Visualization: Highlights different quarters of the trading day to help visualize market phases.
Customizable Colors: Allows users to set different colors for daily, 90-minute, and micro quarters.
Flexible Settings: Designed to work out-of-the-box on both light and dark background charts.
ICT PO3 Alignment: Helps traders align their strategies with ICT's Accumulation, Manipulation, Distribution, and Reversal/Continuation phases.
Usage
Apply this indicator to your NQ1! or ES1! charts and observe the confluence with ICT's macro times. Use it to predict potential market phases and optimize your trading strategy by buying after manipulation down or selling after manipulation up.
Note: The indicator's display may vary based on the timeframe viewed and broker feeds. Back-test and research for best results on your preferred assets.

London Intraday Protraction (Normal + Delayed) [Pro+]The London Intraday Protraction° is an automatic market profiling tool designed from ICT Time and price parameters projected for London Session studies:
Time:
Central Bank Dealers Range (CBDR)
Asian Range (AR)
London Session
Price:
Central Bank Dealers Range Size (CBDR)
Central Bank Dealers Range (CBDR) Standard Deviations
Asian Range Size (AR)
Protraction (fake move, trap)
This tool allows you to keep your attention dialled into the Session harnessing the concepts listed above through historical data (statistics + previous sessions), and live visuals.
This tool automatically annotates your CBDR and AR reference points, and prints range values in pips as a label above the CBDR and AR; it also projects the CBDR deviations encompassed in London's Time opportunity – up to three standard deviations.
The range values for the Time-based ranges, and price action are filtered into conditional statements as taught in the Core Content from the Inner Circle Trader (ICT).
There are three profile types:
1) Normal Protraction – the high/low of the Day is anticipated in early London Session.
2) Delayed Protraction – due to invalid Price Parameters (Range Sizes) the Protraction is expected in the later stages of the London Session (this protraction may, or may not be, the high/low of the Day).
3) Normal Protraction Negated – due to invalid Time Parameters, the Protraction is expected in the later stages of the London Session (this protraction may, or may not be, the high/low of the Day).
Notice the color coding of the specific scenarios, as it always repeats – it will aid pattern recognition.
The statistical table shows the total number of viewable London Sessions on chart; it provides the total number of filtered Normal Protraction Sessions, and Delayed Protractions Sessions. It also indicates a percentage of how many filtered conditions held true and provided clean price action or narrative.
The true power of this tool lies in its specific window of Time opportunity, and solid conditional logic provided by ICT's teachings; having the London Session analysis automated, allows you to focus on price, and bias, rather than drawing predetermined ICT parameters.
Additional Features:
Customizable Colors
Auto-adapting Colors
Customizable Stat Table Position
Customizable Stat Table Size
These tools are available ONLY on the TradingView platform.
Terms and Conditions
These charting tools are products provided for informational and educational purposes only and do not constitute financial, investment, or trading advice. They are not designed to predict market movements or provide specific recommendations. Users should be aware that past performance is not indicative of future results and should not be relied upon for making financial decisions. By using these tools, the purchaser agrees that the seller and the creator are not responsible for any decisions made based on the information provided by these charting tools. The purchaser assumes full responsibility and liability for any actions taken and the consequences thereof, including any loss of money or investments that may occur as a result of using these products. Hence, by purchasing these charting tools, the customer accepts and acknowledges that the seller and the creator are not liable nor responsible for any unwanted outcome that arises from the development, the sale, or the use of these products. Finally, the purchaser indemnifies the seller from any and all liability.
By continuing to use these financial tools, the user acknowledges and agrees to the terms outlined in this legal disclaimer.
Script payant

HTF Suspension Blocks [TakingProphets]-----------------------------------------------------------------------------------------------
HTF SUSPENSION BLOCKS
-----------------------------------------------------------------------------------------------
HTF Suspension Blocks bring ICT’s Suspension Block concept into a multi-timeframe workflow by detecting the 3-candle pattern on higher timeframes and projecting those zones directly onto your current execution chart.
Instead of only seeing Suspension Blocks on the timeframe they form, this script identifies valid HTF formations, draws their ranges on your lower timeframe, extends them forward, and manages invalidation automatically. You get higher-timeframe context while staying in your execution environment.
-----------------------------------------------------------------------------------------------
PURPOSE AND SCOPE
-----------------------------------------------------------------------------------------------
- Detect ICT-style Suspension Blocks on multiple higher timeframes (HTF 1 / HTF 2 / HTF 3)
- Project HTF blocks onto the current chart using bar-time anchored drawing
- Require measurable body-to-body separation defined in true ticks (instrument-aware)
- Auto-extend blocks forward in time until invalidation
- Optional Consequent Encroachment (50% equilibrium) inside each block
- Per-timeframe visibility limiting so charts stay clean and actionable
- Labels each block with the originating HTF (ex: M5 / M15 / M60)
- Alerts for:
- New HTF bullish / bearish block formation
- Price entering into any HTF bullish / bearish block
- Session-restricted alert windows (New York time)
-----------------------------------------------------------------------------------------------
WHAT IS A SUSPENSION BLOCK
-----------------------------------------------------------------------------------------------
A Suspension Block is a strict 3-candle displacement sequence defined by body-to-body gaps around a middle candle. This HTF variant uses the same model, but evaluates the pattern on a higher timeframe and then projects the zone onto your current chart.
Bullish Suspension Block logic:
- HTF Candle 1 close is BELOW HTF Candle 2 open by at least Minimum Body Separation
- HTF Candle 3 open is ABOVE HTF Candle 2 close by at least Minimum Body Separation
- HTF Candle 3 open is ABOVE HTF Candle 1 close to ensure a valid vertical span
- Block vertical span: Candle 1 close (low) to Candle 3 open (high)
- Block remains valid until price CLOSES below the block low (Candle 1 close)
Bearish Suspension Block logic (mirror conditions):
- HTF Candle 1 close is ABOVE HTF Candle 2 open by at least Minimum Body Separation
- HTF Candle 3 open is BELOW HTF Candle 2 close by at least Minimum Body Separation
- HTF Candle 3 open is BELOW HTF Candle 1 close to ensure a valid vertical span
- Block vertical span: Candle 1 close (high) to Candle 3 open (low)
- Block remains valid until price CLOSES above the block high (Candle 1 close)
All gap calculations are normalized using `syminfo.mintick` so the “ticks” setting behaves correctly across instruments.
-----------------------------------------------------------------------------------------------
GENERAL SETTINGS
-----------------------------------------------------------------------------------------------
- Minimum Body Separation (ticks)
- Minimum required body-to-body gap in HTF tick units
- Used for both:
- Candle 1 close to Candle 2 open separation
- Candle 2 close to Candle 3 open separation
- Examples:
- 0.25 = quarter-tick gap
- 1.0 = full tick gap
-----------------------------------------------------------------------------------------------
TIMEFRAMES
-----------------------------------------------------------------------------------------------
This script supports up to 3 higher timeframe sources. Each HTF has:
- Enable toggle
- Timeframe selector
- Per-timeframe Max Blocks visibility control
HTF 1 / HTF 2 / HTF 3:
- These are the timeframes the script scans for Suspension Blocks
- Blocks are drawn only when your current chart timeframe is LOWER than the selected HTF
- This prevents duplicate / redundant rendering when you’re already on the HTF or higher
Max Blocks per timeframe:
- Limits the number of most-recent blocks shown per side (bullish + bearish) for that HTF
- 0 = show all blocks for that timeframe
-----------------------------------------------------------------------------------------------
VISUALIZATION SETTINGS
-----------------------------------------------------------------------------------------------
Bullish Blocks:
- Toggle visibility
- Fill color controls opacity / emphasis
- Optional border with selectable style (Solid / Dashed / Dotted)
Bearish Blocks:
- Toggle visibility
- Fill color controls opacity / emphasis
- Optional border with selectable style (Solid / Dashed / Dotted)
Consequent Encroachment (CE):
- Optional 50% equilibrium line drawn inside each block
- Style options (Solid / Dashed / Dotted)
- Automatically extends as blocks extend
HTF Labels:
- Each block is labeled with its originating timeframe (ex: M5 / M15 / M60)
- Label styling includes:
- Text color
- Size (Tiny / Small / Normal / Large)
- Labels are intentionally hidden on non-visible blocks when visibility limiting is active
-----------------------------------------------------------------------------------------------
HOW HTF PROJECTION WORKS
-----------------------------------------------------------------------------------------------
- The script requests the last 3 candles of each selected HTF via `request.security()`
- It maps those HTF candles into the standard 3-candle Suspension Block model:
- Candle 1 = oldest
- Candle 2 = middle
- Candle 3 = most recent
- When a valid block forms:
- A box is created using `xloc.bar_time`
- The left side anchors to the HTF candle timestamp
- The right side projects forward to the current chart time
- Each HTF has its own independent storage set:
- Bull boxes, bear boxes
- High / low bounds
- CE lines
- Labels
-----------------------------------------------------------------------------------------------
BLOCK MANAGEMENT & INVALIDATION
-----------------------------------------------------------------------------------------------
- All blocks extend forward automatically to the current bar time
- Bullish invalidation:
- Block is removed when price CLOSES below the block low
- Bearish invalidation:
- Block is removed when price CLOSES above the block high
- When a block invalidates:
- The box is deleted
- Its CE line is deleted
- All stored references are removed from the set
This keeps the chart focused on active HTF zones only.
-----------------------------------------------------------------------------------------------
VISIBILITY LIMITING
-----------------------------------------------------------------------------------------------
Each timeframe’s “Max Blocks” setting controls how many blocks per side remain visible.
When Max Blocks > 0:
- The script calculates distance from current price to every stored block range
- It keeps the closest N blocks per side (bullish + bearish)
- Blocks not kept are made fully transparent:
- Hidden fill
- Hidden border
- Hidden CE line
- Hidden label text
This gives you the most relevant HTF structures near price without clutter.
-----------------------------------------------------------------------------------------------
ALERT SYSTEM
-----------------------------------------------------------------------------------------------
Alerts are optional and can be restricted to specific NY sessions.
Sessions (New York time):
- Session 1 (default: 09:30–16:00)
- Session 2 (optional)
- Session 3 (optional)
Alert types:
- HTF Bullish Block Formed
- Triggers when any enabled HTF forms a new bullish suspension block
- HTF Bearish Block Formed
- Triggers when any enabled HTF forms a new bearish suspension block
- Enter Bullish Block
- Triggers when price transitions from NOT inside any bullish HTF block to inside one
- Enter Bearish Block
- Triggers when price transitions from NOT inside any bearish HTF block to inside one
Messages:
- Fully customizable alert text inputs
- Script automatically appends ticker + current chart timeframe for context
-----------------------------------------------------------------------------------------------
BEST USE CASES
-----------------------------------------------------------------------------------------------
- Use HTF Suspension Blocks as “context zones” while executing on a lower timeframe
- Pair with ICT displacement, liquidity, PD arrays, and market structure for confluence
- Treat blocks as HTF inefficiency zones that can act as reaction points on retracements
- Use “enter block” alerts as a heads-up to shift into execution mode at HTF levels
-----------------------------------------------------------------------------------------------
DISCLAIMER
-----------------------------------------------------------------------------------------------
This indicator is provided for educational and analytical purposes only. It does not constitute financial advice. Trading involves risk, and past performance is not indicative of future results.
© TakingProphets
-----------------------------------------------------------------------------------------------
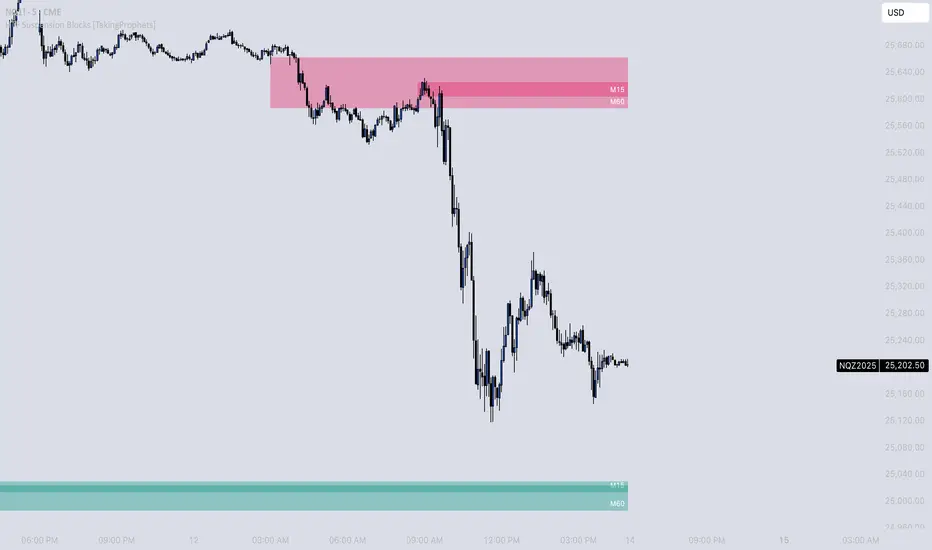
Suspension Blocks [TakingProphets]-----------------------------------------------------------------------------------------------
SUSPENSION BLOCKS
-----------------------------------------------------------------------------------------------
Suspension Blocks are a new ICT concept designed to highlight price inefficiencies created by displacement and body-to-body gaps across a precise 3-candle sequence. These structures represent areas where price was temporarily “suspended” before continuation, often acting as high-probability reaction zones on future revisits.
This indicator automatically detects, visualizes, manages, and invalidates Suspension Blocks in real time, while intelligently limiting chart clutter to only the most relevant structures near current price.
-----------------------------------------------------------------------------------------------
PURPOSE AND SCOPE
-----------------------------------------------------------------------------------------------
- Detect ICT-style Bullish and Bearish Suspension Blocks using strict 3-candle body relationships
- Require measurable body-to-body separation defined in true ticks (instrument-aware)
- Automatically draw and extend Suspension Blocks forward in time
- Invalidate blocks only when price decisively closes beyond the defining boundary
- Optionally display Consequent Encroachment (50% equilibrium) within each block
- Limit on-chart visibility to the closest N blocks per side relative to current price
- Provide session-based, directional alerting for new block formations
-----------------------------------------------------------------------------------------------
WHAT IS A SUSPENSION BLOCK
-----------------------------------------------------------------------------------------------
A Suspension Block is a 3-candle displacement pattern defined by body gaps on both sides of a middle candle.
Bullish Suspension Block logic:
- Candle 1 close is BELOW Candle 2 open by at least the Minimum Body Separation
- Candle 3 open is ABOVE Candle 2 close by at least the Minimum Body Separation
- Candle 3 open is ABOVE Candle 1 close to ensure a valid vertical range
- The block spans from Candle 1 close (low) to Candle 3 open (high)
- The block remains valid until price CLOSES below Candle 1 close
Bearish Suspension Block logic (mirror conditions):
- Candle 1 close is ABOVE Candle 2 open by at least the Minimum Body Separation
- Candle 3 open is BELOW Candle 2 close by at least the Minimum Body Separation
- Candle 3 open is BELOW Candle 1 close to ensure a valid vertical range
- The block spans from Candle 1 close (high) to Candle 3 open (low)
- The block remains valid until price CLOSES above Candle 1 close
All calculations are performed using true tick values via `syminfo.mintick` to ensure precision across instruments.
-----------------------------------------------------------------------------------------------
GENERAL SETTINGS
-----------------------------------------------------------------------------------------------
- Minimum Body Separation (ticks)
- Defines the minimum required body-to-body gap between candles
- Measured in true ticks (0.25 = quarter tick, 1.0 = full tick, etc.)
- Max Visible Blocks per Side
- Limits the number of bullish and bearish blocks displayed
- Only the closest blocks to current price remain visible
-----------------------------------------------------------------------------------------------
VISUALIZATION SETTINGS
-----------------------------------------------------------------------------------------------
- Bullish Suspension Blocks
- Toggle bullish block visibility
- Custom fill color with adjustable transparency
- Optional border with selectable line style (Solid / Dashed / Dotted)
- Bearish Suspension Blocks
- Toggle bearish block visibility
- Custom fill color with adjustable transparency
- Optional border with selectable line style (Solid / Dashed / Dotted)
- Consequent Encroachment (CE)
- Optional 50% equilibrium line drawn inside each block
- Custom color and line style
- Automatically extends with the block
Blocks dynamically extend to the current bar and are hidden or shown based on proximity to price to keep the chart clean and actionable.
-----------------------------------------------------------------------------------------------
BLOCK MANAGEMENT & INVALIDATION
-----------------------------------------------------------------------------------------------
- Each block is stored persistently and extended forward bar-by-bar
- Bullish blocks are invalidated only when price CLOSES below the block low
- Bearish blocks are invalidated only when price CLOSES above the block high
- Invalidated blocks and their CE lines are automatically removed
- Visibility logic ensures only the most relevant structures are emphasized
-----------------------------------------------------------------------------------------------
ALERT SYSTEM
-----------------------------------------------------------------------------------------------
- Optional alerts when new Suspension Blocks form
- Independent toggles for bullish and bearish alerts
- Fully customizable alert messages
- Alerts can be restricted to specific trading sessions:
- Session 1 (default: 09:30–16:00 NY)
- Session 2 (optional)
- Session 3 (optional)
- Alerts include ticker and timeframe context automatically
-----------------------------------------------------------------------------------------------
BEST USE CASES
-----------------------------------------------------------------------------------------------
- High-probability reaction zones after displacement
- Confluence with liquidity, PD arrays, and market structure
- Execution refinement within ICT-based models
- Intraday and higher-timeframe contextual bias
- Clean, rules-based identification of inefficiency zones
-----------------------------------------------------------------------------------------------
DISCLAIMER
-----------------------------------------------------------------------------------------------
This indicator is provided for educational and analytical purposes only. It does not constitute financial advice. Trading involves risk, and past performance is not indicative of future results.
© TakingProphets
-----------------------------------------------------------------------------------------------

GHOST SNIPERGHOST SNIPER™ – BB Reversal Engine + Smart Entry / Exit Structure Core
MNQ / MES / Stocks / ETFs / Crypto / FX
BB Reversals · Breakouts · PD Structure · Liquidity Sweeps · Displacement · Smart Targets · Quick SL & TP Logic
________________________________________
Summary
Ghost Sniper™ is a high-precision reversal and breakout engine designed for intraday scalping on MNQ/MES, while remaining highly effective across equities, ETFs, crypto, and FX.
It blends a custom Bollinger Reversal Framework (BB Bottom / BB Top Sniper) with an internal ICT-style structure core to filter noise and isolate only high-quality turning points.
The system reads stretch and failure conditions, detects band breakouts, and identifies Bollinger Band failures to anticipate sharp reversals. It includes a Quick TP (QTP) and Quick SL (SL-Q) module for micro-scalps, along with full ICT-style structural targets (TP1, TP2, TP3) for extended runs.
All TP levels and SL placement are derived from smart structural logic, designed to reduce premature stop-outs and improve fill reliability during volatility.
Real-time intrabar logic ensures entries trigger the moment structure confirms — no repainting.
________________________________________
BUY / SELL Signal Activation & Checklist HUD
Ghost Sniper™ uses a rule-based BUY / SELL triggering system driven by real-time structural confirmation — not delayed indicators or hindsight logic.
Entries only activate when a multi-condition internal checklist aligns, combining:
• Bollinger stretch, failure, or breakout behavior
• Liquidity sweep or rejection context
• Micro structure confirmation (BOS / displacement)
• Premium / Discount positioning
• Momentum and reversal candle confirmation
A built-in Checklist Activation HUD visually displays when conditions are forming, aligning, or fully confirmed, allowing traders to see why a signal is valid — not just that it fired.
BUY / SELL signals trigger only when checklist confirmation is reached, filtering low-probability setups and maintaining clean, high-quality entries.
All logic operates intrabar and in real time, with no repainting.
________________________________________
Market Structure & Context Awareness
Ghost Sniper™ incorporates a streamlined ICT-inspired framework, including:
• Liquidity sweep awareness (stop-runs and grabs)
• Micro BOS confirmation
• Premium / Discount context
• Impulse and displacement reads
• Reversal candle assist
• Optional PD / HTF alignment gates
To support institutional-grade context without visual clutter, Ghost Sniper™ also includes a comprehensive set of fully optional, user-selectable tools, allowing traders to tailor the chart to their workflow:
• VWAP
• Up to 5 configurable moving averages
• Bollinger Bands
• Automatic liquidity sweep level detection
• Opening Range Breakout (ORB)
• Midnight Open
• 9:30 AM New York Open
• Previous Day High / Low (PDH / PDL)
• Previous Week High / Low (PWH / PWL)
• Current Week High / Low (CWH / CWL)
• Monthly High / Low
• Previous Month High / Low (PMH / PML)
• Global session tracking, including:
o Asia Session
o London Session
o New York Session
All levels and context tools are individually selectable, designed to provide structure and bias awareness while keeping charts clean and focused.
________________________________________
Execution & Risk Logic
Ghost Sniper™ automatically prints clean, minimal BUY / SELL signals, intelligent stop placement, and progressive target logic:
QTP → TP1 → TP2 → TP3
A built-in Break-Even engine, structural invalidation logic, and one-trade-at-a-time control help maintain disciplined execution and consistent risk management.
Designed for traders who want a fast, decisive, and high-probability entry engine without visual noise or unnecessary complexity.
________________________________________
Disclaimer
This tool is for educational and research purposes only and is not financial advice.
Always test thoroughly in replay or paper trading before using in live markets.

AR-Session-Orb-HTF High/LowThis indicator is built for intraday model execution around liquidity grabs, session timing, and higher-timeframe draw-on-liquidity. It maps out sessions, ICT killzones, Session opening ranges (including the US 09:30 cash open), a daily NY “TD Open” line (00:00 → NY close), and key highs/lows from higher timeframes directly onto any lower timeframe chart (down to 1 minute).
________________________________________
1. Sessions (Asia / London / New York)
• Highlights the 3 main sessions with colored boxes:
• Asia
• London
• New York
• Default session times are set in New York local time:
• Asia: 18:00–02:00
• London: 03:00–12:00
• New York: 08:00–17:00
• You can change these times in the settings.
• Each box automatically expands as the session progresses.
Why it matters: these windows show you where liquidity usually builds, where the day “hands off” from Asia → London → NY, and when expansion/displacement typically happens.
________________________________________
2. ICT Killzones
The script includes 4 configurable killzones (NY local by default):
• Asia late session: 20:00–00:00
• London killzone: 02:00–05:00
• New York AM: 07:00–10:00
• New York Midday: 10:00–12:00
For each killzone you can:
• toggle on/off
• adjust the time window
• pick colors
This makes it easy to see when price is trading inside a high-probability delivery period, so you can line it up with liquidity above/below the session or OR.
________________________________________
3. Opening Range Levels
The indicator captures the high and low of the first X minutes (default 15) of each important window and projects those levels as horizontal lines.
It does this for:
• Asia Open Range
• London Open Range
• New York Open Range (08:00)
• NY 09:30 Cash-Open Range
• (in the original idea: NY mid / second NY window)
Behavior:
• Asia OR → after the first X minutes of Asia, the high/low are projected across the rest of the trading day.
• London OR → taken from the London start, but extended only while London is active.
• NY OR (08:00) → taken from the start of the NY session and extended only during NY.
• NY 09:30 OR → this one is special. At exactly 09:30 (cash open) the script starts a second, independent OR for that day, using your chosen length (e.g. 15 minutes). When the window finishes, it freezes the 09:30 high and low and projects them horizontally all the way to the NY session end. You can style it separately (color, labels). This gives you a clean “cash-open dealing range” to watch for sweeps, fake-outs and continuations.
You can:
• choose the range length (1–60 minutes for 09:30, 1–30 for the others)
• show/hide each OR
• color each OR
• show labels such as “Asia OR High”, “Lon OR Low”, “NY 09:30 High”, etc.
• control line padding so labels don’t print on top of the candle
These ORs often become obvious liquidity pools, fail-break zones, or continuation triggers.
________________________________________
4. NY TD Open Line (Daily 00:00)
On every trading day the script also plots a “TD” structure for New York:
• at 00:00 NY time it draws a vertical dashed line to mark the day’s start
• it records that day’s open price
• it then projects a horizontal line from 00:00 → all the way to NY session close (default 17:00)
• the horizontal line is labeled e.g. “NY TD Open”
How to use it:
• see instantly where current price is vs the daily open
• combine with 09:30 OR to know if cash open is opening above/below the day’s open
• good for intraday bias (above = bullish day structure, below = bearish day structure)
• nice anchor when you go down to 1m/3m
You can toggle the TD feature on/off and change its colors.
________________________________________
5. Previous Week High / Low
• Plots last week’s high and low on any timeframe
• Drawn as dashed lines with padding (so they don’t run to infinity)
• Each level is labeled (default “PW High” / “PW Low”)
These are classic weekly liquidity magnets and very useful when London/NY is expanding into an old weekly extreme.
________________________________________
6. Monthly High / Low
The script plots both:
• Previous month high/low
• Current month high/low (live)
Defaults:
• previous month → dashed + purple
• current month → solid + blue
You can change:
• line colors
• label text & colors
• how far the line should extend (bars span)
This gives you higher-TF liquidity targets on your intraday chart without switching to M or W.
________________________________________
7. 4H High / Low (Intra-session Liquidity Map)
On timeframes up to 4H, the script also plots:
• previous 4H high/low
• current 4H high/low
Important design choice: they only live inside their own 4H window.
• the previous 4H range is shown only over the previous 4H time span
• the current 4H range is shown only over the current 4H candle
That means you don’t get messy, stretched 4H lines across the whole day — only where they actually apply. This is super useful for London/NY raids on 4H highs/lows.
________________________________________
8. Customization / Inputs
Almost everything is editable:
• session windows + colors
• killzone windows + colors
• opening-range length
• ON/OFF per OR (Asia, London, NY 08:00, NY 09:30)
• label text, size, bg color, text color
• HTF line length (weekly / monthly)
• TD 00:00 ON/OFF + colors
• line end padding so labels don’t sit on the right edge
The idea is to give you structure, not signals.
________________________________________
How to Use
1. Start from the monthly / weekly / previous week levels to see where price “wants” to go.
2. Drop into the active session box / killzone to know when to pay attention.
3. Trade around opening-range highs/lows — especially the NY 09:30 OR — and look for liquidity sweeps.
4. Check where price is relative to the NY TD Open (00:00) to confirm intraday bias.
5. Refine entries using the 4H highs/lows that fall inside that session.
Result: you get a top-down liquidity map + intraday timing tool, all on one chart.
________________________________________
Notes
• All times are interpreted in the chart/session timezone — keep your chart on NY session if you want the defaults to match the description.
• TradingView has drawing limits; on very low timeframes far back in history, old drawings may recycle.
• Because 09:30 and TD are drawn every day, it’s normal to see more labels the further right you scroll.
________________________________________
Disclaimer
This script is for educational and charting purposes only.
It does not generate trade signals, manage risk, or guarantee profitability.
Trading involves risk — always do your own analysis.
Special Thanks to Sabo & Hive Community
Nov 17
Release Notes
This indicator is built for intraday model execution around liquidity grabs, session timing, and higher-timeframe draw-on-liquidity. It maps out sessions, killzones, opening ranges (including the US 09:30 cash open), a daily NY “TD Open” line (00:00 → NY close), and key highs/lows from higher timeframes directly onto any lower timeframe chart (down to 1 minute).
________________________________________
1. Sessions (Asia / London / New York)
• Highlights the 3 main sessions with colored boxes:
• Asia
• London
• New York
• Default session times are set in New York local time:
• Asia: 18:00–02:00
• London: 03:00–12:00
• New York: 08:00–17:00
• You can change these times in the settings.
• Each box automatically expands as the session progresses.
Why it matters: these windows show you where liquidity usually builds, where the day “hands off” from Asia → London → NY, and when expansion/displacement typically happens.
________________________________________
2. ICT Killzones
The script includes 4 configurable killzones (NY local by default):
• Asia late session: 20:00–00:00
• London killzone: 02:00–05:00
• New York AM: 07:00–10:00
• New York Midday: 10:00–12:00
For each killzone you can:
• toggle on/off
• adjust the time window
• pick colors
This makes it easy to see when price is trading inside a high-probability delivery period, so you can line it up with liquidity above/below the session or OR.
________________________________________
3. Opening Range Levels
The indicator captures the high and low of the first X minutes (default 15) of each important window and projects those levels as horizontal lines.
It does this for:
• Asia Open Range
• London Open Range
• New York Open Range (08:00)
• NY 09:30 Cash-Open Range
• (in the original idea: NY mid / second NY window)
Behavior:
• Asia OR → after the first X minutes of Asia, the high/low are projected across the rest of the trading day.
• London OR → taken from the London start, but extended only while London is active.
• NY OR (08:00) → taken from the start of the NY session and extended only during NY.
• NY 09:30 OR → this one is special. At exactly 09:30 (cash open) the script starts a second, independent OR for that day, using your chosen length (e.g. 15 minutes). When the window finishes, it freezes the 09:30 high and low and projects them horizontally all the way to the NY session end. You can style it separately (color, labels). This gives you a clean “cash-open dealing range” to watch for sweeps, fake-outs and continuations.
You can:
• choose the range length (1–60 minutes for 09:30, 1–30 for the others)
• show/hide each OR
• color each OR
• show labels such as “Asia OR High”, “Lon OR Low”, “NY 09:30 High”, etc.
• control line padding so labels don’t print on top of the candle
These ORs often become obvious liquidity pools, fail-break zones, or continuation triggers.
________________________________________
4. NY TD Open Line (Daily 00:00)
On every trading day the script also plots a “TD” structure for New York:
• at 00:00 NY time it draws a vertical dashed line to mark the day’s start
• it records that day’s open price
• it then projects a horizontal line from 00:00 → all the way to NY session close (default 17:00)
• the horizontal line is labeled e.g. “NY TD Open”
How to use it:
• see instantly where current price is vs the daily open
• combine with 09:30 OR to know if cash open is opening above/below the day’s open
• good for intraday bias (above = bullish day structure, below = bearish day structure)
• nice anchor when you go down to 1m/3m
You can toggle the TD feature on/off and change its colors.
________________________________________
5. Previous Week High / Low
• Plots last week’s high and low on any timeframe
• Drawn as dashed lines with padding (so they don’t run to infinity)
• Each level is labeled (default “PW High” / “PW Low”)
These are classic weekly liquidity magnets and very useful when London/NY is expanding into an old weekly extreme.
________________________________________
6. Monthly High / Low
The script plots both:
• Previous month high/low
• Current month high/low (live)
Defaults:
• previous month → dashed + purple
• current month → solid + blue
You can change:
• line colors
• label text & colors
• how far the line should extend (bars span)
This gives you higher-TF liquidity targets on your intraday chart without switching to M or W.
________________________________________
7. 4H High / Low (Intra-session Liquidity Map)
On timeframes up to 4H, the script also plots:
• previous 4H high/low
• current 4H high/low
Important design choice: they only live inside their own 4H window.
• the previous 4H range is shown only over the previous 4H time span
• the current 4H range is shown only over the current 4H candle
That means you don’t get messy, stretched 4H lines across the whole day — only where they actually apply. This is super useful for London/NY raids on 4H highs/lows.
________________________________________
8. Customization / Inputs
Almost everything is editable:
• session windows + colors
• killzone windows + colors
• opening-range length
• ON/OFF per OR (Asia, London, NY 08:00, NY 09:30)
• label text, size, bg color, text color
• HTF line length (weekly / monthly)
• TD 00:00 ON/OFF + colors
• line end padding so labels don’t sit on the right edge
The idea is to give you structure, not signals.
________________________________________
How to Use
1. Start from the monthly / weekly / previous week levels to see where price “wants” to go.
2. Drop into the active session box / killzone to know when to pay attention.
3. Trade around opening-range highs/lows — especially the NY 09:30 OR — and look for liquidity sweeps.
4. Check where price is relative to the NY TD Open (00:00) to confirm intraday bias.
5. Refine entries using the 4H highs/lows that fall inside that session.
Result: you get a top-down liquidity map + intraday timing tool, all on one chart.
________________________________________
Notes
• All times are interpreted in the chart/session timezone — keep your chart on NY session if you want the defaults to match the description.
• TradingView has drawing limits; on very low timeframes far back in history, old drawings may recycle.
• Because 09:30 and TD are drawn every day, it’s normal to see more labels the further right you scroll.
________________________________________
Disclaimer
This script is for educational and charting purposes only.
It does not generate trade signals, manage risk, or guarantee profitability.
Trading involves risk — always do your own analysis.
Special Thanks to Sabo & Hive Community

LVN Smart Liquidity📊 LVN SMART LIQUIDITY
═════════════════════════════════════════════════════════════
─────────────────────────────────────────────────────────────
🎯 OVERVIEW
LVN Smart Liquidity is an advanced Market Profile-based indicator that automatically identifies Low Volume Nodes (LVN) across multiple timeframes. Unlike traditional volume-based indicators, this tool uses TPO (Time Price Opportunity) calculations to detect price levels where minimal trading activity occurred, revealing potential breakout zones and rapid price movement areas.
These LVN zones often behave similarly to Fair Value Gaps (FVG) in Smart Money Concepts, representing "thin air" areas where price tends to move quickly with minimal resistance. The indicator provides dynamic zone management with an immunity period system to prevent premature zone closure.
─────────────────────────────────────────────────────────────
🔬 HOW IT WORKS
MARKET PROFILE TPO METHODOLOGY:
The indicator analyzes each higher timeframe period by:
1. Dividing the price range into 20 equal levels
2. Counting how many bars touched each level (TPO count)
3. Identifying levels with TPO counts below the threshold (default 30% of maximum)
4. Creating horizontal zones that extend until price touches them
MULTI-TIMEFRAME ANALYSIS:
• Supports up to 5 independent timeframes simultaneously
• Each timeframe generates its own LVN zones with unique colors
• Auto-timeframe mode adapts to your chart period
• Zones project from historical sessions onto current price action
SMART ZONE MANAGEMENT:
• Immunity Period: New zones are protected for N bars after creation (default 20)
• This prevents zones from disappearing immediately when price is already within them
• Zones extend right until price touches them, then stop extending
• Historical zones remain visible for reference (optional)
─────────────────────────────────────────────────────────────
💡 WHY LVN ZONES MATTER
Low Volume Nodes represent price levels where:
✓ Price spent minimal time (rejection zones)
✓ Few market participants were active
✓ Inefficient price discovery occurred
✓ Similar to Fair Value Gaps in ICT/SMC methodology
TRADING APPLICATIONS:
• Breakout Acceleration: Price moves rapidly through LVN zones
• Profit Targets: Place targets beyond LVN zones where momentum slows
• Stop Loss Placement: Avoid placing stops inside LVN zones (price likely to continue)
• Confluence with FVG: LVN zones often align with Fair Value Gaps
• Retest Opportunities: When price revisits LVN, expect quick moves
─────────────────────────────────────────────────────────────
⚙️ KEY FEATURES
TIMEFRAME FLEXIBILITY:
• 5 independent timeframe slots with enable/disable toggles
• Auto-mode intelligently selects higher timeframes
• Preset options: 5m, 15m, 30m, 1H, 2H, 4H, D, W, 2W, M, 3M, 6M, 12M
VISUAL CUSTOMIZATION:
• Individual color settings for each timeframe
• Adjustable box transparency and border width
• Toggle timeframe labels and period dates on/off
• Four text size options: tiny, small, normal, large
ADVANCED CONTROLS:
• LVN Threshold: 0-50% (default 30%) - lower = fewer, stronger zones
• Immunity Period: 0-50 bars (default 20) - prevents premature closure
• Show/Hide old boxes for clean chart appearance
• Maximum 500 boxes supported per timeframe
PROFESSIONAL DISPLAY:
• Zones show timeframe label (5m, 1H, D, etc.)
• Optional period dates (dd.MM-dd.MM format)
• Boxes extend right dynamically until price touch
• Clean visual hierarchy with bordered zones
─────────────────────────────────────────────────────────────
📈 HOW TO USE
SETUP:
1. Add indicator to chart
2. Enable desired timeframes (TF1, TF2, etc.)
3. Adjust LVN threshold based on your trading style:
• 20-25% = Very selective (only thinnest zones)
• 30-35% = Balanced (recommended for most markets)
• 40-50% = More zones (higher sensitivity)
INTERPRETATION:
• RED/DARK ZONES = Low trading activity occurred here
• Price tends to move THROUGH these zones quickly
• Similar behavior to Fair Value Gaps (FVG) in Smart Money theory
• Expect acceleration when price enters LVN zones
TRADING STRATEGIES:
1. BREAKOUT TRADING:
- Wait for price to approach LVN zone
- Enter when price breaks into the zone
- Expect rapid movement through the zone
- Target next support/resistance beyond LVN
2. CONFLUENCE ANALYSIS:
- Combine with other SMC concepts (Order Blocks, FVG, Liquidity)
- LVN + FVG overlap = high-probability acceleration zone
- Use higher timeframe LVN as directional bias
3. MULTI-TIMEFRAME:
- Daily LVN = major breakout zones
- 4H LVN = intraday momentum areas
- 15m LVN = scalping opportunities
─────────────────────────────────────────────────────────────
⚠️ IMPORTANT NOTES
WHAT THIS INDICATOR IS:
✓ Market Profile TPO-based LVN detector
✓ Multi-timeframe zone identification tool
✓ Visual representation of low trading activity areas
✓ Complementary to Smart Money Concepts (SMC/ICT)
WHAT THIS INDICATOR IS NOT:
✗ Not a standalone trading system
✗ Not a guaranteed profit generator
✗ Not financial advice
✗ Requires confirmation from price action and other tools
LIMITATIONS:
• Works best on liquid markets with reliable data
• Lower timeframes may produce excessive zones
• Requires understanding of Market Profile concepts
• Performance depends on proper threshold calibration
BEST PRACTICES:
• Start with 1-2 timeframes, add more as needed
• Use higher timeframes for swing trading
• Combine with support/resistance, trendlines, order blocks
• Backtest on your specific instrument before live trading
• Adjust immunity period based on market volatility
─────────────────────────────────────────────────────────────
🔧 SETTINGS GUIDE
TIMEFRAME GROUPS (1-5):
Each group contains:
• Enable toggle - Turn timeframe on/off
• Timeframe selector - Choose period or Auto
• Box color - Zone fill color
• Border color - Zone outline color
GENERAL SETTINGS:
• LVN Threshold (%) - Percentage of max TPO to qualify as LVN
• Show Old LVN Boxes - Keep historical zones visible
• Box Border Width - Visual thickness (1-4)
• Immunity Period - Protection bars for new zones
• Show Timeframe - Display TF label in boxes
• Show Period - Display date range in boxes
• Text Size - Label size adjustment
─────────────────────────────────────────────────────────────
📊 ORIGINALITY & UNIQUENESS
This indicator is original because:
1. TPO-BASED CALCULATION: Uses Market Profile Time-Price-Opportunity methodology instead of traditional volume analysis, making it work on all markets including those without real volume data (Forex, some indices).
2. IMMUNITY SYSTEM: Unique protection mechanism prevents zones from disappearing immediately when price is already within zone boundaries at creation time.
3. TRUE MULTI-TIMEFRAME: Independent calculation for each timeframe with separate zone management, not simple higher timeframe projection.
4. SMART ZONE LIFECYCLE: Zones dynamically extend until price touch, then become static historical references.
5. FVG-LIKE BEHAVIOR: Bridges traditional Market Profile analysis with modern Smart Money Concepts by identifying zones that behave similarly to Fair Value Gaps.
Unlike existing LVN indicators that rely on volume data, this tool uses time-based analysis, making it universal across all market types and compatible with brokers that don't provide accurate volume information.
─────────────────────────────────────────────────────────────
📚 TECHNICAL BACKGROUND
MARKET PROFILE THEORY:
Developed by J. Peter Steidlmayer in the 1980s, Market Profile analyzes market behavior by examining price and time relationships. Low Volume Nodes in traditional profile represent areas where market participants showed minimal interest.
TPO (TIME PRICE OPPORTUNITY):
Instead of counting volume, TPO counts how many time periods (bars) touched each price level. This approach:
• Works on all markets regardless of volume data quality
• Reflects actual time-based market acceptance/rejection
• Reveals psychological price levels through time distribution
CONNECTION TO SMART MONEY CONCEPTS:
Fair Value Gaps (FVG) in ICT methodology represent similar inefficiencies:
• Areas where price moved too quickly
• Imbalances in buying/selling pressure
• Zones that price may revisit or accelerate through
• LVN zones often overlap with FVG locations
─────────────────────────────────────────────────────────────
🎓 RECOMMENDED RESOURCES
To maximize this indicator's effectiveness, study:
• Market Profile fundamentals (TPO, POC, Value Area)
• Smart Money Concepts (FVG, Order Blocks, Liquidity)
• Multi-timeframe analysis techniques
• Volume Profile comparison (understand the difference)
COMPANION INDICATOR:
Consider using "HVN Smart Liquidity" (opposite concept) to identify both high and low volume zones for complete Market Profile analysis.
─────────────────────────────────────────────────────────────
💬 SUPPORT & FEEDBACK
Questions or suggestions? Feel free to comment below or send a private message.
If you find this indicator useful, please boost and share with other traders!
⚠️ DISCLAIMER: This indicator is for educational purposes only. Trading involves risk. Always do your own research and use proper risk management.

STM APEX Pro📊 STM APEX Pro - SMC + ICT + SOM Combined Indicator
The ULTIMATE Smart Money trading tool that combines three powerful concepts into ONE indicator:
━━━━━━━━━━━━━━━━━━━━━━━━━━━━━━
🔷 SMC (Smart Money Concepts)
- Order Blocks (Supply & Demand)
- Fair Value Gaps (FVG/Imbalance)
- Break of Structure (BOS)
- Change of Character (CHoCH)
- Liquidity Sweeps (BSL/SSL)
🔷 ICT (Inner Circle Trader)
- Kill Zones (London, New York, Asia)
- Premium & Discount Zones
- Optimal Trade Entry (OTE)
- Equilibrium Line
🔷 SOM (Swing of MACD)
- MACD Swing Detection
- Multi-Timeframe Confirmation
- Momentum Analysis
━━━━━━━━━━━━━━━━━━━━━━━━━━━━━━
✅ KEY FEATURES:
📌 Smart Signal System
- 4 Signal Modes: Confluence, Custom, Aggressive, Conservative
- Confluence scoring (1-6) for signal quality
- Customizable entry requirements
📌 Advanced SL/TP
- Structure-based (Swing High/Low)
- ATR-based
- Fixed Risk:Reward
- Hybrid method
📌 Real-time Dashboard
- Trend direction
- Premium/Discount zone
- Kill Zone status
- Confluence score
- Multi-TF confirmation
📌 Full Customization
- Every feature can be toggled ON/OFF
- Adjustable colors and styles
- Mobile-friendly mode
━━━━━━━━━━━━━━━━━━━━━━━━━━━━━━
⚙️ SETTINGS GUIDE:
Signal Mode:
- Confluence: Signal when X conditions are met
- Custom: Define your own requirements
- Aggressive: Quick signals (BOS + SOM)
- Conservative: High-quality signals only (4+ confluence)
Recommended Timeframes: M15, H1, H4
Best Pairs: XAUUSD, EURUSD, GBPUSD, US30
━━━━━━━━━━━━━━━━━━━━━━━━━━━━━━
📱 Works on both Desktop and Mobile
🔔 Alert Conditions included for:
- Buy/Sell Signals
- BOS/CHoCH
- Liquidity Sweeps
━━━━━━━━━━━━━━━━━━━━━━━━━━━━━━
⚠️ DISCLAIMER:
This indicator is for educational purposes. Past performance does not guarantee future results. Always use proper risk management.
━━━━━━━━━━━━━━━━━━━━━━━━━━━━━━
💬 Support:
Tags: SMC, ICT, Smart Money, Order Block, FVG, BOS, CHoCH, Liquidity, Kill Zone, MACD

ORB + Fair Value Gaps (FVG/iFVG) Suite with Daily 50% MidlineA complete smart-money–focused price-action toolkit combining the New York Open Range Breakout (ORB), ICT-style Fair Value Gaps, Inverted FVGs, and a dynamic Daily 50% Midline.
Designed for traders who want a clean, fast, and highly visual way to track liquidity, imbalances, and intraday directional bias.
📌 Key Features
1. NY Session ORB (09:30–09:45 New York Time)
Automatically plots:
ORB High
ORB Low
Labels for ORB high/low
Optional 5-minute chart restriction
Lines extend forward for easy reference
Used to identify breakout conditions, liquidity sweeps, and directional bias into the morning session.
📌 2. ICT-Style Fair Value Gaps (FVGs)
Full automated detection of bullish & bearish FVGs based on the classic 3-candle displacement structure:
Bullish FVG: high < low
Bearish FVG: low > high
Each FVG is drawn as a box with:
Custom colour
Custom border style (solid, dashed, dotted)
Automatic extension to the right until filled
Optional size text showing the gap in points (font size/colour adjustable)
Adjustable max lookback for performance
📌 3. Inverted FVGs (iFVGs)
Once price fully fills an FVG, it automatically becomes an iFVG, shown with:
Custom iFVG colour
Custom border style
Extension to the right
Once price trades through the zone from the opposite side, the iFVG is considered “consumed” and:
It stops extending
And optionally auto-deletes based on user settings
This makes it easy to track meaningful imbalances that turn into liquidity pockets.
📌 4. “Show Only After ORB” Filter
Optionally hide all FVGs/iFVGs formed before the ORB completes.
This is especially useful for intraday strategies focused on NY session structure only.
📌 5. Daily 50% Midline (OHLC Midpoint)
A dynamic, always-updating midpoint of the current daily candle:
Mid = (Daily High + Daily Low) / 2
Features:
Custom colour
Dashed styling
Extends left and right as a horizontal ray
Updates live as the daily candle forms
Great for bias filters, mean reversion, and daily liquidity zones.
📌 6. Performance-Optimized (Fast!)
Built with:
Fully configurable max lookback
Memory-efficient arrays
Auto-cleaning of old FVG/iFVG objects
Lightweight daily midline recalculation
This allows extremely fast rendering even on 1-minute charts.
📌 7. Alerts
Includes a clean alert condition:
Price returned to a Fair Value Gap
Works for both bullish and bearish FVG revisits.
🎯 Who This Indicator Is For
This tool is ideal for traders who use:
ICT / SMC concepts
Liquidity-based trading
ORB strategies
Imbalance-driven price action
Intraday or NY session-focused setups
Futures, crypto, forex, and equities
🎁 Summary
This indicator gives you:
A clean ORB framework
Automatic, dynamic FVG and iFVG analysis
Real-time daily candle context
Customizable visuals
Powerful session filtering
Efficient performance
All in one clean, intuitive package built for real-time decision making.

FVG Visual Super Clean (ticks)This is a robust and highly visual indicator designed for traders utilizing Smart Money Concepts (SMC) or Inner Circle Trader (ICT) methodologies.
Its core function is to automatically identify, visualize, and manage Fair Value Gaps (FVGs) or price inefficiencies, offering deep insight into institutional order flow.
Key Features & Capabilities
Advanced FVG Detection: Accurately identifies bullish and bearish Fair Value Gaps (FVGs) based on the 3-bar pattern.
Wick vs. Body Logic: Configurable option to use candle wicks (high/low) or bodies (open/close) for FVG calculation.
Displacement Confirmation: Includes an optional filter to require price displacement (a strong close) for higher conviction setups.
Mitigation Tracking & Management: The script actively tracks how much the price has filled or "mitigated" the FVG.
Threshold Auto-Removal: FVGs that reach a user-defined mitigation percentage (mitigation_pct) are automatically removed to keep the chart clean.
Mitigated Visibility: An optional setting allows mitigated FVGs to remain visible, repainting them with a distinct "Mitigated" color (blue by default) to show the exact point of rebalance.
Visual Efficiency:
Automatic Extension: Active, unmitigated FVGs are automatically extended forward in time until they are filled or pruned.
Equilibrium Line: Draws a dotted line at the 50% level (Equilibrium) of each FVG, a key reference point in SMC/ICT trading.
Tick-Based Filtering: Allows filtering gaps by a minimum size in ticks, reducing noise from insignificant micro-gaps.
Trend Context: Integrates a configurable Moving Average (EMA or SMA) for contextual trend analysis. The MA line changes color dynamically (green/red) to quickly signal momentum.
Optimized Performance: Implements a lookback window (lookback_days) and a cleanup routine to manage the number of drawing objects, ensuring smooth performance even on low timeframes.
Ideal For:
Traders focused on SMC/ICT Order Blocks, Imbalances, and Price Delivery.
Backtesting price action strategies around institutional liquidity.
Identifying high-probability entries (e.g., at the 50% line) and targets (e.g., unmitigated gaps).

[Statistics] killzone SFPSFP Statistics (ICT Sessions)
This indicator automatically finds and draws the high and low of the Asia, London, and New York trading sessions. It then hunts for Swing Failure Patterns (SFPs) that sweep these key session levels.
The main purpose of this script is to gather statistics on when these high-probability SFPs occur, allowing you to map out and identify the times of day when they are most frequent.
How to Use This Indicator
Set Your SFP Timeframe: In the settings, choose the timeframe you want to hunt for SFPs on (e.g., 1H, 15m). Important: You must also set your main chart to this exact same timeframe for the statistics to be collected correctly.
Define Your Sessions: Go to the "Session Definitions" tab.
Set the Global Timezone to your preferred trading timezone (e.g., "America/New_York"). This controls all session times and table times.
Adjust the start and end times for Asia, London, and NY AM sessions.
You can turn off sessions you don't want to track (like NY Lunch or NY PM).
You can also change the colors and text style for the session boxes here.
Set Confirmation Bars: In "SFP Engine Settings," the "Confirmation Bars" (default is 2) defines how many bars must close after the SFP bar without invalidating the level. An SFP is only "confirmed" and drawn after this period.
0 = Confirms immediately on the SFP candle's close.
2 = Confirms 2 bars after the SFP candle's close.
Read the Statistics: The "Custom SFP Statistics" table will appear on your chart. This table logs every confirmed SFP and tells you:
Which time of day they happen most.
How many were Bearish (swept a high) vs. Bullish (swept a low).
It's set by default to show the "Top 20" most frequent times, sorted chronologically.
Filter Your Chart (Optional): If your chart feels cluttered, go to "Visual Time Filter" and turn it ON.
Set a time window (e.g., "09:30-11:00").
The indicator will now only draw SFP signals that occurred within that specific time window. This is perfect for focusing on a single killzone.
How to Set Up Alerts
You can set up server-side alerts to be notified every time a new SFP is confirmed.
Check the "Enable SFP Alerts" box at the top of the indicator's settings.
Click the "Alert" button (alarm clock icon) on the TradingView toolbar.
In the "Condition" dropdown, select "SFP Statistics (ICT Sessions)".
In the second dropdown, choose "Any alert() function call".
Most Important Step: In the "Message" box, delete any default text and type in this exact placeholder:
{{alert_message}}
Set the trigger to "Once Per Bar Close".
Click "Create".
How Alerts Work (Triggers & Filtering)
Trigger: Alerts are tied to the confirmed signal. An alert will only fire after your "Confirmation Bars" have passed and the SFP is locked in. This prevents you from getting alerts on fake-outs.
Alert Filtering: The alerts are linked to the "Visual Time Filter". If you turn on the Visual Time Filter (e.g., to 09:30-11:00), you will only receive alerts for SFPs that are confirmed within that time window. If an SFP happens at 14:00, the script will ignore it, it will not be drawn, and it will not send you an alert. This allows you to get alerts only for the session you are actively trading.
Note: This is a first draft of this indicator. I will continue to work on it and improve it over time, as it may still contain small bugs.
Acknowledgements:
A big thank you to TFO (tradeforopp). The session detection logic and the visual style for the session boxes were adapted from his excellent "ICT Killzones & Pivots " indicator.

ATHENS GOLD MASTER v1.1e — by ATHENSATHENS GOLD MASTER v1.1e — by ATHENS
Professional Smart-Money-Based Gold Trading System
Built with institutional precision and ICT logic for XAUUSD traders.
⚙️ Core Strategy Components
✅ ICT Premium/Discount Model
✅ Daily Pivot Points & Price Bias
✅ Order Block & Break of Structure Detection
✅ Fair Value Gap (FVG) Mitigation Logic
✅ Dynamic Support & Resistance Recognition
✅ Candlestick + Chart Pattern Confirmation
✅ Multi-Timeframe Structure Alignment
💡 How It Works
The indicator scans real-time GOLD price action and generates Buy / Sell signals only when 3 or more confirmations align across smart money and technical confluence.
Each signal is visually marked on the chart with labels showing:
Confirmation count (1–5)
Key structure notes (Pivot, OB, FVG, etc.)
Support/Resistance zone tags
🧠 Optional Filters for Accuracy (90%+)
EMA-200 Trend Filter
ATR Volatility Filter
Volume Strength Filter
Session-Time Restriction (London–New York Overlap)
🟩 Buy Signal Example
Price above Pivot & in Discount Zone
Bullish Order Block Retest
FVG Mitigation Confirmed
Bullish Engulfing / Pin-Bar Confirmation
🟥 Sell Signal Example
Price below Pivot & in Premium Zone
Bearish Order Block Retest
FVG Mitigation Confirmed
Bearish Engulfing / Pin-Bar Confirmation
📊 Extra Features
Live Bias Table (Panel)
Selective Smart S/R Zones
Auto Session Filter
Alerts for Buy, Sell, and Strong Confluences
Best for: Gold Traders, ICT Students, Smart-Money Concepts Enthusiasts, and Professional Price-Action Analysts.
⚜️ Developed by ATHENS | Sahan Akalanka
📈 “Trade Smart. Think Institutional.”
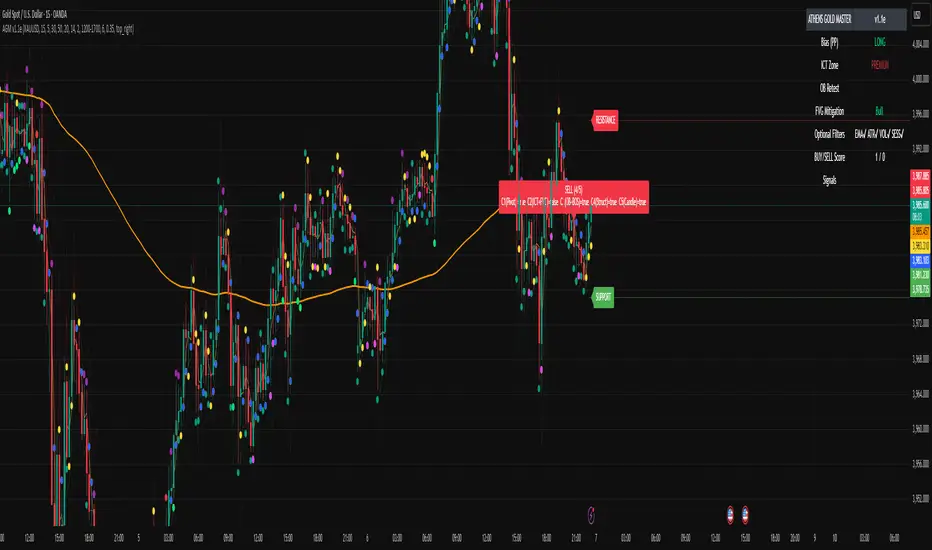
LANZ Origins🔷 LANZ Origins – Multi-Framework Liquidity, Structure & Risk Management Overlay
LANZ Origins is an advanced multi-framework visualization toolkit that unifies key institutional concepts into one efficient interface. Designed for professional traders, it merges session mapping, liquidity analysis, imbalance detection, multi-account risk control, and higher-timeframe candle tracing — all in a single overlay.
🧩 Core Components
🈵 Asian Range Liquidity
Automatically detects and projects the Asian session range (19:00–02:00 NY) with an optional mid-price line (50 %). This provides visual context for intraday liquidity and manipulation zones commonly referenced in ICT-style analysis.
📊 Imbalance Detector
Highlights Fair Value Gaps (FVG), Opening Gaps (OG), and Volume Imbalances (VI) directly on-chart, using separate color schemes for bullish and bearish inefficiencies. Each element can be customized by width, ATR filter, and extension length.
🕯️ Higher-Timeframe Candles (ICT Style)
Displays multi-timeframe candles (HTF1–HTF6) simultaneously — e.g., 5 m, 30 m, 1 h, 4 h, 1 D, 1 W — each rendered with independent wick, border, and fill settings. Includes remaining-time counters, timeframe labels, and optional imbalance shading between bodies.
📈 Market Structure (ZigZag 30 m)
Replicates 30-minute swing structure to all active timeframes, producing dynamic pivots with live extension. Ideal for contextualizing BOS/CHoCH events across multiple scales.
💸 Multi-Account Lot Size Panel
Calculates position size for up to five accounts simultaneously, using your defined capital, risk %, and fixed SL distance (in pips). Results appear in a clean table at the bottom-right corner of the chart.
🎨 Session Visualization
Colored backgrounds mark key trading phases:
🟢 Day division
🔴 No-action zone
🔵 Kill-zone
🟡 Hold session
⚙️ Customization & Performance
Every module can be toggled individually, with full color, opacity, and style control. The script is optimized for overlay use and supports up to 500 boxes, lines, and labels with efficient resource handling.
🧠 Best Use Case
LANZ Origins is ideal for traders who follow:
Smart Money Concepts / ICT methodology
Liquidity & Imbalance-based trading
Multi-timeframe confluence setups
Risk-based position sizing workflows
Use it to observe how price interacts with liquidity pools, higher-timeframe candles, and imbalances within key sessions — while monitoring lot size risk in real time.
📌 Recommended Setup
Timeframes: 30m - 5m – 3m
Pairs: FX
Session Timezone: New York (EST/EDT)
Combine with: LANZ Strategy series for execution and journaling
💬 Note
This indicator does not generate buy/sell signals. It’s a visual and analytical tool built to support your own decision-making process.

Liquidity On TimeIn ICT, liquidity means pools of orders resting in the market.
These are usually stop-losses or pending orders from retail traders.
Liquidity on time combines liquidity with the time-of-day element.
ICT teaches that markets deliver liquidity at specific trading sessions.
Main sessions: London Open (2–5 AM EST) and New York Open (7–10 AM EST).
These times concentrate order flow, creating high-probability moves.
Smart Money hunts liquidity at those hours, not randomly.
Example: During London Open, stops above Asian range = liquidity target.
New York session often sweeps London highs/lows before real move.
Thus, timing tells us when liquidity will likely be attacked.
"Liquidity on time" = confluence of where liquidity sits and when it’s taken.
It explains why moves often happen at precise clock times, not anytime.
Traders use it to avoid chasing price outside killzones.
ICT emphasizes “time & price” must agree for valid setups.
Price alone is incomplete; time confirms when Smart Money acts.
This prevents overtrading in quiet hours.
Example setup: Liquidity sweep at 9:30 AM NYSE open → entry trigger.
Liquidity on time also explains engineered stops runs before news.
The concept ties into Killzones, FVGs, and SMT divergence.
In short, Liquidity on Time = knowing WHEN liquidity will be raided.
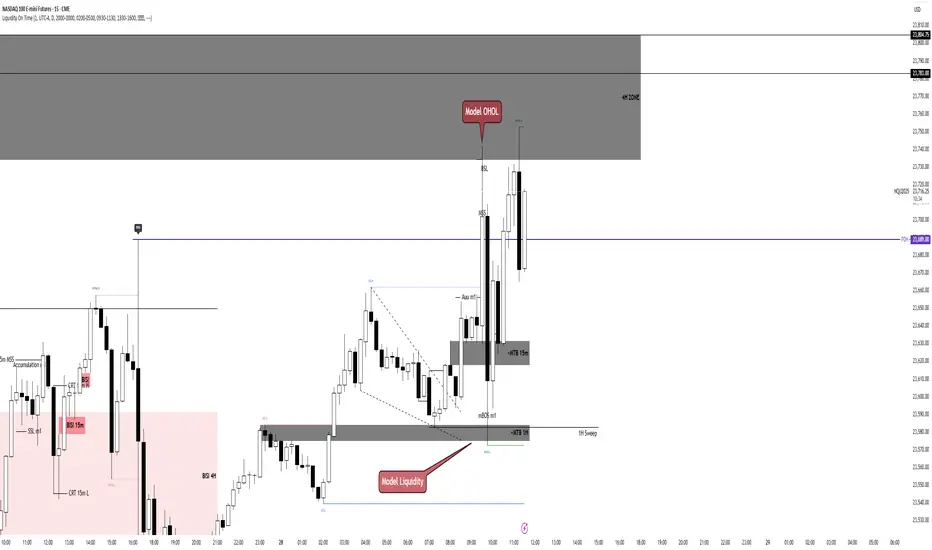
Daily Separator & Killzone marker (L3J)The “Daily Separator (L3J)” is a tool built for day traders who want a clean intraday structure around key U.S. market times and a professional trading-day model. It visually segments trading days, marks critical intraday timestamps (pre-market, cash open, killzone), and aligns with routines inspired by ICT concepts.
Important note: internal code comments and notes are written in French.
What the script does
Draws clear, configurable vertical lines to separate each trading day.
Supports two trading-day models:
- CME 18:00–17:00 (anchored on the Asian session, common for indices/futures)
- Calendar 00:00–23:59 (midnight-to-midnight)
Plots four key intraday rays in UTC‑4:
- 08:30 — U.S. pre-market open
- 09:30 — U.S. cash market open
- 09:50 — killzone start (per my routine)
- 10:30 — killzone end (per my routine)
Smart display logic: each day’s marker stays visible until the time is reached, then auto-hides to keep charts clean.
Object-budget control: caps the number of historical separators to preserve performance.
Day trading strengths (ICT-friendly)
Robust CME anchoring: day switches at the Asian session start in UTC‑4, which better reflects U.S. liquidity flow than calendar midnight.
Focused killzone: highlights 09:50–10:30 for impulse setups, rebalancing, and liquidity events around the open.
Clean readability: fully customizable colors, styles, and widths; markers auto-remove after their window.
Inputs (end‑user labels in French)
- Timezone: choose the time zone (default UTC‑4) for session alignment.
- Day separator:
- Day type: “CME 18:00–17:00” or “Calendrier 00:00–23:59”
- Color, style (solid, dashed, dotted), width
- Max number of visible separators (performance control)
Session (CME): Asian session window used as the anchor (default 18:00–16:00 UTC‑4)
ndependent intraday markers:
- Pre‑Market Open 08:30
- Market Open 09:30
- Killzone Open 09:50
- Killzone Close 10:30
- Each with show/hide, color, style, and width settings
Best practices
U.S. indices ( CME_MINI:ES1! , CME_MINI:NQ1! ) and U.S. equities: favor the “CME 18:00–17:00” mode for a more liquidity‑centric read.
ICT day trading: form directional bias around 09:30, execute between 09:50–10:30 as initial volatility structures.
Multi‑timeframe use: keep it on execution charts (1–5 min) and context charts (15–60 min) for time alignment.
Technical notes
Created by L3J.
Pine Script v6, overlay=true, controlled object budget.
Deterministic time calculations via Pine built‑ins.
All times are expressed in UTC‑4 to align with U.S. practice; adjust the timezone input as needed.
- Internal code comments/notes are written in French.
If this script helps you structure your sessions better, consider leaving a like and sharing it with other intraday traders.
Happy trading, everyone!