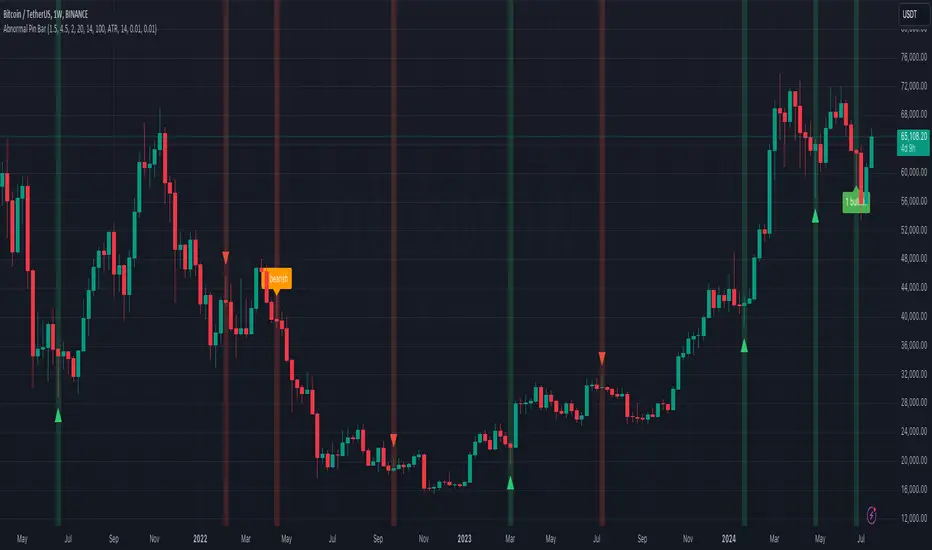
Abnormal Pin BarPin Bar is one of the most important candlestick patterns. Almost every time you see a pin bar, you can expect the price to turn in the opposite direction.
You should pay more attention to the abnormal ones among the pin bars. What I mean by abnormal pin bar is that the long leg is at least 3 times larger than the body.
With this indicator, you can set your own abnormal pin bar settings. The indicator will highlight abnormal pin bars according to the settings you specified.
The indicator uses the following three factors to indicate abnormal pin bar:
- Minimum body ratio in the pattern in percent
- Minimum ratio of the long shadow to the body
- Minimum ratio of the long shadow to the short shadow
Also, there is a volume strength check to confirm the pin bar. If the volume where the pin bar is formed is greater than the 20 volume average, it indicates that the pin bar is more important. Of course, confirming the pin bar with the volume is optional and you can disable it in settings if you wish.
You can use the highlights of this indicator as an entry signal if the pin bar appears at the trend key levels or in support or resistance zones.
Recherche dans les scripts pour "key levels"
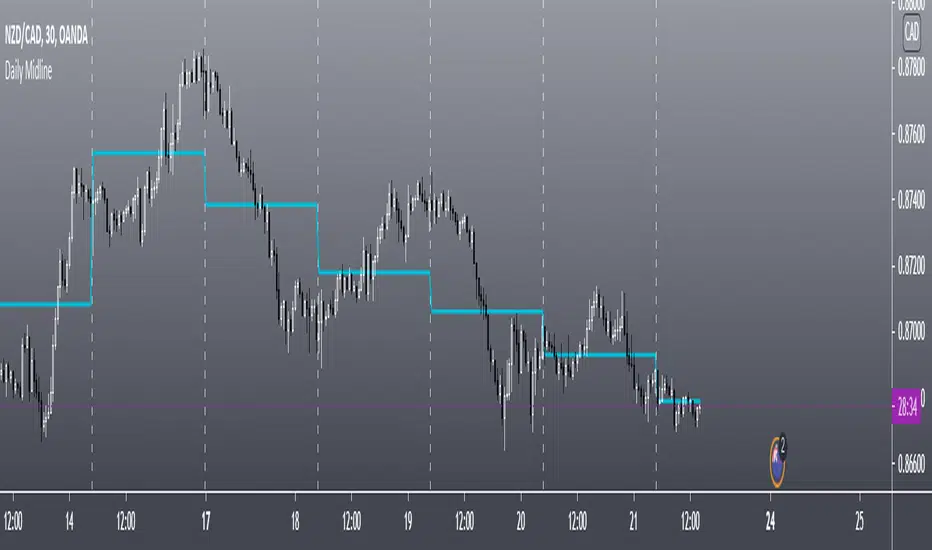
Daily MidlineThis Scripts Shows Daily Midline Levels From Yesterday High/lows.
Credits to rodrigo.aprieto and NorthstarDaytrading
for combined script idea.
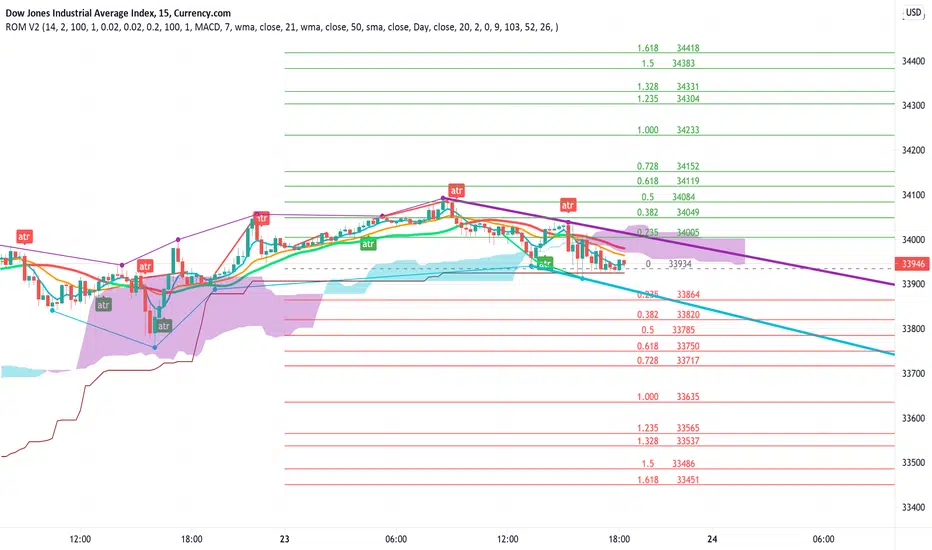
Rain On Me V2As promised, here is Rain On Me Indicator V2! As the name suggests, this indicator will rain money down on you. More seriously, Rain On Me V2 is a complete overhaul of the V1.
For those who are new to this indicator or for those who already knew it, here is a complete description of this indicator.
This indicator contains:
-Fully configurable multi-timeframe buy or sell signals based on ATR with the possibility to set the period, deviation, period of the ATR and choose the source or type of signals: RMA, SMA , EMA, WMA, VWMA, SMMA, KMA, TMA, HullMA, DEMA, TEMA, CTI.
-Colouring of candles on ATR. (green and red).
-Buy or sell signals with VPT (based on st_dev) with the possibility of adjusting the period and the multiplier. (Only works in markets with available volume information flows).
-Trend Parabolic SAR (Up / Down) fully configurable.
-Divergences with the possibility of choosing among the following signals: MACD, OBV, RSI, CCI.
-3 Moving averages with the possibility of choosing their values and their type for each one: SMA, EMA, RMA, WMA, VWMA. (default: WMA 1 = 7, WMA 2 = 21 and SMA 3 = 50).
-Fibonacci on 10 levels with level 0 in the middle. This Fibonacci helps a lot as it can make it easy for you to find an entry / exit point, a trend and even where to place your Take Profit and Stop Loss.
-Fully customizable Bollinger Band.
-Fully customizable Ichimoku cloud.
-Multi-timeframe Trendline that tells you the true trend of the current market based on volume. (Only works in markets with available volume information flows). It can change from green (for an uptrend) or red (downtrend) color.
To place an alert, always choose the "Once per bar" option.
You can place alerts on the following options:
-GO Buy / GO Sell (ATR).
-VPT Buy / Sell.
-PSAR (Up / Down).
-Divergences (Bullish / Bearish).
-Crossing of moving averages 1 and 2.
-Fibonacci key levels (0.382, 0.5 and 0.618) for Crossunder and Crossover in an uptrend or downtrend.
You can choose to show or hide from the chart all the options mentioned above.
Never follow buy or sell signals stupidly. Always watch that all the indicators are going in the same direction, that you are not in a range zone, that there is no resistance etc ...
Always wait for confirmation after a buy or sell alert before entering a position to make sure the label stays on the chart and doesn't disappear.
Please feel free to give your ideas, suggestions or bug reports in the comments area to help me improve it.
A BIG THANKS TO QUANTNOMAD FOR GIVING ME ITS AUTHORIZATION TO USE, MODIFY AND REPUBLIC ITS "Ultimate Pivot Points Alerts" script indicator:
Good trade everyone! And remember, money management is the most important!
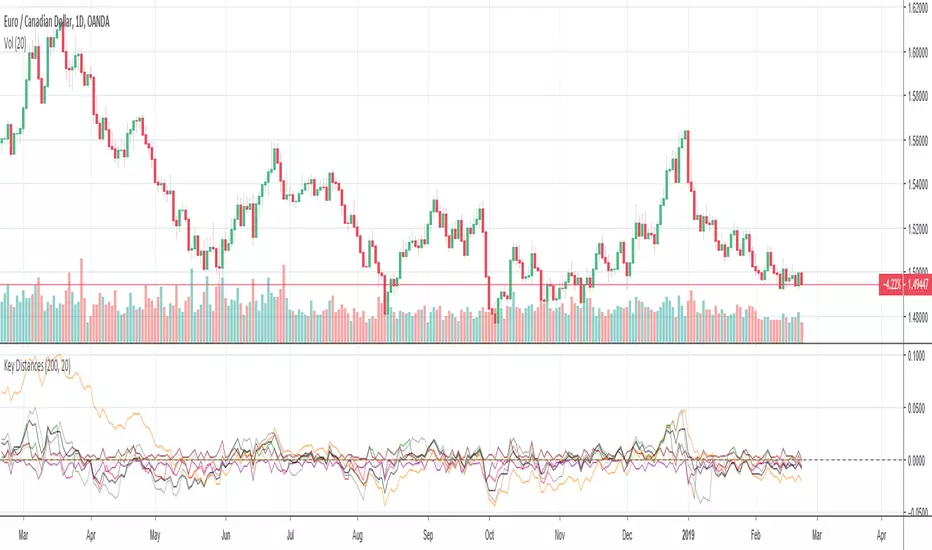
Key Distances (Weekly, Daily Open, & EMA)This indicator provides the pip value from various key levels I've found important in my trading system.
The results are graphed. I suggest that you choose the 2 most important ones you want to graph otherwise the indicator gets difficult to read.
The important data is the actual numbers but I've found it helpful to understand how a ticker moves in regards to weekly open and distance from 200EMA to be most helpful.
Here is the order of the data listed:
Distance from weekly open (green if above open, red if below open, also paints color on line)
Distance from last week opening price
Distance from daily open
Distance to 200EMA
Future Possible Updates:
- customized EMA
- Distance from weekly low/high
Time Pressure ZonesTime Pressure Zones is a multi‑purpose candle and volume‑based indicator that highlights moments when markets are likely being driven by urgency rather than routine trading flow.
**Overview**
Detects sequences of strong, one‑directional candles accompanied by volume spikes to approximate institutional time pressure (forced buying or selling).
Paints subtle background zones, labels, and a net‑pressure histogram so you can see when aggressive flow is building or exhausting across any instrument and timeframe.
**Core Logic**
A bar is tagged “strong” when its real body occupies at least a user‑defined percentage of the full high‑low range, filtering out indecision candles and long‑wick noise.
Volume is compared to a rolling 20‑bar average; only bars with volume above a configurable multiple are treated as meaningful participation, which makes the tool adapt to different symbols and sessions.
The script counts consecutive bars that are both strong and high‑volume in the same direction, then flags a time‑pressure event once a set fraction of the lookback has been reached (e.g., 2 out of 3, 3 out of 5).
**Visual Outputs**
Background shading: green or red bands mark active bullish or bearish time‑pressure windows without overpowering other tools on the chart.
On‑chart labels: “↑ Time Pressure” and “↓ Time Pressure” appear only on the first bar of a new pressure sequence, ideal for alerts and discretionary entries.
Net Pressure histogram: plots the difference between bullish and bearish streak counts, giving a quick at‑a‑glance sense of which side currently dominates.
**Sessions and News**
Uses UTC‑based logic to highlight London and New York open and close windows, where institutional flows and intraday “deadline” behavior tend to cluster.
Includes a manual News Window toggle so you can mark high‑impact event periods (CPI, FOMC, NFP, etc.), aligning tape‑based urgency with scheduled catalysts.
**How To Use**
Look to join moves when fresh time‑pressure labels print into session opens, breakouts, or key levels, rather than fading them.
Tune the three main inputs per market and timeframe: lower thresholds for choppy or thin markets, and higher body/volume requirements for very liquid symbols like major indices or BTC pairs.

eBacktesting - Learning: Liquidity GrabseBacktesting - Learning: Liquidity Grabs highlights moments when price pushes just beyond a recent swing high or swing low (where many stops tend to sit) and then quickly returns back inside the level. This behavior is often called a stop run, sweep, or liquidity grab.
Traders study these events because they can reveal:
- Where liquidity is “resting” (obvious highs/lows)
- A quick sweep and rejection (often a wick)
- When a breakout attempt is actually a trap
- A full candle close through the level, followed by an immediate reversal back inside (classic breakout trap)
- Potential areas where price may reverse or accelerate after stops are taken
Use it as a training tool to build pattern recognition and improve your patience around key levels, especially during active sessions where sweeps happen frequently.
These indicators are built to pair perfectly with the eBacktesting extension, where traders can practice these concepts step-by-step. Backtesting concepts visually like this is one of the fastest ways to learn, build confidence, and improve trading performance.
Educational use only. Not financial advice.

***CILGIN INDIKATOR***ÇILGIN INDICATOR – User Guide
OVERVIEW
ÇILGIN INDICATOR is a multi-layer trend and momentum confirmation tool designed for discretionary traders.
It combines Relative RSI, EMA structure, SuperTrend logic, Momentum, and optional CCI & ADX filters into a single visual system.
Purpose:
Filter market noise, confirm trend strength, and highlight high-probability Buy / Sell zones.
The indicator works on all symbols and all timeframes.
RELATIVE RSI & MOMENTUM
The indicator can work in two modes:
NORMAL MODE (Formula OFF)
RSI is calculated directly from the chart symbol.
FORMULA MODE (Formula ON)
RSI is calculated from a relative price formula:
Base Symbol / Denominator 1 / Denominator 2
This allows relative strength analysis against indices, sectors, or benchmarks.
RSI SIGNAL LOGIC
RSI Signal Line = SMA of RSI
RSI 50 Level = Trend bias reference
BUY SIGNAL
RSI crosses above the signal line
Optional: RSI must also cross above 50 (Double Confirmation)
SELL SIGNAL
RSI crosses below the signal line
Optional: RSI must also cross below 50
Small arrows on the chart represent RSI-based Buy and Sell signals.
EMA STRUCTURE
Five adaptive EMAs are plotted: EMA 1
EMA 5
EMA 21
EMA 50
EMA 100
EMA lengths automatically adapt to timeframe speed.
EMA BUY LOGIC
Fast EMA crosses above any slower EMA.
EMA SELL LOGIC
Fast EMA crosses below any slower EMA.
EMAs define:
Trend direction
Dynamic support and resistance
Momentum shifts
SUPERTREND SYSTEM
A custom ATR-based SuperTrend is used.
Features:
Optional candle wick usage
Dynamic trailing stop
Visual Buy / Sell labels
SUPERTREND BUY
Trend flips from bearish to bullish.
SUPERTREND SELL
Trend flips from bullish to bearish.
Colored zones visualize the active trend direction.
STRONG BUY & STRONG SELL SIGNALS
A Strong Signal is generated only when multiple conditions agree.
STRONG BUY
RSI Buy Signal
SuperTrend Buy Signal
Optional CCI Filter confirmation
Optional ADX Filter confirmation
STRONG SELL
RSI Sell Signal
SuperTrend Sell Signal
Optional CCI Filter confirmation
Optional ADX Filter confirmation
Strong signals are displayed as large labeled markers: “STRONG BUY”
“STRONG SELL”
Designed for trend-following entries, not market noise.
CCI & ADX FILTERS (OPTIONAL)
CCI FILTER
Buy allowed only if CCI > 0
Sell allowed only if CCI < 0
ADX FILTER
ADX must be above minimum level
Direction confirmed using +DI and -DI
These filters help avoid sideways markets and weak trends.
INFORMATION PANELS
PANEL A (Top Right)
Daily percentage change
Weekly percentage change
Monthly percentage change
Daily volume (millions)
PANEL B (Bottom Right)
Relative RSI value
RSI signal value
Relative momentum
Market status (Bull / Bear)
Provides instant market context without extra indicators.
ALERTS
Built-in alerts are available for:
STRONG BUY
STRONG SELL
Suitable for automation and watchlist monitoring.
BEST PRACTICES
Use Formula Mode for relative strength analysis
Enable CCI & ADX filters on higher timeframes
Combine signals with price action and key levels
Do not use as a standalone trading system
DISCLAIMER
This indicator is a decision-support tool and does not provide financial advice.
Always manage risk and confirm signals with your own analysis.

WaveRider [Scalping-Algo]# 📊 TrendPulse Pro - Indicator Guide
## 🎯 What is it?
A clean all-in-one trend tool. Combines 4 smoothed MAs, candlestick patterns & session highlights. No clutter, just signals.
---
## 🔧 Features
### 📈 4 Smoothed Moving Averages
- **21 SMMA** (Cyan) → Fast trend, scalping
- **50 SMMA** (Green) → Swing entries
- **100 SMMA** (Gold) → Medium trend filter
- **200 SMMA** (Red) → Major trend direction
💡 *Price above all = strong bull. Below all = strong bear.*
---
### ⚡ 3 Line Strike Pattern
Rare but powerful reversal signal.
- 🟢 **Bull 3LS** → 3 red candles + 1 big green that closes above first candle
- 🔴 **Bear 3LS** → 3 green candles + 1 big red that closes below first candle
💡 *Best near support/resistance zones.*
---
### 💎 Engulfing Candles
Shows momentum shift.
- 🟢 **Bull Engulf** → Green candle swallows previous red
- 🔴 **Bear Engulf** → Red candle swallows previous green
💡 *Filter with trend direction for better win rate.*
---
### 🕐 Session Highlight
See your trading window clearly.
- Light shade = Pre-session (prep time)
- Darker shade = Active session (go time)
💡 *Default is CME hours. Adjust in settings.*
---
## 📝 Quick Setup
1. Add to chart
2. Pick your timeframe (works on any)
3. Toggle what you need ON/OFF
4. Set your session times
5. Trade with confidence
---
## 🎨 Color Guide
| Element | Default Color | Meaning |
|---------|---------------|---------|
| 21 MA | Cyan | Fast trend |
| 50 MA | Green | Swing trend |
| 100 MA | Gold | Filter |
| 200 MA | Red | Big picture |
| Fill Green | Light Green | Bullish bias |
| Fill Red | Light Red | Bearish bias |
---
## ⚠️ Tips
✅ Use MA stack for trend bias
✅ Wait for patterns AT key levels
✅ Combine with volume
✅ Respect the 200 MA
❌ Don't trade against all MAs
❌ Don't chase every signal
❌ Don't ignore session times
---
## 🚀 Best Practices
**For Scalping:**
- Focus on 21 & 50 MA
- Trade engulfing patterns
- Use 1-5 min charts
**For Swing:**
- Focus on 100 & 200 MA
- Trade 3 Line Strike
- Use 1H-4H charts
---
Made with ☕ by a trader, for traders.
*"Keep it simple. Let price do the talking."*

Intermarket Divergence (Futures vs Equity)Intermarket Divergence (Futures vs Equity)
This indicator detects intermarket divergence between a traded instrument (futures, CFD, or spot) and a related equity or ETF.
It highlights moments where price and its underlying market drivers disagree, often appearing before reversals or expansions.
🎯 What It Shows
Bullish divergence:
Price makes a lower low while the equity makes a higher low
Bearish divergence:
Price makes a higher high while the equity makes a lower high
Based on swing pivots, not candle noise
Designed for intraday context, not mechanical entries
✅ Recommended Use
XAUUSD (Gold) → GDX (default)
XAGUSD (Silver) → SIL
USOIL / WTI → XLE
(These guidelines are included directly in the indicator settings.)
🧭 How to Use
Apply on 15m–30m
Look for signals near key levels (PDH/PDL, Asia high/low, HTF structure)
Use price action for entries
Divergence is context, not a signal.
⚠️ Notes
Non-repainting
Signals are selective by design
Best during London & New York sessions

Simple PDH / PDL Clean Entries (NZ Time)Simple PDH / PDL Liquidity Entry Indicator
This indicator is designed for clean, stress-free intraday trading on Gold. It identifies high-probability buy and sell opportunities based on a liquidity sweep and reclaim of the previous day’s high or low (PDH / PDL). Signals are limited to one trade per session using New Zealand time, helping prevent overtrading. Each signal prints a clear BUY or SELL icon directly on the candle, along with a concise label showing entry price, stop loss, and take profit. No indicators, no clutter — just key levels, disciplined execution, and institutional-style simplicity.

Liquidity Hunter: Stop Hunts & Volume ClustersStop Hunt Wick Detection
What it catches:
Wicks that are 2x+ larger than the candle body (adjustable)
Minimum wick size to filter out noise
Optional volume confirmation (stops hunts usually have higher volume)
Marks bullish stop hunts (long lower wicks) with 💎 and "BUY LIQ"
Marks bearish stop hunts (long upper wicks) with 💎 and "SELL LIQ"
Extends dashed lines showing where liquidity was grabbed
Volume Cluster Detection
What it tracks:
Bars with volume 1.5x+ above average (adjustable)
Automatically merges nearby clusters within 3 bars
Shows different colors based on volume intensity:
Yellow = 3x+ average volume (extreme)
Orange = 2x+ average volume (strong)
Blue = 1.5x+ average volume (moderate)
Draws horizontal zones showing where volume accumulated
Labels show the volume multiplier (e.g., "VOL: 2.3x")
Adjustable Settings
You can tune:
Wick-to-body ratio threshold
Minimum wick size percentage
Volume confirmation requirements
Cluster sensitivity and merge distance
The theory: Stop hunts grab liquidity above/below key levels, then price reverses. Volume clusters show where institutions accumulated positions. Both mark areas price is likely to revisit.
Try it out and let me know what needs tweaking!

Trend Speed Analyzer with Entries (Zeiierman)📈 Trend Speed Analyzer with Entry Signals (Zeiierman – Modified)
🔹 Overview
This indicator is a trend-following momentum system built around an adaptive (dynamic) moving average and a proprietary trend speed / wave strength engine.
It is designed to identify high-quality continuation entries after price confirms direction, not to predict tops or bottoms.
Best suited for:
Index futures (ES, NQ)
ETFs (SPY, QQQ)
Strongly trending stocks
Intraday or swing trading
🔹 Core Concepts
1️⃣ Dynamic Trend Line (Adaptive EMA)
Instead of using a fixed EMA length, this script dynamically adjusts:
EMA length based on normalized price movement
EMA responsiveness using an accelerator factor
Result:
Fast reaction during strong trends
Smooth behavior during choppy markets
Fewer false flips compared to traditional EMAs
This trend line acts as the primary regime filter.
2️⃣ Trend Speed & Wave Analysis
The indicator tracks trend speed, which represents cumulative directional pressure over time.
It also records:
Bullish wave sizes
Bearish wave sizes
Average vs maximum wave strength
Bull/Bear dominance
These statistics are displayed in an optional table to help assess:
Market bias
Momentum asymmetry
Whether the current move is weak, average, or exceptional
🔹 Entry Signal Logic (One Signal per Trend Shift)
Signals are not spammy.
Only one entry signal is allowed per crossover.
Long Entry Conditions
A long signal is generated when:
Price crosses above the dynamic trend line
A bullish candle forms
The candle body is at least X% of ATR (filters weak/doji candles)
The entire candle body is above the trend line
(Optional) Trend speed is positive
Short Entry Conditions
A short signal is generated when:
Price crosses below the dynamic trend line
A bearish candle forms
The candle body is at least X% of ATR
The entire candle body is below the trend line
(Optional) Trend speed is negative
📌 Once a signal fires, no additional signals will appear until a new crossover occurs.
🔹 What this indicator is NOT
❌ Not a mean-reversion system
❌ Not a prediction tool
❌ Not meant for sideways markets
This tool assumes structure → confirmation → continuation.
🔹 How to Trade It (Suggested Use)
Use higher timeframes (5m–30m) for cleaner signals
Trade in the direction of higher-timeframe bias
Combine with:
VWAP
Key levels (PDH / PDL / PMH / PML)
Market session context
🔹 Customization
Adjust Maximum Length for smoother vs faster trends
Adjust Accelerator Multiplier for sensitivity
Enable/disable speed filter for stricter momentum confirmation
ATR candle filter removes weak signals automatically
⚠️ Disclaimer
This indicator provides technical signals only and does not include trade management, stops, or targets.
Always apply proper risk management.

Reversal Candlestick PatternsReversal Candlestick Patterns
Reversal Candlestick Patterns is an indicator designed to detect classic candlestick reversal patterns with additional market context filtering.
The indicator identifies ten well-known reversal candlestick patterns and displays them directly on the chart as visual blocks. Each pattern is detected using its own logic, based on candle structure, position relative to local extremes, and the direction of the current trend.
Bullish patterns:
> Bullish Engulfing
> Morning Star
> Hammer
> Inverted Hammer
> Three White Soldiers
Bearish patterns:
> Bearish Engulfing
> Evening Star
> Hanging Man
> Shooting Star
> Three Black Crows
Pattern configuration
Detection of each individual pattern, its short name displayed on the chart, and the color of the highlighting block can be configured separately in the first two settings groups:
Bullish Patterns and Bearish Patterns .
This allows you to fully customize which patterns are used, how they are labeled, and how they are visually represented.
Trend filtering
The indicator includes an optional trend filter based on two Simple Moving Averages.
It is enabled using the Check Trend setting. The Trend Detection Length parameter is used simultaneously for several calculations:
> Length of the fast moving average
> Half of the slow moving average length
> Number of consecutive bars required to confirm trend direction
This approach helps filter out reversal patterns that form against a well-established trend.
External filters
The indicator supports external confirmation filters for bullish and bearish patterns. External filter settings are located in the External Filters group. For each filter, you can specify the value of an external indicator that must be met for a pattern to be confirmed. This allows flexible integration with oscillators, volume-based indicators, or custom scripts.
Visualization settings
Visualization settings control:
> Pattern name display
> Text size
> Block fill transparency
These settings affect only the visual presentation and do not influence the detection logic.
Alerts
The indicator provides two types of alerts:
1. Global alert for any detected pattern. Created by selecting “Any alert() function call” when setting up an alert.
2. Dedicated alert conditions for:
> Each individual pattern
> Any bullish pattern
> Any bearish pattern
Please note: if detection of a specific pattern is disabled in the settings, alerts for that pattern will not trigger.
Important note
Candlestick patterns should not be used as standalone trading signals. This indicator is intended to be used as part of a broader analysis, together with trend structure, key levels, volume, and other analytical tools.

FPT - Harami FPT – Harami (Wick Included) is a clean and minimalist candlestick pattern indicator that highlights Harami reversal formations using full candle ranges (wicks included).
This version follows a strict and objective definition of Harami by requiring the entire range of the second candle (high–low) to be fully contained within the range of the first candle.
🔹 Patterns Detected
Bullish Harami
First candle: Bearish
Second candle: Bullish
Second candle’s high and low are completely inside the first candle’s range
Bearish Harami
First candle: Bullish
Second candle: Bearish
Second candle’s high and low are completely inside the first candle’s range
Only the pattern-forming candle (second candle) is highlighted to keep the chart clean and focused.
🎨 Customization
Highlight Bullish, Bearish, or Both Harami patterns
Separate and fully customizable colors for bullish and bearish patterns via Inputs → Colors
Style tab colors are intentionally not used
🎯 Design Philosophy
No indicators
No filters
No assumptions about trend or volatility
This tool is designed for traders who prefer pure price action and want to identify Harami patterns in combination with:
Key levels
Support & resistance
Market structure
Session-based or discretionary analysis
⚠️ This indicator is for visual analysis only and does not provide trade signals.
Always apply proper risk management.

FPT - Dark Cloud & Piercing FPT – Dark Cloud & Piercing (GAP) is a minimalist candlestick pattern indicator designed to highlight classical two-candle reversal formations with strict gap requirements.
This tool focuses purely on price action and avoids unnecessary filters or conditions.
🔹 Patterns Detected
Bullish Piercing Line
First candle: Bearish
Second candle: Bullish
Second candle opens with a gap down
Close penetrates above the midpoint of the first candle’s real body
Does not fully engulf the first candle
Bearish Dark Cloud Cover
First candle: Bullish
Second candle: Bearish
Second candle opens with a gap up
Close penetrates below the midpoint of the first candle’s real body
Does not fully engulf the first candle
Only the pattern-forming candle (second candle) is highlighted to keep the chart clean and readable.
🎨 Customization
Enable Bullish, Bearish, or Both patterns
Fully customizable colors for each pattern via Inputs → Colors
Style tab colors are intentionally not used to avoid confusion
🎯 Design Philosophy
No indicators
No volatility or size filters
No trend assumptions
Just pure candlestick structure, exactly as defined in classical technical analysis.
This indicator is ideal for traders who combine:
Key levels
Supply & demand zones
Market structure
Session-based or discretionary analysis
⚠️ This indicator is a visual tool only and does not provide trade signals by itself.
Always use proper risk management.

[ASFX] Free Automatic VWAPsAutomatic VWAP & Key Levels
Overview
This indicator is designed to help traders evaluate VWAP interactions in context, rather than treating every VWAP touch as a trade opportunity. It combines VWAP with a momentum-based directional filter to highlight situations where price interaction with VWAP is supported by broader intraday momentum. This indicator also shows you the initial balance and opening range each day.
Concept and Originality
VWAP is commonly used as an institutional reference level, but VWAP alone does not distinguish between meaningful acceptance/rejection and random intraday chop. This script addresses that limitation by conditioning VWAP interactions with a momentum filter. Signals are only displayed when price location and momentum alignment occur together, allowing traders to focus on higher-quality VWAP reactions instead of monitoring multiple indicators separately.
How It Works
• VWAP is used as the primary price reference level.
• A momentum filter evaluates directional bias and participation.
• Visual signals appear only when price is interacting with VWAP and momentum confirms acceptance or rejection in the same direction.
• No signals are shown during low-momentum or sideways conditions around VWAP.
How to Use
This indicator is best used as a confirmation tool, not as a standalone trading system. It is intended to assist traders in filtering VWAP-based trade ideas by highlighting when conditions are aligned versus when price is simply chopping around VWAP.
Markets and Timeframes
• Designed for index futures such as ES and NQ
• Optimized for intraday trading
• Works best on lower timeframes (1–5 minute charts)
Limitations
• Not predictive
• Not a complete trading strategy
• Does not replace price action analysis, trade management, or risk control
• Signals should be evaluated alongside market structure and context

Buy / Sell Volume + % (Classic + Pressure)Buy / Sell Volume % (Classic + Pressure)
Overview
Buy / Sell Volume (Classic + Pressure) is a volume decomposition and dominance indicator designed to help traders understand how trading volume is distributed between buying and selling pressure on each candle.
Instead of treating volume as a single number, this indicator splits total volume into estimated Buy Volume and Sell Volume, visualizes them symmetrically, and summarizes dominance using a compact on-chart dashboard.
The indicator is intended as a context and confirmation tool, not a trade signal generator.
Core Concepts
1. Buy / Sell Volume Decomposition
The indicator estimates buying and selling activity based on the position of the close within the candle’s high–low range:
Closes near the high → more buying pressure
Closes near the low → more selling pressure
Middle closes → balanced activity
This provides a clear visual view of demand vs supply on every bar.
2. Dual Calculation Modes
🔹 Classic Mode (Default)
Uses pure candle-range logic
Buy Volume + Sell Volume = Total Volume (exact conservation)
No smoothing or directional bias
Values closely match traditional volume behavior
Best for:
Structural analysis
Accumulation / distribution studies
Comparing against raw volume
🔹 Pressure Mode
Introduces a directional bias:
Bullish candles slightly favor buy volume
Bearish candles slightly favor sell volume
Optional EMA smoothing reduces noise
Still volume-conserving (Buy + Sell = Total Volume)
Best for:
Identifying dominance
Trend continuation confirmation
Absorption vs initiative activity
Visual Elements
Volume Bars
Buy Volume plotted above zero
Sell Volume plotted below zero
Optional Total Volume Envelope for context
Color by Dominance
Bright colors when one side dominates
Faded colors when dominance is weak
Helps instantly identify:
Accumulation
Distribution
Absorption
Dashboard (Optional)
A compact dashboard displays:
Buy %
Sell %
Dominance State
BUY DOM
SELL DOM
BALANCED
The dashboard can be toggled ON/OFF and switched between Normal and Compact size to suit multi-pane layouts.
How to Use This Indicator
This indicator works best as a confirmation layer, not a standalone system.
Common Use Cases
Confirming breakouts or breakdowns
Spotting accumulation or distribution near key levels
Identifying absorption during consolidations
Filtering false price moves
Examples
Price rising + strong Buy % → constructive demand
Price rising + strong Sell % → possible distribution
Flat price + balanced volume → absorption / compression
What This Indicator Is NOT
❌ Not true order-flow or bid/ask data
❌ Not a buy/sell signal generator
❌ Not predictive on its own
All calculations are candle-based estimations, designed for context and insight, not execution timing.
Best Use
Works on all timeframes
Most reliable on liquid instruments
Especially useful when combined with:
Support / resistance
Trend structure
Market regime or breadth indicators
Summary
Buy / Sell Volume (Classic + Pressure) helps traders go beyond raw volume by visualizing who is in control of each candle, how strong that control is, and whether volume behavior supports price action.
Used correctly, it can significantly improve trade selectivity, confidence, and risk awareness.

Daily & Pre-Market Key Levels (v5)Plots:
- Today's high/low
- Pre-market High/Low
- Yesterday's high/low/close
- Day before yesterday high/low

JK Scalp - Nishith RajwarJK Scalp Nishith Rajwar
Multi-Stochastic Rotation & Momentum Scalping Framework
JK Scalp is a rule-based momentum and rotation oscillator designed for short-term scalping and intraday execution.
It focuses on how momentum rotates across multiple stochastic speeds, instead of relying on a single oscillator or lagging averages.
This is an execution aid, not a predictive indicator.
🧠 Concept & Originality
Unlike standard stochastic tools, JK Scalp uses four synchronized stochastic layers:
• Fast (9,3) → execution timing
• Medium (14,3) → structure confirmation
• Slow (44,3) → swing context
• Trend (60,10,10) → dominant momentum regime
The core idea is quad-rotation:
High-probability trades occur when all momentum layers rotate together after reaching an extreme.
This script combines:
• Momentum rotation
• Divergence logic
• Flag continuation logic
• Trend-state filtering
into a single cohesive framework, not a simple indicator mashup.
📊 How to Use (Step-by-Step)
1️⃣ Best Timeframes
• Scalping: 1m – 3m
• Intraday: 5m – 15m
• Avoid higher timeframes (not designed for swing holding)
Works best on:
• Index options
• Index futures
• Highly liquid stocks
• Crypto majors
2️⃣ Understanding the Signals
🔁 Quad Rotation (Core Signal)
A valid rotation requires:
• Fast, Medium, Slow, and Trend stochastic moving in the same direction
• Momentum exiting Overbought / Oversold zones
• Trend stochastic supporting the move
This filters out random oscillator noise.
3️⃣ Entry Conditions
🟢 LONG Setup
• Bullish quad rotation
• Either:
– Bullish divergence OR
– Bullish flag pullback
• Fast stochastic turning up
🔴 SHORT Setup
• Bearish quad rotation
• Either:
– Bearish divergence OR
– Bearish flag pullback
• Fast stochastic turning down
⚠️ Signals are confirmation-based, not anticipatory.
4️⃣ SUPER LONG / SUPER SHORT
These appear only when:
• Quad rotation
• Divergence confirmation
They represent high-confidence momentum inflection zones, not guaranteed reversals.
5️⃣ Stop-Loss Visualization
Optional SL zones are plotted using:
• Recent swing high / low
• ATR-based buffer (configurable)
This helps traders visualize risk, not automate exits.
🎨 Visual System (Why It Looks Different)
• Multi-layer glow effects → momentum strength
• Dynamic cloud → fast vs trend dominance
• Color-shifting fast line → acceleration vs decay
• Chart overlays → execution clarity without clutter
Everything is designed for speed and readability during live trading.
⭐ Unique Selling Points (USP)
✅ Multi-speed stochastic rotation (not single-line signals)
✅ Context-first, not signal spam
✅ Built-in divergence + continuation logic
✅ Non-repainting logic
✅ Designed for scalpers, not hindsight analysis
✅ Works across indices, options, crypto, and futures
⚠️ Important Notes
• Not a standalone trading system
• Best combined with:
– Market structure
– Key levels
– Session timing
• Avoid low-liquidity or news-spike candles
This indicator guides execution, it does not replace discretion.
👤 Who This Is For
• Scalpers & intraday traders
• Options traders needing precise timing
• Traders who understand momentum & structure
• Users who want fewer but higher-quality signals
🏁 Summary
JK Scalp helps you trade momentum rotation, not overbought/oversold myths.
Wait for alignment. Execute with discipline.

Liquidity Vacuum DetectorThis indicator identifies liquidity vacuum zones—price areas where the market previously moved quickly with little resistance. These zones often allow price to travel faster once re-entered, which is favorable for intraday options trading.
Vacuum zones are created during strong, clean impulse moves (large range, low overlap, thin participation). When price later enters a stored vacuum zone with volume expansion, the indicator prints a directional triangle to highlight a potential high-speed move.
Optional filters include VWAP directional bias and regular trading hours (RTH).
Designed as a trade filter and acceleration tool, not a predictive signal.
Best used in combination with key levels (PMH/PML, ORH/ORL, VWAP) and volume confirmation.

Golden hour 1130 1230 Session LinesGolden Hour 11:30–12:30 Session Lines
Overview :
Calculate the session high and low between 11:30 AM and 12:30 PM and mark the lines.
Trading Rule
Once the price breaks either side (high or low), it will continue to move further in that direction.
Session Time : 11:30 AM – 12:30 PM
Key Levels : Session High & Session Low
Strategy : Breakout continuation in the direction of the break

🐋 MACRO POSITION TRADER - Quarterly Alignment 💎Disclaimer: This tool is an alignment filter and educational resource, not financial advice. Backtest and use proper risk management. Past performance does not guarantee future returns.
so the idea behind this one came from an experience i had when i first started learning how to trade. dont laugh at me but i was the guy to buy into those stupid AI get rich quick schemes or the first person to buy the "golden indicator" just to find out that it was a scam. Its also to help traders place trades they can hold for months with high confidence and not have to sit in front of charts all day, and to also scale up quickly with small accounts confidently. and basically what it does is gives an alert once the 3 mo the 6 mo and the 12 mo tfs all align with eachother and gives the option to toggle on or off the 1 mo tf as well for extra confidence. Enter on the 5M–15M after a sweep + CHOCH in the direction of the aligned 1M–12M bias. that simple just continue to keep watching key levels mabey take profit 1-2 weeks and jump back in scaling up if desired..easy way to combine any small account size.
Perfect balance of:
low risk
high R:R
optimal precision
minimal chop
best sweep/CHOCH clarity
hope you guys enjoy this one.

Borna's ZonesBorna's Zones marks two important time-based zones on the chart: the 08:00 zone and the 09:00 zone.
The 08:00 zone identifies initial liquidity. This zone sets the range where early market participants create significant activity.
The 09:00 zone serves as a reference for confirmation. After 09:00, the indicator helps you identify whether the 08:00 zone should be considered cleared.
Both zones are automatically extended until 11:00, providing clear visual references for potential market reactions.
No trading is recommended after 11:00, as the early morning zones lose relevance.
This indicator is useful for traders who focus on pre-market and early session liquidity, helping to visualize key levels where price may react.
