Quant Signals: Econophysics-based MomentumPhysical Momentum Switcher (p0 / p1 / p2 / p3)
This indicator implements a “physical momentum” concept from quantitative finance research, where momentum is defined similarly to physics:
Momentum (p) = Mass × Velocity
Instead of using only the standard cumulative return (classic momentum), it lets you switch between multiple definitions:
p0: Cumulative return over the lookback period (no mass, just price change).
p1: Sum of (mass × velocity) over the lookback period.
p2: Weighted average velocity = (Σ mass×velocity) ÷ (Σ mass).
p3: Sharpe-like momentum = average velocity ÷ volatility (massless).
Velocity can be measured as:
Log return: ln(Pt / Pt-1)
Normal return: (Pt / Pt-1 – 1)
Mass (for p1/p2) can be defined as:
Unit mass (1) — equal weighting, equivalent to traditional momentum.
Turnover proxy — Volume ÷ average volume over k bars.
Value turnover proxy — Dollar volume ÷ average dollar volume.
Inverse volatility — 1 ÷ return volatility over a specified period.
Features:
Switchable momentum definition, velocity type, and mass type.
Adjustable lookback (k) and smoothing period for the signal line.
Optional ±1σ display bands for quick overbought/oversold visual cues.
Alerts for crosses above/below zero or the signal line.
Table display summarizing current settings and values.
Typical uses:
Momentum trading: Buy when PM > 0 (or crosses above the signal), sell/short when PM < 0 (or crosses below).
Contrarian strategies: Reverse the logic when testing mean-reversion effects.
Cross-asset testing: Apply to different instruments to see which PM definition works best.
Recherche dans les scripts pour "momentum"
Squeeze Momentum Indicator Strategy [LazyBear + PineIndicators]The Squeeze Momentum Indicator Strategy (SQZMOM_LB Strategy) is an automated trading strategy based on the Squeeze Momentum Indicator developed by LazyBear, which itself is a modification of John Carter's "TTM Squeeze" concept from his book Mastering the Trade (Chapter 11). This strategy is designed to identify low-volatility phases in the market, which often precede explosive price movements, and to enter trades in the direction of the prevailing momentum.
Concept & Indicator Breakdown
The strategy employs a combination of Bollinger Bands (BB) and Keltner Channels (KC) to detect market squeezes:
Squeeze Condition:
When Bollinger Bands are inside the Keltner Channels (Black Crosses), volatility is low, signaling a potential upcoming price breakout.
When Bollinger Bands move outside Keltner Channels (Gray Crosses), the squeeze is released, indicating an expansion in volatility.
Momentum Calculation:
A linear regression-based momentum value is used instead of traditional momentum indicators.
The momentum histogram is color-coded to show strength and direction:
Lime/Green: Increasing bullish momentum
Red/Maroon: Increasing bearish momentum
Signal Colors:
Black: Market is in a squeeze (low volatility).
Gray: Squeeze is released, and volatility is expanding.
Blue: No squeeze condition is present.
Strategy Logic
The script uses historical volatility conditions and momentum trends to generate buy/sell signals and manage positions.
1. Entry Conditions
Long Position (Buy)
The squeeze just released (Gray Cross after Black Cross).
The momentum value is increasing and positive.
The momentum is at a local low compared to the past 100 bars.
The price is above the 100-period EMA.
The closing price is higher than the previous close.
Short Position (Sell)
The squeeze just released (Gray Cross after Black Cross).
The momentum value is decreasing and negative.
The momentum is at a local high compared to the past 100 bars.
The price is below the 100-period EMA.
The closing price is lower than the previous close.
2. Exit Conditions
Long Exit:
The momentum value starts decreasing (momentum lower than previous bar).
Short Exit:
The momentum value starts increasing (momentum higher than previous bar).
Position Sizing
Position size is dynamically adjusted based on 8% of strategy equity, divided by the current closing price, ensuring risk-adjusted trade sizes.
How to Use This Strategy
Apply on Suitable Markets:
Best for stocks, indices, and forex pairs with momentum-driven price action.
Works on multiple timeframes but is most effective on higher timeframes (1H, 4H, Daily).
Confirm Entries with Additional Indicators:
The author recommends ADX or WaveTrend to refine entries and avoid false signals.
Risk Management:
Since the strategy dynamically sizes positions, it's advised to use stop-losses or risk-based exits to avoid excessive drawdowns.
Final Thoughts
The Squeeze Momentum Indicator Strategy provides a systematic approach to trading volatility expansions, leveraging the classic TTM Squeeze principles with a unique linear regression-based momentum calculation. Originally inspired by John Carter’s method, LazyBear's version and this strategy offer a refined, adaptable tool for traders looking to capitalize on market momentum shifts.

TradFi Fundamentals: Enhanced Macroeconomic Momentum Trading Introduction
The "Enhanced Momentum with Advanced Normalization and Smoothing" indicator is a tool that combines traditional price momentum with a broad range of macroeconomic factors. I introduced the basic version from a research paper in my last script. This one leverages not only the price action of a security but also incorporates key economic data—such as GDP, inflation, unemployment, interest rates, consumer confidence, industrial production, and market volatility (VIX)—to create a comprehensive, normalized momentum score.
Previous indicator
Explanation
In plain terms, the indicator calculates a raw momentum value based on the change in price over a defined lookback period. It then normalizes this momentum, along with several economic indicators, using a method chosen by the user (options include simple, exponential, or weighted moving averages, as well as a median absolute deviation (MAD) approach). Each normalized component is assigned a weight reflecting its relative importance, and these weighted values are summed to produce an overall momentum score.
To reduce noise, the combined momentum score can be further smoothed using a user-selected method.
Signals
For generating trade signals, the indicator offers two modes:
Zero Cross Mode: Signals occur when the smoothed momentum line crosses the zero threshold.
Zone Mode: Overbought and oversold boundaries (which are user defined) provide signals when the momentum line crosses these preset limits.
Definition of the Settings
Price Momentum Settings:
Price Momentum Lookback: The number of days used to compute the percentage change in price (default 50 days).
Normalization Period (Price Momentum): The period over which the price momentum is normalized (default 200 days).
Economic Data Settings:
Normalization Period (Economic Data): The period used to normalize all economic indicators (default 200 days).
Normalization Method: Choose among SMA, EMA, WMA, or MAD to standardize both price and economic data. If MAD is chosen, a multiplier factor is applied (default is 1.4826).
Smoothing Options:
Apply Smoothing: A toggle to enable further smoothing of the combined momentum score.
Smoothing Period & Method: Define the period and type (SMA, EMA, or WMA) used to smooth the final momentum score.
Signal Generation Settings:
Signal Mode: Select whether signals are based on a zero-line crossover or by crossing user-defined overbought/oversold (OB/OS) zones.
OB/OS Zones: Define the upper and lower boundaries (default upper zones at 1.0 and 2.0, lower zones at -1.0 and -2.0) for zone-based signals.
Weights:
Each component (price momentum, GDP, inflation, unemployment, interest rates, consumer confidence, industrial production, and VIX) has an associated weight that determines its contribution to the overall score. These can be adjusted to reflect different market views or risk preferences.
Visual Aspects
The indicator plots the smoothed combined momentum score as a continuous blue line against a dotted zero-line reference. If the Zone signal mode is selected, the indicator also displays the upper and lower OB/OS boundaries as horizontal lines (red for overbought and green for oversold). Buy and sell signals are marked by small labels ("B" for buy and "S" for sell) that appear at the bottom or top of the chart when the score crosses the defined thresholds, allowing traders to quickly identify potential entry or exit points.
Conclusion
This enhanced indicator provides traders with a robust approach to momentum trading by integrating traditional price-based signals with a suite of macroeconomic indicators. Its normalization and smoothing techniques help reduce noise and mitigate the effects of outliers, while the flexible signal generation modes offer multiple ways to interpret market conditions. Overall, this tool is designed to deliver a more nuanced perspective on market momentum.

Adaptive Momentum BaseThe Adaptive Momentum Base, (AMB), is a momentum based indicator which measures the momentum change in the recent candles and changes the colour of bar which it occurred on.
Momentum is used as a confirmation to show that the market may move in favour of your direction if the momentum is present for that direction.
Trade Example:
If you have long/short positions open and the market is moving in your favour, the signal will indicate to hold on to the position for a while has the price action has not been completed.
Script Explained:
AMB works by using the velocity created by the bars during the period of the "lookback" which is then used to formulate the momentum. The momentum is then compared against the previous bars and if a spike in momentum occurs, the indicator will follow to give a signal.

Dual-Frame Momentum OscillatorDual-Frame Momentum Oscillator (DFMO)
This is not just another oscillator. This is a confluence engine, built for the discerning trader who reads the story of price action and needs an objective tool to confirm the climax.
The Dual-Frame Momentum Oscillator was designed to solve a specific problem: how to differentiate a genuine, sustainable breakout from an exhaustive liquidity grab. It provides a visual confirmation for high-probability reversal and scalp setups by measuring momentum across two distinct time frames simultaneously.
This tool is for the trader who understands that indicators should not dictate trades, but rather confirm a well-defined thesis based on market structure, volume, and liquidity.
The Core Concept: Context Meets Trigger
The DFMO fuses a slow, methodical Stochastic with a hyper-sensitive RSI to give you a complete picture of momentum.
The Context (Slow Stochastic %K - default 40,4,4): This acts as your long-term momentum gauge. It tells you if the underlying trend is healthy or nearing exhaustion. A high reading suggests the market is overextended and vulnerable, while a low reading suggests the opposite.
The Trigger (Fast RSI - default 3): This is your immediate impulse reader. It measures the velocity and intensity of the current price thrust, making it incredibly sensitive to exhaustive moves, spikes, and bounces.
By themselves, they are useful. Together, they are formidable.
The Confluence Engine: Your Visual Edge
The true power of the DFMO lies in its "Confluence Engine." The indicator's background highlights in real-time when both oscillators are in agreement, visually flagging moments of maximum opportunity.
Bearish Confluence Zone (Red): The background turns red only when the Stochastic is overbought AND the RSI is overbought. This is your signal that the broader trend is exhausted and the current buying impulse has reached a climax. It is the ideal confirmation for a short entry following a liquidity sweep above a key high.
Bullish Confluence Zone (Green): The background turns green only when the Stochastic is oversold AND the RSI is oversold. This signals that the downtrend is tired and the immediate selling pressure is exhaustive, providing high-probability confirmation for a long entry at a key support level.
When these zones appear, the indicator is telling you that both the context and the trigger are aligned. This removes ambiguity and allows for decisive, confident execution.
Practical Application: The Liquidity Sweep
Imagine you're stalking a short on a futures contract like MCL or MES. You've marked the high of the day (HOD) as a key resistance level where liquidity is resting. You see a sharp, vertical impulse move that breaks the HOD, clearing out the stops.
Is this a real breakout, or is it a manipulation move—a classic liquidity grab?
You glance down at the DFMO. The moment price swept the high, the background flashed red. That's your objective confirmation. The slow Stoch was already overbought, and the fast RSI spiking confirmed the exhaustive, terminal nature of that price thrust. You now have the confidence to enter your short scalp, knowing you are aligned with the probable direction of the market's next move.
This is how you move from "feeling" the market to systematically executing a high-probability edge. This is how you aspire for greatness.
Add the Dual-Frame Momentum Oscillator to your toolkit and transform your ability to time entries with surgical precision.
Advanced Averaged Momentum Indicator (AAMI)Key Features of AAMI:
Combination of Momentum Indicators: It averages normalized values from RSI, MACD histogram, raw Momentum, and Stochastic oscillator to give a comprehensive view of momentum.
Normalization: Each component is normalized to a scale from -1 to 1 to ensure they contribute equally to the AMI calculation.
Visual Cues: The indicator includes visual levels for neutral, overbought, and oversold conditions to aid in quick decision-making.
Alerts: Basic alert conditions are included for when AMI moves into overbought or oversold territory, which traders can customize further.
Customizable: All parameters can be adjusted within TradingView to tailor the indicator to different market conditions or trading strategies.
Smoothing: Included an SMA for AMI to reduce noise and give smoother signals.
Divergence Detection: Implemented a basic divergence detection mechanism to spot potential reversals.
Usage Tips:
Overbought/Oversold: When AMI goes above 0.7, it might suggest an overbought condition, potentially signaling a sell or take profit. Below -0.7 might indicate oversold conditions, suggesting a buy opportunity.
Divergence: Watch for divergences between the AMI and price action for signals of potential trend reversals.
Crossing Zero: The AMI crossing from negative to positive might be used as a buy signal, and vice versa for a sell signal.
This script provides a new way to view momentum by consolidating multiple traditional indicators into one, potentially offering clearer signals in complex market environments.
RSI-ROC Momentum AlertThis is the RSI-ROC Momentum Alert trading indicator, designed to help traders identify potential buy and sell signals based on the momentum of price movements.
The indicator is based on two technical indicators: the Rate of Change (ROC) and the Relative Strength Index (RSI). The ROC measures the speed of price changes over a given period, while the RSI measures the strength of price movements. By combining these two indicators, this trading indicator aims to provide a comprehensive view of the market momentum.
An RSI below its oversold level, which shows as a green background, in addition to a ROC crossing above its moving average (turns green) signals a buying opportunity.
An RSI above its overbought level, which shows as a red background, in addition to a ROC crossing below its moving average (turns red) signals a selling opportunity.
Traders can use this indicator to identify potential momentum shifts and adjust their trading strategies accordingly.
The ROC component of the indicator uses a user-defined length parameter to calculate the ROC and a simple moving average (SMA) of the ROC. The color of the ROC line changes to green when it is above the ROC SMA and to red when it is below the ROC SMA. The ROC SMA color changes whether it's above or below a value of 0.
The RSI component of the indicator uses a user-defined length parameter to calculate the RSI, and user-defined RSI Low and RSI High values to identify potential buy and sell signals. When the RSI falls below the RSI Low value, a green background color is applied to the chart to indicate a potential buy signal. Conversely, when the RSI rises above the RSI High value, a red background color is applied to the chart to indicate a potential sell signal.
This indicator is intended to be used on any time frame and any asset, and can be customized at will.

Market momentum catcherIs a tool used to catch market momentum. If the color is green it means the bulls are in momentum or the prices will continue to increase, if the color is red it means the bears are in momentum or the prices will continue to decrease and gray color means the market is consolidating.
This tool is made from moving averages and RSI.
You can place a buy order when the color is green, you can place a sell order when the color is red and if the color is gray do not trade.

Point and Figure (PnF) MomentumThis is live and non-repainting Point and Figure Chart Momentum tool. The script has it’s own P&F engine and not using integrated function of Trading View.
Point and Figure method is over 150 years old. It consist of columns that represent filtered price movements. Time is not a factor on P&F chart but as you can see with this script P&F chart created on time chart.
P&F chart provide several advantages, some of them are filtering insignificant price movements and noise, focusing on important price movements and making support/resistance levels much easier to identify.
Momentum indicator measures the rate of change or speed of price movement. It compares the current price with the previous price from a number of periods ago. By analysing the rate of change , possible to gauge the strength or “momentum”. By using this script we get Point and Figure chart momentum.
If you are new to Point & Figure Chart then you better get some information about it before using this tool. There are very good web sites and books. Please PM me if you need help about resources.
Options in the Script
Box size is one of the most important part of Point and Figure Charting. Chart price movement sensitivity is determined by the Point and Figure scale. Large box sizes see little movement across a specific price region, small box sizes see greater price movement on P&F chart. There are four different box scaling with this tool: Traditional, Percentage, Dynamic (ATR), or User-Defined
4 different methods for Box size can be used in this tool.
User Defined: The box size is set by user. A larger box size will result in more filtered price movements and fewer reversals. A smaller box size will result in less filtered price movements and more reversals.
ATR: Box size is dynamically calculated by using ATR, default period is 20.
Percentage: uses box sizes that are a fixed percentage of the stock's price. If percentage is 1 and stock’s price is $100 then box size will be $1
Traditional: uses a predefined table of price ranges to determine what the box size should be.
Price Range Box Size
Under 0.25 0.0625
0.25 to 1.00 0.125
1.00 to 5.00 0.25
5.00 to 20.00 0.50
20.00 to 100 1.0
100 to 200 2.0
200 to 500 4.0
500 to 1000 5.0
1000 to 25000 50.0
25000 and up 500.0
Default value is “ATR”, you may use one of these scaling method that suits your trading strategy.
If ATR or Percentage is chosen then there is rounding algorithm according to mintick value of the security. For example if mintick value is 0.001 and box size (ATR/Percentage) is 0.00124 then box size becomes 0.001.
And also while using dynamic box size (ATR or Percentage), box size changes only when closing price changed.
Reversal : It is the number of boxes required to change from a column of Xs to a column of Os or from a column of Os to a column of Xs. Default value is 3 (most used). For example if you choose reversal = 2 then you get the chart similar to Renko chart.
Source: Closing price or High-Low prices can be chosen as data source for P&F charting.
There is 2 options for P&F Momentum
Length: Length for the P&F Momentum, default value is 10
Display as: there are two options and can display as “Histogram” or “Line”

US Market Long Horizon Momentum Summary in one paragraph
US Market Long Horizon Momentum is a trend following strategy for US index ETFs and futures built around a single eighteen month time series momentum measure. It helps you stay long during persistent bull regimes and step aside or flip short when long term momentum turns negative.
Scope and intent
• Markets. Large cap US equity indices, liquid US index ETFs, index futures
• Timeframes. 4h/ Daily charts
• Default demo used in the publication. SPY on 4h timeframe chart
• Purpose. Provide a minimal long bias index timing model that can reduce deep drawdowns and capture major cycles without parameter mining
• Limits. This is a strategy. Orders are simulated on standard candles only
Originality and usefulness
• Unique concept or fusion. One unscaled multiple month log return of an external benchmark symbol drives all entries and exits, with optional volatility targeting as a single risk control switch.
• Failure mode addressed. Fully passive buy and hold ignores the sign of long horizon momentum and can sit through multi year drawdowns. This script offers a way to step down risk in prolonged negative momentum without chasing short term noise.
• Testability. All parameters are visible in Inputs and the momentum series is plotted so users can verify every regime change in the Tester and on price history.
• Portable yardstick. The log return over a fixed window is a unit that can be applied to any liquid symbol with daily data.
Method overview in plain language
The method looks at how far the benchmark symbol has moved in log return terms over an eighteen month window in our example. If that long horizon return is positive the strategy allows a long stance on the traded symbol. If it is negative and shorts are enabled the strategy can flip short, otherwise it goes flat. There is an optional realised volatility estimate on the traded symbol that can scale position size toward a target annual volatility, but in the default configuration the model uses unit leverage and only the sign of momentum matters.
Base measures
Return basis. The core yardstick is the natural log of close divided by the close eighteen months ago on the benchmark symbol. Daily log returns of the traded symbol feed the realised volatility estimate when volatility targeting is enabled.
Components
• Component one Momentum eighteen months. Log of benchmark close divided by its close mom_lookback bars ago. Its sign defines the trend regime. No extra smoothing is applied beyond the long window itself.
• Component two Realised volatility optional. Standard deviation of daily log returns on the traded symbol over sixty three days. Annualised by the square root of 252. Used only when volatility targeting is enabled.
• Optional component Volatility targeting. Converts target annual volatility and realised volatility into a leverage factor clipped by a maximum leverage setting.
Fusion rule
The model uses a simple gate. First compute the sign of eighteen month log momentum on the benchmark symbol. Optionally compute leverage from volatility. The sign decides whether the strategy wants to be long, short, or flat. Leverage only rescales position size when enabled and does not change direction.
Signal rule
• Long suggestion. When eighteen month log momentum on the benchmark symbol is greater than zero, the strategy wants to be long.
• Short suggestion. When that log momentum is less than zero and shorts are allowed, the strategy wants to be short. If shorts are disabled it stays flat instead.
• Wait state. When the log momentum is exactly zero or history is not long enough the strategy stays flat.
• In position. In practice the strategy sits IN LONG while the sign stays positive and flips to IN SHORT or flat only when the sign changes.
Inputs with guidance
Setup
• Momentum Lookback (months). Controls the horizon of the log return on the benchmark symbol. Typical range 6 to 24 months. Raising it makes the model slower and more selective. Lowering it makes it more reactive and sensitive to medium term noise.
• Symbol. External symbol used for the momentum calculation, SPY by default. Changing it lets you time other indices or run signals from a benchmark while trading a correlated instrument.
Logic
• Allow Shorts. When true the strategy will open short positions during negative momentum regimes. When false it will stay flat whenever momentum is negative. Practical setting is tied to whether you use a margin account or an ETF that supports shorting.
Internal risk parameters (not exposed as inputs in this version) are:
• Target Vol (annual). Target annual volatility for volatility targeting, default 0.2.
• Vol Lookback (days). Window for realised volatility, default 63 trading days.
• Max Leverage. Cap on leverage when volatility targeting is enabled, default 2.
Usage recipes
Swing continuation
• Signal timeframe. Use the daily chart.
• Benchmark symbol. Leave at SPY for US equity index exposure.
• Momentum lookback. Eighteen months as a default, with twelve months as an alternative preset for a faster swing bias.
Properties visible in this publication
• Initial capital. 100000
• Base currency. USD
• Default order size method. 5% of the total capital in this example
• Pyramiding. 0
• Commission. 0.03 percent
• Slippage. 3 ticks
• Process orders on close. On
• Bar magnifier. Off
• Recalculate after order is filled. Off
• Calc on every tick. Off
• All request.security calls use lookahead = barmerge.lookahead_off
Realism and responsible publication
The strategy is for education and research only. It does not claim any guaranteed edge or future performance. All results in Strategy Tester are hypothetical and depend on the data vendor, costs, and slippage assumptions. Intrabar motion is not modeled inside daily bars so extreme moves and gaps can lead to fills that differ from live trading. The logic is built for standard candles and should not be used on synthetic chart types for execution decisions.
Performance is sensitive to regime structure in the US equity market, which may change over time. The strategy does not protect against single day crash risk inside bars and does not model gap risk explicitly. Past behavior of SPY and the momentum effect does not guarantee future persistence.
Honest limitations and failure modes
• Long sideways regimes with small net change over eighteen months can lead to whipsaw around the zero line.
• Very sharp V shaped reversals after deep declines will often be missed because the model waits for momentum to turn positive again.
• The sample size in a full SPY history is small because regime changes are infrequent, so any test must be interpreted as indicative rather than statistically precise.
• The model is highly dependent on the chosen lookback. Users should test nearby values and validate that behavior is qualitatively stable.
Legal
Education and research only. Not investment advice. You are responsible for your own decisions. Always test on historical data and in simulation with realistic costs before any live use.

Hash Momentum IndicatorHash Momentum Indicator
Overview
The Hash Momentum Indicator provides real-time momentum-based trading signals with visual entry/exit markers and automatic risk management levels. This is the indicator version of the popular Hash Momentum Strategy, designed for traders who want signal alerts without backtesting functionality.
Perfect for: Live trading, automation via alerts, multi-indicator setups, and clean chart visualization.
What Makes This Indicator Special
1. Pure Momentum-Based Signals
Captures price acceleration in real-time - not lagging moving average crossovers. Enters when momentum exceeds a dynamic ATR-based threshold, catching moves as they begin accelerating.
2. Automatic Risk Management Visualization
Every signal automatically displays:
Entry level (white dashed line)
Stop loss level (red line)
Take profit target (green line)
Partial TP levels (dotted green lines)
3. Smart Trade Management
Trade Cooldown: Prevents overtrading by enforcing waiting period between signals
EMA Trend Filter: Only trades with the trend (optional)
Session Filters: Trade only during Tokyo/London/New York sessions (optional)
Weekend Toggle: Avoid low-liquidity weekend periods (optional)
4. Clean Visual Design
🟢 Tiny green dot = Long entry signal
🔴 Tiny red dot = Short entry signal
🔵 Blue X = Long exit
🟠 Orange X = Short exit
No cluttered labels or dashboard - just clean signals
5. Professional Alerts Ready
Set up TradingView alerts for:
Long signals
Short signals
Long exits
Short exits
How It Works
Step 1: Calculate Momentum
Momentum = Current Price - Price
Normalized by standard deviation for consistency
Must exceed ATR × Threshold to trigger
Step 2: Confirm Acceleration
Momentum must be increasing (positive momentum change)
Price must be moving in signal direction
Step 3: Apply Filters
EMA Filter: Long only above EMA, short only below EMA (if enabled)
Session Filter: Check if in allowed trading session (if enabled)
Weekend Filter: Block signals on Sat/Sun (if enabled)
Cooldown: Ensure minimum bars passed since last signal
Step 4: Generate Signal
All conditions met = Entry signal fires
Lines automatically drawn for entry, stop, and targets
Step 5: Exit Detection
Opposite momentum detected = Exit signal
Stop loss or take profit hit = Exit signal
Lines removed from chart
⚙️ Settings Guide
Core Strategy
Momentum Length (Default: 13)
Number of bars for momentum calculation. Higher values = stronger signals but fewer trades.
Aggressive: 10
Balanced: 13
Conservative: 18-24
Momentum Threshold (Default: 2.25)
ATR multiplier for signal generation. Higher values = only trade the biggest momentum moves.
Aggressive: 2.0
Balanced: 2.25
Conservative: 2.5-3.0
Risk:Reward Ratio (Default: 2.5)
Your target profit as a multiple of your risk. With 2.2% stop and 2.5 R:R, your target is 5.5% profit.
Conservative: 3.0+ (need 25% win rate to profit)
Balanced: 2.5 (need 29% win rate to profit)
Aggressive: 2.0 (need 33% win rate to profit)

(OFPI) Order Flow Polarity Index - Momentum Gauge (DAFE) (OFPI) Order Flow Polarity Index - Momentum Gauge: Decode Market Aggression
The (OFPI) Gauge Bar is your front-row seat to the battle between buyers and sellers. This isn’t just another indicator—it’s a momentum tracker that reveals market aggression through a sleek, centered gauge bar and a smart dashboard. Built for traders who want clarity without clutter, it’s your edge for spotting who’s driving price, bar by bar.
What Makes It Unique?
Order Flow Pressure Index (OFPI): Splits volume into buy vs. sell pressure based on candle body position. It’s not just volume—it’s intent, showing who’s got the upper hand.
T3 Smoothing Magic: Uses a Tilson T3 moving average to keep signals smooth yet responsive. No laggy SMA nonsense here.
Centered Gauge Bar: A 20-segment bar splits bullish (lime) and bearish (red) momentum around a neutral center. Empty segments scream indecision—it’s like a visual heartbeat of the market.
Momentum Shift Alerts: Catches reversals with “Momentum Shift” flags when the OFPI crests, so you’re not caught off guard.
Clean Dashboard: A compact, bottom-left table shows momentum status, the gauge bar, and the OFPI value. Color-coded, transparent, and no chart clutter.
Inputs & Customization
Lookback Length (default 10): Set the window for pressure calculations. Short for scalps, long for trends.
T3 Smoothing Length (default 5): Tune the smoothness. Tight for fast markets, relaxed for chill ones.
T3 Volume Factor (default 0.7): Crank it up for snappy signals or down for silky trends.
Toggle the dashboard for minimalist setups or mobile trading.
How to Use It
Bullish Momentum (Lime, Right-Filled): Buyers are flexing. Look for breakouts or trend continuations. Pair with support levels.
Bearish Momentum (Red, Left-Filled): Sellers are in charge. Scout for breakdowns or shorts. Check resistance zones.
Neutral (Orange, Near Center): Market’s chilling. Avoid big bets—wait for a breakout or play the range.
Momentum Shift: A reversal might be brewing. Confirm with price action before jumping in.
Not a Solo Act: Combine with your strategy—trendlines, RSI, whatever. It’s a momentum lens, not a buy/sell bot.
Why Use the OFPI Gauge?
See the Fight: Most tools just count volume. OFPI shows who’s winning with a visual that slaps.
Works Anywhere: Crypto, stocks, forex, any timeframe. Tune it to your style.
Clean & Pro: No chart spam, just a sharp gauge and a dashboard that delivers.
Unique Edge: No other indicator blends body-based pressure, T3 smoothing, and a centered gauge like this.
The OFPI Gauge catches the market’s pulse so you can trade with confidence. It’s not about predicting the future—it’s about knowing who’s in control right now.
For educational purposes only. Not financial advice. Always use proper risk management.
Use with discipline. Trade your edge.
— Dskyz , for DAFE Trading Systems

Uptrick: Momentum-Volatility Composite Signal### Title: Uptrick: Momentum-Volatility Composite Signal
### Overview
The "Uptrick: Momentum-Volatility Composite Signal" is an innovative trading tool designed to offer traders a sophisticated synthesis of momentum, volatility, volume flow, and trend detection into a single comprehensive indicator. This tool stands out by providing an integrated view of market dynamics, which is critical for identifying potential trading opportunities with greater precision and confidence. Its unique approach differentiates it from traditional indicators available on the TradingView platform, making it a valuable asset for traders aiming to enhance their market analysis.
### Unique Features
This indicator integrates multiple crucial elements of market behavior:
- Momentum Analysis : Utilizes Rate of Change (ROC) metrics to assess the speed and strength of market movements.
- Volatility Tracking : Incorporates Average True Range (ATR) metrics to measure market volatility, aiding in risk assessment.
- Volume Flow Analysis : Analyzes shifts in volume to detect buying or selling pressure, adding depth to market understanding.
- Trend Detection : Uses the difference between short-term and long-term Exponential Moving Averages (EMA) to detect market trends, providing insights into potential reversals or confirmations.
Customization and Inputs
The Uptrick indicator offers a variety of user-defined settings tailored to fit different trading styles and strategies, enhancing its adaptability across various market conditions:
Rate of Change Length (rocLength) : This setting defines the period over which momentum is calculated. Shorter periods may be preferred by day traders who need to respond quickly to market changes, while longer periods could be better suited for position traders looking at more extended trends.
ATR Length (atrLength) : Adjusts the timeframe for assessing volatility. A shorter ATR length can help day traders manage the quick shifts in market volatility, whereas longer lengths might be more applicable for swing or position traders who deal with longer-term market movements.
Volume Flow Length (volumeFlowLength): Determines the analysis period for volume flow to identify buying or selling pressure. Day traders might opt for shorter periods to catch rapid volume changes, while longer periods could serve swing traders to understand the accumulation or distribution phases better.
Short EMA Length (shortEmaLength): Specifies the period for the short-term EMA, crucial for trend detection. Shorter lengths can aid day traders in spotting immediate trend shifts, whereas longer lengths might help swing traders in identifying more sustainable trend changes.
Long EMA Length (longEmaLength): Sets the period for the long-term EMA, which is useful for observing longer-term market trends. This setting is particularly valuable for position traders who need to align with the broader market direction.
Composite Signal Moving Average Length (maLength): This parameter sets the smoothing period for the composite signal's moving average, helping to reduce noise in the signal output. A shorter moving average length can be beneficial for day traders reacting to market conditions swiftly, while a longer length might help swing and position traders in smoothing out less significant fluctuations to focus on significant trends.
These customization options ensure that traders can fine-tune the Uptrick indicator to their specific trading needs, whether they are scanning for quick opportunities or analyzing more prolonged market trends.
### Functionality Details
The indicator operates through a sophisticated algorithm that integrates multiple market dimensions:
1. Momentum and Volatility Calculation : Combines ROC and ATR to gauge the market’s momentum and stability.
2. Volume and Trend Analysis : Integrates volume data with EMAs to provide a comprehensive view of current market trends and potential shifts.
3. Signal Composite : Each component is normalized and combined into a composite signal, offering traders a nuanced perspective on when to enter or exit trades.
The indicator performs its calculations as follows:
Momentum and Volatility Calculation:
roc = ta.roc(close, rocLength)
atr = ta.atr(atrLength)
Volume and Trend Analysis:
volumeFlow = ta.cum(volume) - ta.ema(ta.cum(volume), volumeFlowLength)
emaShort = ta.ema(close, shortEmaLength)
emaLong = ta.ema(close, longEmaLength)
emaDifference = emaShort - emaLong
Composite Signal Calculation:
Normalizes each component (ROC, ATR, volume flow, EMA difference) and combines them into a composite signal:
rocNorm = (roc - ta.sma(roc, rocLength)) / ta.stdev(roc, rocLength)
atrNorm = (atr - ta.sma(atr, atrLength)) / ta.stdev(atr, atrLength)
volumeFlowNorm = (volumeFlow - ta.sma(volumeFlow, volumeFlowLength)) / ta.stdev(volumeFlow, volumeFlowLength)
emaDiffNorm = (emaDifference - ta.sma(emaDifference, longEmaLength)) / ta.stdev(emaDifference, longEmaLength)
compositeSignal = (rocNorm + atrNorm + volumeFlowNorm + emaDiffNorm) / 4
### Originality
The originality of the Uptrick indicator lies in its ability to merge diverse market metrics into a unified signal. This multi-faceted approach goes beyond traditional indicators by offering a deeper, more holistic analysis of market conditions, providing traders with insights that are not only based on price movements but also on underlying market dynamics.
### Practical Application
The Uptrick indicator excels in environments where understanding the interplay between volume, momentum, and volatility is crucial. It is especially useful for:
- Day Traders : Can leverage real-time data to make quick decisions based on sudden market changes.
- Swing Traders : Benefit from understanding medium-term trends to optimize entry and exit points.
- Position Traders : Utilize long-term market trend data to align with overall market movements.
### Best Practices
To maximize the effectiveness of the Uptrick indicator, consider the following:
- Combine with Other Indicators : Use alongside other technical tools like RSI or MACD for additional validation.
- Adapt Settings to Market Conditions : Adjust the indicator settings based on the asset and market volatility to improve signal accuracy.
- Risk Management : Implement robust risk management strategies, including setting stop-loss orders based on the volatility measured by the ATR.
### Practical Examples and Demonstrations
- Example for Day Trading : In a volatile market, a trader notices a sharp increase in the momentum score coinciding with a surge in volume but stable volatility, signaling a potential bullish breakout.
- Example for Swing Trading : On a 4-hour chart, the indicator shows a gradual alignment of decreasing volatility and increasing buying volume, suggesting a strengthening upward trend suitable for a long position.
### Alerts and Their Uses
- Alert Configurations : Set alerts for when the composite score crosses predefined thresholds to capture potential buy or sell events.
- Strategic Application : Use alerts to stay informed of significant market moves without the need to continuously monitor the markets, enabling timely and informed trading decisions.
Technical Notes
Efficiency and Compatibility: The indicator is designed for efficiency, running smoothly across different trading platforms including TradingView, and can be easily integrated with existing trading setups. It leverages advanced mathematical models for normalizing and smoothing data, ensuring consistent and reliable signal quality across different market conditions.
Limitations : The effectiveness of the Uptrick indicator can vary significantly across different market conditions and asset classes. It is designed to perform best in liquid markets where data on volume, volatility, and price trends are readily available and reliable. Traders should be aware that in low-liquidity or highly volatile markets, the signals might be less reliable and require additional confirmation.
Usage Recommendations : While the Uptrick indicator is a powerful tool, it is recommended to use it in conjunction with other analysis methods to confirm signals. Traders should also continuously monitor the performance and adjust settings as needed to align with their specific trading strategies and market conditions.
### Conclusion
The "Uptrick: Momentum-Volatility Composite Signal" is a revolutionary tool that offers traders an advanced methodology for analyzing market dynamics. By combining momentum, volatility, volume, and trend detection into a single, cohesive indicator, it provides a powerful, actionable insight into market movements, making it an indispensable tool for traders aiming to optimize their trading strategies.

Composite Momentum█ Introduction
The Composite Momentum Indicator is a tool we came across that we found to be useful at detecting implied tops and bottoms within quick market cycles. Its approach to analyzing momentum through a combination of moving averages and summation techniques makes it a useful addition to the range of available indicators on TradingView.
█ How It Works
This indicator operates by calculating the difference between two moving averages—one fast and one slow, which can be customized by the user. The difference between these two averages is then expressed as a percentage of the fast moving average, forming the core momentum value which is then smoothed with an Exponential Moving Average is applied. The smoothed momentum is then compared across periods to identify directional changes in direction
Furthermore, the script calculates the absolute differences between consecutive momentum values. These differences are used to determine periods of momentum acceleration or deceleration, aiming to establish potential reversals.
In addition to tracking momentum changes, the indicator sums positive and negative momentum changes separately over a user-defined period. This summation is intended to provide a clearer picture of the prevailing market bias—whether it’s leaning towards strength or weakness.
Finally, the summed-up values are normalized to a percentage scale. This normalization helps in identifying potential tops and bottoms by comparing the relative strength of the momentum within a given cycle.
█ Usage
This indicator is primarily useful for traders who focus on detecting quick cycle tops and bottoms. It provides a view of momentum shifts that can signal these extremes, though it’s important to use it in conjunction with other tools and market analysis techniques. Given its ability to highlight potential reversals, it may be of interest to those who seek to understand short-term market dynamics.
█ Disclaimer
This script was discovered without any information about its author or original intent but was nonetheless ported from its original format that is available publicly. It’s provided here for educational purposes and should not be considered a guaranteed method for market analysis. Users are encouraged to test and understand the indicator thoroughly before applying it in real trading scenarios.
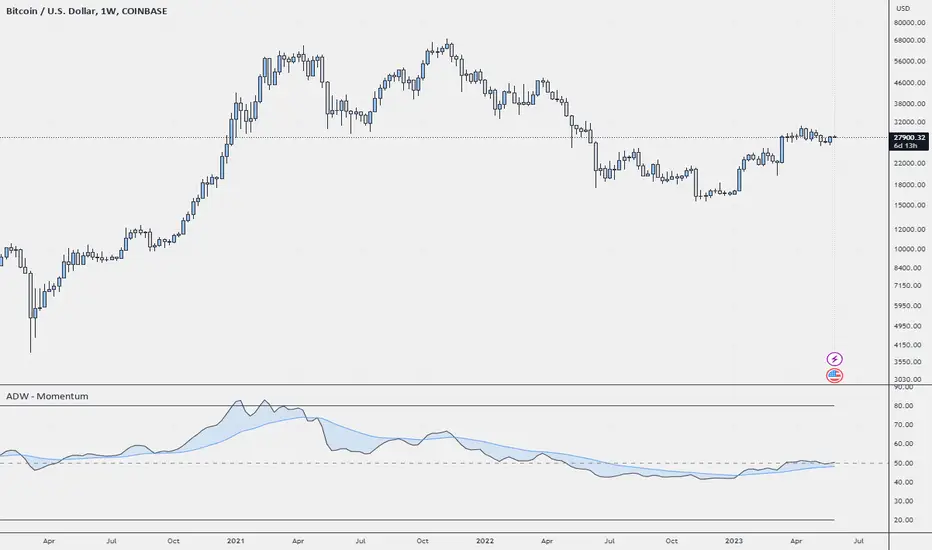
ADW - MomentumADW - Momentum is a trading indicator based on the Relative Momentum Index (RMI) and Exponential Moving Averages (EMAs). This indicator plots the RMI along with its EMAs and highlights regions where RMI crosses its slow EMA. Additionally, it provides alerts when the momentum flips bullish or bearish.
Key Features:
The RMI helps to identify momentum in the market.
Three EMAs (Fast, Standard, and Slow) were calculated on the RMI. These can be utilized to analyze the momentum trend over different periods.
Highlighted regions and colour coding to indicate when RMI crosses its Slow EMA, signalling potential momentum shifts.
Customizable parameters: Users can specify the lengths of the RMI and EMAs, boundaries for RMI, and colours for various components of the plot.
Alerts: The script can alert users when the momentum has flipped bullish or bearish.
The script is organized into several sections:
Inputs: The user can customize several parameters including the RMI averaging length, momentum lookback, RMI boundaries, and the EMA lengths. In addition, users can also specify the colours for the RMI line, Slow EMA line, and the fill colour.
RMI Calculation: The script calculates the RMI based on the user-provided length and momentum lookback. This is done by first calculating two EMAs - one for the positive differences between closing prices (emaInc), and one for the negative differences (emaDec). Then, the RMI is computed using these EMAs.
Plotting: The script plots the RMI line, Slow EMA line, and two horizontal lines indicating the RMI boundaries. In addition, it also fills the region between the RMI and Slow EMA lines.
Conditions: The script computes the conditions for bullish and bearish momentum flips. These are defined as when the RMI crosses above or below the Slow EMA respectively.
Alerts: Finally, the script sets up two alert conditions based on the bullish and bearish conditions. These alert the user when the momentum has flipped bullish or bearish, with a message that includes the current RMI value.
Momentum Ratio Oscillator [Loxx]What is Momentum Ratio Oscillator?
The theory behind this indicator involves utilizing a sequence of exponential moving average (EMA) calculations to achieve a smoother value of momentum ratio, which compares the current value to the previous one. Although this results in an outcome similar to that of some pre-existing indicators (such as volume zone or price zone oscillators), the use of EMA for smoothing is what sets it apart. EMA produces a smooth step-like output when values undergo sudden changes, whereas the mathematics used for those other indicators are completely distinct. This is a concept by the beloved Mladen of FX forums.
To utilize this version of the indicator, you have the option of using either levels, middle, or signal crosses for signals. The indicator is range bound from 0 to 1.
What is an EMA?
EMA stands for Exponential Moving Average, which is a type of moving average that is commonly used in technical analysis to smooth out price data and identify trends.
In a simple moving average (SMA), each data point is given equal weight when calculating the average. For example, if you are calculating the 10-day SMA, you would add up the prices for the past 10 days and divide by 10 to get the average. In contrast, in an EMA, more weight is given to recent prices, while older prices are given less weight.
The formula for calculating an EMA involves using a smoothing factor that is multiplied by the difference between the current price and the previous EMA value, and then adding this to the previous EMA value. The smoothing factor is typically calculated based on the length of the EMA being used. For example, a 10-day EMA might use a smoothing factor of 2/(10+1) or 0.1818.
The result of using an EMA is that the line produced is more responsive to recent price changes than a simple moving average. This makes it useful for identifying short-term trends and potential trend reversals. However, it can also be more volatile and prone to whipsaws, so it is often used in combination with other indicators to confirm signals.
Overall, the EMA is a widely used and versatile tool in technical analysis, and its effectiveness depends on the specific context in which it is applied.
What is Momentum?
In technical analysis, momentum refers to the rate of change of an asset's price over a certain period of time. It is often used to identify trends and potential trend reversals in financial markets.
Momentum is calculated by subtracting the closing price of an asset X days ago from its current closing price, where X is the number of days being used for the calculation. The result is the momentum value for that particular day. A positive momentum value suggests that prices are increasing, while a negative value indicates that prices are decreasing.
Traders use momentum in a variety of ways. One common approach is to look for divergences between the momentum indicator and the price of the asset being traded. For example, if an asset's price is trending upwards but its momentum is trending downwards, this could be a sign of a potential trend reversal.
Another popular strategy is to use momentum to identify overbought and oversold conditions in the market. When an asset's price has been rising rapidly and its momentum is high, it may be considered overbought and due for a correction. Conversely, when an asset's price has been falling rapidly and its momentum is low, it may be considered oversold and due for a bounce back up.
Momentum is also often used in conjunction with other technical indicators, such as moving averages or Bollinger Bands, to confirm signals and improve the accuracy of trading decisions.
Overall, momentum is a useful tool for traders and investors to analyze price movements and identify potential trading opportunities. However, like all technical indicators, it should be used in conjunction with other forms of analysis and with consideration of the broader market context.
Extras
Alerts
Signals
Loxx's Expanded Source Types, see here for details

Multi-Oscillator Adaptive Kernel with MomentumMulti-Oscillator Adaptive Kernel w. Momentum
An adaptation of the indicator by AlphaAlgos : Multi-Oscillator-Adaptive-Kernel (MOAK) with Divergence . Please find the description of the indicator in the above link.
Apart from adding labels to show trend/momentum changes, the following changes have been made to the original script:
1. Sensitivity is used in the computation to scale the fast MOAK signal,
2. Selection between two indicator modes:
Trending - (the original script method) assesses whether smoothed MOAK is above/below 0 - for up/down trends respectively.
Momentum - assesses whether the fast MOAK signal is above/below the smoothed MOAK, and can be used to indicate potential trend reversals as momentum of current trend fades.
Institutional Momentum Scanner [IMS]Institutional Momentum Scanner - Professional Momentum Detection System
Hunt explosive price movements like the professionals. IMS identifies maximum momentum displacement within 10-bar windows, revealing where institutional money commits to directional moves.
KEY FEATURES:
▪ Scans for strongest momentum in rolling 10-bar windows (institutional accumulation period)
▪ Adaptive filtering reduces false signals using efficiency ratio technology
▪ Three clear states: LONG (green), SHORT (red), WAIT (gray)
▪ Dynamic volatility-adjusted thresholds (8% ATR-scaled)
▪ Visual momentum flow with glow effects for signal strength
BASED ON:
- Pocket Pivot concept (O'Neil/Morales) applied to price momentum
- Adaptive Moving Average principles (Kaufman KAMA)
- Market Wizards momentum philosophy
- Institutional order flow patterns (5-day verification window)
HOW IT WORKS:
The scanner finds the maximum price displacement in each 10-bar window - where the market showed its hand. An adaptive filter (5-bar regression) separates real moves from noise. When momentum exceeds the volatility-adjusted threshold, states change.
IDEAL FOR:
- Momentum traders seeking explosive moves
- Swing traders (especially 4H timeframe)
- Position traders wanting institutional footprints
- Anyone tired of false breakout signals
Default parameters (10,5) optimized for 4H charts but adaptable to any timeframe. Remember: The market rewards patience and punishes heroes. Wait for clear signals.
"The market is honest. Are you?"

BTC Momentum Detector 1h# BTC Momentum Detector 1h
This indicator is designed to detect significant momentum movements in Bitcoin price on the 1-hour timeframe. It identifies candles with percentage changes within a specific range, which often precede larger price movements.
## How It Works
The indicator analyzes price movements to detect potential momentum shifts:
- Identifies candles with percentage changes between configurable thresholds (default: 1.7% - 2.8%)
- Requires neutral or inverse movement in the prior candle to avoid false signals
- Optional volume filter ensures signals are confirmed by above-average trading activity
- Tracks price continuation to calculate success rates and average returns
## Key Features
- **Signal Detection**: Green triangles below price bars indicate upward momentum signals; red triangles above price bars indicate downward momentum signals
- **Continuation Tracking**: Dashed horizontal lines show the entry price levels of active signals being tracked
- **Statistics Panel**: Displays real-time metrics including signal counts, success rates, and average returns
- **Current Status**: Shows the current price change percentage and active signals being monitored
## Parameters
- **Minimum Percentage Threshold**: Minimum price change to trigger a signal (default: 1.7%)
- **Maximum Percentage Threshold**: Maximum price change to filter out extreme moves (default: 2.8%)
- **Continuation Periods**: Number of periods to track after signal (default: 2)
- **Require Prior Neutral/Inverse**: Filters signals by requiring neutral or opposite prior movement
- **Neutral Threshold**: Defines what's considered a neutral movement (default: 0.1%)
- **Volume Filter**: Option to require above-average volume for confirmation
- **Volume Multiplier**: Volume must exceed average by this factor (default: 2x)
## Strategy Concept
The underlying strategy is based on the concept that when Bitcoin makes a controlled, significant move (not too small, not too large) after a period of neutral or opposite movement, it often continues in that direction for the next few periods. This pattern reflects the early stages of momentum development in the market.

BTCUSD Momentum After Abnormal DaysThis indicator identifies abnormal days in the Bitcoin market (BTCUSD) based on daily returns exceeding specific thresholds defined by a statistical approach. It is inspired by the findings of Caporale and Plastun (2020), who analyzed the cryptocurrency market's inefficiencies and identified exploitable patterns, particularly around abnormal returns.
Key Concept:
Abnormal Days:
Days where the daily return significantly deviates (positively or negatively) from the historical average.
Positive abnormal days: Returns exceed the mean return plus k times the standard deviation.
Negative abnormal days: Returns fall below the mean return minus k times the standard deviation.
Momentum Effect:
As described in the academic paper, on abnormal days, prices tend to move in the direction of the abnormal return until the end of the trading day, creating momentum effects. This can be leveraged by traders for profit opportunities.
How It Works:
Calculation:
The script calculates the daily return as the percentage difference between the open and close prices. It then derives the mean and standard deviation of returns over a configurable lookback period.
Thresholds:
The script dynamically computes upper and lower thresholds for abnormal days using the mean and standard deviation. Days exceeding these thresholds are flagged as abnormal.
Visualization:
The mean return and thresholds are plotted as dynamic lines.
Abnormal days are visually highlighted with transparent green (positive) or red (negative) backgrounds on the chart.
References:
This indicator is based on the methodology discussed in "Momentum Effects in the Cryptocurrency Market After One-Day Abnormal Returns" by Caporale and Plastun (2020). Their research demonstrates that hourly returns during abnormal days exhibit a strong momentum effect, moving in the same direction as the abnormal return. This behavior contradicts the efficient market hypothesis and suggests profitable trading opportunities.
"Prices tend to move in the direction of abnormal returns till the end of the day, which implies the existence of a momentum effect on that day giving rise to exploitable profit opportunities" (Caporale & Plastun, 2020).

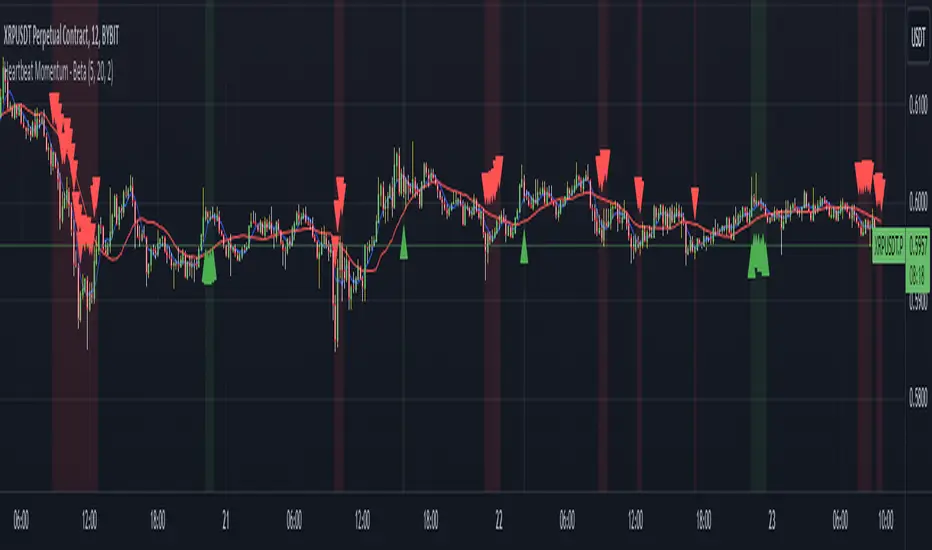
Heartbeat Momentum Strategy BetaHeartbeat Momentum Strategy Beta
Overview
The Heartbeat Momentum Strategy is an innovative approach to market analysis that draws inspiration from the rhythmic patterns of a heartbeat. This strategy aims to identify significant momentum shifts in the market by comparing short-term and long-term moving averages, analogous to detecting irregularities in a heartbeat.
Key Concepts
Market Heartbeat: The difference between short-term and long-term moving averages, representing the market's current 'pulse'.
Heartbeat Volatility: Measured by the standard deviation of the market heartbeat.
Momentum Signals: Generated when the heartbeat deviates significantly from its normal range.
How It Works
Calculates a short-term moving average (default 5 periods) and a long-term moving average (default 20 periods) of the closing price.
Computes the 'heartbeat' by subtracting the long-term MA from the short-term MA.
Measures the volatility of the heartbeat using its standard deviation over the long-term period.
Generates buy signals when the heartbeat exceeds 2 standard deviations above its mean.
Generates sell signals when the heartbeat falls 2 standard deviations below its mean.
Indicator Components
Blue Line: Short-term moving average
Red Line: Long-term moving average
Green Triangles: Buy signals
Red Triangles: Sell signals
Background Color: Light green during buy signals, light red during sell signals
Strategy Parameters
Short MA Window: The period for the short-term moving average (default: 5)
Long MA Window: The period for the long-term moving average (default: 20)
Standard Deviation Threshold: The number of standard deviations to trigger a signal (default: 2.0)
Interpretation
Buy Signal: Indicates a potential strong upward momentum shift. Consider opening long positions or closing short positions.
Sell Signal: Suggests a potential strong downward momentum shift. Consider opening short positions or closing long positions.
No Signal: The market is moving within its normal rhythm. Maintain current positions or look for other entry opportunities.
Customization
Users can adjust the strategy parameters to suit different assets, timeframes, or trading styles:
Decrease the MA windows for more frequent signals (more suitable for shorter timeframes).
Increase the MA windows for fewer, potentially more significant signals (better for longer timeframes).
Adjust the Standard Deviation Threshold to fine-tune sensitivity (lower for more signals, higher for fewer but potentially stronger signals).
Risk Management
While this strategy can provide valuable insights into market momentum, it should not be used in isolation:
Always use stop-loss orders to manage potential losses.
Consider the overall market context and other technical/fundamental factors.
Be aware of potential false signals, especially in ranging or highly volatile markets.
Backtest and forward-test the strategy with different parameters before live trading.
Conclusion
The Heartbeat Momentum Strategy offers a unique perspective on market movements by treating price action like a heartbeat. By identifying significant deviations from the normal market rhythm, it aims to capture strong momentum shifts while filtering out market noise. As with any trading strategy, use it as part of a comprehensive trading plan and always practice sound risk management.
Multi-Timeframe Momentum Indicator [Ox_kali]The Multi-Timeframe Momentum Indicator is a trend analysis tool designed to examine market momentum across various timeframes on a single chart. Utilizing the Relative Strength Index (RSI) to assess the market’s strength and direction, this indicator offers a multidimensional perspective on current trends, enriching technical analysis with a deeper understanding of price movements. Other oscillators, such as the MACD and StochRSI, will be integrated in future updates.
Regarding the operation with the RSI: when its value is below 50 for a given period, the trend is considered bearish. Conversely, a value above 50 indicates a bullish trend. The indicator goes beyond the isolated analysis of each period by calculating an average of the displayed trends, based on user preferences. This average, ranging from “Strong Down” to “Strong Up,” reflects the percentage of periods indicating a bullish or bearish trend, thus providing a precise overview of the overall market condition.
Key Features:
Multi-Timeframe Analysis : Allows RSI analysis across multiple timeframes, offering an overview of market dynamics.
Advanced Customization : Includes options to adjust the RSI period, the RSI trend threshold, and more.
Color and Transparency Options : Offers color styles for bullish and bearish trends, as well as adjustable transparency levels for personalized visualization.
Average Trend Display : Calculates and displays the average trend based on activated timeframes, providing a quick summary of the current market state.
Flexible Table Positioning : Allows users to choose the indicator’s display location on the chart for seamless integration.
List of Parameters:
RSI Period : Defines the RSI period for calculation.
RSI Up/Down Threshold: Threshold for determining bullish or bearish trends of the RSI.
Table Position: Location of the indicator’s display on the chart.
Color Style : Selection of the color style for the indicator.
Strong Down/Up Color (User) : Customization of colors for strong market movements.
Table TF Transparency : Adjustment of the transparency level for the timeframe table.
Show X Minute/Hour/Day/Week Trend : Activation of the RSI display for specific timeframes.
Show AVG : Option to display or not the calculated average trend.
the Multi-Timeframe Momentum Indicator , stands as a comprehensive tool for market trend analysis across various timeframes, leveraging the RSI for in-depth market insights. With the promise of future updates including the integration of additional oscillators like the MACD and StochRSI, this indicator is set to offer even more robust analysis capabilities.
Please note that the MTF-Momentum is not a guarantee of future market performance and should be used in conjunction with proper risk management. Always ensure that you have a thorough understanding of the indicator’s methodology and its limitations before making any investment decisions. Additionally, past performance is not indicative of future results.

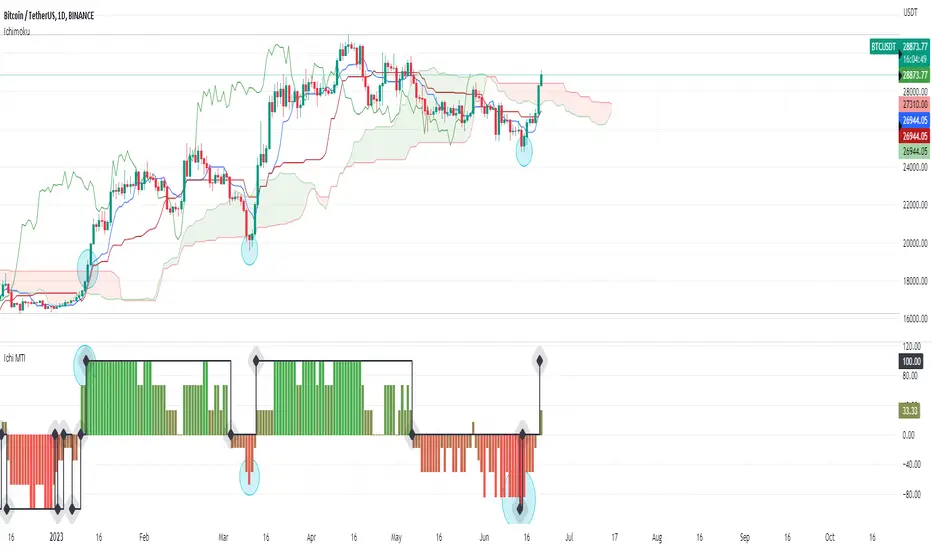
Ichimoku Cloud Momentum & Trend Indicator «NoaTrader»If you like Ichimoku cloud and use it in your analysis, or you are new to it and sometimes gets tricky to figure out all the details, this indicator tries to simplify that and visualize the change of trend and momentum relative to the past based on ichimoku.
The RED/GREEN columns are showing momentum strength while the black diamond line suggests the trend change. The conditions are simple enough to check them out on the script.
As you can see highlighted cyan circles on the chart as major important signals on the chart of Bitcoin daily timeframe.
This script tries to be complementary to the ichimoku cloud itself and cannot replace the levels represented by the cloud on chart.