Granville 8-Rule Engine — v6Description:
The Granville 8-Rule Engine systematically implements Joseph Granville's eight original trading rules, which provide a comprehensive framework for interpreting price action relative to a moving average to identify genuine trend changes and avoid false signals.
Granville's methodology focuses on the critical relationship between price movement and the direction of the moving average, recognizing that valid trend changes and continuations exhibit specific behavioral patterns while false breakouts and reversals show characteristic divergences.
The indicator evaluates all eight of Granville's rules and assigns a composite score based on their fulfillment:
Bullish Rules:
Rule 1: Price crosses above a rising moving average (+3 points)
Rule 2: Price remains above a rising moving average after testing support (+2 points)
Rule 3: Price remains above a rising moving average after penetrating below it (+1 point)
Rule 4: Moving average changes from declining to rising (+1 point)
Bearish Rules:
Rule 5: Price crosses below a declining moving average (-3 points)
Rule 6: Price remains below a declining moving average after testing resistance (-2 points)
Rule 7: Price remains below a declining moving average after penetrating above it (-1 point)
The indicator incorporates volume confirmation by adding or subtracting additional points when significant volume accompanies the fulfillment of bullish or bearish rules, respectively.
A buy signal is generated when the composite score reaches +4 or higher, indicating multiple bullish rules are simultaneously satisfied. A sell signal is generated when the score reaches -4 or lower, indicating multiple bearish rules are in effect.
This systematic approach filters out many false breakout and whipsaw signals by requiring multiple confirmatory conditions rather than relying on simple moving average crossovers. The scoring mechanism provides a quantitative measure of the strength of the prevailing trend relationship, enabling traders to distinguish between genuine trend development and deceptive price movements that fail to confirm with the moving average direction.
The Granville 8-Rule Engine provides a disciplined, rule-based method for determining whether price movements represent valid trend continuation, genuine trend reversal, or potentially misleading counter-trend activity that is likely to fail. By requiring multiple confirmatory conditions from Granville's established rules, the indicator helps traders avoid premature entries and provides higher-probability signals for participating in sustained trend movements.
Recherche dans les scripts pour "moving average crossover"

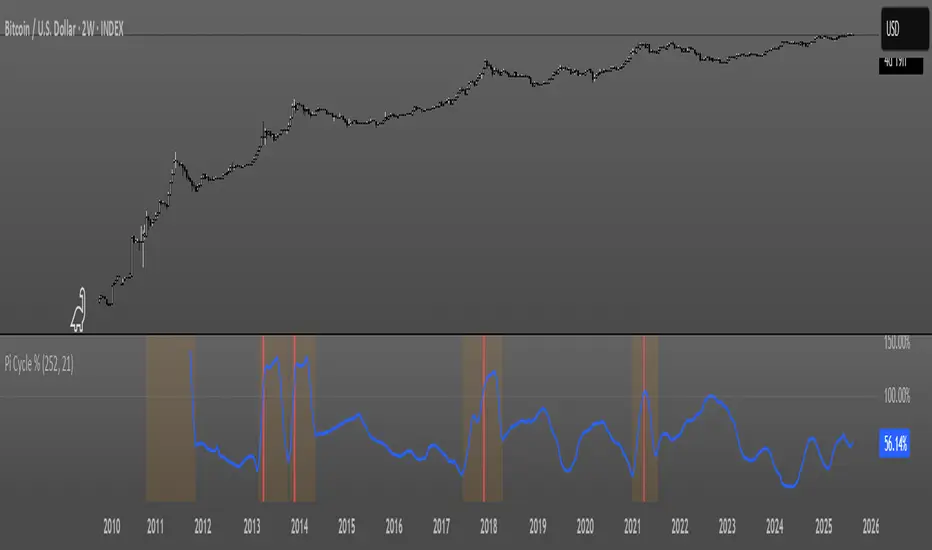
Pi Cycle OscillatorThis oscillator combines the Pi Cycle Top indicator with a percentile-based approach to create a more precise and easy to read market timing tool.
Instead of waiting for moving average crossovers, it shows you exactly how close you are to a potential market top.
Orange background means you should start preparing for a potential top and look into taking profits.
Red background means that the crossover has happened on the original Pi Cycle Indicator and that you should have already sold everything. (Crossover of the gray line aka 100)
Thank you
Bollinger Band Width Percentile - The_Caretaker
Pi Cycle Top - megasyl20
OB/OS adaptative v1.1# OB/OS Adaptative v1.1 - Multi-Timeframe Adaptive Overbought/Oversold Indicator
## Overview
The `tradingview_indicator_emas.pine` script is a sophisticated multi-timeframe indicator designed to identify dynamic overbought and oversold levels in financial markets. It combines EMA (Exponential Moving Average) crossovers and Bollinger Bands across monthly, weekly, and daily timeframes to create adaptive support and resistance levels that adjust to changing market conditions.
## Core Functionality
### Multi-Timeframe Analysis
The indicator analyzes three timeframes simultaneously:
- **Monthly (M)**: Long-term trend identification
- **Weekly (W)**: Intermediate-term trend identification
- **Daily (D)**: Short-term volatility measurement
### Technical Indicators Used
- **EMA 9 and EMA 20**: For trend identification and momentum assessment
- **Bollinger Bands (20-period)**: For volatility measurement and extreme level identification
- **Price action**: For confirmation of level validity and signal generation
## Key Features
### Adaptive Level Calculation
The indicator dynamically determines overbought and oversold levels based on market structure and trend bias:
#### Monthly Level Logic
- **Bullish Bias** (when monthly open > EMA20):
- Oversold = lower of EMA9 or EMA20
- Overbought = upper of EMA9 or Bollinger Upper Band
- **Bearish/Neutral Bias** (when monthly open ≤ EMA20):
- Oversold = Bollinger Lower Band
- Overbought = upper of EMA20 or EMA9
#### Weekly Level Logic
- **Bullish Bias** (when weekly open > EMA20):
- Oversold = lower of EMA9 or EMA20
- Overbought = Bollinger Upper Band
- **Bearish/Neutral Bias** (when weekly open ≤ EMA20):
- Oversold = Bollinger Lower Band
- Overbought = upper of EMA20 or EMA9
#### Daily Level Logic
- Simple Bollinger Bands:
- Oversold = Bollinger Lower Band
- Overbought = Bollinger Upper Band
### Final Level Determination
The indicator combines all three timeframes through a weighted averaging process:
1. Calculates initial values as the average of monthly, weekly, and daily levels
2. Ensures mathematical consistency by enforcing overbought_final ≥ oversold_final using min/max functions
3. Calculates a midpoint average level as the center of the range
### Visual Elements
- **Dynamic Lines**: Draws horizontal lines for current and previous period overbought, oversold, and average levels
- **Labels**: Places clear textual labels at the start of each period
- **Color Coding**:
- Red for overbought levels (resistance)
- Green for oversold levels (support)
- Blue for average levels (pivot point)
- **Transparency**: Previous period lines use semi-transparent colors to distinguish between current and historical levels
### Update Mechanism
- **Calculation Day**: User-defined day of the week (default: Monday)
- On the specified calculation day, the indicator:
- Updates all levels based on previous bar's data
- Draws new lines extending forward for a user-defined number of days
- Maintains previous period lines for comparison and trend analysis
- Automatically deletes and recreates lines to ensure clean visualization
### Proximity Detection
- Alerts when price approaches overbought/oversold levels (configurable distance in percentage)
- Helps identify potential reversal zones before actual crossovers occur
- Distance thresholds are user-configurable for both overbought and oversold conditions
### Alert Conditions
The indicator provides four distinct alert types:
1. **Cross below oversold**: Triggered when price crosses below the oversold level
2. **Cross above overbought**: Triggered when price crosses above the overbought level
3. **Near oversold**: Triggered when price approaches the oversold level within the configured distance
4. **Near overbought**: Triggered when price approaches the overbought level within the configured distance
### Debug Mode
When enabled, displays comprehensive debug information including:
- Current values for all levels (oversold, overbought, average)
- Timeframe-specific calculations and raw data points
- System status information (current day, calculation day, etc.)
- Lines existence and timing information
- Organized in multiple labels at different price levels to avoid overlap
## Configuration Parameters
| Parameter | Default Value | Description |
|---------|---------------|-------------|
| Short EMA (9) | 9 | Length for short-term EMA calculation |
| Long EMA (20) | 20 | Length for long-term EMA calculation |
| BB Length | 20 | Period for Bollinger Bands calculation |
| Std Dev | 2.0 | Standard deviation multiplier for Bollinger Bands |
| Distance to overbought (%) | 0.5 | Percentage threshold for "near overbought" alerts |
| Distance to oversold (%) | 0.5 | Percentage threshold for "near oversold" alerts |
| Calculation day | Monday | Day of week when levels are recalculated |
| Lookback days | 7 | Number of days to extend previous period lines backward |
| Forward days | 7 | Number of days to extend current period lines forward |
| Show Debug Labels | false | Toggle for comprehensive debug information display |
## Trading Applications
### Primary Use Cases
1. **Reversal Trading**: Identify potential reversal zones when price approaches overbought/oversold levels
2. **Trend Confirmation**: Use the adaptive nature of levels to confirm trend strength and direction
3. **Position Sizing**: Adjust position size based on distance from key levels
4. **Stop Placement**: Use opposite levels as dynamic stop-loss references
### Strategic Advantages
- **Adaptive Nature**: Levels adjust to changing market volatility and trend structure
- **Multi-Timeframe Confirmation**: Signals are validated across multiple timeframes
- **Visual Clarity**: Clear color-coded lines and labels enhance decision-making
- **Proactive Alerts**: "Near" conditions provide early warnings before crossovers
## Implementation Details
### Data Security
Uses `request.security()` function to fetch data from higher timeframes (monthly, weekly) while maintaining proper bar indexing with ` ` offset for open prices.
### Performance Optimization
- Uses `var` keyword to declare persistent variables that maintain state across bars
- Efficient line and label management with proper deletion before recreation
- Conditional execution of debug code to minimize performance impact
### Error Handling
- Comprehensive NA (not available) checks throughout the code
- Graceful degradation when data is unavailable for higher timeframes
- Mathematical safeguards to prevent invalid level calculations
## Conclusion
The OB/OS Adaptative v1.1 indicator represents a sophisticated approach to identifying market extremes by combining multiple technical analysis concepts. Its adaptive nature makes it particularly useful in trending markets where static levels may be less effective. The multi-timeframe approach provides a comprehensive view of market structure, while the visual elements and alert system enhance its practical utility for active traders.

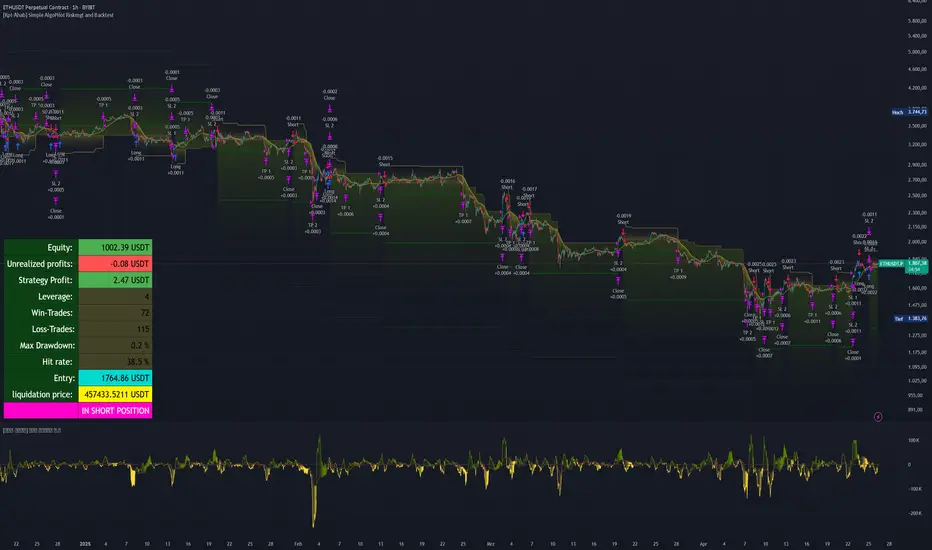
[Kpt-Ahab] Simple AlgoPilot Riskmgt and Backtest Simple AlgoPilot Riskmgt and Backtest
This script provides a compact solution for automated risk management and backtesting within TradingView.
It offers the following core functionalities:
Risk Management:
The system integrates various risk limitation mechanisms:
Percentage-based or trailing stop-loss
Maximum losing streak limitation
Maximum drawdown limitation relative to account equity
Flexible position sizing control (based on equity, fixed size, or contracts)
Dynamic repurchasing of positions ("Repurchase") during losses with adjustable size scaling
Supports multi-stage take-profit targets (TP1/TP2) and automatic stop-loss adjustment to breakeven
External Signal Processing for Backtesting:
In addition to its own moving average crossovers, the script can process external trading signals:
External signals are received via a source input variable (e.g., from other indicators or signal generators)
Positive values (+1) trigger long positions, negative values (–1) trigger short positions
This allows for easy integration of other indicator-based strategies into backtests
Additional Backtesting Features:
Selection between different MA types (SMA, EMA, WMA, VWMA, HMA)
Flexible time filtering (trade only within defined start and end dates)
Simulation of commission costs, slippage, and leverage
Optional alert functions for moving average crossovers
Visualization of liquidation prices and portfolio development in an integrated table
Note: This script is primarily intended for strategic backtesting and risk setting optimization.
Real-time applications should be tested with caution. All order executions, alerts, and risk calculations are purely simulation-based.
Explanation of Calculations and Logics:
1. Risk Management and Position Sizing:
The position size is calculated based on the user’s choice using three possible methods:
Percentage of Equity:
The position size is a defined fraction of the available capital, dynamically adjusted based on market price (riskPerc / close).
Fixed Size (in currency): The user defines a fixed monetary amount to be used per trade.
Contracts: A fixed number of contracts is traded regardless of the current price.
Leverage: The selected leverage multiplies the position size for margin calculations.
2. Trade Logic and Signal Triggering:
Trades can be triggered through two mechanisms:
Internal Signals:
When a fast moving average crosses above or below a slower moving average (ta.crossover, ta.crossunder). The type of moving averages (SMA, EMA, WMA, VWMA, HMA) can be freely selected.
External Signals:
Signals from other indicators can be received via an input source field.
+1 triggers a long entry, –1 triggers a short entry.
Position Management:
Once entered, the position is actively managed.
Multiple take-profit targets are set.
Upon reaching a profit target, the stop-loss can optionally be moved to breakeven.
3. Stop-Loss and Take-Profit Logic:
Stop-Loss Types:
Fixed Percentage Stop:
A fixed distance below/above the entry price.
Trailing Stop:
Dynamically adjusts as the trade moves into profit.
Fast Trailing Stop:
A more aggressive variant of trailing that reacts quicker to price changes.
Take-Profit Management:
Two take-profit targets (TP1 and TP2) are supported, allowing partial exits at different stages.
Remaining positions can either reach the second target or be closed by the stop-loss.
4. Repurchase Strategy ("Scaling In" on Losses):
If a position reaches a specified loss threshold (e.g., –15%), an automatic additional purchase can occur.
The position size is increased by a configurable percentage.
Repurchases happen only if an initial position is already open.
5. Backtesting Control and Filters:
Time Filters:
A trading period can be defined (start and end date).
All trades outside the selected period are ignored.
Risk Filters: Trading is paused if:
A maximum losing streak is reached.
A maximum allowed drawdown is exceeded.
6. Liquidation Calculation (Simulation Only):
The script simulates liquidation prices based on the account balance and position size.
Liquidation lines are drawn on the chart to better visualize potential risk exposure.
This is purely a visual aid — no real broker-side liquidation is performed.
MA Crossover [AlchimistOfCrypto]🌌 MA Crossover Quantum – Illuminating Market Harmonic Patterns 🌌
Category: Trend Analysis Indicators 📈
"The moving average crossover, reinterpreted through quantum field principles, visualizes the underlying resonance structures of price movements. This indicator employs principles from molecular orbital theory where energy states transition through gradient fields, similar to how price momentum shifts between bullish and bearish phases. Our implementation features algorithmically optimized parameters derived from extensive Python-based backtesting, creating a visual representation of market energy flows with dynamic opacity gradients that highlight the catalytic moments where trend transformations occur."
📊 Professional Trading Application
The MA Crossover Quantum transcends the traditional moving average crossover with a sophisticated gradient illumination system that highlights the energy transfer between fast and slow moving averages. Scientifically optimized for multiple timeframes and featuring eight distinct visual themes, it enables traders to perceive trend transitions with unprecedented clarity.
⚙️ Indicator Configuration
- Timeframe Presets 📏
Python-optimized parameters for specific timeframes:
- 1H: EMA 23/395 - Ideal for intraday precision trading
- 4H: SMA 41/263 - Balanced for swing trading operations
- 1D: SMA 8/44 - Optimized for daily trend identification
- 1W: SMA 32/38 - Calibrated for medium-term position trading
- 2W: SMA 17/20 - Engineered for long-term investment signals
- Custom Settings 🎯
Full parameter customization available for professional traders:
- Fast/Slow MA Length: Fine-tune to specific market conditions
- MA Type: Select between EMA (exponential) and SMA (simple) calculation methods
- Visual Theming 🎨
Eight scientifically designed visual palettes optimized for neural pattern recognition:
- Neon (default): High-contrast green/red scheme enhancing trend transition visibility
- Cyan-Magenta: Vibrant palette for maximum visual distinction
- Yellow-Purple: Complementary colors for enhanced pattern recognition
- Specialized themes (Green-Red, Forest Green, Blue Ocean, Orange-Red, Grayscale): Each calibrated for different market environments
- Opacity Control 🔍
- Variable transparency system (0-100) allowing seamless integration with price action
- Adaptive glow effect that intensifies around crossover points - the "catalytic moments" of trend change
🚀 How to Use
1. Select Timeframe ⏰: Choose from scientifically optimized presets based on your trading horizon
2. Customize Parameters 🎚️: For advanced users, disable presets to fine-tune MA settings
3. Choose Visual Theme 🌈: Select a color scheme that enhances your personal pattern recognition
4. Adjust Opacity 🔎: Fine-tune visualization intensity to complement your chart analysis
5. Identify Trend Changes ✅: Monitor gradient intensity to spot high-probability transition zones
6. Trade with Precision 🛡️: Use gradient intensity variations to determine position sizing and risk management
Developed through rigorous mathematical modeling and extensive backtesting, MA Crossover Quantum transforms the fundamental moving average crossover into a sophisticated visual analysis tool that reveals the molecular structure of market momentum.

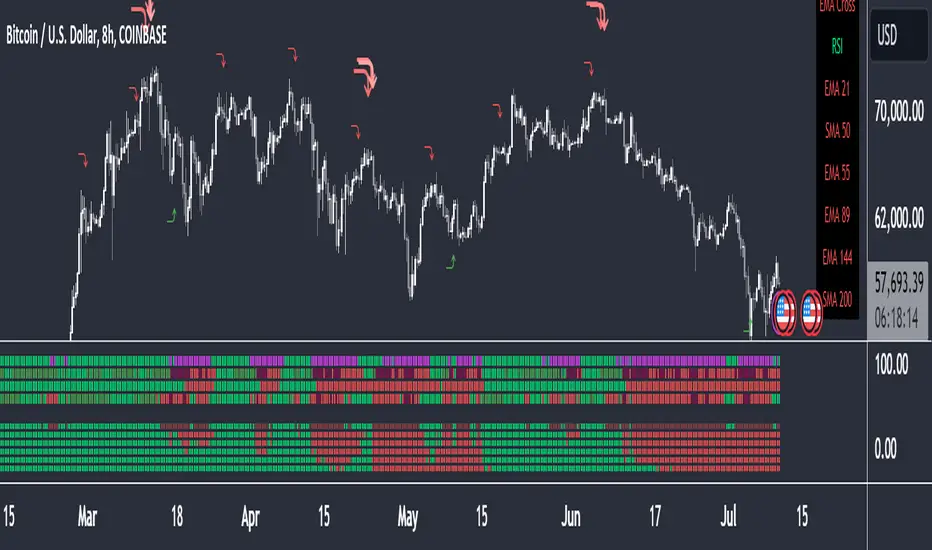
Buy Signal Forex & Crypto v0 ImprovedPurpose of the Script:
This script is designed to generate buy and sell signals for trading Forex and cryptocurrencies by analyzing price trends using exponential moving averages (EMAs), volatility, and volume filters. The signals are displayed as arrows on the chart.
What the Script Does
Input Settings:
The script allows the user to configure various settings, such as the lengths of EMAs, a higher timeframe for trend confirmation, and thresholds for volume and volatility (ATR - Average True Range).
Key settings:
5 EMA Length – Length of the short-term EMA.
13 EMA Length – Length of the medium-term EMA.
26 EMA Length – Length of the long-term EMA.
21 EMA Length – Used for trend confirmation on a higher timeframe.
Higher Timeframe – Lets you select a timeframe (e.g., daily) for confirming the overall trend.
ATR Threshold – Filters out signals when the market's volatility is too low.
Volume Filter – Ensures sufficient trading activity before generating signals.
Calculating EMAs (Exponential Moving Averages):
Four EMAs are calculated:
ema5 (short-term), ema13 (medium-term), ema26 (long-term), and ema21 (higher timeframe confirmation).
These EMAs help determine price trends and crossovers, which are critical for identifying buy and sell opportunities.
Trend Confirmation Using a Higher Timeframe:
The 21 EMA on the higher timeframe (e.g., daily) is used to confirm the overall direction of the market.
Defining Signal Conditions:
Buy Signal:
A buy signal is generated when:
ema5 crosses above ema13 (indicating a bullish trend).
ema5 crosses above ema26 (stronger bullish confirmation).
The closing price is above ema5, ema13, ema26, and the 21 EMA on the higher timeframe.
The market's volatility (ATR) is above the defined threshold.
The volume meets the conditions or volume filtering is disabled.
Sell Signal:
A sell signal is generated when:
ema5 crosses below ema13 (indicating a bearish trend).
ema5 crosses below ema26 (stronger bearish confirmation).
The closing price is below ema5, ema13, ema26, and the 21 EMA on the higher timeframe.
The market's volatility (ATR) is above the defined threshold.
The volume meets the conditions or volume filtering is disabled.
Volume Filtering:
Ensures there’s enough trading activity by comparing the current volume to a 20-period moving average of volume.
Persistent Variables:
These variables (crossed13 and crossed13Sell) help track whether the short-term EMA (ema5) has crossed the medium-term EMA (ema13). This prevents false or repeated signals.
Displaying Signals on the Chart:
Buy signals are displayed as green upward arrows below the price.
Sell signals are displayed as red downward arrows above the price.
How It Helps Traders:
This script provides visual cues for potential entry and exit points by combining moving average crossovers, volatility, volume, and higher timeframe trend confirmation. It works well for trending markets and ensures signals are filtered for stronger conditions to reduce noise.

Trend Following Parabolic Buy Sell Strategy [TradeDots]The Trend Following Parabolic Buy-Sell Strategy leverages the Parabolic SAR in combination with moving average crossovers to deliver buy and sell signals within a trend-following framework.
This strategy synthesizes proven methodologies sourced from various trading tutorials available on platforms such as YouTube and blogs, enabling traders to conduct robust backtesting on their selected trading pairs to assess the strategy's effectiveness.
HOW IT WORKS
This strategy employs four key indicators to orchestrate its trading signals:
1. Trend Alignment: It first assesses the relationship between the price and the predominant trendline to determine the directional stance—taking long positions only when the price trends above the moving average, signaling an upward market trajectory.
2. Momentum Confirmation: Subsequent to trend alignment, the strategy looks for moving average crossovers as a confirmation that the price is gaining momentum in the direction of the intended trades.
3. Signal Finalization: Finally, buy or sell signals are validated using the Parabolic SAR indicator. A long order is validated when the closing price is above the Parabolic SAR dots, and similarly, conditions are reversed for short orders.
4. Risk Management: The strategy institutes a fixed stop-loss at the moving average trendline and a take-profit level determinable by a prefixed risk-reward ratio calculated from the moving average trendline. These parameters are customizable by the users within the strategy settings.
APPLICATION
Designed for assets exhibiting pronounced directional momentum, this strategy aims to capitalize on clear trend movements conducive to achieving set take-profit targets.
As a lagging strategy that waits for multiple confirmatory signals, entry into trades might occasionally lag beyond optimal timing.
Furthermore, in periods of consolidation or sideways movement, the strategy may generate several false signals, suggesting the potential need for additional market condition filters to enhance signal accuracy during volatile phases.
DEFAULT SETUP
Commission: 0.01%
Initial Capital: $10,000
Equity per Trade: 70%
Users are advised to adjust and personalize this trading strategy to better match their individual trading preferences and style.
RISK DISCLAIMER
Trading entails substantial risk, and most day traders incur losses. All content, tools, scripts, articles, and education provided by TradeDots serve purely informational and educational purposes. Past performances are not definitive predictors of future results.

OBV Oscillator [LazyBear]- with some MAsThis indicator in modified OBV written by @LazyBear
I just added the 2 different Bollinger Bands and 2 different moving averages to the OBV version of LazyBear.
OBV line green -> OBV above zero
OBV line red -> OBV under zero
green background line -> OBV crossover 1st Moving Average
red background line -> OBV crossunder 1st Moving Average
blue '◆' -> OBV crossover 2nd Moving Average
yellow '◆' -> OBV crosunder 2nd Moving Average
blue '+' -> 1st Moving Average crossUNDER 2nd Moving Average
red '+' -> 1st Moving Average crossOVER 2nd Moving Average

MA Crossover Alerts for Small Quick Profits on 3commas/DCA botDear fellow 3commas users,
This is a the most basic Moving Average crossover technique generating Buy Alerts.
This is especially written for those of you who want to link this basic crossover strategy with your 3commas DCA bot .
Buy Alerts
Moving averages available:
- Simple Moving Average (SMA)
- Exponential Moving Average (EMA)
- Weighted Moving Average (WMA)
- Hull Moving Average (HullMA)
- Volume Weighted Moving Average (VMWA)
- Running Moving Average (RMA)
- Triple Exponential Moving Average (TEMA)
Recommended settings for using with 3commas DCA bot:
Interval:
3m to 15m
3commas bot setup:
- TP/TTP: 0.3%/0.1%,
- Base Order: Your choice ,
- Safety Order: 1.2 * Base order
- Safety Order Volume Scale: 1.2,
- Safety Order Step Scale: 1.5,
- Max Active Deals: Your choice ,
- Price Deviation to Open Safety Order (% from initial order): 0.2%,
- Max Safety Trades Count: 7,
- Simulatenous Deals per Same Pair: 3
> Create Alert with Buy Alert and link it to your bot "Message for deal start signal"
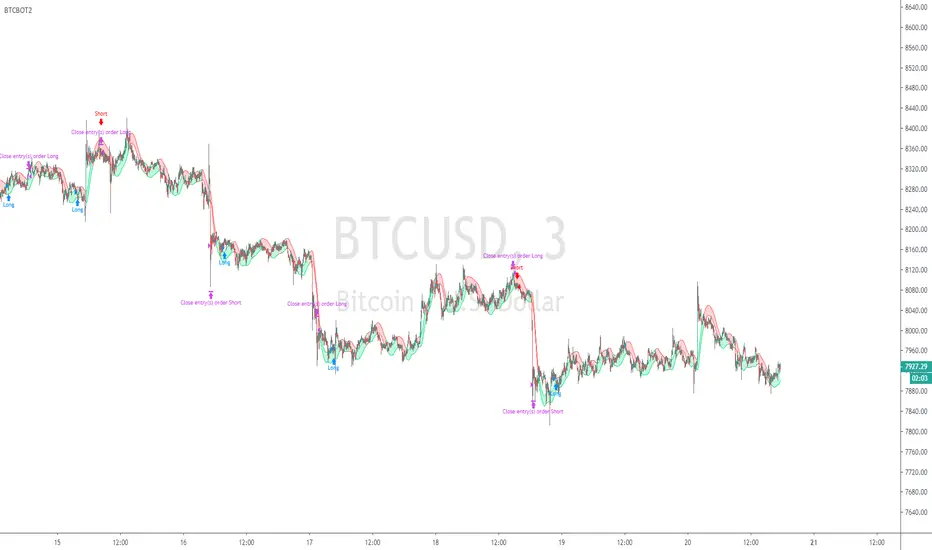
BTCBOT2Watches 3 Symbols with separate timeframe control, with Hull Moving Average crossovers on each, DXY XAU/USD BTC/USD
and a daily candle crossover. With StopLoss and Target Price and Backtesting history selection control. Entry and Exit rules visible in script (script open)
So if DXY chart is going down and Gold chart going up and Bitcoin chart going up then it will enter a buy, yes it is watching more than just bitcoin itself.
it needs HMA to match on all 3 charts and with selected timeframes, the timeframe of users chart, the timeframe in settings for the HMA's on the symbols. Also a Daily Candle chart of the users selected chart (symbol)
10 indicators in 1 : MACD RSI PIVOT EMA-CROSS and 7 EMA/SMA10 indicators in 1
MACD
RSI
PIVOT weekly:best
200 sma
100 sma
75 ema
55 ema
50 sma
20 ema
Golden EMA Crossover 13/48 based on tests Results of 1750 Moving Average Crossovers
Alert included, You can find "Bullish signal" and "Bearish signal" When you add Alert

Efmus System : 10 indicators in 1
10 indicators in 1
MACD
RSI
PIVOT weekly:best
200 sma
100 sma
75 ema
55 ema
50 sma
20 ema
Golden EMA Crossover 13/48 based on tests Results of 1750 Moving Average Crossovers :
etfhq.com
Efmus System : 10 indicators in 1
10 indicators in 1
MACD
RSI
PIVOT weekly:best
200 sma
100 sma
75 ema
55 ema
50 sma
20 ema
Golden EMA Crossover 13/48 based on tests Results of 1750 Moving Average Crossovers :
etfhq.com

Adaptive Trend SelectorThe Adaptive Trend Selector is a comprehensive trend-following tool designed to automatically identify the optimal moving average crossover strategy. It features adjustable parameters and an integrated backtester that delivers institutional-grade insights into the recommended strategy. The model continuously adapts to new data in real time by evaluating multiple moving average combinations, determining the best performing lengths, and presenting the backtest results in a clear, color-coded table that benchmarks performance against the buy-and-hold strategy.
At its core, the model systematically backtests a wide range of moving average combinations to identify the configuration that maximizes the selected optimization metric. Users can choose to optimize for absolute returns or risk-adjusted returns using the Sharpe, Sortino, or Calmar ratios. Alternatively, users can enable manual optimization to test custom fast and slow moving average lengths and view the corresponding backtest results. The label displays the Compounded Annual Growth Rate (CAGR) of the strategy, with the buy-and-hold CAGR in parentheses for comparison. The table presents the backtest results based on the fast and slow lengths displayed at the top:
Sharpe = CAGR per unit of standard deviation.
Sortino = CAGR per unit of downside deviation.
Calmar = CAGR relative to maximum drawdown.
Max DD = Largest peak-to-trough decline in value.
Beta (β) = Return sensitivity relative to buy-and-hold.
Alpha (α) = Excess annualized risk-adjusted returns.
Win Rate = Ratio of profitable trades to total trades.
Profit Factor = Total gross profit per unit of losses.
Expectancy = Average expected return per trade.
Trades/Year = Average number of trades per year.
This indicator is designed with flexibility in mind, enabling users to specify the start date of the backtesting period and the preferred moving average strategy. Supported strategies include the Exponential Moving Average (EMA), Simple Moving Average (SMA), Wilder’s Moving Average (RMA), Weighted Moving Average (WMA), and Volume-Weighted Moving Average (VWMA). To minimize overfitting, users can define constraints such as a minimum and maximum number of trades per year, as well as an optional optimization margin that prioritizes longer, more robust combinations by requiring shorter-length strategies to exceed this threshold. The table follows an intuitive color logic that enables quick performance comparison against buy-and-hold (B&H):
Sharpe = Green indicates better than B&H, while red indicates worse.
Sortino = Green indicates better than B&H, while red indicates worse.
Calmar = Green indicates better than B&H, while red indicates worse.
Max DD = Green indicates better than B&H, while red indicates worse.
Beta (β) = Green indicates better than B&H, while red indicates worse.
Alpha (α) = Green indicates above 0%, while red indicates below 0%.
Win Rate = Green indicates above 50%, while red indicates below 50%.
Profit Factor = Green indicates above 2, while red indicates below 1.
Expectancy = Green indicates above 0%, while red indicates below 0%.
In summary, the Adaptive Trend Selector is a powerful tool designed to help investors make data-driven decisions when selecting moving average crossover strategies. By optimizing for risk-adjusted returns, investors can confidently identify the best lengths using institutional-grade metrics. While results are based on the selected historical period, users should be mindful of potential overfitting, as past results may not persist under future market conditions. Since the model recalibrates to incorporate new data, the recommended lengths may evolve over time.

Script_Algo - High Low Range MA Crossover Strategy🎯 Core Concept
This strategy uses modified moving averages crossover, built on maximum and minimum prices, to determine entry and exit points in the market. A key advantage of this strategy is that it avoids most false signals in trendless conditions, which is characteristic of traditional moving average crossover strategies. This makes it possible to improve the risk/reward ratio and, consequently, the strategy's profitability.
📊 How the Strategy Works
Main Mechanism
The strategy builds 4 moving averages:
Two senior MAs (on high and low) with a longer period
Two junior MAs (on high and low) with a shorter period
Buy signal 🟢: when the junior MA of lows crosses above the senior MA of highs
Sell signal 🔴: when the junior MA of highs crosses below the senior MA of lows
As seen on the chart, it was potentially possible to make 9X on the WIFUSDT cryptocurrency pair in just a year and a half. However, be careful—such results may not necessarily be repeated in the future.
Special Feature
Position closing priority ❗: if an opposite signal arrives while a position is open, the strategy first closes the current position and only then opens a new one
⚙️ Indicator Settings
Available Moving Average Types
EMA - Exponential MA
SMA - Simple MA
SSMA - Smoothed MA
WMA - Weighted MA
VWMA - Volume Weighted MA
RMA - Adaptive MA
DEMA - Double EMA
TEMA - Triple EMA
Adjustable Parameters
Senior MA Length - period for long-term moving averages
Junior MA Length - period for short-term moving averages
✅ Advantages of the Strategy
🛡️ False Signal Protection - using two pairs of modified MAs reduces the number of false entries
🔄 Configuration Flexibility - ability to choose MA type and calculation periods
⚡ Automatic Switching - the strategy automatically closes the current position when receiving an opposite signal
📈 Visual Clarity - all MAs are displayed on the chart in different colors
⚠️ Disadvantages and Risks
📉 Signal Lag - like all MA-based strategies, it may provide delayed signals during sharp movements
🔁 Frequent Switching - in sideways markets, it may lead to multiple consecutive position openings/closings
📊 Requires Optimization - optimal parameters need to be selected for different instruments and timeframes
💡 Usage Recommendations
Backtest - test the strategy's performance on historical data
Optimize Parameters - select MA periods suitable for the specific trading instrument
Use Filters - add additional filters to confirm signals
Manage Risks - always use stop-loss and take-profit orders.
You can safely connect to the exchange via webhook and enjoy trading.
Good luck and profits to everyone!!

Ultimate Scalping Strategy v2Strategy Overview
This is a versatile scalping strategy designed primarily for low timeframes (like 1-min, 3-min, or 5-min charts). Its core logic is based on a classic EMA (Exponential Moving Average) crossover system, which is then filtered by the VWAP (Volume-Weighted Average Price) to confirm the trade's direction in alignment with the market's current intraday sentiment.
The strategy is highly customizable, allowing traders to add layers of confirmation, control trade direction, and manage exits with precision.
Core Strategy Logic
The strategy's entry signals are generated when two primary conditions are met simultaneously:
Momentum Shift (EMA Crossover): It looks for a crossover between a fast EMA (default length 9) and a slow EMA (default length 21).
Buy Signal: The fast EMA crosses above the slow EMA, indicating a potential shift to bullish momentum.
Sell Signal: The fast EMA crosses below the slow EMA, indicating a potential shift to bearish momentum.
Trend/Sentiment Filter (VWAP): The crossover signal is only considered valid if the price is on the "correct" side of the VWAP.
For a Buy Signal: The price must be trading above the VWAP. This confirms that, on average, buyers are in control for the day.
For a Sell Signal: The price must be trading below the VWAP. This confirms that sellers are generally in control.
Confirmation Filters (Optional)
To increase the reliability of the signals and reduce false entries, the strategy includes two optional confirmation filters:
Price Action Filter (Engulfing Candle): If enabled (Use Price Action), the entry signal is only valid if the crossover candle is also an "engulfing" candle.
A Bullish Engulfing candle is a large green candle that completely "engulfs" the body of the previous smaller red candle, signaling strong buying pressure.
A Bearish Engulfing candle is a large red candle that engulfs the previous smaller green candle, signaling strong selling pressure.
Volume Filter (Volume Spike): If enabled (Use Volume Confirmation), the entry signal must be accompanied by a surge in volume. This is confirmed if the volume of the entry candle is greater than its recent moving average (default 20 periods). This ensures the move has strong participation behind it.
Exit Strategy
A position can be closed in one of three ways, creating a comprehensive exit plan:
Stop Loss (SL): A fixed stop loss is set at a level determined by a multiple of the Average True Range (ATR). For example, a 1.5 multiplier places the stop 1.5 times the current ATR value away from the entry price. This makes the stop dynamic, adapting to market volatility.
Take Profit (TP): A fixed take profit is also set using an ATR multiplier. By setting the TP multiplier higher than the SL multiplier (e.g., 2.0 for TP vs. 1.5 for SL), the strategy aims for a positive risk-to-reward ratio on each trade.
Exit on Opposite Signal (Reversal): If enabled, an open position will be closed automatically if a valid entry signal in the opposite direction appears. For example, if you are in a long trade and a valid short signal occurs, the strategy will exit the long position immediately. This feature turns the strategy into more of a reversal system.
Key Features & Customization
Trade Direction Control: You can enable or disable long and short trades independently using the Allow Longs and Allow Shorts toggles. This is useful for trading in harmony with a higher-timeframe trend (e.g., only allowing longs in a bull market).
Visual Plots: The strategy plots the Fast EMA, Slow EMA, and VWAP on the chart for easy visualization of the setup. It also plots up/down arrows to mark where valid buy and sell signals occurred.
Dynamic SL/TP Line Plotting: A standout feature is that the strategy automatically draws the exact Stop Loss and Take Profit price lines on the chart for every active trade. These lines appear when a trade is entered and disappear as soon as it is closed, providing a clear visual of your risk and reward targets.
Alerts: The script includes built-in alertcondition calls. This allows you to create alerts in TradingView that can notify you on your phone or execute trades automatically via a webhook when a long or short signal is generated.

EMA & MA Crossover StrategyGuys, you asked, we did. Strategy for crossing moving averages .
The Moving Average Crossover trading strategy is possibly the most popular
trading strategy in the world of trading. First of them were written in the
middle of XX century, when commodities trading strategies became popular.
This strategy is a good example of so-called traditional strategies.
Traditional strategies are always long or short. That means they are never
out of the market. The concept of having a strategy that is always long or
short may be scary, particularly in today’s market where you don’t know what
is going to happen as far as risk on any one market. But a lot of traders
believe that the concept is still valid, especially for those of traders who
do their own research or their own discretionary trading.
This version uses crossover of moving average and its exponential moving average.
Strategy parameters:
Take Profit % - when it receives the opposite signal
Stop Loss % - when it receives the opposite signal
Current Backtest:
Account: 1000$
Trading size: 0.01
Commission: 0.05%
WARNING:
- For purpose educate only
- This script to change bars colors.
Dskyz (DAFE) MAtrix with ATR-Powered Precision Dskyz (DAFE) MAtrix with ATR-Powered Precision
This cutting‐edge futures trading strategy built to thrive in rapidly changing market conditions. Developed for high-frequency futures trading on instruments such as the CME Mini MNQ, this strategy leverages a matrix of sophisticated moving averages combined with ATR-based filters to pinpoint high-probability entries and exits. Its unique combination of adaptable technical indicators and multi-timeframe trend filtering sets it apart from standard strategies, providing enhanced precision and dynamic responsiveness.
imgur.com
Core Functional Components
1. Advanced Moving Averages
A distinguishing feature of the DAFE strategy is its robust, multi-choice moving averages (MAs). Clients can choose from a wide array of MAs—each with specific strengths—in order to fine-tune their trading signals. The code includes user-defined functions for the following MAs:
imgur.com
Hull Moving Average (HMA):
The hma(src, len) function calculates the HMA by using weighted moving averages (WMAs) to reduce lag considerably while smoothing price data. This function computes an intermediate WMA of half the specified length, then a full-length WMA, and finally applies a further WMA over the square root of the length. This design allows for rapid adaptation to price changes without the typical delays of traditional moving averages.
Triple Exponential Moving Average (TEMA):
Implemented via tema(src, len), TEMA uses three consecutive exponential moving averages (EMAs) to effectively cancel out lag and capture price momentum. The final formula—3 * (ema1 - ema2) + ema3—produces a highly responsive indicator that filters out short-term noise.
Double Exponential Moving Average (DEMA):
Through the dema(src, len) function, DEMA calculates an EMA and then a second EMA on top of it. Its simplified formula of 2 * ema1 - ema2 provides a smoother curve than a single EMA while maintaining enhanced responsiveness.
Volume Weighted Moving Average (VWMA):
With vwma(src, len), this MA accounts for trading volume by weighting the price, thereby offering a more contextual picture of market activity. This is crucial when volume spikes indicate significant moves.
Zero Lag EMA (ZLEMA):
The zlema(src, len) function applies a correction to reduce the inherent lag found in EMAs. By subtracting a calculated lag (based on half the moving average window), ZLEMA is exceptionally attuned to recent price movements.
Arnaud Legoux Moving Average (ALMA):
The alma(src, len, offset, sigma) function introduces ALMA—a type of moving average designed to be less affected by outliers. With parameters for offset and sigma, it allows customization of the degree to which the MA reacts to market noise.
Kaufman Adaptive Moving Average (KAMA):
The custom kama(src, len) function is noteworthy for its adaptive nature. It computes an efficiency ratio by comparing price change against volatility, then dynamically adjusts its smoothing constant. This results in an MA that quickly responds during trending periods while remaining smoothed during consolidation.
Each of these functions—integrated into the strategy—is selectable by the trader (via the fastMAType and slowMAType inputs). This flexibility permits the tailored application of the MA most suited to current market dynamics and individual risk management preferences.
2. ATR-Based Filters and Risk Controls
ATR Calculation and Volatility Filter:
The strategy computes the Average True Range (ATR) over a user-defined period (atrPeriod). ATR is then used to derive both:
Volatility Assessment: Expressed as a ratio of ATR to closing price, ensuring that trades are taken only when volatility remains within a safe, predefined threshold (volatilityThreshold).
ATR-Based Entry Filters: Implemented as atrFilterLong and atrFilterShort, these conditions ensure that for long entries the price is sufficiently above the slow MA and vice versa for shorts. This acts as an additional confirmation filter.
Dynamic Exit Management:
The exit logic employs a dual approach:
Fixed Stop and Profit Target: Stops and targets are set at multiples of ATR (fixedStopMultiplier and profitTargetATRMult), helping manage risk in volatile markets.
Trailing Stop Adjustments: A trailing stop is calculated using the ATR multiplied by a user-defined offset (trailOffset), which captures additional profits as the trade moves favorably while protecting against reversals.
3. Multi-Timeframe Trend Filtering
The strategy enhances its signal reliability by leveraging a secondary, higher timeframe analysis:
15-Minute Trend Analysis:
By retrieving 15-minute moving averages (fastMA15m and slowMA15m) via request.security, the strategy determines the broader market trend. This secondary filter (enabled or disabled through useTrendFilter) ensures that entries are aligned with the prevailing market direction, thereby reducing the incidence of false signals.
4. Signal and Execution Logic
Combined MA Alignment:
The entry conditions are based primarily on the alignment of the fast and slow MAs. A long condition is triggered when the current price is above both MAs and the fast MA is above the slow MA—complemented by the ATR filter and volume conditions. The reverse applies for a short condition.
Volume and Time Window Validation:
Trades are permitted only if the current volume exceeds a minimum (minVolume) and the current hour falls within the predefined trading window (tradingStartHour to tradingEndHour). An additional volume spike check (comparing current volume to a moving average of past volumes) further filters for optimal market conditions.
Comprehensive Order Execution:
The strategy utilizes flexible order execution functions that allow pyramiding (up to 10 positions), ensuring that it can scale into positions as favorable conditions persist. The use of both market entries and automated exits (with profit targets, stop-losses, and trailing stops) ensures that risk is managed at every step.
5. Integrated Dashboard and Metrics
For transparency and real-time analysis, the strategy includes:
On-Chart Visualizations:
Both fast and slow MAs are plotted on the chart, making it easy to see the market’s technical foundation.
Dynamic Metrics Dashboard:
A built-in table displays crucial performance statistics—including current profit/loss, equity, ATR (both raw and as a percentage), and the percentage gap between the moving averages. These metrics offer immediate insight into the health and performance of the strategy.
Input Parameters: Detailed Breakdown
Every input is meticulously designed to offer granular control:
Fast & Slow Lengths:
Determine the window size for the fast and slow moving averages. Smaller values yield more sensitivity, while larger values provide a smoother, delayed response.
Fast/Slow MA Types:
Choose the type of moving average for fast and slow signals. The versatility—from basic SMA and EMA to more complex ones like HMA, TEMA, ZLEMA, ALMA, and KAMA—allows customization to fit different market scenarios.
ATR Parameters:
atrPeriod and atrMultiplier shape the volatility assessment, directly affecting entry filters and risk management through stop-loss and profit target levels.
Trend and Volume Filters:
Inputs such as useTrendFilter, minVolume, and the volume spike condition help confirm that a trade occurs in active, trending markets rather than during periods of low liquidity or market noise.
Trading Hours:
Restricting trade execution to specific hours (tradingStartHour and tradingEndHour) helps avoid illiquid or choppy markets outside of prime trading sessions.
Exit Strategies:
Parameters like trailOffset, profitTargetATRMult, and fixedStopMultiplier provide multiple layers of risk management and profit protection by tailoring how exits are generated relative to current market conditions.
Pyramiding and Fixed Trade Quantity:
The strategy supports multiple entries within a trend (up to 10 positions) and sets a predefined trade quantity (fixedQuantity) to maintain consistent exposure and risk per trade.
Dashboard Controls:
The resetDashboard input allows for on-the-fly resetting of performance metrics, keeping the strategy’s performance dashboard accurate and up-to-date.
Why This Strategy is Truly Exceptional
Multi-Faceted Adaptability:
The ability to switch seamlessly between various moving average types—each suited to particular market conditions—enables the strategy to adapt dynamically. This is a testament to the high level of coding sophistication and market insight infused within the system.
Robust Risk Management:
The integration of ATR-based stops, profit targets, and trailing stops ensures that every trade is executed with well-defined risk parameters. The system is designed to mitigate unexpected market swings while optimizing profit capture.
Comprehensive Market Filtering:
By combining moving average crossovers with volume analysis, volatility thresholds, and multi-timeframe trend filters, the strategy only enters trades under the most favorable conditions. This multi-layered filtering reduces noise and enhances signal quality.
-Final Thoughts-
The Dskyz Adaptive Futures Elite (DAFE) MAtrix with ATR-Powered Precision strategy is not just another trading algorithm—it is a multi-dimensional, fully customizable system built on advanced technical principles and sophisticated risk management techniques. Every function and input parameter has been carefully engineered to provide traders with a system that is both powerful and transparent.
For clients seeking a state-of-the-art trading solution that adapts dynamically to market conditions while maintaining strict discipline in risk management, this strategy truly stands in a class of its own.
****Please show support if you enjoyed this strategy. I'll have more coming out in the near future!!
-Dskyz
Caution
DAFE is experimental, not a profit guarantee. Futures trading risks significant losses due to leverage. Backtest, simulate, and monitor actively before live use. All trading decisions are your responsibility.

Han Algo - Moving average strategyHan Algo Indicator Strategy Description
Overview:
The Han Algo Indicator is designed to identify trend directions and signal potential buy and sell opportunities based on moving average crossovers. It aims to provide clear signals while filtering out noise and minimizing false signals.
Indicators Used:
Moving Averages:
200 SMA (Simple Moving Average): Used as a long-term trend indicator.
100 SMA: Provides a medium-term perspective on price movements.
50 SMA: Offers insights into shorter-term trends.
20 SMA: Provides a very short-term perspective on recent price actions.
Trend Identification:
The indicator identifies the trend based on the relationship between the closing price (close) and the 200 SMA (ma_long):
Uptrend: When the closing price is above the 200 SMA.
Downtrend: When the closing price is below the 200 SMA.
Sideways: When the closing price is equal to the 200 SMA.
Buy and Sell Signals:
Buy Signal: Generated when transitioning from a downtrend to an uptrend (buy_condition):
Displayed as a green "BUY" label above the price bar.
Sell Signal: Generated when transitioning from an uptrend to a downtrend (sell_condition):
Displayed as a red "SELL" label below the price bar.
Signal Filtering:
Signals are filtered to prevent consecutive signals occurring too closely (min_distance_bars parameter):
Ensures that only significant trend reversals are captured, minimizing false signals.
Visualization:
Background Color:
Changes to green for uptrend and red for downtrend (bgcolor function):
Provides visual cues for current market sentiment.
Usage:
Traders can customize the indicator's parameters (long_term_length, medium_term_length, short_term_length, very_short_term_length, min_distance_bars) to align with their trading preferences and timeframes.
The Han Algo Indicator helps traders make informed decisions by highlighting potential trend reversals and aligning with market trends identified through moving average analysis.
Disclaimer:
This indicator is intended for educational purposes and as a visual aid to support trading decisions. It should be used in conjunction with other technical analysis tools and risk management strategies.

Multiple MAs Signals with RSI MA Filter & Signal About the Script
The "Multiple Moving Averages Signals with RSI MA Filter and Golden Signals" script is a comprehensive trading tool designed to provide traders with detailed insights and actionable signals based on multiple moving averages and RSI (Relative Strength Index). This script combines traditional moving average crossovers with RSI filtering to enhance the accuracy of trading signals and includes "golden" signals to highlight significant long-term trend changes.
This script integrates several technical indicators and concepts to create a robust and versatile trading tool. Here's why this combination is both original and useful:
1. Multiple Moving Averages:
- Why Use Multiple MAs: Different types of moving averages (SMA, EMA, SMMA, WMA, VWMA, Hull) offer unique perspectives on price trends and volatility. Combining them allows traders to capture a more comprehensive view of the market.
- Purpose: Using multiple moving averages helps identify trend direction, support/resistance levels, and potential reversal points.
2. RSI MA Filter:
- Why Use RSI: RSI is a momentum oscillator that measures the speed and change of price movements. It is used to identify overbought or oversold conditions in a market.
- Purpose: Filtering signals with RSI moving averages ensures that trades are taken in line with the prevailing momentum, reducing the likelihood of false signals.
3. Golden Signals:
- Why Use Golden Crosses: A golden cross (50-period MA crossing above the 200-period MA) is a well-known bullish signal, while a death cross (50-period MA crossing below the 200-period MA) is bearish. These signals are widely followed by traders and institutions.
- Purpose: Highlighting these significant long-term signals helps traders identify major buy or sell opportunities and align with broader market trends.
How the Script Works
1. Moving Average Calculations:
- The script calculates multiple moving averages (MA1 to MA5) based on user-selected types (SMA, EMA, SMMA, WMA, VWMA, Hull) and periods (9, 21, 50, 100, 200).
- Golden Moving Averages: Separately calculates 50-period and 200-period moving averages for generating golden signals.
2. RSI and RSI MA Filter:
- RSI Calculation: Computes the RSI for the given period.
- RSI MA: Calculates a moving average of the RSI to smooth out the RSI values and reduce noise.
- RSI MA Filter: Traders can enable/disable RSI filtering and set custom thresholds to refine long and short signals based on RSI momentum.
3. Long & Short Signal Generation:
- Long Signal: Generated when the short-term moving average crosses above both the mid-term and long-term moving averages, and the RSI MA is below the specified threshold (if enabled).
- Short Signal: Generated when the short-term moving average crosses below both the mid-term and long-term moving averages, and the RSI MA is above the specified threshold (if enabled).
4. Golden Signals:
- Golden Long Signal: Triggered when the 50-period golden moving average crosses above the 200-period golden moving average.
- Golden Short Signal: Triggered when the 50-period golden moving average crosses below the 200-period golden moving average.
How to Use the Script
1. Customize Inputs:
- Moving Averages: Choose the type of moving averages and set the periods for up to five different moving averages.
- RSI Settings: Adjust the RSI period and its moving average period. Enable or disable RSI filtering and set custom thresholds for long and short signals.
- Signal Colors: Customize the colors for long, short, and golden signals.
- Enable/Disable Signals: Toggle the visibility of long, short, and golden signals.
2. Observe Plots and Signals:
- The script plots the selected moving averages on the chart.
- Long and short signals are marked with labels on the chart, with customizable colors for easy identification.
- Golden signals are highlighted with specific labels to indicate significant long-term trend changes.
3. Analyze and Trade:
- Use the generated signals as part of your trading strategy. The script provides visual cues to help you make informed decisions about entering or exiting trades based on multiple technical indicators.
Unique Features
1. Integration of Multiple Moving Averages: Combines various moving average types to provide a holistic view of market trends.
2. RSI MA Filtering: Enhances signal accuracy by incorporating RSI momentum, reducing the likelihood of false signals.
3. Golden Signals: Highlights significant long-term trend changes, aligning with broader market movements.
4. Customizability: Offers extensive customization options, allowing traders to tailor the script to their specific trading strategies and preferences.
feel free to comments.

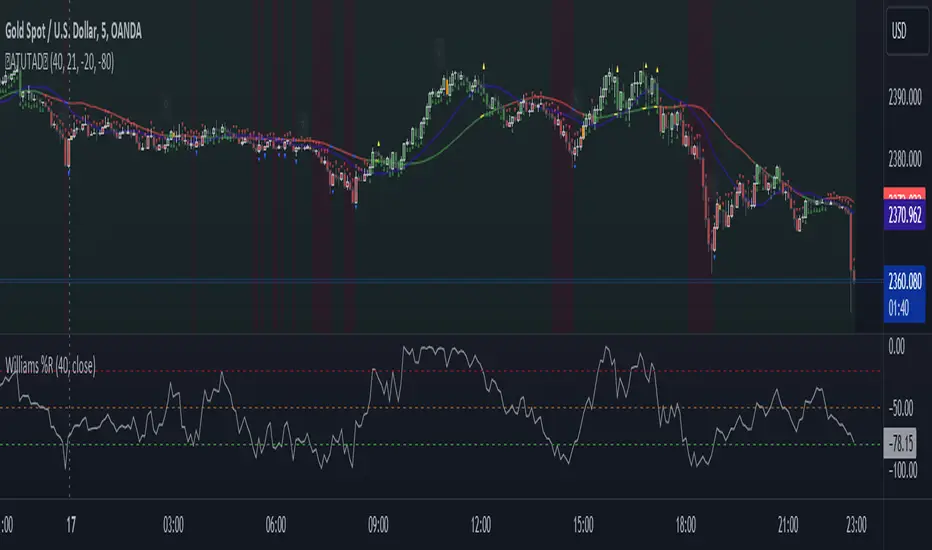
AllTheUpsTheresAlwaysDowns "AllTheUpsTheresAlwaysDowns" ☆ATUTAD☆ // w%r + ma indicator designed for forex trading.
This indicator combines the Williams %R, moving averages, and session tracking.
Key Inputs:
Williams%Range Period: Adjusts the sensitivity of the Williams %R calculation.
Moving Average Period: Defines the period for the moving average used in the indicator.
Overbought and Oversold Thresholds: Sets the thresholds for identifying overbought and oversold conditions.
Features:
Williams %R Calculation: Calculates the Williams %R, a momentum oscillator that measures overbought and oversold levels.
Moving Averages: Plots two moving averages to capitalize on and visualize trend direction.
Session Tracking: Identifies the start and end of trading sessions (Tokyo, London, New York) for better session-based analysis.
Signal Generation: Generates buy/sell signals based on Williams %R levels and moving average crossovers.
Color Coding: Visualizes color-coded bars and shapes to highlight different market conditions and signal types.
Alerts: For buy/sell signals and overbought/oversold conditions to prompt timely actions.
Usage Tips:
Interpret Signals: Trend direction through buy/sell signals and overbought/oversold trend,- reversal / breakout line conditions for potential trading opportunities.
Session Awareness: Take into account the trading sessions (Tokyo, London, New York) to move along with the market dynamics during different times of the day.
Confirmation: Use additional technical analysis tools to confirm signals before executing trades. For example the Williams Percetange Range indicator.
Risk Management: Trade with proper risk management strategies to avoid potential losses.
HappyTrading
VARGAS"VARGAS" is an indicator that can be used in all timeframes on charts in the stock, crypto, and commodity markets. It allows trades to be opened according to the intersections of moving averages in different time periods.
It is an indicator using weighted moving averages. Using a weighted moving average has the following benefits for traders:
1) Precision and Smoothness: The WMA typically gives more weight to recent prices and therefore reacts faster to more recent data. This helps you catch price movements faster and recognize trend changes faster. On the other hand, the WMA is smoother than the simple moving average (SMA), which makes it less likely to generate false signals.
2) Trend Identification: The WMA is used to identify and analyze price trends. It is especially important for traders who want to track short-term movements. The WMA is used to assess the direction and strength of the trend.
3) Trading Signals: The WMA is used as part of various trading strategies. It is especially used in moving average crossover strategies. For example, a short-term WMA crossing the long-term WMA to the upside can be considered a buy signal, while a reversal can be interpreted as a sell signal.
4) Adaptability to Volatility: WMA can adapt to volatility by changing weighting factors. Investors can adopt a more flexible approach by assigning different weights based on market conditions and asset classes.
5) Data Correction: WMA can be helpful in reducing data noise. A single large price fluctuation can cause the SMA to be more affected, while the WMA reduces the impact of these fluctuations.
In our VARGAS coding, the intersection times of the 9-day and 15-day weighted moving averages allow us to decide the direction of the trend. The green and red cloud areas following the price candles make the strategy easy for the user to follow.
At the intersection between the 9-day weighted moving average and the 15-day weighted moving average, we can use buy and sell signals as follows:
If the 9-day weighted moving average crosses the 15-day weighted moving average upwards, buy,
Sell if the 9-day weighted moving average crosses the 15-day weighted moving average downwards.
Within the scope of this strategy, GOLDEN CROSS and DEATH CROSS intersections, which guide us for trend changes, are also included in the coding. Thus, it is aimed to add strength to our WMA 9 and WMA 15 intersection strategy as an idea.
VARGAS indicator gives better results for longer periods of 4 hours and above. As the time period increases, the probability of correct results will increase.
**
"VARGAS" hisse senedi, kripto, ve emtia piyasalarındaki grafiklerde her türlü zaman diliminde kullanılabilen bir indikatördür. Farklı zaman periyotlarındaki hareketli ortalamaların kesişimlerine göre işlem açılmasını sağlar.
Ağırlıklı hareketli ortalamalar kullanılarak hazırlanmış bir göstergedir. Ağırlıklı hareketli ortalama kullanmanın yatırımcılara aşağıdaki gibi faydaları bulunmaktadır:
1) Duyarlılık ve Pürüzsüzlük: WMA, tipik olarak son dönem fiyatlarına daha fazla ağırlık verir ve bu nedenle daha güncel verilere daha hızlı tepki verir. Bu, fiyat hareketlerini daha hızlı yakalamanıza ve daha hızlı trend değişikliklerini tanımanıza yardımcı olur. Diğer yandan, WMA, basit hareketli ortalamaya (SMA) göre daha pürüzsüzdür, bu da yanlış sinyal üretme olasılığını azaltır.
2) Trend Belirleme: WMA, fiyat trendlerini belirlemek ve analiz etmek için kullanılır. Özellikle kısa vadeli hareketleri izlemek isteyen yatırımcılar için önemlidir. WMA, trendin yönünü ve gücünü değerlendirmek için kullanılır.
3) Ticaret Sinyalleri: WMA, çeşitli ticaret stratejilerinin bir parçası olarak kullanılır. Özellikle hareketli ortalama crossover stratejilerinde kullanılır. Örneğin, kısa vadeli WMA'nın uzun vadeli WMA'yı yukarı yönlü kesmesi bir alım sinyali olarak kabul edilebilir, tersine dönmesi ise bir satış sinyali olarak yorumlanabilir.
4) Volatiliteye Uyarlanabilirlik: WMA, ağırlıklandırma faktörlerini değiştirerek volatiliteye uyum sağlayabilir. Yatırımcılar, piyasa koşullarına ve varlık sınıflarına göre farklı ağırlıklar atayarak daha esnek bir yaklaşım benimseyebilirler.
5) Veri Düzeltme: WMA, veri gürültüsünü azaltmada yardımcı olabilir. Tek bir büyük fiyat dalgalanması, SMA'nın daha fazla etkilenmesine neden olabilirken, WMA bu dalgalanmaların etkisini azaltır.
VARGAS isimli kodlamamızda ise 9 günlük ve 15 günlük ağırlıklı hareketli ortalamaların kesişme zamanları trendin yönüne karar vermemizi sağlar. Fiyat mumlarını takip eden yeşil ve kırmızı bulut alanları stratejinin kullanıcı tarafından kolaylıkla takip edilmesini sağlamaktadır.
9 Günlük Ağırlıklı hareketli ortalama, 15 Günlük Ağırlıklı hareketli ortalama arasındaki kesişimde al ve sat sinyallerini şu şekilde kullanabiliriz:
Eğer 9 günlük ağırlıklı hareketli ortalama 15 günlük ağırlıklı hareketli ortalamayı yukarı doğru kesiyorsa al,
Eğer 9 günlük ağırlıklı hareketli ortalama, 15 günlük ağırlıklı hareketli ortalamayı aşağı doğru keserse sat.
Bu strateji kapsamında trend değişimleri için bizlere yön veren GOLDEN CROSS ve DEATH CROSS kesişimleri de kodlamanın içerisinde dahil edilmiştir. Böylelikle WMA 9 ve WMA 15 kesişim stratejimize fikir olarak güç katması hedeflenmiştir.
VARGAS indikatörü 4 saat ve üzeri daha uzun periyotlarda daha iyi sonuçlar vermektedir. Zaman periyodu büyüdükçe doğru sonuç verme olasılığı artacaktır.

Extreme Trend Reversal Points [HeWhoMustNotBeNamed]Using moving average crossover for identifying the change in trend is very common. However, this method can give lots of false signals during the ranging markets. In this algorithm, we try to find the extreme trend by looking at fully aligned multi-level moving averages and only look at moving average crossover when market is in the extreme trend - either bullish or bearish. These points can mean long term downtrend or can also cause a small pullback before trend continuation. In this discussion, we will also check how to handle different scenarios.
🎲 Components
🎯 Recursive Multi Level Moving Averages
Multi level moving average here refers to applying moving average on top of base moving average on multiple levels. For example,
Level 1 SMA = SMA(source, length)
Level 2 SMA = SMA(Level 1 SMA, length)
Level 3 SMA = SMA(Level 2 SMA, length)
..
..
..
Level n SMA = SMA(Level (n-1) SMA, length)
In this script, user can select how many levels of moving averages need to be calculated. This is achieved through " recursive moving average " algorithm. Requirement for building such algorithm was initially raised by @loxx
While I was able to develop them in minimal code with the help of some of the existing libraries built on arrays and matrix , I also thought why not extend this to find something interesting.
Note that since we are using variable levels - we will not be able to plot all the levels of moving average. (This is because plotting cannot be done in the loop). Hence, we are using lines to display the latest moving average levels in front of the last candle. Lines are color coded in such a way that least numbered levels are greener and higher levels are redder.
🎯 Finding the trend and range
Strength of fully aligned moving average is calculated based on position of each level with respect to other levels.
For example, in a complete uptrend, we can find
source > L(1)MA > L(2)MA > L(3)MA ...... > L(n-1)MA > L(n)MA
Similarly in a complete downtrend, we can find
source < L(1)MA < L(2)MA < L(3)MA ...... < L(n-1)MA < L(n)MA
Hence, the strength of trend here is calculated based on relative positions of each levels. Due to this, value of strength can range from 0 to Level*(Level-1)/2
0 represents the complete downtrend
Level*(Level-1)/2 represents the complete uptrend.
Range and Extreme Range are calculated based on the percentile from median. The brackets are defined as per input parameters - Range Percentile and Extreme Range Percentile by using Percentile History as reference length.
Moving average plot is color coded to display the trend strength.
Green - Extreme Bullish
Lime - Bullish
Silver - range
Orange - Bearish
Red - Extreme Bearish
🎯 Finding the trend reversal
Possible trend reversals are when price crosses the moving average while in complete trend with all the moving averages fully aligned. Triangle marks are placed in such locations which can help observe the probable trend reversal points. But, there are possibilities of trend overriding these levels. An example of such thing, we can see here:
In order to overcome this problem, we can employ few techniques.
1. After the signal, wait for trend reversal (moving average plot color to turn silver) before placing your order.
2. Place stop orders on immediate pivot levels or support resistance points instead of opening market order. This way, we can also place an order in the direction of trend. Whichever side the price breaks out, will be the direction to trade.
3. Look for other confirmations such as extremely bullish and bearish candles before placing the orders.
🎯 An example of using stop orders
Let us take this scenario where there is a signal on possible reversal from complete uptrend.
Create a box joining high and low pivots at reasonable distance. You can also chose to add 1 ATR additional distance from pivots.
Use the top of the box as stop-entry for long and bottom as stop-entry for short. The other ends of the box can become stop-losses for each side.
After few bars, we can see that few more signals are plotted but, the price is still within the box. There are some candles which touched the top of the box. But, the candlestick patterns did not represent bullishness on those instances. If you have placed stop orders, these orders would have already filled in. In that case, just wait for position to hit either stop or target.
For bullish side, targets can be placed at certain risk reward levels. In this case, we just use 1:1 for bullish (trend side) and 1:1.5 for bearish side (reversal side)
In this case, price hit the target without any issue:
Wait for next reversal signal to appear before placing another order :)
