[Sextan] Delta-RSI Oscillator BacktestLevel: 1
NOTE: This is a request by @scantor516 to backtest Delta-RSI Oscillator by tbiktag with my Sextan framework. You can backtest many of my indicators in minutes now! Of course,you can define your own indicator in the highlighted area in compliance with the uniform format, which guarantee when you use "Indicator on Indicator" function, it would not produce any error.
Courtesy of tbiktag for his Delta-RSI Oscillator Strategy
Background
Backtesting of technical indicators and strategies is the most common way to understand a quantitative strategy. However, the complicated configuration and adaptation work of backtesting many quantitative tools makes many traders who do not understand the code daunted. Moreover, although I have written a lot of strategies, I am still not very satisfied with the backtest configuration and writing efficiency. Therefore, I have been thinking about how to build a backtesting framework that can quickly and easily evaluate the backtesting performance of any indicator with a "long/short entry" indicator, that is, a "simple backtesting tool for dummies". The performance requirements should be stable, and the operation should be simple and convenient. It is best to "copy", "paste", and "a few mouse clicks" to complete the quick backtest and evaluation of a new indicator.
Luckily, I recently realized that TradingView provides an "Indicator on Indicator" feature, which is the perfect foundation for doing "hot swap" backtesting. My basic idea is to use a two-layer design. The first layer is the technical indicator signal source that needs to be embedded, which is only used to provide buy and sell signals of custom strategies; the second layer is the trading system, which is used to receive the output signals of the first layer, and filter the signals according to the agreed specifications. , Take Profit, Stop Loss, draw buy and sell signals and cost lines, define and send custom buy and sell alert messages to mobile phones, social software or trading interfaces. In general, this two-layer design is a flexible combination of "death and alive", which can meet the needs of most traders to quickly evaluate the performance of a certain technical indicator. The first layer here is flexible. Users can insert their own strategy codes according to my template, and they can draw buy and sell signals and output them to the second layer. The second layer is fixed, and the overall framework is solidified to ensure the stability and unity of the trading system. It is convenient to compare different or similar strategies under the same conditions. Finally, all trading signals are drawn on the chart, and the output strategy returns. test report.
The main function:
The first layer: "{Sextan} Your Indicator Source", the script provides a template for personalized strategy input, and the signal and definition interfaces ensure full compatibility with the second layer. Backtesting is performed stably in the backtesting framework of the layer. The first layer of this script is also relatively simple: enter your script in the highlighted custom script area, and after ensuring the final buy and sell signals long = bool condition, short = bool condition, the design of the first layer is considered complete. Input it into the PINE script editor of TradingView, save it and add it to the chart, you can see the pulse sequence in yellow (buy) and purple (sell) on the sub-picture, corresponding to the main picture, you can subjectively judge that the quality of the trading point of the strategy is good Bad.
The second layer: "{Sextan} PINEv4 Sextans Backtest Framework". This script is the standardized trading system strategy execution and alarm, used to generate the final report of the strategy backtest and some key indicators that I have customized that I find useful, such as: winning rate , Odds, Winning Surface, Kelly Ratio, Take Profit and Stop Loss Thresholds, Trading Frequency, etc. are evaluated according to the Kelly formula. To use the second layer, first load it into the TrainingView chart, no markers will appear on the chart, since you have not specified any strategy source signals, click on the gear-shaped setting next to the "{Sextan} PINEv4 Sextans BTFW" header button, you can open the backtest settings, the first item is to select your custom strategy source. Because we have added the strategy source to the chart in the previous step, you can easily find an option "{Sextan} Your Indicator Source: Signal" at the bottom of the list, this is the strategy source input we need, select and confirm , you can see various markers on the main graph, and quickly generate a backtesting profit graph and a list of backtesting reports. You can generate files and download the backtesting reports locally. You can also click the gear on the backtest chart interface to customize some conditions of the backtest, including: initial capital amount, currency type, percentage of each order placed, amount of pyramid additions, commission fees, slippage, etc. configuration. Note: The configuration in the interface dialog overrides the same configuration implemented by the code in the backtest script.
How to output charts:
The first layer: "{Sextan} Your Indicator Source", the output of this script is the pulse value of yellow and purple, yellow +1 means buy, purple -1 means sell.
The second layer: PINEv4 Sextans Backtest Framework". The output of this script is a bit complicated. After all, it is the entire trading system with a lot of information:
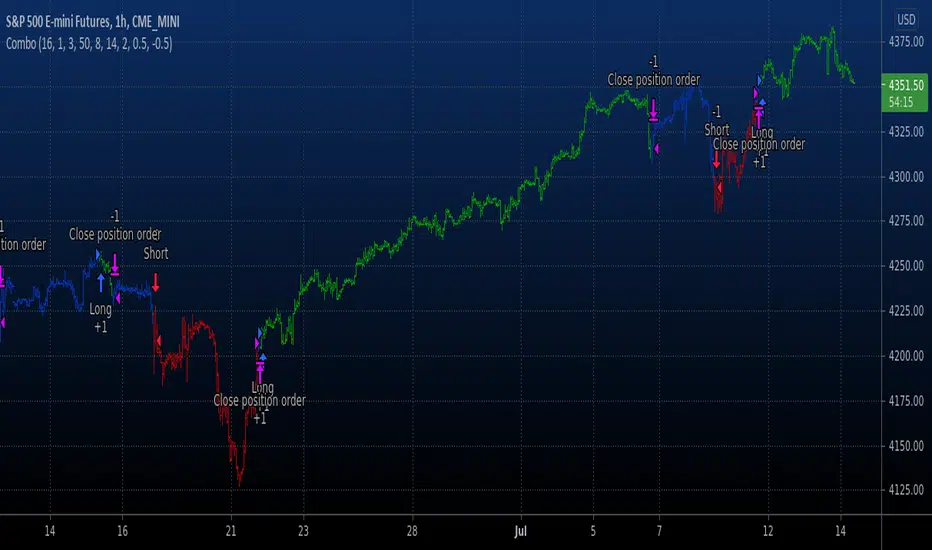
1. Blue and red arrows. The blue upward arrow indicates long position, the red downward arrow indicates short position, and the horizontal bar at the end of the purple arrow indicates take profit or stop loss exit.
2. Red and green lines. This is the holding cost line of the strategy, green represents the cost of holding a long position, and red represents the cost of holding a short position. The cost line is a continuous solid line and the price action is relatively close.
3. Green and yellow long take profit and stop loss area and green and yellow long take profit and stop loss fork. Once a long position is held, there is a conditional order for take profit and stop loss. The green horizontal line is the long take profit ratio line, and the yellow is the long stop loss ratio line; the green cross indicates the long take profit price, and the yellow cross indicates the long position. Stop loss price. It's worth noting that the prongs and wires don't necessarily go together. Because of the optimization of the algorithm, for a strong market, the take profit will occur after breaking the take profit line, and the profit will not be taken until the price falls.
4. The purple and red short take profit and stop loss area and the purple red short stop loss fork. Once a short position is held, there will be a take profit and stop loss conditional order, the red is the short take profit ratio line, and the purple is the short stop loss ratio line; the red cross indicates the short take profit price, and the purple cross indicates the short stop loss price.
5. In addition to the above signs, there are also text and numbers indicating the profit and loss values of long and short positions. "L" means long; "S" means short; "XL" means close long; "XS" means close short.
TradingView Strategy Tester Panel:
The overview graph is an intuitive graph that plots the blue (gain) and red (loss) curves of all backtest periods together, and notes: the absolute value and percentage of net profit, the number of all closed positions, the winning percentage, the profit factor, The maximum trading loss, the absolute value and ratio of the average trading profit and loss, and the average number of K-lines held in all trades.
Another is the performance summary. This is to display all long and short statistical indicators of backtesting in the form of a list, such as: net profit, gross profit, Sharpe ratio, maximum position, commission, times of profit and loss, etc.
Finally, the transaction list is a table indexed by the transaction serial number, showing the signal direction, date and time, price, profit and loss, accumulated profit and loss, maximum transaction profit, transaction loss and other values.
Remarks
Finally, I will explain that this is just the beginning of this model. I will continue to optimize the trading system of the second layer. Various optimization feedback and suggestions are welcome. For valuable feedback, I am willing to provide some L4/L5 technical indicators as rewards for free subscription rights.
Recherche dans les scripts pour "oscillator"

TFS Volume Oscillator Noise FilteredINTRODUCTION
This indicator is inspired from " HPotter’s TFS: Volume Oscillator " but I have used Heiken Ashi and Hull Moving Average in calculations in order to reduce noise for better trades.
The concept is similar to that of On-Balance Volume indicator (OBV). It is calculated according to these rules:
If Heiken Ashi Close > Heiken Ashi Open, Volume is positive
If Heiken Ashi Close < Heiken Ashi Open, Volume is negative
If Heiken Ashi Close = Heiken Ashi Open, Volume is neutral
BAR COLORS
Green Color:
Strong Uptrend with good volume supported momentum.
Faded Green Color:
Volume is relatively weakening.
Red Color:
Strong Downtrend with volume support.
Gray Color:
Downtrend negative volume is relatively weakening.
DEFAULTS SETTINGS
Volume length is 30 (Better for timeframes higher than 1H)
Hull Moving Average length is 14 but Linear Regression Curve can be selected with same length

Chaikin Volume Accumulation Oscillator (VAO)The Volume Accumulation Oscillator is a volume momentum indicator developed by Mark Chaikin (177E, 77th Street, New York, NY
10021). Their simplest form is a sliding sum of daily volumes divided by the difference between the daily closing price and the midpoint of the daily price range.
It is a sensitive short term oscillator, the values of which are obtained by subtracting the value of the previous day of its own ESS from the cumulative sum of the cumulative volume
length of 2 days (for the purpose of normalization, the result is then divided by the value 2-day ESS for the previous day)
Analysis of historical data shows that volume accumulation indicator can be an effective tool, especially on Long
positions.

KINSKI Flexible Volume OscillatorThe Volume Oscillator is a trend-oriented indicator that shows the strength or weakness of price trends. This indicator calculates the volume from two moving averages (MA). The value of the slow volume MA is then subtracted from the value of the fast moving average. The Volume Oscillator measures volume by analyzing the relationship between these two moving averages.
The special feature of this indicator is that the type of moving average can be selected as the basis for calculation. Currently, it is possible to choose between the following MA variants:
"COVWMA", "DEMA", "EMA", "EHMA", "FRAMA", "HMA", "KAMA", "RMA", "SMA", "SMMA", "VIDYA", "VWMA", "WMA".
Upward and downward movements are represented in different colors. The following color variants are available:
Color green: Strong upward trend
Color green/dark: weakening upward trend
Color red: strong downward trend
Color red/dark: weakening downward trend
The colors, as well as the style can be adjusted in the settings according to your own needs.

Combo Backtest 123 Reversal & SMI Ergodic Oscillator This is combo strategies for get a cumulative signal.
First strategy
This System was created from the Book "How I Tripled My Money In The
Futures Market" by Ulf Jensen, Page 183. This is reverse type of strategies.
The strategy buys at market, if close price is higher than the previous close
during 2 days and the meaning of 9-days Stochastic Slow Oscillator is lower than 50.
The strategy sells at market, if close price is lower than the previous close price
during 2 days and the meaning of 9-days Stochastic Fast Oscillator is higher than 50.
Second strategy
The SMI Ergodic Indicator is the same as the True Strength Index (TSI) developed by
William Blau, except the SMI includes a signal line. The SMI uses double moving averages
of price minus previous price over 2 time frames. The signal line, which is an EMA of the
SMI, is plotted to help trigger trading signals. Adjustable guides are also given to fine
tune these signals. The user may change the input (close), method (EMA), period lengths
and guide values.
WARNING:
- For purpose educate only
- This script to change bars colors.
Volume Zone Oscillator and Price Zone Oscillator (VZO/PZO)Credits go to @NeoButane as basis is taken from his open-source code and I modified it - changes described below.
Usage:
Positive -> bullish, negative -> bearish
-60/60 is seen as the limit of the oscillator range, and a pullback should be expected from there
-40/40 are in general Oversold/Overbought levels
Modifications:
added alerts
added Divergences formula
added additional types of smoothing
added signal display based on described above usage (extreme levels of oscillations and bounce back)
Uber Oscillator with DivergencesThis is a simple mod of the Uber Oscillator with more periods added to the mix and combined with a the Tradingview Divergence spotter.
Compare it to the standard Ultimate Oscillator and see the difference. Good to even overlay them even.
It basically just adds more detail. You won't always need it but sometimes it can catch big drops/peaks earlier then the standard AO while still retaining relative relaxedness during other periods.

Ultimate Trader Oscillator - UTO v1Note; this is experimental / learning work -- has nothing to do with the existing "Ultimate Oscillator" -- i call this project UTOpia :)
This is based on some research work i was doing around the Balance Of Power - which i posted about in the past
the conclusion form there was a questions of, what would we get if we create an indicator that takes into consideration other factors that may be affecting momentum - so while the classic Balance of Power formula looks at where the open and close of a bar are compared to the full bar range, this is only a small part of the insight we need - when we visually inspect a price chart, we also look at many other factors. for example, how the bar closes compared to previous bar(s), how much did the bulls (or bears) managed to move the high (or low) of the bar compared to previous one, how much volume, how is the price spread ...etc
so i wanted to build an indicator that does exactly that - we will give a score of +100 / -100 to each bar based on these factors (some were identified in the linked post) -- imagine here that we are a judge in a tug of war contest (or a beauty contest if you would :)) and we give a score to the participating teams - the scores are given in different "categories" as these teams make effort to win the game (each bar) - to be totally fair, in some scoring categories, we choose to take the average of 3 points for a fair assessment - the final score is calculated based on the average from all judges - and then and average over the desired length is calculated. this score should be very fair and represents the true effort from all angles, right? that would be our UTOPIA :)
in our case, we don't use an average of total score after each category is evaluated, but rather create a directional index (similar to RSI) -- so we can avoid big spikes in the resulting numbers, and maintain a oscillator -like result.
-- the code is commented to explain the various pieces - and how the scoring happen.
the results are interesting - and you can see how the UTO stacks against the classic RSI and BoP - but it's more of a work to build on, rather than a usable indicator - although i do use it in my own trading :)
one final thought here, i came to learn after few years that the best indicators do not necessarily lead to profitable trading. from an indicator standpoint, if everyone else is trading using (for example) a moving average crossover or RSI, then a successful trader should be looking at these classic indicators too, cause these common indicators will drive the mass behavior - and will at many times trigger "self- fulfilling prophesies" in price action - but that's not the only or the biggest reason - the big reasons have to do with the fact that trading needs a lot of effort outside the charts, in researching markets, learning the discipline, then managing positions and managing the portfolio. these are all big topics to put in such short words.
i hope some will find this work inspiring.
RedK_AvgMoneyFlow Oscillator v1This is a compact & simple study that tracks the short-term average price change and the (average) volume associated with it, to generate a very clear signal when a change of buying/selling flow is detected. these buy/sell cycles can happen within a longer "demand / trend-up" or "supply / trend down" phases as we know.
this concept is a bit different from MFI or CMF. The math we use here is simpler, and more "relative" and short-term focused, deliberately.
how does it work
===============
once the average price change and the average volumes are calculated for the specified length, we then turn that into a +100/-100 oscillator format - using the stoch() function - which helps to generate a clearly identifiable unambiguous signal (crossing the zero line up or down) that help traders (mainly with entries)
-- the stoch() function also makes the oscillator "relative" to the specified period length, meaning, we can be in a uptrend (demand mode) and the MFO is showing flow "out" (negative) - that's specific to the short-term period - and that's exactly what i was trying to see
- the thinking here is that the best spot to go long is when the existing selling has been depleted and no more supply exists (during an uptrend), and vice verca.
- other stuff: i use WMA() throughout the script -- and we apply a smoothing for the final plot. keep smoothing to a minimum to avoid unnecessary lag in the signals
- the signal should be considered *after* a bar is fully closed.
Suggested Use
==============
i suggest you use this in combination with other indicators that can show the overall short-term and long-term bias (for example, i use the Ribbon here for that) - and take only entry signals in the same direction - a signal to go long, for example, would be when the bias / trend is up *and* the MFO crosses the zero line *going up* .. you may need to wait for that setup to show before you hit the trigger.
another benefit here, is that MFO will also detect strengths and weaknesses - when we see diversion with price movement. this shows couple of times in the example below
Please Note
============
i do not do short-term trading / scalping - those who do, i hope may find this useful - if you decide to use it and you do find it useful, please post feedback here for the common learning
Good luck!

[RS][UCS]Murrey's Math Oscillator ModificationExperimental:
modifications includes 2 extra channel types to read volatility's range.
this is a update and modification to the Murrey's Math Lines Oscillator published by UCSgears here:
Mass Thrust OscillatorThis is a custom indicator that turns my Mass Thrust Indicator into an oscillator which is loosely based on Tushar S. Chande's Market Thrust Oscillator (Stocks & Commodities V. 10:8 (347-350))
Let me know if you would like a custom script or if you want to see me publish any other indicators!

1337 OscillatorThis script is inspired by the Awesome Oscillator by Bill Williams. The 1337 Oscillator uses a faster and more reactive hull moving average.
Signals could be from the 0 line crosses or rising/falling.

Price/Volume Normalized OscillatorIt can be interesting to have an indicator displaying two rescaled measures, thus ending with an indicator that allow the creation of more complex trading rules (conditions), this is what is intended with the price/volume normalized oscillator (PVNO) who normalize both volume and price in order to display them together.
Volume is considered an important factor as it show the trading activity of a security, securities with higher volume are more attractive to trade as higher volume is in general present with larger price variations, higher volume can also indicate a better trade execution.
THE INDICATOR
In the PVNO, the rescaled volume is represented by the blue plot while the rescaled price is represented by the (green/red) plot. The rescaling method used here is simply based on the sum of the current and past momentum output of a series of observations divided by the sum of the current and past absolute value of this momentum, this allow to have a smooth output with values reaching 1 and -1 instead of converging toward 0.
The indicator has two settings, Volume Length who control the length of the sum of the rescaled volume, while Price Length control the sum length of the rescaled price. When the rescaled volume is positive it means that the sum of the current and past Volume Length - 1 positive volume momentum values is greater than the sum of negative ones, this indicate a more active market. The same apply to the rescaled price, with a positive rescaled price value indicating an uptrend and negative values indicating a downtrend.
Because of the stationary and periodic nature of volume, low values for Volume Length are recommended.
INTERPRETATIONS AND USAGES
As you can see the rescaled price plot can have two colors, and the area between the rescaled volume and price plot is filled with two possible colors as well, the color depend on the following simple condition:
green: once rescaled price > 0 and rescaled volume > 0 until condition for red don't happen
red: once rescaled price < 0 and rescaled volume > 0 until condition for green don't happen
Therefore no signals are triggered if the rescaled price is greater/lower then 0 but the rescaled volume is lower than 0, this could allow to filter various false signals (at the cost of reactivity). A more interesting use-case of the indicator can be based on the upper and lower constant levels displayed in order to spot points where volume will fall or rise.
Volume can also be used to spot potential reversals, therefore the levels can also be used to this end as well.
SUMMARY
A normalized oscillator plotting rescaled price and volume values has been presented, the indicator posses its own trading rules but can easily modified. This is not an indicator i'am super proud of, even after passing some time on it lol. You can use the code freely without asking for permission, mention is appreciated.
Next indicators should be more pertinent and interesting, thanks for reading !

DT-OscillatorThis is Robert C. Miner's DT Oscillator, a version of the Stochastics & RSI.
See his book, High Probability Trading Strategies
There are four possible parameter combinations for this indicator:
8,5,3,3 Monthly,Weekly,Daily
13,8,5,5 Weekly,Daily,H4
21,13,8,8 Daily,H4,H1
34,21,13,13 H4,H1,M15

Premium Stochastic OscillatorThe PSO is a rewired version of a short-period stochastic. Unlike a standard stochastic oscillator, this indicator is normalized to register neutral values at zero while providing greater sensitivity to short-term price moves. This indicator uses a central zero line as a reference point and will oscillate above and below this point as price fluctuates. In addition, the PSO is smoothed by using a double exponential moving average to provide a more even response to turns in the market.
(from TASC magazine, August 2008 issue).
The Premium Stochastic Oscillator was introduced by technical analyst Lee Leibfarth.

Reflex Oscillator - Dr. John EhlersHot off the press, I present this NEW "Reflex Oscillator" employing PSv4.0, originally formulated by Dr. John Ehlers for TASC - February 2020 Traders Tips. John Ehlers might describe it's novel characteristics as being a reversal sensitive near zero-lag averaging indicator retaining the CYCLE component. Also, I would add that irregardless of the sampling interval, this indicator has a bound range between +/-2.0 on "1 second" candles all the way up to "1 month" candle durations. This indicator also has a companion indicator entitled "TrendFlex Oscillator". I have published it in tandem with this one in my scripts profile.
One notable difference between this and the original formulation is that I have added an independent control for the Super Smoother. This "tweak" is enabled by applying the override and adjusting it's period. There is a "Post Smooth" input() that "tweaks" the internal Reflex EMA too. Keep in mind that my intention of adding tweaks is solely for experimentation with the original formulation.
I also added adjustable levels for those of you that may wish to employ alertcondition()s to this indicator somehow. Providing a more utilitarian approach, I created this with an easy to use reusable function named reflex(). As always, I have included advanced Pine programming techniques that conform to proper "Pine Etiquette". Being this is one of John Ehlers' first two simultaneously released indicators for 2020, I felt a few more bells and whistles were appropriate as a proper contribution to the Tradingview community.
Features List Includes:
Dark Background - Easily disabled in indicator Settings->Style for "Light" charts or with Pine commenting
AND much, much more... You have the source!
The comments section below is solely just for commenting and other remarks, ideas, compliments, etc... regarding only this indicator, not others. When available time provides itself, I will consider your inquiries, thoughts, and concepts presented below in the comments section, should you have any questions or comments regarding this indicator. When my indicators achieve more prevalent use by TV members, I may implement more ideas when they present themselves as worthy additions. As always, "Like" it if you simply just like it with a proper thumbs up, and also return to my scripts list occasionally for additional postings. Have a profitable future everyone!

PVT Osc - Price Volume Trend Oscillator [UTS]The oscillator version of the Price Volume Trend indicator (PVT) can be considered as a leading indicator of future price movements. The PVT Indicator is similar to the On Balance Volume indicator as it is also used to measure the strength of a trend.
The difference between the OBV and the PVT is that where the OBV adds all volumes when price achieves higher daily closes and subtracts them when price registers a lower daily close, the PVT adds or subtracts only a portion of the volume from the cumulative total in relation to a percentage change in price.
The general market consensus is that this difference enables the PVT to more accurately represent money flow volumes in and out of a stock or commodity.
The PVT has been designed so that it is capable of forecasting directional changes in price. For instance, if the price of a stock is rising and the PVT begins to fall, then this is indicative that a price reversal could occur very soon.
The general consensus is that the PVT is more accurate at detecting new trading opportunities than the OBV because of the differences in their construction. The OBV is designed so that it adds the same amount of volume whether the price closes upwards by just a small fraction or by multiples of its day opening value. On the other hand, the PVT adds volume proportional to the amount the price closed higher.
General Usage
Plain old PVT can be used to confirm trends, as well as spot possible trading signals due to divergences.
A benefit of the oscillator version is that it can produce LONG or SHORT signals on zero line cross.
Or controversy, disallow LONG trades in bearish territory and disallow SHORT trades in bullish territory.
Moving Averages
4 different Moving Averages are available:
EMA (Exponential Moving Average)
SMA (Simple Moving Average)
VWMA (Volume Weighted Moving Average)
WMA (Weighted Moving Average)

Complex Oscillator [-W-]Eng.
Tradingview in the free version has a limitation - you can only use three indicators on the chart.
Complex Oscillator indicator combines several indicators in one, it is:
- RSI
- Stochastic
- WPR (%R)
- Volumes
The first three are chosen because their values are in the range |0-100| and one scale can be used for them.
The volumes are added because I personally feel sorry to allocate one of the three available places for them. =)
It is much more convenient to use them together with some other indicator.
Volumes also in the range 0-100, that is, they will not show the real numerical value, but only the value relative to the previous volumes.
You can display all the indicators at once or only a few of them.
The chart above shows the same indicator in three different variations.
If you know any other standard indicators with values in the range |0-100|, write in the comments, I will add to this indicator.
Rus.
Tradingview в бесплатной версии имеет ограничение - вы можете использовать только три индикатора на графике.
Индикатор Complex Oscillator объединяет несколько индикаторов в одном, это:
- RSI
- Stochastic
- WPR (%R)
- Volumes
Первые три выбраны из-за того, что их значения лежат в диапазоне |0-100| и для них можно использовать одну шкалу.
Объёмы добавлены, потому что лично мне жалко выделять для них одно из трёх доступных мест. =)
Намного удобнее использовать их вместе с каким-нибудь другим индикатором.
Объёмы относительные, тоже лежат в диапазоне 0-100, то есть реальное численное значение они не покажут, а только величину относительно предыдущих объёмов.
Вы можете вывести показания сразу всех индикаторов или только нескольких из них.
На графике выше представлен один и тот же индикатор в трёх разных вариациях.
Если вы знаете ещё какие-нибудь стандартные индикаторы со значениями в интервале |0-100|, напишите в комментариях, я добавлю в этот индикатор.

Projection Oscillator - Mel Widner, Ph.D.For any Mel Widner, Ph.D fans out there, I present this decades old "Projection Oscillator" employing PSv4.0, originally formulated by Mel Widner for TASC - July of 1995 Traders Tips. Just when you may have thought it was the end of the evolutionary line for Mel Widner technology, it's not! Basically it's a hybridization of linear regression, banding, and a stochastic rolled into one. It's purpose is intended to help identify reversal points.
While working on another member's project, I discovered other implementations on TV and a few scarcely found on the internet, they are not entirely correct and not in a package like this. I'm submitting this as a complimentary indicator for their trading system AND also for the TV community for hybridized indicator evolution. My implementation is a heavily modified version of the original indicator using novel techniques, surpassing Widner's original intended design.
Utilizing the "Power of Pine", I included the maximum amount of features I could surmise in an ultra small yet impressive package. Configurations are displayed above in multiple scenarios that should be suitable for most traders. Of notable mention, the original design was a range from 0-100 just like any other stochastic, but I rescaled the oscillator more towards a zero mean unity scale(+/-1.0), while still leaving the waveforms completely intact.
Features List Includes:
Dark Background - Easily disabled in indicator Settings->Style for "Light" charts or with Pine commenting
AND much, much more... you have the source!
For those of you who are new to Pine Script, this script also may help you understand advanced programming techniques in Pine and how they may be utilized in a most effective manner. I would like to see Tradingview become the go to platform for the best indicators attainable with this contribution to the TV community. This is commonly what my dense intricate code looks like behind the veil. If you are wondering why there is no notes, that's because the notation is in the variable naming. If you wish to contribute additional ideas, please do so below in the comments about all things Pine in regards to this indicator.
NOTICE: Copy pasting bandits who may be having nefarious thoughts, DO NOT attempt this, because this may violate Tradingview's terms, conditions and/or house rules regarding publishing and "fair" reuse of code. "WE" are always watching the TV community vigilantly for mischievous behaviors and actions that exploit well intended authors for the purpose of unscrupulously increasing brownie points in reputation scores. Hiding behind a "protected" wall may not protect you from investigation and account penalization by TV staff. Be respectful, and don't just throw a meaningless feature in there, then branding it as "your" gizmo if you reuse this code for publishing another indicator. Fair enough? Alrighty then... I firmly believe in "innovating" future state-of-the-art indicators, and please contact me if you wish to do so.
The comments section below is solely just for commenting and other remarks, ideas, compliments, etc... regarding only this indicator, not others. When available time provides itself, I will consider your inquiries, thoughts, and concepts presented below in the comments section if you do have any questions or comments regarding this indicator. When my indicators achieve more prevalent use by TV members, I may implement more ideas when they present themselves as worthy additions. As always, "Like" it if you simply just like it with a proper thumbs up, and also return to my scripts list occasionally for additional postings. Have a profitable future everyone!
John Ehlers Universal Oscillator [mwlang]This version of John Ehlers Universal Oscillator fixes a degrees to radians bug in LazyBear's version published here:
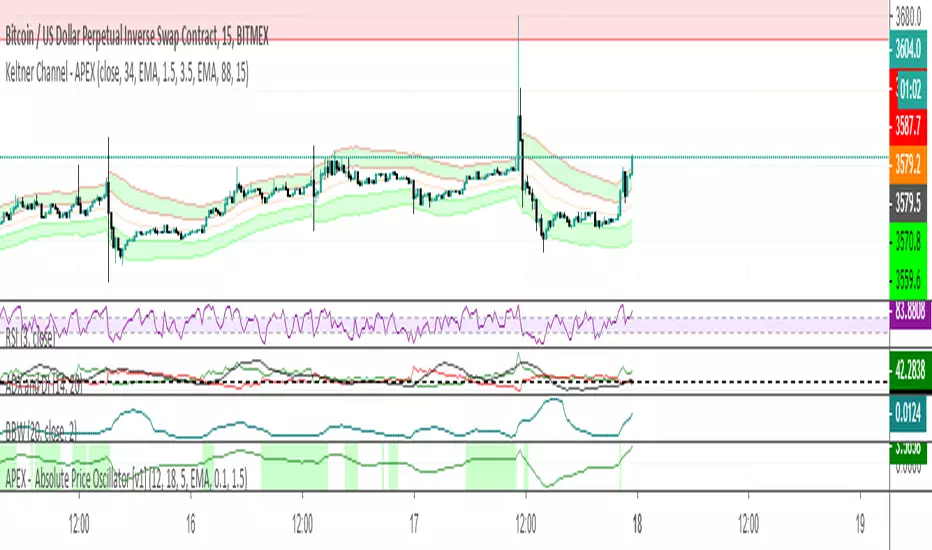
APEX - Absolute Price Oscillator [v1]The Absolute Price Oscillator is calculated as a difference of two moving averages of an asset and is expressed as an absolute value. It rates the strength of the trend. This Oscillator can be used primarily as a filter for stronger trends or for coin specific strategies.
Values are a coin and Moving average base specific.
[astropark] MACD, RSI+, Awesome Oscillator, DMI, ADX, OBV//******************************************************************************
// Copyright by astropark v4.0.0
// MACD, RSI+, Awesome Oscillator, DMI, ADX, OBV
// 24/10/2018 Added RSI with Center line to have clear glue of current trend
// 10/12/2018 Added MACD
// 13/12/2018 Added multiplier for MACD in order to make it clearly visible over RSI graph
// 11/01/2019 Added Awesome Oscillator (AO)
// 11/01/2019 Added Directional Movement Index (DMI) with ADX
// 14/01/2019 Added On Balance Volume (OBV)
//******************************************************************************

WaveTrend Oscillator (Dark Mode) [Krypt]My WaveTrend Oscillator indicator optimized for dark backgrounds. The light mode is available here:
