On Balance Volume Oscillator Strategy [QuantNomad]Looking for the way to use OBV Oscillator in a strategy.
Here is my first try. I just enter to position of a cross of 2 emas based on OBV.
Here is my original oscillator indicator:
Recherche dans les scripts pour "oscillator"

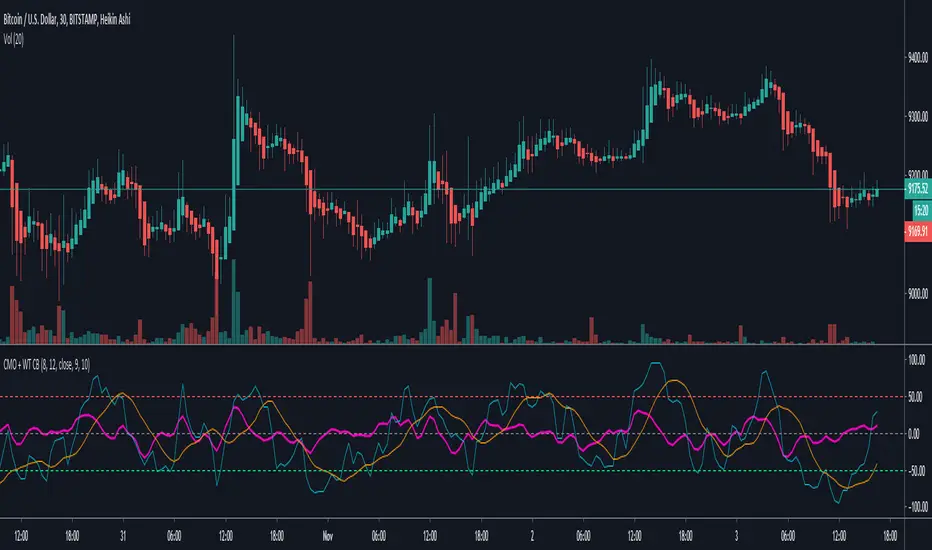
Chande Momentum Oscillator + WaveTrend Oscillator [ChuckBanger]This is a combination of Lazybears WaveTrend Oscillator (purple line) and Chande Momentum Oscillator (blue line with the orange line as a signal line). Use WaveTrend as a confirmation tool. It is consider as a selling point when CMO is over the red horizontal dotted line. The opposite applies if CMO line is under the red horizontal dotted line.
You can also use this with WaveTrand to confirm the sell or buy point. When WT line is over center line and CMO has crossed over it's signal line. It is a buy point. The opposite applies if WT line is under the center line and CMO is under its signal line.
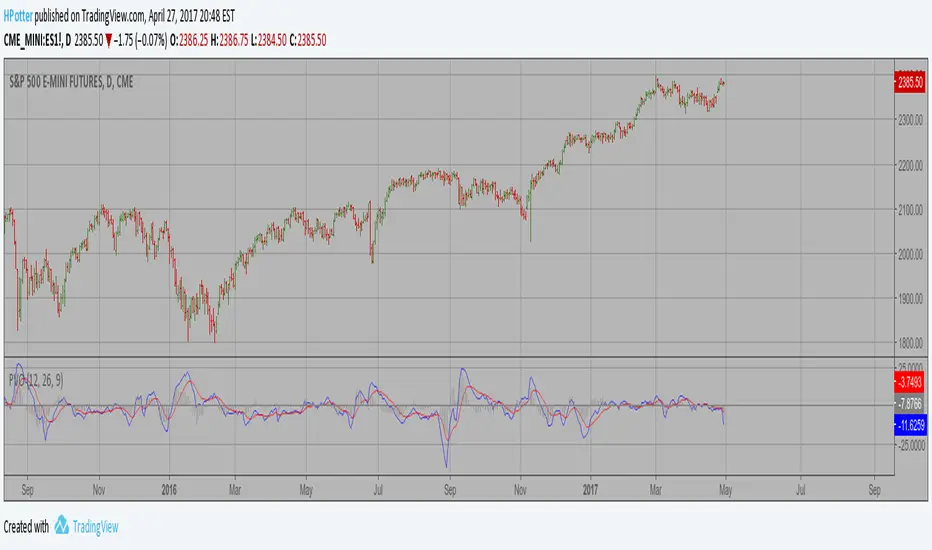
Percentage Volume Oscillator (PVO) Copyright by HPotter v1.0 28/04/2017
The Percentage Volume Oscillator (PVO) is a momentum oscillator for volume.
PVO measures the difference between two volume-based moving averages as a
percentage of the larger moving average. As with MACD and the Percentage Price
Oscillator (PPO), it is shown with a signal line, a histogram and a centerline.
PVO is positive when the shorter volume EMA is above the longer volume EMA and
negative when the shorter volume EMA is below. This indicator can be used to define
the ups and downs for volume, which can then be use to confirm or refute other signals.
Typically, a breakout or support break is validated when PVO is rising or positive.
Ehlers Center of Gravity Oscillator [LazyBear]As part of my "Ehler's Indicators week", here's one more.
CG Oscillator, by John Ehlers, provides a smoothed, essentially zero lag oscillator for identifying market turning points. The "CG" in the name of the oscillator refers to "Center Of Gravity" of the prices over the window of observation.
Entry/Exit are based on the osc/signal crossovers. Enabling the "Color bars" options helps in easily identifying crossovers.
More info:
- CG osc (pdf): www.mesasoftware.com
- TASC Article: traders.com
- Cybernetic Analysis for Stocks and Futures (Ehlers, 2004)
List of my public indicators: bit.ly
List of my app-store indicators: blog.tradingview.com

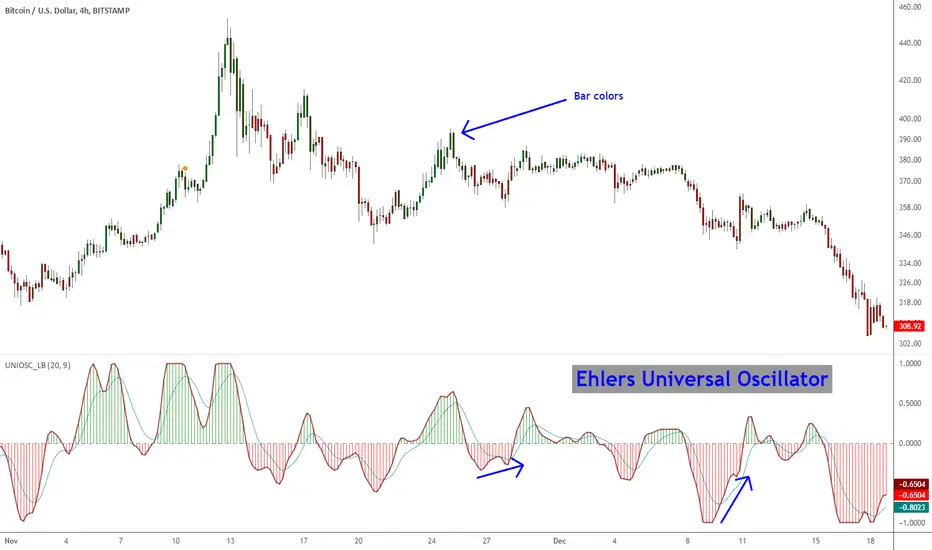
Ehlers Universal Oscillator [LazyBear]Universal Oscillator by Mr. Ehlers is an evolution of his SuperSmoother filter. The new indicator follows the swings in price without introducing extra delay.
It is controlled through one single input – the band edge – which basically is frequency. The smaller it is set, the less lag there is, but you may see lot of whipsaws. Built-in automatic gain control normalizes the output to vary between the range of -1 to +1.
Mr. Ehlers suggests a straightforward system:
- Buy when long-term Universal Oscillator crosses above zero
- Sell when long-term Universal Oscillator crosses below zero
I have added options to draw a signal line, histogram and bar coloring. Bar coloring, if enabled, is done using the histogram color, but you can change it easily to signal_cross by uncommenting a line (check the source).
More info:
Whiter is Brighter - Ehlers
List of my other indicators:
- GDoc: docs.google.com
- Chart:
Vervoort Heiken Ashi Candlestick OscillatorHeiken-Ashi Candlestick Oscillator (HACO), by Sylvian Vervoort, is a digital oscillator version of the colored candlesticks.
Explanation from Vervoort:
"HACO is not meant to be an automatic trading system, so when there is a buy or sell signal from HACO, make sure it is confirmed by other TA techniques. HACO will certainly aid in signaling buy/sell opportunities and help you hold on to a trade, making it more profitable. The behavior of HACO is closely related to the level and speed of price change. It can be used on charts of any time frame ranging from intraday to monthly."
HACO has 2 configurable length parameters - "UP TEMA length" and "Down TEMA length". Vervoort suggests having them the same value.
I have also added an option to color the bars (overlay mode).
More info:
Trading with the Heiken-Ashi Candlestick Oscillator - Sylvian Vervoort
List of my other indicators:
- GDoc: docs.google.com
- Chart:

Indicators: Hurst Bands and Hurst OscillatorThese 2 indicators are derivative work from Jim Hurst's book - "The Magic of Stock Transaction Timing".
The bands are % bands around a median that gets calculated according to Hurst's formula. The outer bands (called ExtremeBands) signify extreme overbought/oversold conditions. Inner bands signify potential pullback points. As you can see, they also act as dynamic S/R levels.
The oscillator bands match the bands overlaid on price, so you will get an excellent indication of where the price is gonna do by using the oscillator along with the bands. Note that Hurst Oscillator can be used separately too, there is no technical dependency on Hurst Bands.
More info on Hurst Method:
www.readtheticker.com

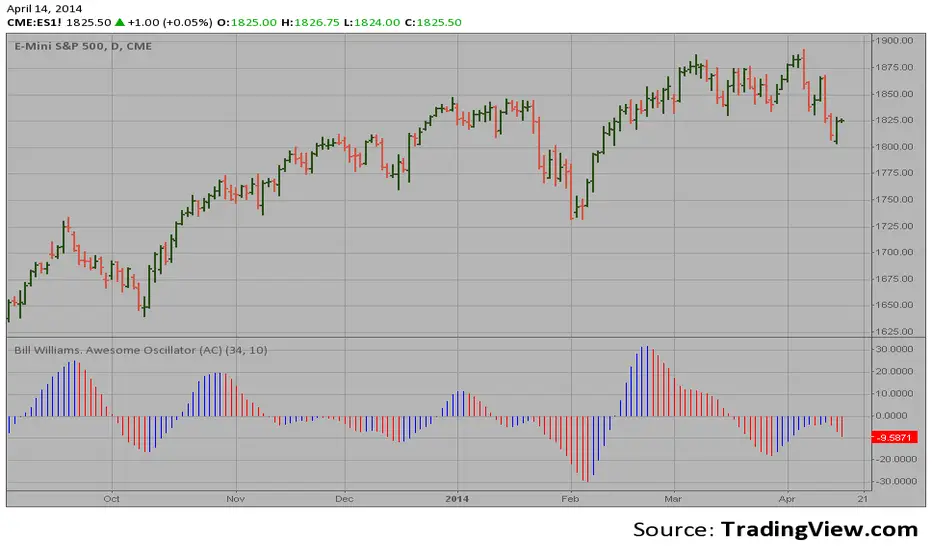
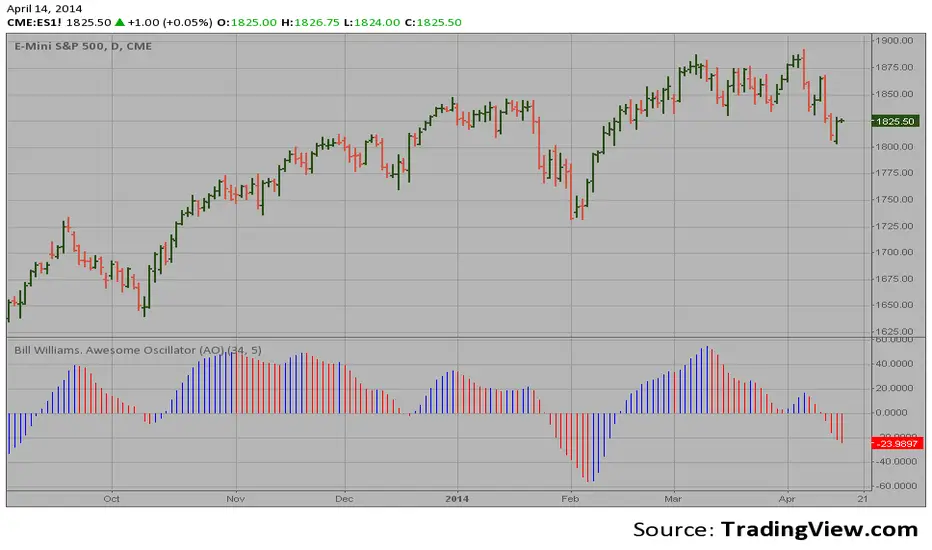
Bill Williams. Awesome Oscillator (AC)Hi
Let me introduce my Bill Williams. Awesome Oscillator (AC) script.
This indicator plots the oscillator as a histogram where blue denotes
periods suited for buying and red . for selling. If the current value
of AO (Awesome Oscillator) is above previous, the period is considered
suited for buying and the period is marked blue. If the AO value is not
above previous, the period is considered suited for selling and the
indicator marks it as red.
Bill Williams. Awesome Oscillator (AO) Hi
Let me introduce my Bill Williams. Awesome Oscillator (AO) script.
This indicator is based on Bill Williams` recommendations from his book
"New Trading Dimensions". We recommend this book to you as most useful reading.
The wisdom, technical expertise, and skillful teaching style of Williams make
it a truly revolutionary-level source. A must-have new book for stock and
commodity traders.
The 1st 2 chapters are somewhat of ramble where the author describes the
"metaphysics" of trading. Still some good ideas are offered. The book references
chaos theory, and leaves it up to the reader to believe whether "supercomputers"
were used in formulating the various trading methods (the author wants to come across
as an applied mathemetician, but he sure looks like a stock trader). There isn't any
obvious connection with Chaos Theory - despite of the weak link between the title and
content, the trading methodologies do work. Most readers think the author's systems to
be a perfect filter and trigger for a short term trading system. He states a goal of
10%/month, but when these filters & axioms are correctly combined with a good momentum
system, much more is a probable result.
There's better written & more informative books out there for less money, but this author
does have the "Holy Grail" of stock trading. A set of filters, axioms, and methods which are
the "missing link" for any trading system which is based upon conventional indicators.
This indicator plots the oscillator as a histogram where periods fit for buying are marked
as blue, and periods fit for selling as red. If the current value of AC (Awesome Oscillator)
is over the previous, the period is deemed fit for buying and the indicator is marked blue.
If the AC values is not over the previous, the period is deemed fir for selling and the indicator
is marked red.
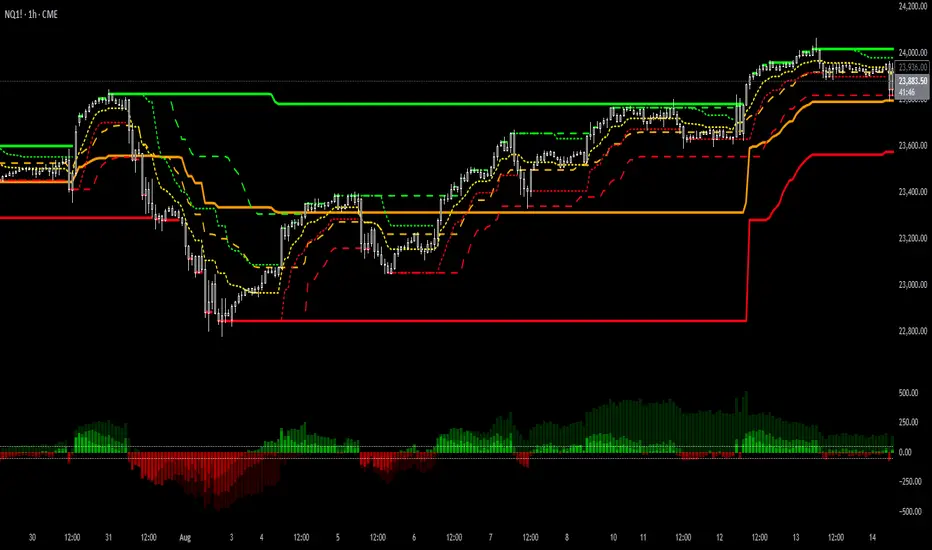
Supertrend Channel Histogram OscillatorThis histogram is based on the script "Supertrend Channels "
The idea of the indicator is to visually represent the interaction of price with several different supertrend channels of various lengths in an oscillator in order to make it much more clear to the trader how the longer trends are interacting with shorter trends of the price movement of an asset. I got this idea from the "Kurutoga Cloud" and "Kurutoga Histogram" by D7R which is based on the centerlines of 3 Donchian Channels, however after I started using the Supertrend Channel by LuxAlgo I found that it was a more reliable price range channel than a standard Donchian Channel and I made this indicator to accompany it.
This indicator plots a positive value above 0 when the price is above the centerline of the supertrend channel and a negative value below 0 when the price is below the centerline.
The first supertrend's length and multiple can be adjusted in the settings.
The given supertrend input is then doubled and quadrupled in both length and multiplication so that a supertrend histogram with the values of 3, 3 will be accompanied by 2 additional supertrend histograms with the values of 6, 6 and 12, 12.
The larger price trend histograms are clearly visible behind the short term supertrend channel's histogram, giving traders a balanced view of short and long term trends interacting. The less visible columns of the larger trend remain above or below the 0 line behind the more visible short term channel trend, helping to spot pullbacks within a larger trend.
Additionally, when the 3 separate histograms are all positive or all negative but the histogram columns are separating from each other this can indicate a potential trend exhaustion leading to reversal or pullback about to happen.
The overbought and oversold lines at 50 and -50 are representative primarily of the short term trend with above 50 or below -50 indicating that the price is pushing the boundary and potentially beginning a new short term supertrend in the opposite direction. If values do not noticably exceed these levels, then the current short term trend movement can be viewed as a pullback within a larger trend, with continuation potentially to follow.
I have had troubles converting the original code to v6 so this will be published here in v5 of pinescript to be used in conjunction with the original. I was intending to create a companion indicator for this oscillator that represents 3 supertrends with corresponding 2x and 4x calculations based on LuxAlgo's script, but I can't seem to get it to work correctly in v5.
For best visualization of the trends 3 LuxAlgo Supertrend channels with 2x and 4x values should be used in conjunction with each other to fully visualize the histogram.
Used in conjunction with other indicators this can be a very effective strategy to capture larger trend moves and pullbacks within trends, as well as warn of potential price trend exhaustion.
EMA Range OscillatorEMA Range Oscillator (ERO) - User Guide
Overview
The EMA Range Oscillator (ERO) is a technical indicator that measures the distance between two Exponential Moving Averages (EMAs) and the distance between price and EMA. It normalizes these distances into a 0-100 range, helping traders identify trend strength, market momentum, and potential reversal points.
Components
Main Line
Green Line: EMA20 > EMA50 (Uptrend)
Red Line: EMA20 < EMA50 (Downtrend)
Histogram
White Histogram: Price distance from EMA20
Key Levels
Upper Level (80): High divergence zone
Middle Level (50): Neutral zone
Lower Level (20): Low divergence zone
Parameters
ParameterDefaultDescriptionFast EMA20Short-term EMA periodSlow EMA50Long-term EMA periodNormalization Period100Lookback period for scalingUpper80Upper threshold levelLower20Lower threshold level
How to Read the Indicator
High Values (Above 80)
Strong trend in progress
EMAs are widely separated
High momentum
Potential overbought/oversold conditions
Watch for possible trend exhaustion
Low Values (Below 20)
Consolidation phase
EMAs are close together
Low volatility
Potential breakout setup
Range-bound market conditions
Middle Zone (20-80)
Normal market conditions
Moderate trend strength
Balanced momentum
Look for directional clues from color changes

50-Line Oscillator // (\_/)
// ( •.•)
// (")_(")
25-Line Oscillator
Description:
The 25-Line Oscillator is a sophisticated technical analysis tool designed to visualize market trends through the use of multiple Simple Moving Averages (SMAs). This indicator computes a series of 26 SMAs, incrementally increasing the base length, providing traders with a comprehensive view of price dynamics.
Features:
Customizable Base Length: Adjust the base length of the SMAs according to trading preferences, enhancing versatility for different market conditions.
Rainbow Effect: The indicator employs a visually appealing rainbow color scheme to differentiate between the various trend lines, making it easy to identify crossovers and momentum shifts.
Crossovers Detection: The script includes logic to detect crossover events between consecutive trend lines, which can serve as signals for potential entry or exit points in trading.
Clear Visualization: Suitable for both novice and seasoned traders, the plots enable quick interpretation of trends and market behavior.
How to Use:
Add the indicator to your chart and customize the base length as desired.
Observe the rainbow-colored lines for trend direction.
Look for crossover events between the SMAs as potential trading signals.
Application: This indicator is particularly useful for swing traders and trend followers who aim to capitalize on market momentum and identify reversals. By monitoring the behavior of multiple SMAs, traders can gain insights into the strength and direction of price movements over various time frames.

DAMA OSC - Directional Adaptive MA OscillatorOverview:
The DAMA OSC (Directional Adaptive MA Oscillator) is a highly customizable and versatile oscillator that analyzes the delta between two moving averages of your choice. It detects trend progression, regressions, rebound signals, MA cross and critical zone crossovers to provide highly contextual trading information.
Designed for trend-following, reversal timing, and volatility filtering, DAMA OSC adapts to market conditions and highlights actionable signals in real-time.
Features:
Support for 11 custom moving average types (EMA, DEMA, TEMA, ALMA, KAMA, etc.)
Customizable fast & slow MA periods and types
Histogram based on percentage delta between fast and slow MA
Trend direction coloring with “Green”, “Blue”, and “Red” zones
Rebound detection using close or shadow logic
Configurable thresholds: Overbought, Oversold, Underbought, Undersold
Optional filters: rebound validation by candle color or flat-zone filter
Full visual overlay: MA lines, crossover markers, rebound icons
Complete alert system with 16 preconfigured conditions
How It Works:
Histogram Logic:
The histogram measures the percentage difference between the fast and slow MA:
hist_value = ((FastMA - SlowMA) / SlowMA) * 100
Trend State Logic (Green / Blue / Red):
Green_Up = Bullish acceleration
Blue_Up (or Red_Up, depending the display settings) = Bullish deceleration
Blue_Down (or Green_Down, depending the display settings) = Bearish deceleration
Red_Down = Bearish acceleration
Rebound Logic:
A rebound is detected when price:
Crosses back over a selected MA (fast or slow)
After being away for X candles (rebound_backstep)
Optional: filtered by histogram zones or candle color
Inputs:
Display Options:
Show/hide MA lines
Show/hide MA crosses
Show/hide price rebounds
Enable/disable blue deceleration zones
DAMA Settings:
Fast/Slow MA type and length
Source input (close by default)
Overbought/Oversold levels
Underbought/Undersold levels
Rebound Settings:
Use Close and/or Shadow
Rebound MA (Fast/Slow)
Candle color validation
Flat zone filter rebounds (between UnderSold and UnderBought)
Available MA type:
SMA (Simple MA)
EMA (Exponential MA)
DEMA (Double EMA)
TEMA (Triple EMA)
WMA (Weighted MA)
HMA (Hull MA)
VWMA (Volume Weighted MA)
Kijun (Ichimoku Baseline)
ALMA (Arnaud Legoux MA)
KAMA (Kaufman Adaptive MA)
HULLMOD (Modified Hull MA, Same as HMA, tweaked for Pine v6 constraints)
Notes:
**DEMA/TEMA** reduce lag compared to EMA, useful for faster reaction in trending markets.
**KAMA/ALMA** are better suited to noisy or volatile environments (e.g., BTC).
**VWMA** reacts strongly to volume spikes.
**HMA/HULLMOD** are great for visual clarity in fast moves.
Alerts Included (Fully Configurable):
Golden Cross:
Fast MA crosses above Slow MA
Death Cross:
Fast MA crosses below Slow MA
Bullish Rebound:
Rebound from below MA in uptrend
Bearish Rebound:
Rebound from above MA in downtrend
Bull Progression:
Transition into Green_Up with positive delta
Bear Progression:
Transition into Red_Down with negative delta
Bull Regression:
Exit from Red_Down into Blue/Green with negative delta
Bear Regression:
Exit from Green_Up into Blue/Red with positive delta
Crossover Overbought:
Histogram crosses above Overbought
Crossunder Overbought:
Histogram crosses below Overbought
Crossover Oversold:
Histogram crosses above Oversold
Crossunder Oversold:
Histogram crosses below Oversold
Crossover Underbought:
Histogram crosses above Underbought
Crossunder Underbought:
Histogram crosses below Underbought
Crossover Undersold:
Histogram crosses above Undersold
Crossunder Undersold:
Histogram crosses below Undersold
Credits:
Created by Eff_Hash. This code is shared with the TradingView community and full free. do not hesitate to share your best settings and usage.

Quantum Motion Oscillator-QMO (TechnoBlooms)Quantum Motion Oscillator (QMO) is a momentum indicator designed for traders who demand precision. Combining multi-timeframe weighted linear regression with EMA crossovers, QMO offers a dynamic view of market momentum, helping traders anticipate trend shifts with greater accuracy.
This oscillator is inspired by quantum mechanics and wave theory, where market movement is seen as a series of probabilistic waves rather than rigid structures.
The histogram is plotted in proportion to the price movement of the candlesticks.
KEY FEATURES
1. Multi-Timeframe Histogram - Integrates 1 to 5 weighted linear regression averages, reducing lag while maintaining accuracy.
2. EMA Crossover Signal - Uses a Short and Long EMA to confirm trend shifts with minimal noise.
3. Adaptive Trend Analysis - Self-adjusting mechanics make QMO effective in both ranging and trending markets.
4. Scalable for Different Trading Styles - Works seamlessly for scalping, intraday, swing and position trading.
ADVANCED PROFESSIONAL INSIGHTS
1. Wave Dynamics and Market Flow - Inspired by wave mechanics, QMO reflects the energy accumulation and dissipation in price movements.
Expanding histogram waves = Strong momentum surge
Contracting waves = Momentum weakening, potential reversal zone.
2. Liquidity and Order Flow Applications - QMO works well alongside liquidity concepts and smart money techniques:
Combine with Fair Value Gaps & Order Blocks -> Enter when QMO signals align with liquidity zones.
Avoid False Moves - If price sweeps liquidity, but QMO momentum diverges, it is a sign of potential smart money manipulation.

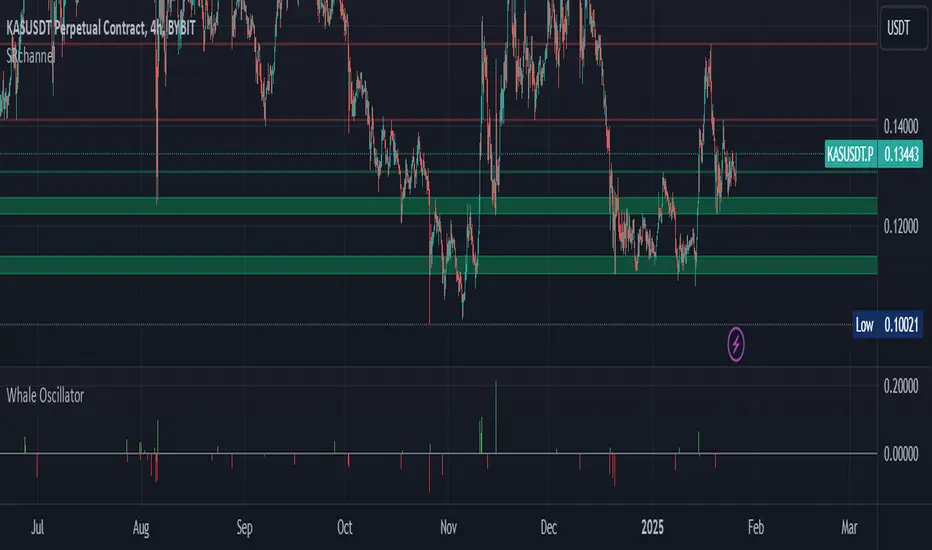
Whale Activity Impact OscillatorThe "Whale Activity Impact Oscillator" is a Pine Script v6 component designed to identify abnormal price movements caused by potential whale activity in the crypto market.
Here's how it works:
Inputs: The script allows users to configure the volume spike multiplier, price spike multiplier, lookback period, minimum volume threshold, and thresholds for strong buy and sell signals.
Data Calculations: It calculates the average volume and average percentage price change over the specified lookback period.
Whale Detection Logic: The script detects a volume spike if the current volume exceeds the average volume by the specified multiplier. It detects a price spike if the percentage price change exceeds the average by the specified multiplier.
Signals: A buy signal is generated when both a volume spike and a price increase are detected. A sell signal is generated when both a volume spike and a price decrease are detected.
Output: The oscillator is displayed as a histogram below the price chart. Green bars indicate buy signals, red bars indicate sell signals, and gray bars indicate normal activity. The height of the bars is proportional to the magnitude of the price change.
Alerts: The script includes alerts for whale buying and selling detected signals.
Edge Cases: The script avoids false signals in low-liquidity environments by setting a minimum volume threshold and filtering out signals during low market activity.
This component can be added to a TradingView chart to help traders identify potential whale activity and make informed trading decisions.
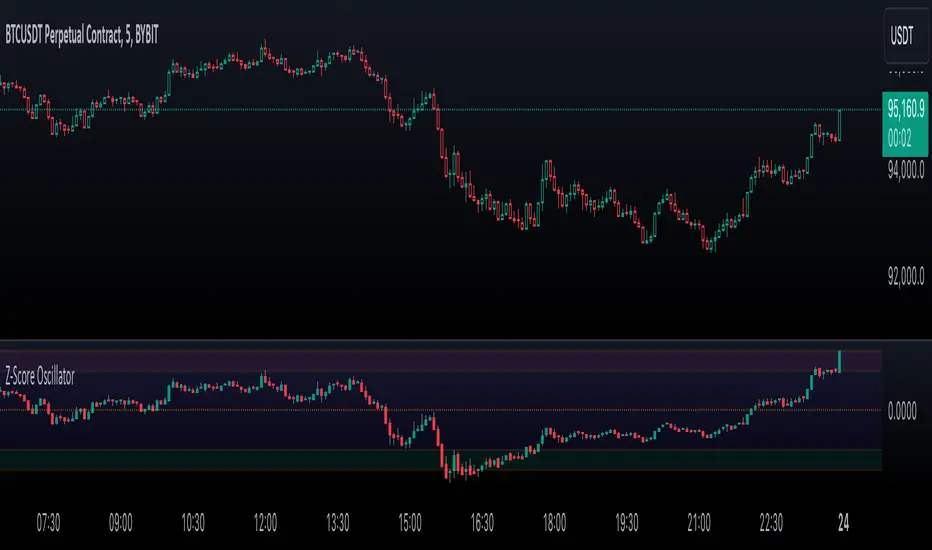
Enhanced Price Z-Score OscillatorThe Enhanced Price Z-Score Oscillator by tkarolak is a powerful tool that transforms raw price data into an easy-to-understand statistical visualization using Z-Score-derived candlesticks. Simply put, it shows how far prices stray from their average in terms of standard deviations (Z-Scores), helping traders identify when prices are unusually high (overbought) or unusually low (oversold).
The indicator’s default feature displays Z-Score Candlesticks, where each candle reflects the statistical “distance” of the open, high, low, and close prices from their average. This creates a visual map of market extremes and potential reversal points. For added flexibility, you can also switch to Z-Score line plots based on either Close prices or OHLC4 averages.
With clear threshold lines (±2σ and ±3σ) marking moderate and extreme price deviations, and color-coded zones to highlight overbought and oversold areas, the oscillator simplifies complex statistical concepts into actionable trading insights.
Awesome Oscillator with DivergenceSimple Awesome Oscillator with Divergences
This TradingView script combines the classic Awesome Oscillator (AO) with divergence detection. It plots AO as a histogram, highlighting changes in momentum. Divergences are identified based on pivot highs and lows, signaling potential trend reversals:
- Bullish Divergence: Price makes lower lows, AO makes higher lows.
- Bearish Divergence: Price makes higher highs, AO makes lower highs.
Visual signals (arrows) and alerts ensure clear identification, making it ideal for traders focusing on momentum and trend reversals.
Stablecoin Dominance Oscillator
The SDO is a normalized oscillator that tracks the relationship between stablecoin market capitalization (USDT + USDC + DAI) and total crypto market capitalization. It helps identify periods where stablecoins represent an unusually high or low portion of the total crypto market value.
Key components:
Main Signal (Blue Line):
Shows the normalized deviation of stablecoin dominance from its trend. Higher values indicate higher stablecoin dominance relative to history (which often corresponds with market bottoms/fear), while lower values indicate lower stablecoin dominance (often seen during strong bull markets/greed).
Dynamic Bands (Gray):
These adapt to market volatility, expanding during volatile periods and contracting during stable periods
Generally suggest temporary boundaries for the oscillator
Volatility Reference (Purple Line):
Shows the ratio between short-term and long-term volatility
Higher values indicate more volatile market conditions
Helps contextualize the reliability of the current signal
The indicator uses a 500-period lookback for baseline calculations and a 15-period Hull Moving Average for smoothing, making it responsive while filtering out noise. The final signal is normalized and volatility-adjusted to maintain consistent readings across different market regimes.

Awesome Oscillator + Bars count lines + EMA LineThe indicator includes an Awesome Oscillator with 2 vertical lines at a distance of 100 and 140 bars from the last bar to determine the third Elliott wave by the maximum peak of AO in the interval from 100 to 140 bars according to Bill Williams' Profitunity strategy. Additionally, a faster EMA line is displayed that calculates the difference between 5 Period and 34 Period Exponential Moving Averages (EMA 5 - EMA 34) based on the midpoints of the bars, just like AO calculates the difference between Simple Moving Averages (SMA 5 - SMA 34).
In the indicator settings, you can change the number of bars for vertical lines and any parameters for AO and EMA - method (SMA, Smoothed SMA, EMA and others), length, source (open, high, low, close, hl2 and others).
***
Индикатор включает Awesome Oscillator с 2 вертикальными линиями на расстоянии 100 и 140 баров от последнего бара, чтобы определить третью волну Эллиота по максимальному пику AO в интервале от 100 до 140 баров по стратегии Profitunity Билла Вильямса. Дополнительно отображается более быстрая линия EMA, которая вычисляет разницу между 5 Периодной и 34 Периодной Экспоненциальными Скользящими Средними (EMA 5 - EMA 34) по средним точкам баров (hl2), точно так же, как AO вычисляет разницу между Простыми Скользящими Средними (SMA 5 - SMA 34).
В настройках индикатора вы можете изменить количество баров для вертикальных линий и любые параметры для AO и EMA – метод (SMA, Smoothed SMA, EMA и другие), длину, источник (open, high, low, close, hl2 и другие).

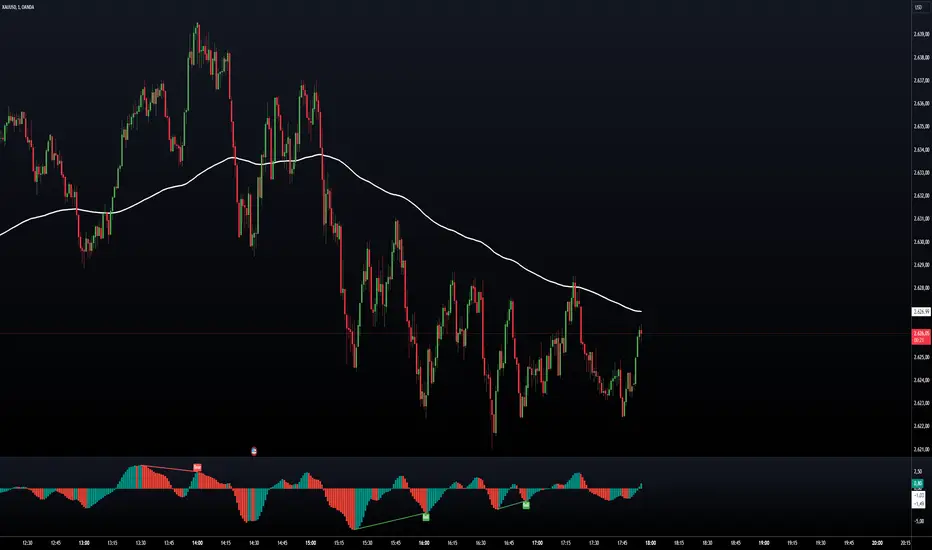
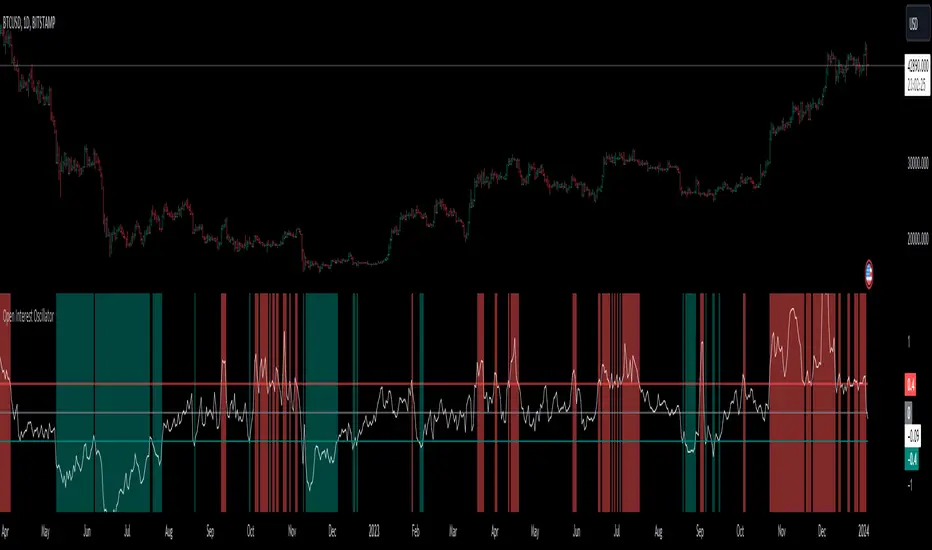
Open Interest OscillatorIn the middle of a bustling cryptocurrency market, with Bitcoin navigating a critical phase and the community hype over potential ETF approvals, current funding rates, and market leverage, the timing is optimal to harness the capabilities of sophisticated trading tools.
Meet the Open Interest Oscillator – special indicator tailored for the volatile arena of cryptocurrency trading. This powerful instrument is adept at consolidating open interest data from a multitude of exchanges, delivering an in-depth snapshot of market sentiment across all timeframes, be it a 1-minute sprint or a weekly timeframe.
This versatile indicator is compatible with nearly all cryptocurrency pairs, offering an expansive lens through which traders can gauge the market's pulse.
Key Features:
-- Multi-exchange Data Aggregation: This feature taps into the heart of the crypto market by aggregating open interest data from premier exchanges such as BINANCE, BITMEX, BITFINEX, and KRAKEN. It goes a step further by integrating data from various pairs and stablecoins, thus providing traders with a rich, multi-dimensional view of market activities.
-- Open Interest Bars: Witness the flow of market dynamics through bars that depict the volume of positions being opened or closed, offering a clear visual cue of trading behavior. In this mode, If bars are going into negative zone, then traders are closing their positions. If they go into positive territory - leveraged positions are being opened.
-- Bollinger Band Integration: Incorporate a layer of statistical analysis with standard deviation calculations, which frame the open interest changes, giving traders a quantified edge to evaluate the market's volatility and momentum.
-- Oscillator with Customizable Thresholds: Personalize your trading signals by setting thresholds that resonate with your unique trading tactics. This customization brings the power of tailored analytics to your strategic arsenal.
-- Max OI Ceiling Setting: In the fast-paced crypto environment where data can surge to overwhelming levels, the Max OI Ceiling ensures you maintain a clear view by capping the open interest data, thus preserving the readability and interpretability of information, even when market activity reaches feverish heights.
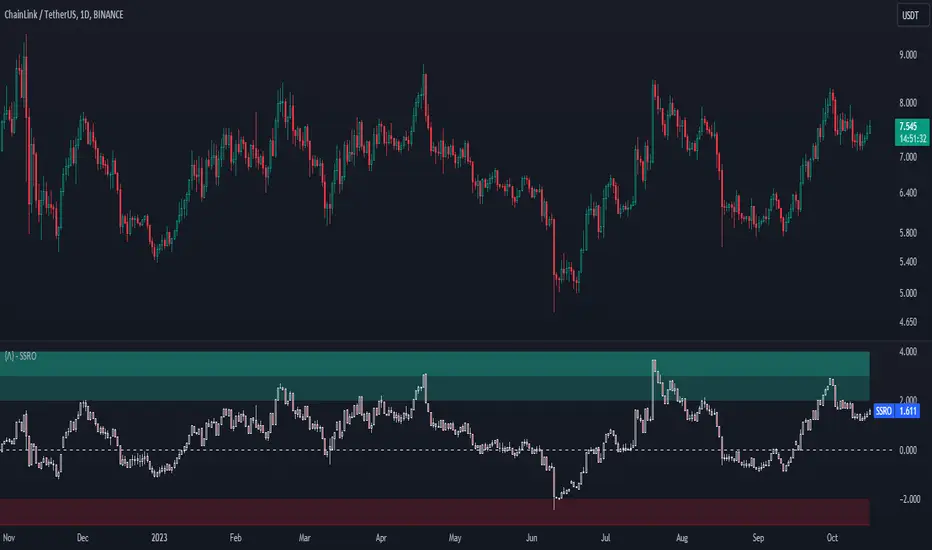
Stablecoin Supply Ratio Oscillator
The Stablecoin Supply Ratio Oscillator (SSRO) is a cryptocurrency indicator designed for mean reversion analysis and sentiment assessment. It calculates the ratio of CRYPTO:BTCUSD 's market capitalization to the sum of stablecoins' market capitalization and z-scores the result, offering insights into market sentiment and potential turning points.
Methodology:
The SSRO is calculated as follows-
method ssro(float src, array stblsrc, int len) =>
float ssr = src / stblsrc.sum() // Source of the underlying divided by the sum of stablecoin sources
(ssr - ta.sma(ssr, len)) / ta.stdev(ssr, len) // Z-Score Transformed
This ratio is Z-Scored to provide a standardized measure, allowing users to identify periods of market fear or greed based on the allocation of capital between the underlying and Stablecoins ( CRYPTOCAP:USDT , CRYPTOCAP:USDC , CRYPTO:TUSD , CRYPTOCAP:BUSD , CRYPTOCAP:DAI , CRYPTOCAP:USDD , CRYPTOCAP:FRAX ). The z-scored values indicate potential areas of discount (buying opportunities) or premium (selling opportunities) relative to historical patterns.
Customization:
Underlying Asset: SSRO is customizable to different underlying assets, offering a versatile tool for various cryptocurrencies.
Calculation Length: Users can adjust the length of the calculation, tailoring the indicator to short or long-term analysis.
Visualization: SSRO can be displayed as candles, providing a visual representation of premium and discount areas.
Interpretation:
Market Sentiment: Lower SSRO values may indicate market fear, suggesting a preference for stablecoins as a relatively safer haven for capital. Conversely, higher values may suggest market greed, as more capital is allocated to the underlying asset.
Utility and Use Cases:
1. Mean Reversion Analysis: SSRO identifies potential mean reversion opportunities, guiding traders on optimal entry and exit points.
2. Sentiment Analysis: The indicator provides insights into market sentiment, aiding traders in understanding market dynamics.
3. Macro Analysis: The majority of cryptos follow \ correlate to CRYPTO:BTCUSD , Therefore by assessing premium and discount areas of CRYPTO:BTCUSD relative to the chosen underlying asset, users gain insights into potential market tops and bottoms.
4. Divergence Analysis: SSRO divergence from price trends can signal potential reversals, providing traders with additional confirmation for their decisions.
The Stablecoin Supply Ratio Oscillator is a valuable tool for cryptocurrency traders, offering a nuanced perspective on market sentiment and mean reversion opportunities. Its customization options and visual representation make it a versatile and powerful addition to the crypto analyst's toolkit.
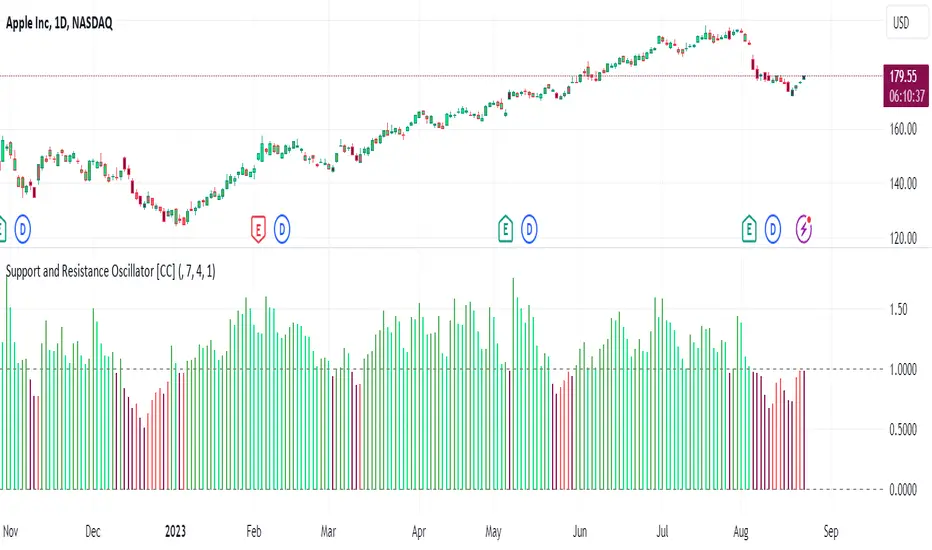
Support and Resistance Oscillator [CC]The Support and Resistance Oscillator is an experimental script I created to identify when the current price breaks a support or resistance line and reflect this value in an oscillator formula. This indicator uses a threshold to decide the dividing line between buying and selling points. Feel free to change the threshold or smoothing settings to see if you find anything better since this is so experimental. I'm double smoothing the difference between the indicator and its signal line to attempt to capture a combo of the price momentum combined with the general support and resistance levels. I have used dark colors for strong signals and lighter colors for normal signals and make sure to buy when the line turns green and sell when it turns red.
Let me know if there are any other scripts or indicators you would like to see me publish!
EMA X Oscillator
This indicator combines elements of the Exponential Moving Average (EMA) crossover and Rate of Change (ROC), generating a solid simple tool for technical analysis.
Overall, this script creates an oscillator by calculating the Rate of Change between two Exponential Moving Averages (Fast and Slow) based on the chosen smoothing methods and lengths. The oscillator helps identify potential trends. It offers customization options for the types of smoothing and other parameters, making it versatile for various strategies.
