Fibonacci Extension / Retracement / Pivot Points by DGTFɪʙᴏɴᴀᴄᴄɪ Exᴛᴇɴᴛɪᴏɴ / Rᴇᴛʀᴀᴄᴍᴇɴᴛ / Pɪᴠᴏᴛ Pᴏɪɴᴛꜱ
This study combines various Fibonacci concepts into one, and some basic volume and volatility indications
█ Pɪᴠᴏᴛ Pᴏɪɴᴛꜱ — is a technical indicator that is used to determine the levels at which price may face support or resistance. The Pivot Points indicator consists of a pivot point (PP) level and several support (S) and resistance (R) levels. PP, resistance and support values are calculated in different ways, depending on the type of the indicator, this study implements Fibonacci Pivot Points
The indicator resolution is set by the input of the Pivot Points TF (Timeframe). If the Pivot Points TF is set to AUTO (the default value), then the increased resolution is determined by the following algorithm:
for intraday resolutions up to and including 5 min, 4HOURS (4H) is used
for intraday resolutions more than 5 min and up to and including 45 min, DAY (1D) is used
for intraday resolutions more than 45 min and up to and including 4 hour, WEEK (1W) is used
for daily resolutions MONTH is used (1M)
for weekly resolutions, 3-MONTH (3M) is used
for monthly resolutions, 12-MONTH (12M) is used
If the Pivot Points TF is set to User Defined, users may choose any higher timeframe of their preference
█ Fɪʙ Rᴇᴛʀᴀᴄᴇᴍᴇɴᴛ — Fibonacci retracements is a popular instrument used by technical analysts to determine support and resistance areas. In technical analysis, this tool is created by taking two extreme points (usually a peak and a trough) on the chart and dividing the vertical distance by the key Fibonacci coefficients equal to 23.6%, 38.2%, 50%, 61.8%, and 100%. This study implements an automated method of identifying the pivot lows/highs and automatically draws horizontal lines that are used to determine possible support and resistance levels
█ Fɪʙᴏɴᴀᴄᴄɪ Exᴛᴇɴꜱɪᴏɴꜱ — Fibonacci extensions are a tool that traders can use to establish profit targets or estimate how far a price may travel AFTER a retracement/pullback is finished. Extension levels are also possible areas where the price may reverse. This study implements an automated method of identifying the pivot lows/highs and automatically draws horizontal lines that are used to determine possible support and resistance levels.
IMPORTANT NOTE: Fibonacci extensions option may require to do further adjustment of the study parameters for proper usage. Extensions are aimed to be used when a trend is present and they aim to measure how far a price may travel AFTER a retracement/pullback. I will strongly suggest users of this study to check the education post for further details, where to use extensions and where to use retracements
Important input options for both Fibonacci Extensions and Retracements
Deviation, is a multiplier that affects how much the price should deviate from the previous pivot in order for the bar to become a new pivot. Increasing its value is one way to get higher timeframe Fib Retracement Levels
Depth, affects the minimum number of bars that will be taken into account when building
█ Volume / Volatility Add-Ons
High Volatile Bar Indication
Volume Spike Bar Indication
Volume Weighted Colored Bars
This study benefits from build-in auto fib retracement tv study and modifications applied to get extentions and also to fit this combo
Disclaimer:
Trading success is all about following your trading strategy and the indicators should fit within your trading strategy, and not to be traded upon solely
The script is for informational and educational purposes only. Use of the script does not constitute professional and/or financial advice. You alone have the sole responsibility of evaluating the script output and risks associated with the use of the script. In exchange for using the script, you agree not to hold dgtrd TradingView user liable for any possible claim for damages arising from any decision you make based on use of the script
Recherche dans les scripts pour "pivot"

sma-pivotsThis model is based on this script
I change it to sma model . the model run on pivots high or low that are base on SMA
I make two SMA one for high pivots and one for low pivots ( I put for now at same distance but you need to change it according to needs)
because asset can be in bull period or bear period when we have two separate distance of SMA we can find the correct combination if to buy more or less by changing either the sma pivot of the low end or the sma pivots of the high end using the length . also global we can use the lookbar of bar numbers
one sma to both pivots is bad as it not consider the market situation but separation to two one for sell and one for buy can give you a better flexible model for enter or exit
so its your job to find what length is best suited for exit and what for enter .
example when we have two different length how it work on 4 hour


Standard Deviation W/Q/M PivotsThis is a re-iteration of the standard deviation of daily pivots with the pivots applied on weekly, monthly, quarterly and yearly levels. For intraday traders the weekly pivot points will act as a major support resistance levels. Quarterly and monthly pivot points are useful for short-term positions while the yearly pivot determines the stock's long term support-resistance levels and useful in determining if the stock is in a bullish/bearish leg.
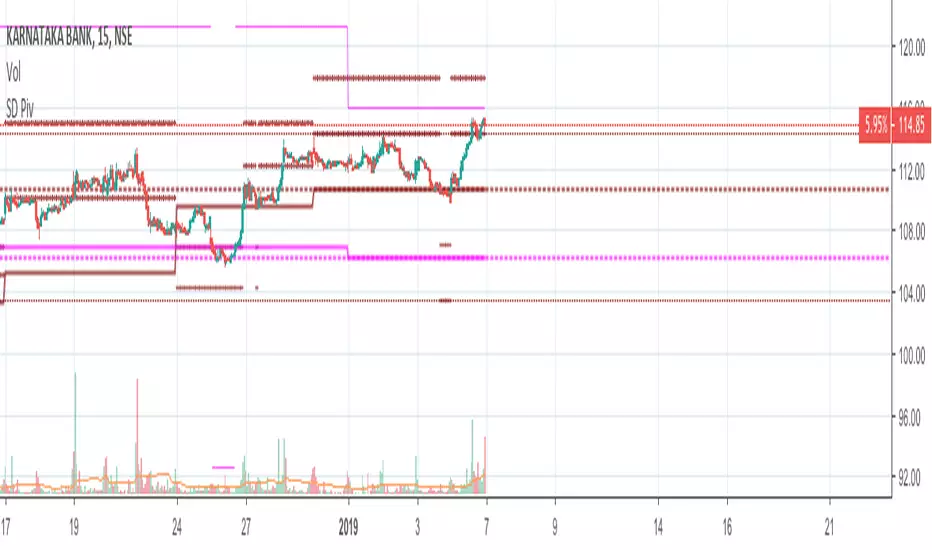
Rounded Weekly Pivot (by ChartArt)Trade with the trend. This is an overlay indicator which shows the weekly pivot (rounded) either as line or circle drawing, select-able by the user. The width of the pivot line (or circle) overlay is also adjustable.
In addition the bars can be colored by the trend, depending if the close price is above or below both the weekly and monthly pivots. If the close price is neither above or below both the weekly and monthly pivot prices the trend color is neutral blue.
The weekly pivot indicator with the optional setting that the pivot price is drawn as circles instead of a line:
And here with the pivot drawing disabled, showing only the pivot bar trend color

Auto Fibo Pivot [Ultimate MTF]Stocks: Locks lines during market hours (09:00-15:30) and switches to "Preview Mode" (Next Day) after market close.
Forex/Crypto: Always Fixed Mode (24h).
Multi-Timeframe (MTF): Select between Auto Daily, Weekly, Monthly, or Yearly pivots.
Fully Customizable: Easily change Fibonacci ratios and colors in the settings.
No Repaint: Stable lines on 1-minute charts.
自動判別・マルチタイムフレーム対応のフィボナッチピボット
株・為替を自動判別し、最適なモードで動作する実戦向けインジケーターです。
主な機能:
自動判別機能:
日本株: ザラ場中はラインを完全固定。15:30以降は自動で「明日の予習モード」に切り替わります。
為替・仮想通貨: 24時間常時固定モードで動作します。

4H Pivot Levels# 4-Hour Pivot Levels - Quick Guide
## What It Does
Displays 4-hour pivot support and resistance levels on any timeframe chart with clear BUY (green) and SELL (red) labels.
## Installation
1. Open TradingView Pine Editor
2. Paste the script code
3. Save and "Add to Chart"
## Understanding the Levels
**Pivot Point (P)** - Yellow line, central reference point
- Price above = bullish bias
- Price below = bearish bias
**Support Levels (S1, S2, S3)** - Green "BUY" labels
- Demand zones where price may bounce up
- Use as long entry targets or short exit points
- S1 strongest, S3 weakest
**Resistance Levels (R1, R2, R3)** - Red "SELL" labels
- Supply zones where price may reverse down
- Use as short entry targets or long exit points
- R1 strongest, R3 weakest
## How to Use
**For Longs:**
- Buy near green support levels
- Target red resistance levels or pivot
- Stop loss below the support level
**For Shorts:**
- Sell near red resistance levels
- Target green support levels or pivot
- Stop loss above the resistance level
**For Ranging Markets:**
- Buy support, sell resistance
- Use pivot as mid-range guide
## Settings
**Display:** Toggle pivot point, support, or resistance on/off
**Line Extension:** Adjust how far lines project forward (default: 50 bars)
**Colors:** Customize pivot (yellow), support (green), resistance (red)
**Style:** Change line width (1-5) and style (solid/dashed/dotted)
## Tips
- Works on any timeframe but best on 15min-4H charts
- R1/S1 are typically the strongest levels
- Always use with price action confirmation and stop losses
- Levels update every 4 hours based on previous 4H candle
- Combine with volume and other indicators for best results
## Quick Strategy
1. Identify the trend (above/below pivot)
2. Wait for price to approach a level
3. Look for confirmation (candlestick pattern, volume)
4. Enter with stop beyond the level
5. Target next level or pivot point

Structure Pivot (LL-HL / HH-LH)Structure Pivot (LL-HL / HH-LH) - Indicator Guide
This indicator scans for market structure pivot patterns—specifically the bullish Higher Low (LL–HL) and the bearish Lower High (HH–LH) —across multiple lengths simultaneously.
It automatically selects the most optimal pattern based on a "Priority Mode" and plots the structure and breakout/breakdown levels on the chart.
1. Basic Calculation Method
The indicator builds upon TradingView’s ta.pivotlow and ta.pivothigh functions to identify structural points.
Bullish Structure (LL–HL)
1.LL (Lowest Low): A standard Pivot Low is identified.
2.HL (Higher Low): A subsequent Pivot Low forms higher than the previous LL. This completes the setup.
3.Pivot Line (Resistance): The indicator finds the highest price (High) that occurred between the LL and the HL. This level becomes the breakout trigger.
Bearish Structure (HH–LH)
1.HH (Highest High): A standard Pivot High is identified.
2.LH (Lower High): A subsequent Pivot High forms lower than the previous HH. This completes the setup.
3.Pivot Line (Support): The indicator finds the lowest price (Low) that occurred between the HH and the LH. This level becomes the breakdown trigger.
2. Multi-Length Scanning
Unlike standard indicators that use a single fixed length (e.g., Length = 5), this indicator scans a range of lengths simultaneously.
・Settings: Defined by Min Length and Max Length.
・Mechanism: If set to Min=2 and Max=10, the indicator internally runs 9 separate calculations (Length 2 through 10) in parallel.
This allows it to capture everything from small, short-term pullbacks to larger, significant structural pivots without manual adjustment.
3. Priority Mode System
Since multiple lengths are scanned, multiple valid patterns may appear at the same time. The Priority Mode determines which single pattern is the "winner" and gets displayed.
A. Tightest Structure (Default)
・For Bullish (Long): Selects the pattern with the lowest Pivot Line (Resistance).
・For Bearish (Short): Selects the pattern with the highest Pivot Line (Support).
・Advantage: It finds the "tightest" contraction (like a VCP). This offers the entry point closest to the stop-loss level, providing the best Risk/Reward ratio.
B. Longest Length
・Selects the pattern detected by the longest length setting.
・Advantage: Focuses on major structural points, filtering out short-term noise. Best for trend confirmation.
C. Shortest Length
・Selects the pattern detected by the shortest length setting.
・Advantage: Extremely sensitive. Best for scalping or catching immediate micro-pullbacks.
4. Real-Time Logic & Features
Structure Invalidation (Failure)
・Bullish: If the current price drops below the HL (the support of the structure), the setup is considered failed.
・Bearish: If the current price rises above the LH (the resistance of the structure), the setup is considered failed.
・Result: All lines and labels for that structure are immediately deleted to keep the chart clean.
Pivot Line Extension
・As long as the structure remains valid (price hasn't violated the HL or LH), the Pivot Line extends to the right, acting as a live reference for breakouts or breakdowns.
Alerts
・Bullish Breakout: Triggered when the Close price crosses over the Pivot Line.
・Bearish Breakdown: Triggered when the Close price crosses under the Pivot Line.

Tomorrow's Pivot Points [SMH]這個TradingView指標不同於內置的Pivot Point指標,因為它能夠提前顯示明天的Pivot Point。透過預測下一交易日的支撐與阻力位置,交易員可以更早部署策略,為隔日的市場波動做好準備。
This TradingView indicator is different from the built-in Pivot Point tool because it can display tomorrow’s Pivot Points in advance. By forecasting support and resistance levels for the next trading day, traders can position their strategies earlier and be well-prepared for upcoming market movements.

Bardhi's ICT Killzone & PivotsThis indicator is a complete ICT-style session and liquidity toolkit designed for precision trading. It automatically marks the most important trading windows (“Killzones”) and provides powerful tools for tracking price action around them.
Key Features:
Killzones: Automatically plots Asia, London, and New York (AM, Lunch, PM) sessions with customizable colors, transparency, and labels.
Session Highs, Lows & Midpoints: Dynamic lines for killzone highs/lows, optional midpoints, and alerts when levels are broken.
Range Statistics: Displays the real-time range of each session plus rolling averages in a customizable table.
Day / Week / Month Levels: Plots opens, highs, lows, and separators for higher-timeframe reference points with optional alerts.
Custom Opening Prices: Define up to 8 custom open lines (e.g., True Day Open, 06:00, 10:00) with cutoff times.
Vertical Timestamp Lines: Highlight important intraday times such as news events or personal strategy triggers.
Day-of-Week Labels: Clean labels for each day, with the option to hide weekends.
Full Customization: Adjustable label sizes, colors, line styles, transparency, and drawing limits.
Why Use It?
This tool combines killzone sessions, pivots, higher-timeframe opens/highs/lows, and range statistics into one clean, automated package. It saves time drawing manually, keeps charts organized, and helps traders apply ICT concepts consistently.

Pivot Points with MID LevelsThis indicator shows the Standard Pivot Points level based on daily values that can act as support and resistance. It is used by a variety of traders around the world. You can select which time frame Pivot Point Levels you'd like. Daily, weekly etc... Perfect for swing trading or day trading.
Pivot Points- Shows 3 levels of resistance, the Pivot Point and 3 levels of support
(R3, R2, R1, PIVOT POINT, S1, S2, S3
MID Levels- The MID levels are 50% retracement from the pivot point level above it and below
Example- R3, MID, R2, MID, R1, MID, PIVOT POINT, MID, S1, MID, S2, MID, S3
With this indicator you will also have the option to show the Previous days High and Low that are also important levels. On gap up/down days it is always interesting to see if price will close the gap, hence the important level to note.
PDH= Previous Days High
PDL= Previous Days Low
I have added a feature that you can now select specific color to each level and the line style for each level to help understand which levels are being show by personal needs.
Happy Trading

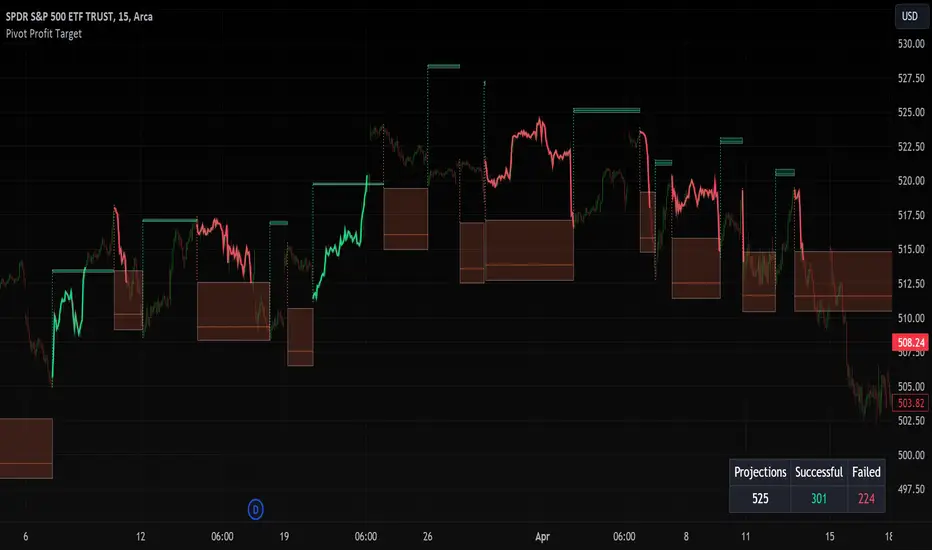
Pivot Profit Target [Mxwll]Introducing the Pivot Profit Target!
This script identifies recent pivot highs/lows and calculates the expected minimum distance for the next pivot, which acts as an approximate profit target.
The image above details the indicator's output.
The image above shows a table consisting of projection statistics.
How to use
The Pivot Profit Targets can be used to approximate a profit target for your trade.
Identify where your entry is relative to the most recent pivot, and assess whether the minimum expected distance for the most recent pivot has been exceeded. Treat the zones as an approximation.
If your trade aligns with the most recent pivot - treat the minimum expected distance zone as a potential profit target area. Of course, price might stop short or continue beyond the projection area!
That's it! Just a short and sweet script; thank you!
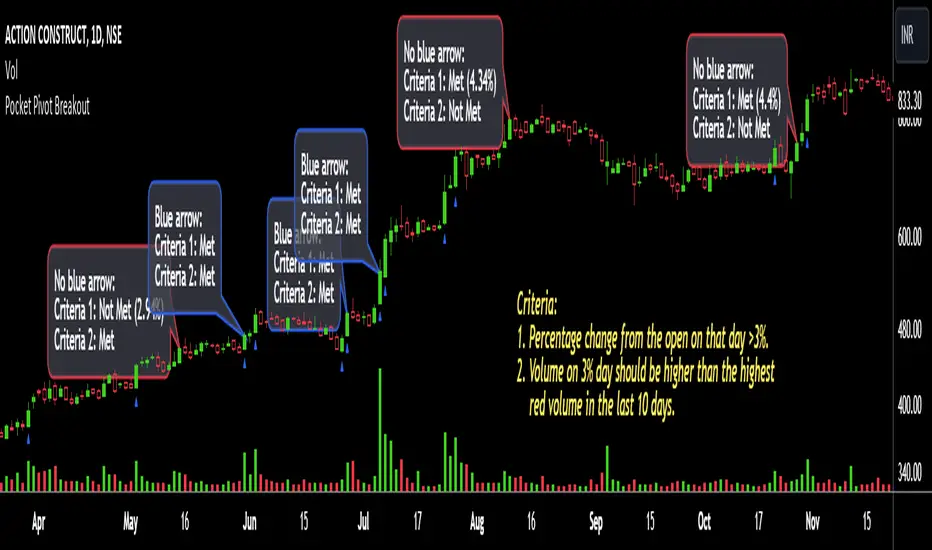
Pocket Pivot BreakoutPocket Pivot Breakout Indicator
The pocket pivot breakout indicator will show a blue arrow under the candle if both the following conditions are met:
1. The percentage change of the candle on that day from open is greater than 3%.
2. The volume on the day of 3% candle is higher than the highest red volume in the past 10 days.
The second condition is based on the 'Pocket Pivot' concept developed by Gil Morales and Chris Kacher.
If only one of the conditions is met, while the other is not, there will be no arrow.
How to use the Pocket Pivot Breakout indicator?
1. If the stock is breaking out of a proper base like (cup & handle, Darvas box etc.), you can use the blue arrow as an indicator to make your initial buy.
2. If you already own a stock, the blue arrow indicator can be used for pyramiding, following a continuation breakout from a proper base.
3. Avoid making a new entry or continuation entry if the stock is too extended from 10ma.
Gap-up > 0.5% Indicator
Gap-up Indicator displays a blue colored candle when a stock gaps up by more than 0.5% compared to previous day's close.
It is turned off by default. To activate it, check the box next to Gap-up > 0.5% in the indicator options.
How to use the Gap-up Indicator?
1. When a stock gaps up, it usually indicates strength, especially if on the day of the gap-up, the stock closes strongly.
2. This indicator should not be used in isolation but with a proper base breakout from a tight consolidation.
3. If a stock is already extended from 10ma, avoid taking any new or continuation entries.
Precautions
1. Avoid buying longs when the general market conditions are not favorable.
2. Avoid buying stocks below 200ma.
3. Avoid making a new entry or pyramid entry if a stock is too extended from 10ma.
Important Points
1. Always choose fundamentally strong stocks showing strong growth in earnings/margins/sales.
2. Buy these fundamentally strong stocks when they are breaking out of proper bases.
3. To learn more about pocket pivots and buyable gap-ups, read the book, Trade Like an O'Neil Disciple (by Gil Morales & Chris Kacher).
Cheers
Simranjit
Three-Day Rolling PivotThe three-day rolling pivot is another pivot concept,
which may be used by intermediate positions, for several days or even weeks.
It can be utilized in many ways, such as to determine an entry point or trailing stop.
As the name suggests, this pivot is based on the last three days.
I learned this concept of the book "The logical Trader" by Mark Fisher.
Kudos go to him!
My version of the Three-Day Rolling Pivot uses actual data!
And all similar scripts I have found so far calculate future data and don't take into account the original data.
I hope this script will help some people to do some better decisions.
And I am pleased to get some advice to make this script even better!
Future data vs original data
Pine Script v5 Reference Manual:
Merge strategy for the requested data position... This merge strategy can lead to undesirable effect of getting data from "future" on calculation on history. This is unacceptable in backtesting strategies, but can be useful in indicators.
e2e4 on Stack Overflow said:
Pine v1-v2's security() function is using the lookahead parameter by default, which could be modified in v3-v5...
stackoverflow.com
I haven't found a script which put this into account jet.
I leave this option available for people that wanna more speculated data. But it's disabled by default.
Long/Short Example
You can enter Long when the market cross over the upper line (default color is green) and you should put your trailing stop 1-5 ticks below the lower line (default color is red).
The opposite when Shorting, then the market has to cross down the lower line and your trailing stop should be 1-5 ticks above the upper line.
How does this script work:
First it fetches the highest high of ...
yesterday,
the day before yesterday,
and the day before that.
After that the script looks for the highest high of all three.
Next it does the same for previous lowest low.
Last but not least, it fetches the closing price of the last day.
After that it adds all three prices together and divide them by three.
This result in a three day pivot price.
Then it adds the highest high and lowest low of the three last days and divide it by two.
This gives us the second number we need to calculate the differential.
The differential is the gap between the three day pivot price and the second number.
Sometimes the second number is bigger than the three day pivot price so I took that into account too. Other wise the colors plotted would be on the wrong site.
Finally, the script is rounding the numbers to the nearest minimum tick of that security.

[JL] Supertrend Zone Pivot Point with zigzag fibThis is an open-source Pine script that generates a Supertrend Zone Pivot Point with Zigzag Fib indicator for TradingView. The indicator displays the Supertrend Zone, pivot points, and Fibonacci levels on the chart.
One of the unique features of this indicator is that it uses a Zigzag that does not repaint, ensuring accurate high and low points for the pivot points.
Another feature is that when the Supertrend is in an uptrend, only the highest points are taken as pivot points, and when it's in a downtrend, only the lowest points are taken as pivot points.
The Fibonacci levels are calculated based on the previous high and low pivot points, with labels displaying the corresponding levels on the chart.
The indicator also includes options to show/hide the Zigzag and Fibonacci levels.
Overall, this indicator is useful for identifying key pivot points and Fibonacci levels in the Supertrend Zone, providing valuable information for traders to make informed decisions.

Bagang Pivot Zones | Supply & Demand, Support & ResistanceBagang Pivot Zones detects imbalances from classic reversal and momentum price actions.
Imbalances create pivot zones, a.k.a Supply & Demand / Support & Resistance / Orderblock zones.
Use Cases
1. Traders using Supply & Demand theory can quickly pinpoint imbalance zones created by BUY-to-SELL and SELL-to-BUY candles.
2. Trend Following traders can systematically catch and follow a trend based on pivot zones analysis.
3. Breakout traders can easily target pivot zones’ breakout and breakdown.
4. Take the guesswork out of risk management: manage stop-loss precisely behind pivot zones.
5. Analyze contrary pivot zones to set realistic profit targets.
Objectivity
By only comparing OHLC values to identify notable price actions, Bagang Pivot Zones avoids derived calculations with subjective parameters.
Chart Issue
If the chart zooms out after adding an indicator, right-click the price scale and toggle "Scale price chart only” on.

Bias Pivot PointA simple indicator that uses Pivot Points as a filter and to generate a Directional Bias .
How to use this indicator?
1. Directional Bias
Bullish => Closing Price > Pivot Point
Bearish => Closing Price < Pivot Point
2. Support / Resistance
Each Pivot Points can be used as Support or Resistance
3. Take Profit Targets
Each Pivot Points can be used as targets for taking profit

Fibonacci Pivot ZonesFibonacci Pivot Zones make use of the average price between the high, low & close of the previous session, while adding deviations based on Fibonacci numbers to form support and resistance zones, which can be used as targets for intraday and swing trading.
You can select the timeframe for the zones, for example 12 hour pivots to trade in 15m timeframe, or even monthly pivots to trade on the daily timeframe.
You can choose the different fibonacci levels on the menu, by default these are:
0.382
0.618
0.782
1
Enjoy!
Kviateq - Session Pivots for CryptoPretty much the exact same indicator as my other Session Pivots, however this one also shows the weekends and the session times are set to Bitmex exchange (note: I'm in a GMT+7 timezone myself).
Fibonacci Pivots Monthly and Weekly Full (no history)Fibonacci Pivots Monthly and Weekly Full (no history)
Inspired by FxChartAnalyst trader, with his great Monthly Weekly Daily Pivot Points Standard indicator
www.tradingview.com
This indicator calculates and plots both Monthly and Weekly pivots on a chart. Pivots are based on the Fibonacci ratios of the previous Month/Week candle close.
Good luck everyone!

(JS) Multi-Time Frame Pivot Point Detector 2.0So here's an updated version of my automatic Pivot Point detector.
If you don't like having a bunch of Pivots on your chart at once, or having to cycle through various resolutions to see different ones, this is for you!
What does this indicator do? It automatically detects the nearest daily, weekly, and monthly pivot points both above and below the current price and automatically plots them for you. It's really just as simple as that.
You select how far back you want it to plot with the "Pivot Point Look Back Period" option.
I also have transparency options for each type of pivot so its easy to find the opacity you prefer and save it as a default setting.
With "Turn Off Each Pivot Point On All Time Frames" turned on, as an example, if you were to uncheck "S1/R1" then it turns S1/R1 plots off across all 3 pivot resolutions. By default however, I have it set where you can pick and choose each one individually.
I also added the default "VWAP Periodic" script from TradingView in there with it (not in prior version). This works identical to the built in indicator (because it is identical).
Trading algorithms like to target pivot points and liquidity, so I figured they would pair together nicely for active trading.

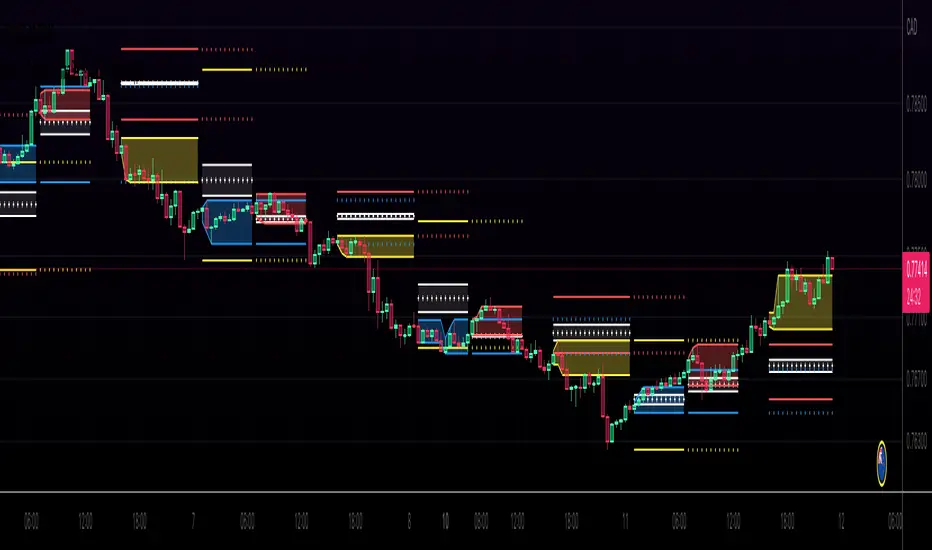
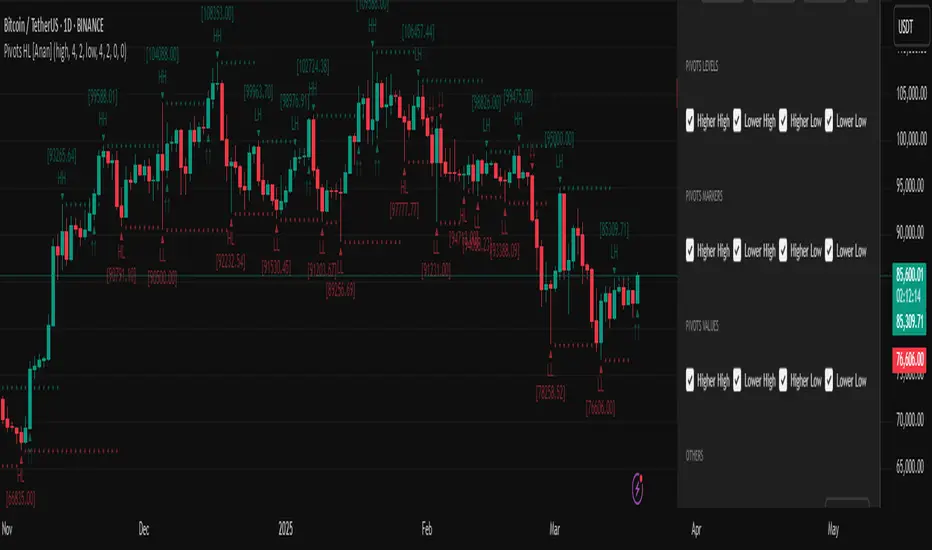
Pivot Points High Low (HH/HL/LH/LL) [Anan]Hello Friends,
This is my own version of ( Pivot Hilo Support n Resistance Levels R3-3 by JustUncleL )
- V4 Pinescript
- Removed MA dependency filters
- Add some arrows
[RS]Shifted Pivots V1update: added weekly and monthly pivots, the offset is a average approximation so there may be inconsistency on the date forecasted to be end of week/month.
(using diferent sessions or limited time intervals is not possible).
