Pivot PointsIndicator calculates the basic pivot points from previous day's h/l/c on intraday charts
Recherche dans les scripts pour "pivot"

Pivot Points Standard Higher Timeframe█ OVERVIEW
This indicator was intended as educational purpose only and alternative way to write pine script in version 5 for Pivot Points Standard.
█ CREDITS
Credits to TradingView for original built-in source code.
█ FEATURES
Display price or percentage.
Change color for labels and lines.
█ USAGE EXAMPLES

Pivot Support/ResistanceThis indicator displays immediate Pivot Highs/Lows compared to the current price as lines on the chart. It can be useful to identify support/resistance.

Pivot Points And Breakout Price Action With LuckyNickVaBar Color Candle Aligned with pivot points swing high and swing lows For Those Who Are Familiar with Trading The Breakouts Of Highs & Lows Of Structure. Pivots are said to be key areas in the market where price shows heavy reaction to where reversals make occur. At these points there are swing Highs & swing lows that traders may be able to find opportunity in the market. This Script is a combination of pivot points and Barcolor signals for the breakout.

Pivot Points (Daily, Weekly, Monthly)Pivot point: P = (High + Low)/2
First support: S1 = Low
Second support, S2 = Low - 2 * (High - Low)
First resistance: R1 = High
Second resistance, R2 = High + 2 * (High - Low)
White Line: Pivot Point
Gleen Line(Thin Line): Support 1
Green Line(Thick Line): Support 2
Red Line(Thin Line): Resistance 1
Red Line (Thick Line): Resistance 2
You can adjust it to daily, weekly or monthly indicators, daily for intraday trading (1minute, 1hour etc.), weekly and monthly for day/swing trading, monthly for weekly trades. I plot the graph with steplines since I think they can show the differences of pivots from time to time more clearly, you are free to change to other plot styles like circles or regular lines if you want to. Please like this script, and let me know any questions, thanks.

Pivots Daily Weekly Monthly YearlyDaily, Weekly, Monthly and yearly pivot lines
Just the pivot lines without the support and resistance lines

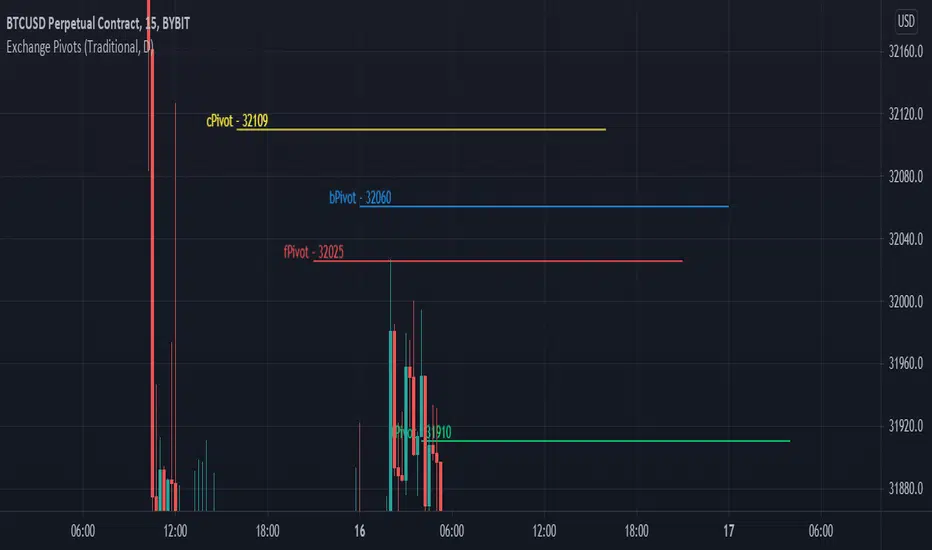
Exchange PivotsPivot points from 4 different Markets:
DailyPivot: BYBIT:BTCUSD
AsiaPivot: OKCOIN:BTCUSD
ForexPivot: FOREXCOM:BTCUSD
TradestationPivot: TRADESTATION:BTCUSD

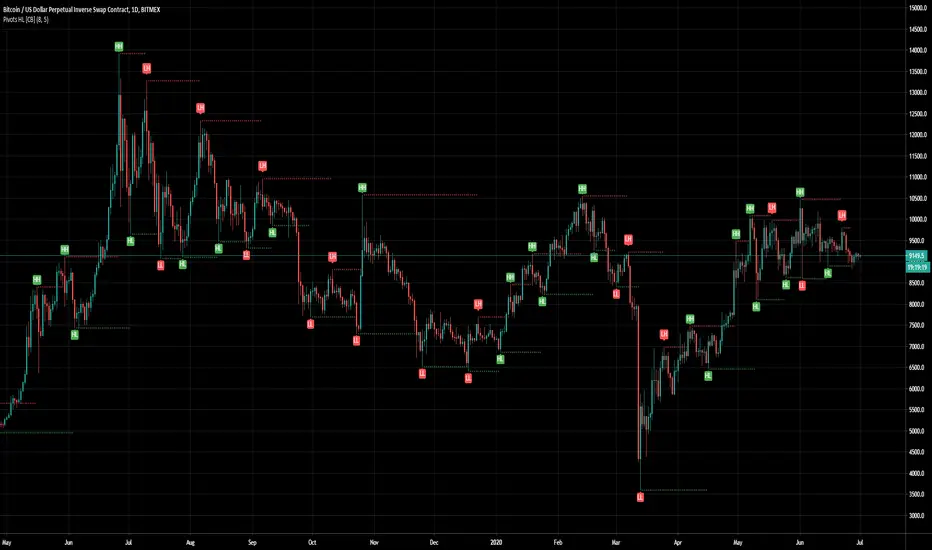
Pivot Points [CB]Automatically label pivots as HH/LH and HL/LL.
The criteria for determining pivot points can be configured.
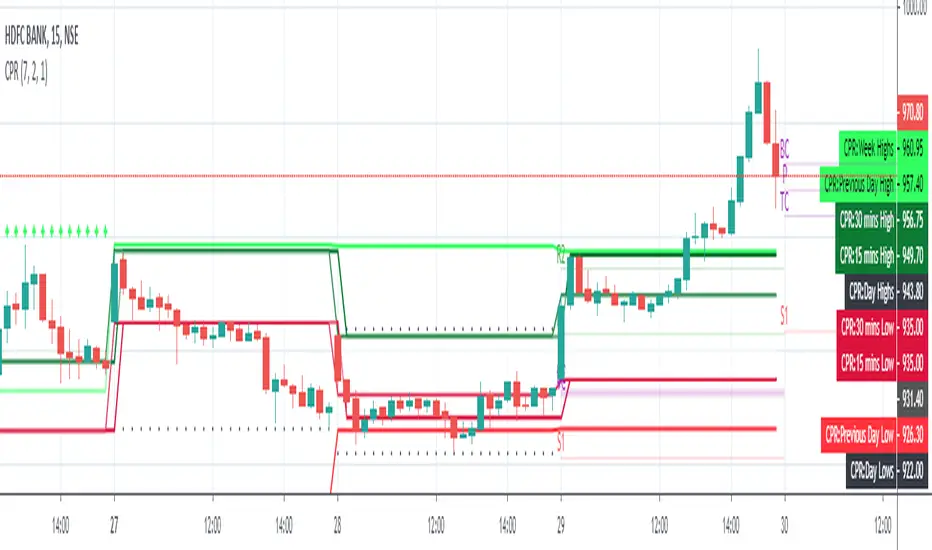
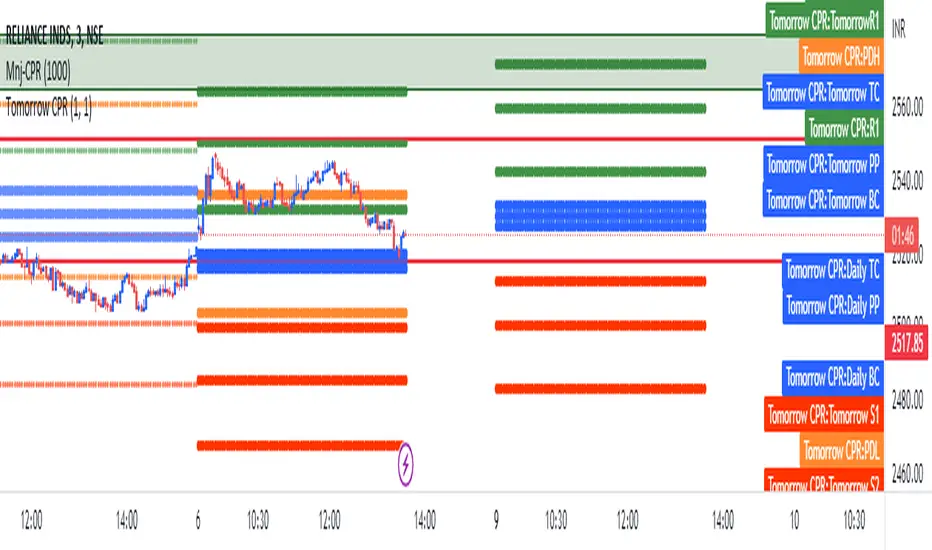
Pivot CPR by AnandI have included the following in this script which we can include all five in a single indicator.
============================
1) PIVOT POINTS
2) CAMARILLA PIVOTS
3) Opening Price
4) Previous Day High
5) Previous Day Low
You can SHOW (or) HIDE any one in the list !
Thanks,
Anand J.
Pivot Points {xqweasdzxcv}Pivot Points {xqweasdzxcv}
This indicator plots classic Pivot Point levels (PP, S1–S3, R1–R3) using the previous period’s High, Low, and Close. The pivot timeframe is fully customizable (Daily, Weekly, Monthly, etc.), making it suitable for both intraday and swing trading.
The script automatically calculates:
Pivot Point (PP)
Three Support levels (S1, S2, S3)
Three Resistance levels (R1, R2, R3)
Each level can be individually toggled on or off, with customizable colors, line width, and line style. Price labels are dynamically displayed on the right edge of the chart for quick reference.
Designed for clean visuals and practical use, this tool helps identify key market reaction zones, potential reversals, and breakout areas across any timeframe.
Created by xqweasdzxcv.

Pivot Breakouts with MA FilterPivot Breakouts with MA Filter
This script identifies pivot breakouts (both bullish and bearish) using support and resistance levels and overlays breakout labels, arrows, and customizable Moving Averages. It allows traders to fine-tune their analysis with multiple options to customize the display and behavior of the breakout signals.
Key Features:
Pivot Support and Resistance:
Support is defined by the lowest low in a given range (using the lookback period).
Resistance is defined by the highest high in a given range (using the lookback period).
The script draws support and resistance boxes on the chart when these levels change, providing clear visual markers for potential breakout areas.
Breakout Detection:
Bullish Breakout: A breakout above resistance and the price is above the selected moving average (MA).
Bearish Breakout: A breakdown below support and the price is below the selected MA.
Breakout events trigger labels indicating "Resistance Breakout" (for bullish) and "Support Breakout" (for bearish).
The option to show Breakout Labels (with customizable colors) is available in the settings.
Moving Average Filter:
You can select the type of moving average (SMA or EMA) to use for filtering breakout signals.
MA Filter Length: This input allows you to set the period of the moving average to act as a filter for breakout conditions. This helps ensure the breakout aligns with the broader trend.
Multiple Moving Averages (Optional):
You can add up to four different moving averages (SMA or EMA), each with its own length and color.
You have the option to toggle each moving average on or off and adjust their appearance settings (color and length).
The script supports dynamic plots for each moving average, helping to visualize multiple trends at once.
Breakout Arrows:
The script can display arrows (or other shapes) below the bar for bullish breakouts and above the bar for bearish breakouts.
Arrows are optional and can be turned on/off in the settings.
You can customize the shape of the arrows (e.g., arrow, circle, square, or even a large or small triangle).
Customizable Colors and Labels:
The color of the breakout labels and arrows can be customized in the settings to make them fit your chart's style and personal preferences.
Alerts:
Alerts can be set for new support and resistance levels, as well as when breakouts occur (either bullish or bearish).
The alert system helps to notify traders when significant price action takes place without needing to constantly monitor the chart.
Settings:
Select Moving Average Type (SMA or EMA)
MA Filter Length: Length of the moving average used for filtering breakout conditions.
Lookback Range: Determines the range over which the pivot points (support and resistance) are calculated.
Breakout Labels: Option to turn on/off breakout labels, and customize label colors.
Show Breakout Arrows: Enable or disable breakout arrows with shape options (arrow, circle, square, large triangle, small triangle).
Multiple Moving Averages: Option to show up to 4 MAs with customizable colors and lengths.

Pivot Point+ Supertrend + EMA + Support/Resistance- LAXMANTAK98
Pivot Point Supertrend with EMA and Support/Resistance Indicator
This custom trading indicator combines the following key components to assist in market analysis and trade decision-making:
Pivot Points:
Pivot points are calculated based on a chosen price source (High, Low, Open, or Close). These levels are used to determine potential support and resistance zones.
Pivot Highs (Resistance) and Pivot Lows (Support) are plotted as labels on the chart for easy identification.
Supertrend Indicator:
The Supertrend is a trend-following indicator that helps to identify bullish or bearish trends.
It uses the Average True Range (ATR) to calculate dynamic support/resistance levels, with adjustable settings for ATR length and multiplier factor.
The trend direction is visually represented by green (bullish) and red (bearish) lines on the chart.
Exponential Moving Averages (EMA):
The indicator plots up to four EMAs with user-defined periods (e.g., 9, 21, 50, 200).
EMAs are commonly used to smooth out price data and identify trends over various timeframes.
Support and Resistance Levels:
Based on Pivot Points, support and resistance levels are plotted using crosses on the chart.
These levels indicate possible price reversal points, helping traders spot key zones for entry and exit.
Visual Alerts:
The indicator includes built-in alerts for trend changes and potential buy/sell signals based on the transition between uptrend and downtrend states.
This combined indicator allows traders to analyze trends, identify key levels for trading, and make more informed decisions by integrating Pivot Points, Supertrend, EMAs, and Support/Resistance in one cohesive system.

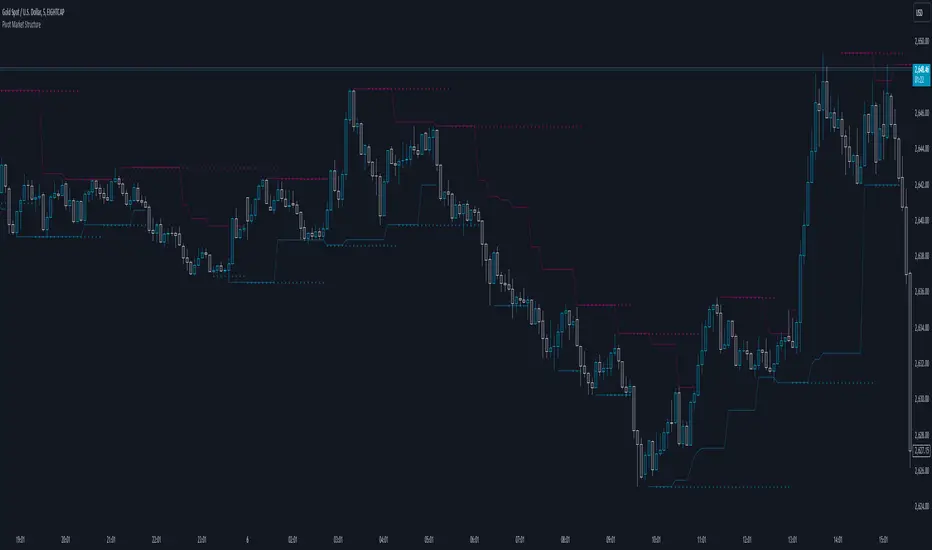
Pivot Market StructureDescription and Features
This script is designed to enhance technical analysis by identifying key market structure levels. It uses a price action trail (based on the last highest/lowest price) and pivot points to track market trends, offering insights into potential reversal zones or trend continuation signals.
How the Script Works
High/Low Trail Logic: The script includes a trail mechanism that compares the current price with the last highest and lowest price, determining whether the price has breached these levels. This helps pinpoint key price action events and potential trend shifts. Unlike pivot points the price action trail is more responsive changes within the market structure.
Step Size and Length for High/Low Trail:
- The Step Length parameter defines how many bars are used to compare the current price against the last highest/lowest price, providing a measure of price extremes.
- The Length parameter determines the number of bars considered for calculating the highest/lowest price since the last price action event (either price surpassing a previous high or dipping below a previous low).
Pivot Point Calculation: Pivot Point Highs are calculated by the number of bars with lower highs on either side of a Pivot Point High calculation. Similarly, Pivot Point Lows are calculated by the number of bars with higher lows on either side of a Pivot Point Low calculation. The script draws a line from/to every calculated pivot point to highlight market structure extremes. It can optionally extend these pivot lines to the left for added context, providing historical reference for decision-making.
Summary
By combining both pivot analysis and price action trailing techniques, the script provides a comprehensive view of a pivot point based market structure.
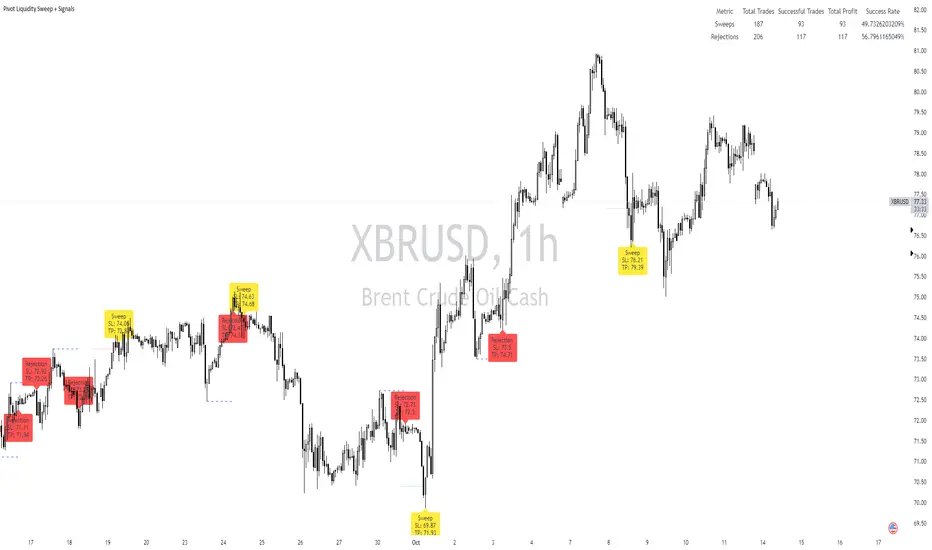
Pivot Liquidity Sweep + SignalsCore Functionalities:
Sweep Signals:
The indicator identifies sweeps of liquidity by detecting when price exceeds recent pivot highs (swing highs) or pivot lows (swing lows) and then reverses direction. It draws attention to these scenarios by labeling them on the chart.
For bullish sweep signals, the entry point is the closing price of the sweep candle, with the stop loss placed at the highest point between the sweep candle and the previous candle.
For bearish sweeps, the entry point is similarly identified, with the stop loss being the lowest price of the sweep candle and the candle before it. The profit target is dynamically set to the low or high of the closest valid pivot depending on the direction of the trade.
Rejection Signals:
Rejection signals are identified when price attempts to break a pivot high or low but fails, causing a rejection.
Bullish rejections involve price trying to break a pivot low but closing back above it, indicating potential for a bounce.
Bearish rejections follow a similar pattern, with price attempting to break a pivot high but failing to hold above it, signaling a potential bearish move.
High-Precision Intrabar Data:
The "Intrabar Precision" feature allows the indicator to use lower timeframe data to accurately plot sweeps and rejections, providing traders with precise entry and exit points.
The intrabar settings are particularly useful for traders looking for high-precision trades, such as scalpers who want to capture small yet consistent moves.
ATR and Percentage-Based Filters:
The indicator allows for customizable filters to ensure signals meet certain thresholds before being validated. Traders can use ATR (Average True Range) or percentage-based conditions to filter out low-quality signals, ensuring that the trades captured have enough volatility or price movement potential.
Dashboard:
The built-in dashboard provides a quick overview of trades executed using the indicator, displaying metrics such as the total number of sweep and rejection trades, their success rates, and total profit in points.
The dashboard is color-coded for easy reading and offers traders insights into the overall performance of their strategy, helping with ongoing evaluation and optimization.
Labeling and Alerts:
Every time a sweep or rejection signal is detected, the indicator automatically labels the chart to help traders quickly identify the trading opportunities.
Alerts are also generated for each trading signal, providing the trader with real-time notifications, which can be useful for those who are not constantly monitoring their charts.
Stop Loss and Target Adaptation:
The stop loss levels are adjusted dynamically based on the recent pivot points, and the target profit is derived from valid subsequent pivot levels to ensure realistic and efficient trade exits.
Pivot Length BandsPivot Length Bands Indicator
Description:
The Pivot Length Bands indicator is designed to visualize price volatility based on pivot points and ATR-adjusted pivot points. I. These bands can help traders identify potential support and resistance levels and assess the current volatility of the market.
Inputs:
Swing Length: The length of the swing used to calculate the pivot points and average true range.
Pivot Length Left Hand Side: The number of candles to the left of the current pivot point to consider when calculating the pivot high and low.
Pivot Length Right Hand Side: The number of candles to the right of the current pivot point to consider when calculating the pivot high and low.
Usage:
Traders can use the bands as potential levels for placing stop-loss orders or profit targets.
The width of the bands adjusts dynamically based on the current volatility of the market.
Note:
This indicator is best used in conjunction with other technical analysis tools and should not be relied upon as a standalone trading signal.
EXAMPLE 1:
Entry:
Exit:
EXAMPLE 2:
Entry:
Exit:

Pivot Point Trend LineThis Indicator simply draw lines between high pivot points and low points.
in the code by default its used tradingview default ta.pivothigh and ta.pivotlow function to get the high and low points.
it will generate recent 4 lines of high and low pivot points.
you can change the no of days for both highs and lows pivot points.
this script is not generating any buy or sell signals its just autodraw and connect 2 pivot points. so you dont have to do it manually.


Pivot Boss IndicatorsPivot boss indicators shows central pivot range and pivot levels for support and resistance.

Pivot HL Trading SetupThis simple script base on function of Pivot High Low to plot Trading Setup on chart with detail as below:
2. Trading Setup
2.1 Buy setup
+ New Pivot Low is plotted
+ Entry Long at market price.
+ Stoploss at Pivot Low
+ Takeprofit at Pivot High
+ Buy setup invalidation when price crossed Pivot High or Pivot Low
2.1 Sell setup
+ New Pivot High is plotted
+ Entry Short at market price.
+ Stoploss at Pivot High
+ Takeprofit at Pivot Low
+ Sell setup invalidation when price crossed Pivot High or Pivot Low

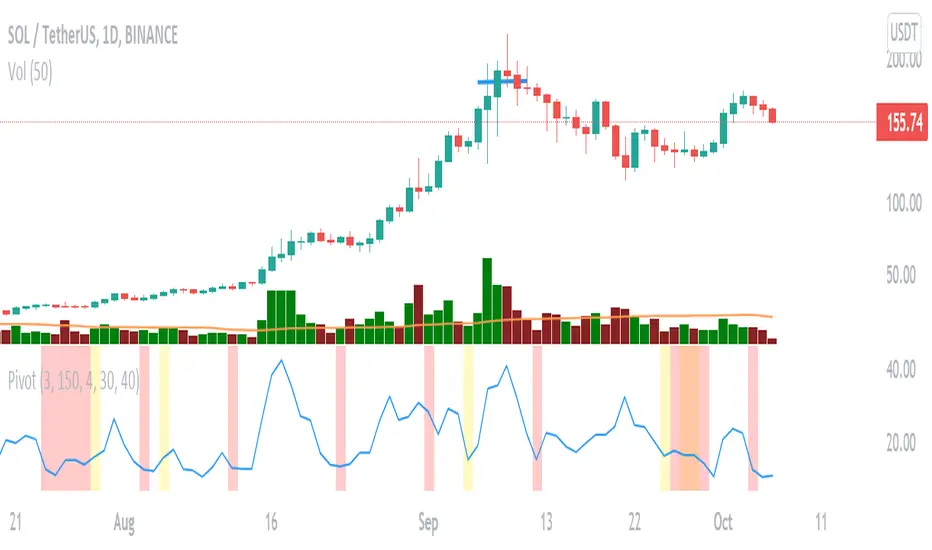
Pivot Point (MM)It helps indicate the contraction point so that we can have a low-risk entry of a buy point.
It followed the strategy of Mark Minervini.
changing the lookback period input to change the percentile
changing the Pivot Length to decide how many bars you would consider as a pivot
changing the Close range to decide in how much percentage does the close range you would consider as a pivot
The percentile rank is represented in the colour of the background, you can alter how low you want to set to indicate lowering volatility.
The blue line shows the percentage range in ( pivot length) days/bars
The coloured background shows the signal of pivot point forming
Pivot and liquidation lines [LM]Hello traders,
I would like to introduce you pivot and liquidation zones. Levels are rendered based on pivot points. We are looking for confluence of liquidation lines in order to have the gist where the market could go. calculation for the liquidation lines are taken from Bybit. It's good to look for line clusters. Indicator doesn't tell you where the market will go but it tells you where are the potential zones of position liquidations
There are several settings:
pivot setting - ordinary pivot lines setting
first leverage - setting for first leverage
second leverage - setting for second leverage
third leverage - setting for first leverage
fourth leverage - setting for second leverage
Hope you will enjoy it.
