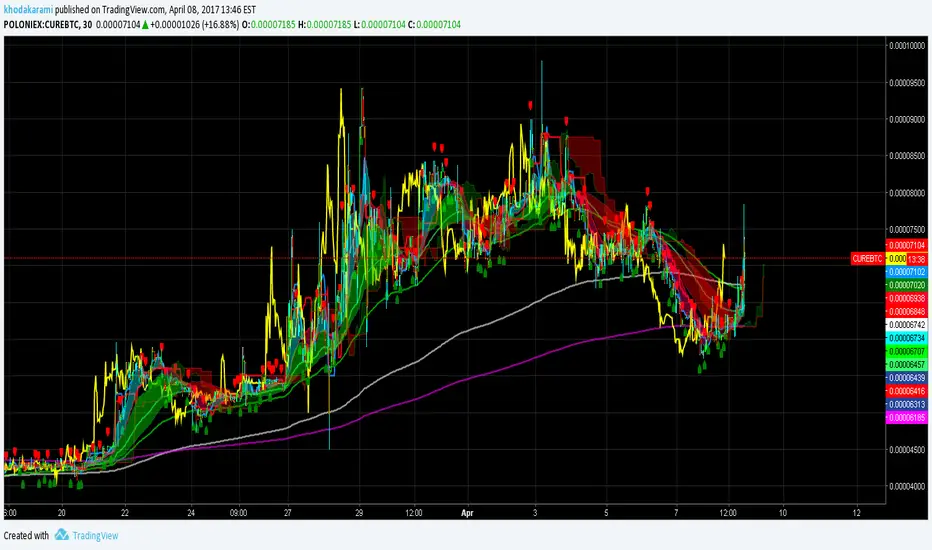
Multiple Moving AveragesThis is really simple. But useful for me as I don't have a paid account. No-pro users can only use 3 indicators at once and because I rely heavily on simple moving averages it can be a real pain.
This one indicator features:
20 MA
50 MA
100 MA
200 MA
which I find are the most useful overall. The 20 and 50 over all time frame but in particular < 1 day, the 100 and 200 at > 4 hr time frames. In general I don't use the 100 MA that much. The daily 200 MA is a critical support for many assets like stocks and cryptos. I'm by no means a pro and if you are learning I recommend becoming familiar with moving averages right at the beginning.
If you want to deactivate some of the lines, you can do it via the indicator's settings icon.
Recherche dans les scripts pour "pro"

Custom Time Frame, Inverse Price CapabilityAt it again. This time I've added to the custom time frame indicator an inversion capability. This way you can look at the inverse price of custom time frames, again without having to go pro!
I use it too look at downtrends with the same bias as I do uptrends. Unfortunately usually to look at the inverse on timeframes anything other than the 1D chart you need a pro account, but not with this indicator!
Enjoy.

Guerrilla AdvancedThis indicator was designed with people without Pro License in mind (Including many of my close friends).
Basically, you will get a combo of few different tools in one box, with ability to turn them on and off with a single check mark, also, you have total control over the input numbers that was used in calculations if you so want to, for example, sometimes when i see a massive bullish up trend, i reduce the short rally from 12 to 8 even 6 to get faster signal for selling the trend.
So, what will you get in this pack?
1- Ichimoko. Yes, you heard it right, although we have it in the default tools but hey, it will use one indicator slot and if you don't have a pro license, you will use that slot
2- Rally. This is an old yet very powerful system for getting buy or sell signals, basically, you get two lines and for making the life easier i draw a cloud between them. when the trend passes above the cloud and it was bellow it in past, right after the very first candle that gets above the cloud you can put the buy order, and vice versa, the moment a candle body enters the cloud, if you want an aggressive signal, you can sell, if not, you may want to wait to see if the candles drop bellow the cloud or not then decide.
3- Resistance Support Cloud. Most of us always heard about resistance and support "lines" but many of us don't know that, in each trend, the trend line itself is a resistance or support line, and when you are going in a bullish or bearish tunnel, the floor and roof of tunnels are again resistance and supports, using this part of the tool, just like rally, you get a cloud that shows you the resistance / support "zone"
4- William Fractals. To be honest, I got this part of the code from another source available around. Why? looking at those fractal indicators, you can easily eyeball the trend line or existence of a tunnel.
5- Different EMA lines. If you are one of those people that use EMA lines for their trading, have fun with them, there are few different standard ones and even a custom one that you can put your desired number for it.
Cinematic Session Fade [Pro]🎬 Cinematic Session Fade — A Clean Way to See Market Mood
This indicator is designed to enhance visual clarity, not clutter your chart.
Instead of adding more lines, boxes, or signals, it uses soft cinematic session shading to show how market behavior naturally changes throughout the day.
🌍 Session-Based Market Atmosphere
Asia Session (Calm Blue)
Represents balance, low volatility, and range-building conditions.
London Session (Warm Gold)
Highlights the transition phase where momentum often starts to build.
New York Session (Deep Red)
Emphasizes decision-making hours, volatility, and directional moves.
The session colors fade smoothly in the background, creating a professional and distraction-free viewing experience.
🎨 Why This Indicator Looks Clean & Professional
No indicators stacked on price
No buy/sell arrows or noisy labels
Soft, eye-friendly background shading
Clean candle colors for clear price focus
Optimized for dark mode charts
This makes the chart easy to read, easy on the eyes, and visually attractive for both analysis and screenshots.
🧠 How Traders Use It
Identify which session the market is in at a glance
Adjust expectations for volatility and behavior
Combine with your own strategy (structure, SMC, trend, or price action)
Perfect for education, market commentary, and clean chart presentations
📈 Best Markets
Forex
Gold (XAUUSD)
Bitcoin & Crypto
Indices
🎯 Final Note
This tool does not predict price.
It simply provides context and atmosphere, helping traders stay aligned with market rhythm while keeping charts elegant and professional.
If you value clarity over clutter, this indicator is built for you.

Druckenmiller 2nd Order ROC [Acceleration]How to Read It (The User Guide)
This indicator doesn't just tell you if the price is going up or down; it tells you if the energy behind the move is growing or dying.
1. The Zero Line (The "Engine Check")
Think of the Zero Line as the difference between a car accelerating and coasting.
Crossing Above 0: The engine just kicked in. Buyers are stepping on the gas. Even if the candle is red, the internal momentum has turned bullish.
Action: Look for Longs.
Crossing Below 0: The engine is off. The car might still be rolling forward (price going up), but it's slowing down.
Action: Tighten Stops / Look for Shorts.
2. The Colors (The "Phase" Check)
🟢 Bright Green (Positive Acceleration):
Meaning: Price is moving up faster than before.
Action: Hold. This is the strongest part of the trend.
🟢 Faded Green (Positive Deceleration):
Meaning: Price is still moving up, but the "pop" is gone. It's struggling.
Action: Caution. Watch for a top.
🔴 Bright Red (Negative Acceleration):
Meaning: Panic. Price is crashing faster every candle.
Action: Hold Short / Stay Out.
🔴 Faded Red (Negative Deceleration):
Meaning: The selling is drying up. The crash is slowing down.
Action: Watch for a Bounce.
3. The "Druckenmiller Divergence" (The Money Shot)
This is the setup Stan Druckenmiller looks for—when the indicator disagrees with the price.
Bullish Reversal: Price makes a Lower Low (looks bad), BUT the Indicator makes a Higher Low (less red).
Translation: Sellers are exhausted. A rip your face off rally is imminent.
Bearish Reversal: Price makes a Higher High (looks good), BUT the Indicator makes a Lower High (less green).
Translation: Buyers are exhausted. The trend is hollow and about to collapse.
Pro Tip: Use this on Weekly or Monthly charts to find major market turns, just like Druckenmiller does. On 5-minute charts, it will be noisy.

Full Dashboard V20 - Pro PA & Stoch OVB/OVS StatusTable (Multi timefram)
- show Trend
- show rsi
- show Stoch
- show prev candle (default hide)
- show curr candle (default hide)
- shows the time when the candlestick will close.
--can config show/hide all column
Graph
- show rsi 89/21
Signal
- show signal with tp/sl (default hide)

Full Dashboard V18 - Pro PA & Column CustomizationTable (Multi timefram)
- show Trend
- show rsi
- show Stoch
- show prev candle (default hide)
- show curr candle (default hide)
- shows the time when the candlestick will close.
- can config show/hide all column
Graph
- show rsi 89/21
Signal
- show signal with tp/sl (default hide)

Institutional Top-Bottom by Herman Sangivera (Papua)Institutional Top-Bottom + Volume Profile by Herman Sangivera ( Papua )
📈 Component Description
Orange Line (POC - Point of Control): This represents the "Fair Value." Institutions view prices far above this line as "Expensive" (Premium) and prices below as "Cheap" (Discount).
Green/Red Boxes (Order Blocks): These are footprints left by big banks. A Green Box is a demand zone where institutional buying occurred, and a Red Box is a supply zone where institutional selling happened.
Institutional Labels: These appear when the RSI Divergence confirms that price momentum is fading, signaling a high-probability reversal (Top or Bottom).
🚀 Trading Strategy Guide
1. The High-Probability Buy Setup (Bottom)
Look for a "Confluence" of these three factors:
Location: Price is trading below the Orange POC line (Discount zone).
The Zone: Price enters or touches a Green Order Block.
The Signal: The "INSTITUTIONAL BUY" label appears.
Entry: Enter Buy at the close of the candle with the label.
Stop Loss: Place it just below the Green Order Block.
Take Profit: Target the Orange POC line or the nearest Red Order Block.
2. The High-Probability Sell Setup (Top)
Look for a "Confluence" of these three factors:
Location: Price is trading above the Orange POC line (Premium zone).
The Zone: Price enters or touches a Red Order Block.
The Signal: The "INSTITUTIONAL SELL" label appears.
Entry: Enter Sell at the close of the candle with the label.
Stop Loss: Place it just above the Red Order Block.
Take Profit: Target the Orange POC line or the nearest Green Order Block.
💡 Pro Tips for Accuracy
Timeframes: For the best results, use 15m for Scalping, and 1H or 4H for Day/Swing Trading.
Wait for the Candle Close: Labels are based on Pivot points. Always wait for the current candle to close to ensure the signal is locked and won't "repaint."
Avoid Flat Markets: This indicator works best when there is volatility. Avoid using it during "choppy" or sideways markets with very low volume.

TOA SESSION INDICATOR PRO - MARKED WITH COLORSThis indicator is made for The Orderflow Academy community.
You can see the highs and lows of the sessions in colors.

UFX PRO How it works
The indicator plots a single line on the chart that changes position and color depending on the trend:
🟢 Uptrend:
The SuperTrend line is below the price → bullish bias
🔴 Downtrend:
The SuperTrend line is above the price → bearish bias
When the price crosses the SuperTrend line, it often signals a potential trend reversal.
✅ Advantages
✔ Easy to read
✔ Works well in trending markets
✔ Adaptive to volatility
✔ Useful for stops and trend confirmation

[Sumit Ingole] 200-EMA SUMIT INGOLE
Indicator Name: 200 EMA Strategy Pro
Overview
The 200-period Exponential Moving Average (EMA) is widely regarded as the "Golden Line" by professional traders and institutional investors. This indicator is a powerful tool designed to identify the long-term market trend and filter out short-term market noise.
By giving more weight to recent price data than a simple moving average, this EMA reacts more fluidly to market shifts while remaining a rock-solid trend confirmation tool.
Key Features
Trend Filter: Instantly distinguish between a Bull market and a Bear market.
Price above 200 EMA: Bullish Bias
Price below 200 EMA: Bearish Bias
Dynamic Support & Resistance: Acts as a psychological floor or ceiling where major institutions often place buy or sell orders.
Institutional Benchmark: Since many hedge funds and banks track this specific level, price reactions near the 200 EMA are often highly significant.
Reduced Lag: Optimized exponential calculation ensures you stay ahead of the curve compared to traditional lagging indicators.
How to Trade with 200 EMA
Trend Confirmation: Only look for "Buy" setups when the price is trading above the 200 EMA to ensure you are trading with the primary trend.
Mean Reversion: When the price stretches too far away from the 200 EMA, it often acts like a magnet, pulling the price back toward it.
The "Death Cross" & "Golden Cross": Use this in conjunction with shorter EMAs (like the 50 EMA) to identify major trend reversals.
Exit Strategy: Can be used as a trailing stop-loss for long-term positional trades.
Best Used On:
Timeframes: Daily (1D), 4-Hour (4H), and Weekly (1W) for maximum accuracy.
Assets: Highly effective for Stocks, Forex (Major pairs), and Crypto (BTC/ETH).
Disclaimer: This tool is for educational and analytical purposes only. Trading involves risk, and it is recommended to use this indicator alongside other technical analysis tools for better confirmation.

Dav1zoN PRO: MACD + RSI + ADXThis indicator is a momentum and trend-strength tool designed to stay clear and readable on all timeframes, especially lower TFs where most indicators become noisy or flat.
It combines MACD Histogram, RSI, and ADX into a single adaptive system, with automatic scaling and smoothing, so values stay proportional without using static horizontal levels.

Patterns and AlertsPatterns and Alerts — TradingView Indicator Documentation
© 2026 Arup Sarkar
Indicator Name: Patterns and Alerts
Version: 1.0
About Me:
Spent 32+ years in the software industry and now a full time trader. I did not find an indicator that keeps the chart clean, addresses candle and chart patters combined and provide alerts. This is my first release and by Feb end, I will include all chart/candle patterns, trend line & most vital, Smart Money intent behind patterns (candle and chart).
Description
The Indicator: Patterns and Alerts is a comprehensive indicator that detects candlestick and classical chart patterns, provides real-time alerts, and keeps charts clean with minimalist visuals. It helps traders identify actionable price patterns across all timeframes and asset classes.
Key Features
- Detects Bullish/Bearish Pin Bars
- Detects Double Top, Head & Shoulders, Rising Wedges, and Falling Wedges
- Generates alerts once per confirmed pattern
- Uses thin lines and optional pivot labels for clean visuals
- Works on all timeframes (1-minute to Daily)
Alerts
- Pattern type
- Pivot prices (if applicable)
- Symbol
- Timeframe
Pro Tips
- For aggressive detection, decrease Pivot Length & Pin Bar Wick Ratio
- For conservative detection, increase Pivot Length & Pin Bar Wick Ratio
- Disable labels on lower timeframes to reduce clutter
- Combine alerts with trend indicators, volume, or higher timeframe analysis for confirmation
- Can integrate alerts via webhooks for automated trading
Author / Credit
Arup Sarkar

Pradip's MACD Divergence ProThis is where the "magic" happens, Pradip. MACD Divergence is one of the most powerful concepts because it acts like an early-warning system. It tells you when the market is "lying"—when the price is moving up or down, but the energy (momentum) behind it is dying.

EURCHF Pro: 1H Trend + Prob + Sessions + Timer + SwingsEURCHF – Table Explanation (Calm & Precision)
EURCHF is a slow and controlled pair.
The table focuses on patience and precision.
🔹 Market Trend (1H)
If the trend is not clear → no trade
EURCHF dislikes choppy markets
👉 The table helps you stay out of bad conditions.
🔹 Session
Best time:
London session only
👉 LOW session = stay out.
🔹 Candle Time Left
Less critical than other pairs.
Still useful for final confirmation
👉 No need to rush.
🔹 Buy / Sell Probability
Best results at 60%+
Fewer trades, higher quality
👉 One clean trade is better than many weak ones.
🔹 RSI / Volume
RSI moves slowly
Weak volume = low continuation
🟢 Result:
A precision-focused table for patient traders.

Trend-ProE un trend basado en medias móviles de hull, 1 acelerada un 20% y otra normal de periodo mas largo

GBPJPY Pro: 1H Trend + Prob + Sessions + Timer + Swings📊 GBPJPY – Table Explanation (High Volatility Control)
GBPJPY is fast and volatile.
The table is designed to protect you before profit.
🔹 Market Trend (1H)
The most important field for this pair.
Trading against the trend is very risky
👉 Always follow the 1H trend.
🔹 Session
Best trading times:
London
London–New York Overlap
👉 Avoid trading outside these sessions.
🔹 Candle Time Left
Extremely important for GBPJPY.
Entering before candle close can be dangerous
👉 Always wait for confirmation.
🔹 Buy / Sell Probability
50%+ can be acceptable due to strong moves
“READY” status is more important than the number
👉 Quality over quantity.
🔹 RSI / Volume
RSI moves fast
Strong volume often precedes sharp moves
⚠️ Result:
A defensive table that helps avoid late or emotional entries.

USDJPY Pro: 1H Trend + Prob + Sessions + Timer + Swings
📊 USDJPY – Table Explanation (Balanced & Clean)
USDJPY is a well-balanced pair with smooth trends.
The table helps you enter calmly and precisely.
🔹 Market Trend (1H)
Shows the main direction from the 1-Hour timeframe.
BULL → Look for BUY only
BEAR → Look for SELL only
👉 USDJPY respects trend direction very well.
🔹 Session
Displays the current trading session.
London & New York = best volatility
LOW = slow market
👉 Helps you avoid trading during dead hours.
🔹 Candle Time Left
Shows how much time remains before the candle closes.
👉 Very useful for waiting for candle confirmation on USDJPY.
🔹 Buy / Sell Probability
Shows the strength of BUY or SELL setups in %.
55%+ is usually sufficient for this pair
👉 Helps avoid weak or early entries.
🔹 RSI / Volume
Confirms momentum and activity.
Strong volume = better follow-through
✅ Result:
A clean table designed for disciplined, trend-based trading.

OIL (WTI) Pro: 1H Trend + Prob + Sessions + Candle TimerIndicator Features
📈 Multi-Timeframe Trend Detection (1H)
Identifies the main market trend from the 1-Hour timeframe
Displays the trend clearly as Bullish / Bearish / Sideways
Avoids trading against the higher-timeframe direction
🎯 Smart BUY & SELL Signals (On Candles)
Clear BUY and SELL signals directly on the candles
Signals are placed below lows (BUY) and above highs (SELL)
Uses ATR offset so signals are always visible and never hidden inside candles
📊 Separate Buy & Sell Probability
Calculates BUY Probability and SELL Probability independently
Probabilities are shown as percentages
Helps traders decide when to enter and when to wait
🧠 Pullback-Based Logic (No Chasing Price)
Signals are generated only after healthy pullbacks
Prevents entering trades when price is overextended
Displays a “Wait for Pullback” warning during strong trend extensions

ANTS MVP Indicator David Ryan's Institutional Accumulation🚀 ANTS MVP Indicator – David Ryan's Legendary Accumulation Signal
Discover stocks under heavy **institutional buying** before they explode — just like 3-time U.S. Investing Champion David Ryan used to crush the markets!
This is a faithful, open-source recreation of the famous **ANTS (Momentum-Volume-Price)** pattern popularized by David Ryan (protégé of William O'Neil / IBD / CAN SLIM fame). It scans for the classic 15-day "MVP" setup that often appears in early stages of massive winners.
Key Features:
• Colored "Ants" diamonds show signal strength:
- Gray: Momentum only (12+ up days in 15)
- Yellow: Momentum + Volume surge (≥20% avg volume increase)
- Blue: Momentum + Price gain (≥20% rise)
- Green: FULL MVP (all three!) – the strongest institutional demand signal!
• Toggle to show ONLY green ants for cleaner charts
• Position ants above or below bars
• Built-in alert for NEW green ants (copy the alert condition or use alert() triggers)
• Optional background highlight + label on the last bar for quick spotting
Why ANTS Works:
- Flags consistent up-days + volume explosion + solid price advance
- Often clusters before major breakouts (cup-with-handle, flat bases, etc.)
- Used by pros to find leaders early (think NVDA, TSLA, CELH runs)
- Great for daily charts + combining with RS Rating, earnings growth, and market uptrends
How to Use:
1. Add to daily stock charts
2. Watch for GREEN ants (full MVP) in bases or near pivots
3. Wait for volume breakout above resistance for entry
4. Set alerts for "GREEN ANTS MVP detected!" to catch them live
Fully open code – feel free to tweak thresholds (lookback, % gains, etc.)!
Inspired by public descriptions from IBD, Deepvue, and Ryan's teachings.
If this helps you spot winners, drop a ❤️ like, comment your biggest ANTS catch, and follow for more CAN SLIM-style tools!
Questions? Want screener tweaks or strategy version? Comment below!
#ANTS #DavidRyan #MVPPattern #InstitutionalAccumulation #CANSLIM #TradingView #MomentumTrading #StockScanner The time it takes for a stock to rise significantly after a green ANTS (full MVP) signal appears varies widely — there is no fixed or guaranteed timeframe. The ANTS indicator (developed by David Ryan) flags strong institutional accumulation over a rolling ~3-week (15-day) period, but the actual price breakout or major advance often comes later, after further consolidation or a proper setup.
Typical Timings from Real-World Usage and Examples
Short-term (days to weeks): Sometimes the green ants appear during or right at the start of a breakout — price can rise 10–30%+ in the following 1–4 weeks if momentum continues and volume supports it (e.g., Rocket Lab (RKLB) showed ANTS strength ahead of a powerful breakout in examples from IBD).
Medium-term (weeks to months): More commonly, green ants signal early accumulation while the stock is still building or tightening in a base (e.g., cup-with-handle, flat base, high tight flag, or pullback to 10/21 EMA). The big move (often 50–200%+) happens after the stock forms a proper buy point (pivot breakout on high volume), which can take 2–12 weeks after the first green ants.
Longer-term leaders: In historical CAN SLIM winners, ANTS often appeared during the stealth accumulation phase (before the stock became obvious), with the major multi-month/year run starting 1–6 months later once the market confirmed an uptrend and the stock broke out.
Key points from David Ryan/IBD sources:
ANTS is a demand confirmation tool, not a precise timing signal.
Many stocks with green ants are extended when the signal fires — wait for a pullback/consolidation before expecting the next leg up.
In strong bull markets, clusters of green ants over several bars increase the odds of an imminent or near-term move.
If no breakout follows within ~1–3 months (and market weakens), the signal may fizzle — cut losses or move on.
Bottom line: Expect 0–3 months for meaningful upside in good setups, but always wait for a classic buy point (breakout above resistance on volume) rather than buying the ants alone. Backtest examples (e.g., via TradingView replay on past leaders like NVDA, TSLA, or CELH during their runs) to see the lag in action.

Smart Auto-Step Open (1H Base)The "Big Brother" to the 15m Open: While the 15m Open is perfect for scalping entries, this indicator is designed for Trend Direction & Bias. It automatically identifies the major Hourly and Daily opening levels, giving you the "Big Picture" context instantly.
🧠 Smart Auto-Step Logic: This script detects your timeframe and automatically upgrades the level to the next major resistance:
Intraday Mode (1s – 1H): Locks to the 1-Hour Open. This is your primary "Bull/Bear" line for the session.
Swing Mode (4H): Automatically switches to the 4-Hour Open.
Daily Mode (D): Automatically switches to the Daily Open.
Noise Filter: Hides automatically on intermediate frames (like 2H or 3H) to keep your chart clean.
✨ Luxury Visuals:
Floating Labels: No ugly boxes. Text floats cleanly in the right-side margin.
Custom Typography: Includes a "Luxury" setting that uses Bold Serif Unicode characters (e.g., 𝟏𝐇 𝐎𝐩𝐞𝐧) for a high-end, institutional look.
Dark Mode Optimized: Defaulted to Bright White for maximum contrast.
🚀 Key Features:
Zero-Lag Anchor: Uses time-based coordinates to ensure the line never repaints.
Smart Visibility: Works perfectly even if you are viewing the 1H chart itself (prevents the "disappearing line" bug).
Price Tags: Displays the exact price with a $ symbol.
PRO Strategy (The "Confluence" Setup): Load this indicator together with the "15m Open" version.
When Price is above the 15m Open AND the 1H Open → Strong Buy Signal.
When Price is below both → Strong Sell Signal.
Settings:
Font Style: Modern, Luxury, or Hacker.
Offset: Move the label right/left.
Color: Fully customizable.

Bulkowski Breakout vPRO (5m) - Runtime FixedHere is the English translation of your strategy guide, tailored for international traders while maintaining your encouraging tone.Strategy Guide: Bulkowski Breakout vPROFor Aspiring "Golden Traders"This strategy is designed for beginners to trade with the "flow of power." In short, it is a momentum-following strategy that enters a trade when a strong price move (Long Body Candle + High Volume) breaks through a key psychological level (200 EMA).1. Core Concept: "The High-Energy Breakout"Based on the principles of Thomas Bulkowski, a legendary master of chart patterns, this strategy prioritizes high-energy moves over simple price touches. A signal (LONG or SHORT) is only generated when these three conditions align:200 EMA Break (The Baseline): The 200-period Exponential Moving Average is the "life-line" of the market. Price breaking above this line indicates a powerful shift from a bearish to a bullish trend.Long Body Candle (Volatility): The candle body must be at least 2x larger than the recent average. This serves as evidence of institutional or "whale" buying/selling.Volume Surge (Reliability): Trading volume at the moment of breakout must be 1.5x higher than the recent average. This confirms the move is genuine and not a "fake-out."2. Session Filter (Optimized for Peak Volatility)To avoid "choppy" sideways markets, this strategy only operates during the first two hours of the major global market opens, when liquidity is at its highest.MarketTime (KST / UTC+9)Market CharacteristicsAsia Session09:00 ~ 11:00Opening of Korean, Japanese, and Chinese markets.Europe Session16:00 ~ 18:00Volatility spikes as the London market opens.US Session22:00 ~ 24:00Peak global liquidity as New York opens.Signals only appear when the chart background is shaded blue. All other times are "resting periods" to protect your capital.3. Execution GuideEntryLONG (Buy): Enter when a large green candle breaks above the yellow 200 EMA with high volume. (Green triangle label appears).SHORT (Sell): Enter when a large red candle breaks below the yellow 200 EMA with high volume. (Red triangle label appears).Take Profit (TP) & Stop Loss (SL)Lines are automatically drawn on your chart once you enter:Orange Line (Stop Loss): Automatically set at the low (or high) of the last 3 candles. If the price touches this, the trade closes to prevent further loss.Green Line (Take Profit): Automatically set at 1.5x your risk. This ensures a healthy 1:1.5 Risk-to-Reward ratio.4. Pro-Tips for BeginnersOptimized for 5m: This strategy works best on the 5-minute (5m) timeframe. 1m is often too noisy, and 15m can be too slow for scalping.Watch Bitcoin: Even if an altcoin gives a LONG signal, be cautious if Bitcoin is currently crashing. BTC dictates the overall market direction.Adjusting Sensitivity: If signals are too rare, go to "Settings" and lower the Long Body Multiplier from 2.0 to 1.5.This indicator is built to help you trade based on statistical advantages, not emotions. We strongly recommend practicing with Paper Trading first to get a feel for the signals.To everyone dreaming of becoming a Golden Trader—Success is a marathon, not a sprint!

Dynamic Flow Ribbon [Adaptive]The Dynamic Flow Ribbon is a next-generation trend-following tool designed to solve the two biggest problems traders face: Lag and Noise .
Unlike traditional Moving Averages (SMA/EMA) that are often too slow to catch reversals or too sensitive to chop, this indicator utilizes Rational Quadratic Kernel Smoothing . This advanced mathematical approach creates a "Flow Ribbon" that hugs price action tightly during trends while remaining silky smooth, filtering out the random noise that leads to false signals.
This is not just a crossover indicator; it is a complete Market Regime Detector . It automatically identifies when the market is trending and when it is ranging, helping you stay out of dangerous "chop" zones.
Why Use This?
Zero-Lag Smoothing: Experience the responsiveness of a fast EMA with the smoothness of a slow SMA.
Chop Filter: The ribbon automatically turns Gray when volatility (ADX) drops, signaling you to sit on your hands and preserve capital.
Visual Clarity: No messy lines. Just a clean, glowing ribbon that tells you the trend direction instantly.
How It Works
The indicator calculates two dynamic curves:
Fast Flow Line: Tracks immediate price action using a tight kernel window.
Base Flow Line: A slower, weighted baseline that acts as the trend anchor.
The Ribbon: The space between these lines forms the "Ribbon."
Green (Bullish): Fast Flow > Base Flow. The trend is Up.
Red (Bearish): Fast Flow < Base Flow. The trend is Down.
Gray (Flat): Volatility is too low (ADX < Threshold). The market is sideways.
How to Trade
This tool is best used for Trend Continuation and Reversal Catching .
The Entry: Wait for a Crossover Signal (Small Circle).
Buy when the Ribbon flips Green.
Sell when the Ribbon flips Red.
The Filter: If the Ribbon is Gray , ignore all signals. This prevents you from getting whipsawed in a ranging market.
The Exit: You can ride the trend until the Ribbon flips color, or use your own support/resistance targets.
Settings
Bandwidth (Smoothness): Adjusts the sensitivity of the kernel. Higher values = smoother ribbon (better for swing trading). Lower values = faster reaction (better for scalping).
Trend Filter: Toggle the ADX-based chop filter on/off.
Visuals: Fully customizable colors to match your chart aesthetic.
Pro Tip: Combine for Maximum Accuracy
While the Dynamic Flow Ribbon is excellent for Trend Direction, it does not plot Support & Resistance levels.
For the ultimate trading setup, I highly recommend pairing this with my AIO Pivot Master
or any other pivot indicator, which you can easily find on TradingView.
Use Dynamic Flow to determine the Direction .
Use AIO Pivot Master to find your Entry and Exit targets .
Disclaimer
For Educational and Informational Purposes Only
This indicator is provided for educational and informational purposes only and DOES NOT constitute financial, investment, or trading advice. It does not predict future market movements with certainty.
Risk Warning
Trading in financial markets (Stocks, Crypto, Futures, Forex, etc.) involves a high degree of risk and may not be suitable for all investors. You could lose some or all of your initial investment. Past performance of any trading system or methodology is not necessarily indicative of future results.
No Liability
The author of this script assumes no responsibility or liability for any errors or omissions in the content of this indicator, or for any trading losses or damages incurred as a result of using this tool. Users are solely responsible for their own trading decisions and should always use proper risk management. By using this script, you acknowledge and agree to these terms.
