VWAP CATS background flipped 4.0VWAP CATS Background Flipped 4.0 is a sophisticated Pine Script v5 indicator for TradingView that combines a configurable moving average (MA) with dynamic Gann Square of 9 levels to create a multi-layered background shading system for price action analysis. It visualizes support/resistance zones around a central MA (often VWAP or RVWAP) using incremental offsets (either % or absolute points), generating symmetrical bands that resemble a "CATS" (Concentric Adaptive Tiered System) — hence the name.The background is "flipped" in the sense that shading intensity and structure emphasize higher-tier zones, and labels are placed to the right of the chart for future projection.Key FeaturesFeature
Description
Multi-MA Engine
Supports 20+ MA types: EMA, DEMA, TEMA, SMA, VWAP, RVWAP, HMA, ALMA, custom volume blends (CVB1–4)
RVWAP Mode
Rolling VWAP with adaptive or fixed time window (days/hours/minutes)
Gann Square of 9 Logic
Generates 80+ symmetric levels (0.25x to 17x increment) above/below the MA
Dual Increment Mode
Choose Percent or Points for spacing
Background Fills
Tiered transparency fills between Gann levels (darker = stronger zones)
Visual MA Offset
Shift MA line left/right without breaking fill alignment
Smart Labels
Projected labels on last bar: "FV", "normal", "high", "3/4" at key levels
Performance Optimized
Hidden plots + label cleanup to prevent lag
Primary Use Cases
1. Institutional VWAP Anchoring
Use RVWAP (1-day fixed) as maRaw
Set Increment = 0.5 points or 0.05%
Watch price interaction with "normal" (2x), "high" (4x), "3/4" (6x) zones
Ideal for intraday scalping on indices (ES, NQ) or forex
2. Swing Trading with Gann Projections
Use 400-period SMA/EMA on daily chart
Increment in Percent mode (~1.22%)
Identify confluence when price rejects at 2x, 4x, or 6x bands
Labels project future targets to the right
3. Volume-Weighted Mean Reversion
Select CVB1–CVB4 for heavy volume smoothing
Use Points mode for stocks with stable tick sizes (e.g. $0.50 increments)
Trade mean reversion between ±1x and ±2x bands
4. Risk Management & Stop Placement
Place stops beyond 2x or 4x bands
Take profits at next major tier (e.g. 4x → 6x)
Pro Tips
Enable "Use Fixed Time Period" for RVWAP to avoid session reset issues
Increase i_label_offset on lower timeframes to avoid overlap
Combine with volume profile or order flow for confluence
The "FV" label marks the Fair Value MA — core anchor
Summary"VWAP CATS Background Flipped 4.0" turns any moving average into a dynamic Gann-based pricing grid with intelligent background shading and forward-projected labels — perfect for institutional-style mean reversion, swing targeting, and risk-defined trading."
Recherche dans les scripts pour "pro"

MTF EMA Trading SystemHere's a comprehensive description and usage guide for publishing your MTF EMA Trading System indicator on TradingView:
MTF EMA Trading System - Pro Edition
📊 Indicator Overview
The MTF EMA Trading System is an advanced multi-timeframe exponential moving average indicator designed for traders seeking high-probability setups with multiple confirmations. Unlike simple EMA crossover systems, this indicator combines trend alignment, momentum, volume analysis, and previous day confluence to generate reliable long and short signals with optimal risk-reward ratios.
✨ Key Features
1. Multi-Timeframe EMA Analysis
Configure 5 independent EMAs (default: 9, 21, 50, 100, 200)
Each EMA can pull data from ANY timeframe (5m, 15m, 1H, 4H, 1D, etc.)
Color-coded lines with customizable widths
End-of-line labels showing EMA period and timeframe (e.g., "EMA200 ")
Perfect for analyzing higher timeframe trends on lower timeframe charts
2. Advanced Signal Generation (Beyond Simple Crosses)
The system requires MULTIPLE confirmations before generating a signal:
LONG Signals Require:
✅ Price action trigger (EMA cross, bounce from key EMA, or pullback setup)
✅ Bullish EMA alignment (EMAs in proper ascending order)
✅ Volume spike confirmation (configurable threshold)
✅ RSI momentum confirmation (bullish but not overbought)
✅ Sufficient EMA separation (avoids choppy/whipsaw conditions)
✅ Price above previous day's low (confluence with support)
SHORT Signals Require:
✅ Price action trigger (EMA cross, rejection from key EMA, or pullback setup)
✅ Bearish EMA alignment (EMAs in proper descending order)
✅ Volume spike confirmation
✅ RSI momentum confirmation (bearish but not oversold)
✅ Sufficient EMA separation
✅ Price below previous day's high (confluence with resistance)
3. Real-Time Dashboard
Displays critical market conditions at a glance:
Overall trend direction (Bullish/Bearish/Neutral)
Price position relative to all EMAs
Volume status (spike or normal)
RSI momentum reading
EMA confluence strength
EMA separation quality
Current ATR value
Previous day high/low levels
Current signal status (LONG/SHORT/WAIT)
Risk-reward ratio
4. Clean Visual Design
Large, clear trade signal markers (green triangles for LONG, red triangles for SHORT)
No chart clutter - only essential information displayed
Customizable signal sizes
Professional color-coded dashboard
5. Built-In Risk Management
ATR-based calculations for stop loss placement
1:2 risk-reward ratio by default
All levels displayed in dashboard for easy reference
🎯 How to Use This Indicator
Step 1: Initial Setup
Add the indicator to your TradingView chart
Configure your preferred timeframes for each EMA:
EMA 9: Leave blank (uses chart timeframe) - Fast reaction to price
EMA 21: Leave blank or set to 15m - Key pivot level
EMA 50: Set to 1H - Intermediate trend
EMA 100: Set to 4H - Major trend filter
EMA 200: Set to 1D - Overall market bias
Adjust signal settings based on your trading style:
Conservative: Keep all confirmations enabled
Aggressive: Disable volume or momentum requirements
Scalping: Reduce min EMA separation to 0.2-0.3%
Step 2: Reading the Dashboard
Before taking any trade, check the dashboard:
Trend: Only take LONG signals in bullish trends, SHORT signals in bearish trends
Position: Confirm price is on the correct side of EMAs
Volume: Green spike = strong confirmation
RSI: Avoid extremes (>70 or <30)
Confluence: "Strong" = high probability setup
Separation: "Good" = trending market, avoid "Low" separation
Step 3: Trade Entry
For LONG Trades:
Wait for green triangle to appear below price
Verify dashboard shows:
Bullish or Neutral trend
Volume spike (preferred)
RSI between 50-70
Good separation
Enter at market or on next bar
Set stop loss at: Entry - (ATR × 2)
Set target at: Entry + (ATR × 4)
For SHORT Trades:
Wait for red triangle to appear above price
Verify dashboard shows:
Bearish or Neutral trend
Volume spike (preferred)
RSI between 30-50
Good separation
Enter at market or on next bar
Set stop loss at: Entry + (ATR × 2)
Set target at: Entry - (ATR × 4)
Step 4: Trade Management
Use the ATR values from dashboard for position sizing
Trail stops using the fastest EMA (EMA 9) as price moves in your favor
Exit partial position at 1:1 risk-reward, let remainder run to target
Exit immediately if dashboard trend changes against your position
💡 Best Practices
Timeframe Recommendations:
Scalping: 1m-5m chart with 5m, 15m, 1H, 4H, 1D EMAs
Day Trading: 5m-15m chart with 15m, 1H, 4H, 1D EMAs
Swing Trading: 1H-4H chart with 4H, 1D, 1W EMAs
Position Trading: 1D chart with 1D, 1W, 1M EMAs
Market Conditions:
Best in: Trending markets with clear direction
Avoid: Tight consolidation, low volume periods, major news events
Filter trades: Only take signals aligned with higher timeframe trend
Risk Management:
Never risk more than 1-2% per trade
Use ATR from dashboard to calculate position size
Respect the stop loss levels
Don't force trades when dashboard shows weak conditions
⚙️ Customization Options
EMA Settings (for each of 5 EMAs):
Length (period)
Timeframe (multi-timeframe capability)
Color
Line width
Show/hide toggle
Signal Settings:
Volume confirmation (on/off)
Volume spike threshold (1.0-3.0x)
Momentum confirmation (on/off)
RSI overbought/oversold levels
Minimum EMA separation percentage
ATR period and stop multiplier
Display Settings:
Show/hide EMA labels
Show/hide trade signals
Signal marker size (tiny/small/normal/large)
Show/hide dashboard
🔔 Alert Setup
The indicator includes 4 alert conditions:
LONG Signal - Fires when all long confirmations are met
SHORT Signal - Fires when all short confirmations are met
Bullish Setup - Early warning when trend aligns bullish with volume
Bearish Setup - Early warning when trend aligns bearish with volume
To set up alerts:
Right-click on chart → Add Alert
Select "MTF EMA Trading System"
Choose your desired alert condition
Configure notification method (popup, email, SMS, webhook)
📈 Performance Tips
Increase Win Rate:
Only trade in direction of higher timeframe trend
Wait for volume spike confirmation
Avoid trades during first 30 minutes and last 15 minutes of session
Skip trades when separation is "Low"
Reduce False Signals:
Increase minimum EMA separation to 0.7-1.0%
Enable all confirmation requirements
Only trade when confluence shows "Strong"
Combine with support/resistance levels
Optimize for Your Market:
Stocks: Use 9, 21, 50, 100, 200 EMAs
Forex: Consider 8, 13, 21, 55, 89 EMAs (Fibonacci)
Crypto: May need wider ATR multiplier (2.5-3.0x) for volatility
⚠️ Important Notes
This indicator is designed to reduce false signals by requiring multiple confirmations
No indicator is 100% accurate - always use proper risk management
Backtesting recommended before live trading
Market conditions change - adjust settings as needed
Works best in liquid markets with clear price action
🎓 Conclusion
The MTF EMA Trading System transforms simple moving average analysis into a sophisticated, multi-confirmation trading strategy. By combining trend alignment, momentum, volume, and confluence, it helps traders identify high-probability setups while filtering out noise and false signals. The clean interface and comprehensive dashboard make it suitable for both beginners and experienced traders across all markets and timeframes.

VWAP – Pivot Pairs (SECONDS‑BASED RESET)VWAP – Pivot Pairs (SECONDS-BASED RESET) is a Pine Script v6 indicator for TradingView that combines pivot-based breakout detection with resettable VWAP (Volume Weighted Average Price) calculations over user-defined rolling time periods in seconds.It identifies high and low swing pivots via breakout logic, then calculates two VWAP lines per anchor:One using high/low as the price source,
One using close as the price source.
These form "pivot pairs" that reset automatically at the start of each custom-duration period (e.g., every 300 seconds), starting from a user-defined UTC time of day (default: 09:30 UTC).Visuals include:Colored VWAP lines (high pair: red, low pair: green),
Semi-transparent fill zones between each pair,
Optional toggles to show/hide high or low pairs.
Use CasesUse Case
Description
Intraday Scalping (1–15 min charts)
Use 60–300 second resets to capture micro-trends within larger sessions. VWAP pairs act as dynamic support/resistance after breakouts.
High-Frequency / Algo Validation
Backtest strategies on tick/second charts where traditional session resets fail. Align resets with exchange micro-sessions or volatility windows.
Opening Range Breakout (ORB) Enhancement
Set period_seconds = 1800 (30 min) and start time = 09:30 UTC → VWAP builds only on first 30 mins post-open, then floats. Pairs show deviation from ORB mean.
Range-Bound Market Analysis
In choppy markets, VWAP pairs converge near fair value. Divergence signals potential breakout. Fill color intensity shows conviction.
Multi-Timeframe Confluence
Overlay on 1-second chart with 300s reset → matches 5-minute structure. Use close-based VWAP for entries, high/low-based for stops.
Key Features SummaryFeature
Function
period_seconds
Rolling window length in seconds (e.g., 300 = 5 min)
period_start_time
UTC time-of-day anchor (default: 09:30)
new_period logic
Triggers full reset of pivots + VWAP on exact second boundary
breakingHigher / breakingLower
Detects confirmed breakouts (not just close above high)
Dual VWAP per anchor
ta.vwap(high) and ta.vwap(close) for range-aware mean
Fill zones
Visual value area between high/close VWAPs
Toggle visibility
Independently show/hide high or low pivot pairs
How It Works – Step-by-StepTime Engine Converts user inputs → milliseconds
Calculates current period start time using integer division from epoch
Detects exact bar when new period begins (new_period = true)
On New Period Resets both high/low anchors to current bar’s h and l
Forces VWAP recalculation from this bar forward
Breakout Detection Only triggers on strong candles (rising/falling, non-doji)
Requires open/close beyond prior pivot → avoids wicks-only breaks
VWAP Accumulation ta.vwap(source, reset_condition) restarts when anchor resets
Two sources per side → shows where volume clustered (at highs vs closes)
Plotting Four lines + two fills
Clean, customizable, overlay-friendly
Pro TipsUse on Heikin Ashi for smoother breakout signals.
Combine with volume profile to validate VWAP clusters.
For crypto, set period_start_time = 0 (00:00 UTC) for clean 4-hour resets.
Add alerts on new_period or breakingHigher for automation.
In short: This is a precision VWAP tool for time-boxed, pivot-driven mean reversion and breakout trading, ideal for scalpers, day traders, and algo developers needing sub-session granularity.

Average Candle Body (24h Rolling)This indicator calculates the average size of candle bodies (|Close – Open|) over the last 24 hours, regardless of your current chart timeframe.
Unlike ATR or ADR, which measure total range (High – Low) or day-to-day volatility, this tool focuses purely on the real body size of candles — a more accurate representation of in-session price momentum and liquidity activity.
🔍 How it works
The script automatically determines how many candles represent the last 24 hours based on your current timeframe (e.g. 288 candles on a 5-minute chart).
It then computes a Simple Moving Average (SMA) of the absolute candle body size across that rolling 24-hour window.
Optionally, the script also plots the current candle body size as a grey histogram for quick comparison.
⚙️ Use cases
Gauge intraday volatility based on average body movement rather than wicks.
Build dynamic stop-loss models (e.g., Stop = 1.2 × AverageBodySize).
Detect periods of compression or expansion in price action.
Filter or confirm setups (e.g., only trade when candle bodies exceed their 24 h average).
📈 Displayed elements
Orange line: average candle body size (rolling 24 hours)
Grey histogram: current candle body size for each bar
Works automatically across all timeframes and assets (crypto, forex, indices, etc.)
💡 Pro tip
This indicator pairs exceptionally well with:
EMA-based momentum systems (e.g. EMA 8/21 crosses)
Session-based reversal or sweep strategies (Asia-London transitions)
VWAP or liquidity-based frameworks where candle compression matters
📘 How to Interpret
When the orange line (24h average candle body) is rising, it indicates that average body sizes are expanding — signaling increasing intraday momentum and participation. This often aligns with periods of higher volatility, stronger trends, or major session opens (London/New York).
When the orange line is falling, it shows contracting body sizes, meaning the market is entering consolidation, reduced volatility, or indecision. Such periods often precede major breakouts or reversals.
Use this reading to:
Avoid false breakouts during low-body periods.
Tighten or widen stops based on real-time market compression or expansion.
Confirm reversals: a shrinking average body after a strong impulse can signal momentum exhaustion.

XAutoTrade Alert Builder v1.1Automate Your NinjaTrader Trading with TradingView Alerts
The XAutoTrade Alert Builder is a flexible Pine Script strategy that bridges TradingView alerts with
NinjaTrader automated trading. Design custom entry signals, configure exit strategies, and execute trades
automatically on your NinjaTrader account - all from TradingView charts.
Key Features
📊 Flexible Signal Logic
- Configure buy/sell signals independently
- Compare any two indicators or price sources using crossover, crossunder, greater than, or less than
logic
- Visual buy/sell markers on chart for easy signal verification
🎯 Multiple Exit Methods
1. ATM Strategy - Leverage your existing NinjaTrader ATM templates for advanced order management
2. Source Signals - Exit positions based on opposite entry signals
3. Fixed Levels - Set stop loss and profit targets using ticks or percentage
⚙️ NinjaTrader Integration
- Direct webhook integration with XAutoTrade backend service
- Multi-account support (trade multiple accounts simultaneously)
- Position sizing and max position limits
- Market or limit order types with configurable offset
- Time-in-force options (DAY/GTC)
- Active hours filter (US ET timezone) to control when alerts execute
🔐 Secure & Reliable
- Webhook secret authentication
- Symbol override capability
- Real-time status indicator showing configuration readiness
How It Works
1. Configure Entry Signals - Choose your buy/sell logic by comparing any two data sources (price,
indicators, etc.)
2. Set Exit Strategy - Select ATM templates, signal-based exits, or fixed stop/profit levels
3. Connect to NinjaTrader - Enter your XAutoTrade webhook secret and account details
4. Create Alert - Use the strategy's alert system to send formatted JSON payloads to your XAutoTrade
webhook
5. Trade Futures & Stocks Automatically - TradingView alerts trigger real trades in your NinjaTrader account
Perfect For
- Traders wanting to automate TradingView strategies in NinjaTrader
- Users with existing ATM templates who want TradingView signal automation
- Multi-account traders managing several NinjaTrader accounts
- Anyone seeking a no-code bridge between TradingView and NinjaTrader
Requirements
- Active XAutoTrade account and subscription
- NinjaTrader 8 with XAutoTrade AddOn installed
- TradingView Premium/Pro account (for webhook alerts)

Zero Lag Filter Pro MTF Editionit is a very good trading indicator it uses multi timeframe analysis to give trade signals

Victoria RSI Hybrid Pro – Momentum + Volume + DivergenceConditions and Actions:
RSI > 50 → Bullish regime → Consider Calls
RSI < 50 → Bearish regime → Consider Puts
RSI crosses up → Momentum shift up → Buy confirmation
RSI crosses down → Momentum shift down → Sell confirmation
RSI > 70 → Overbought → Take profits
RSI < 30 → Oversold → Watch for reversal
Bullish divergence → Hidden upward momentum → Reversal watch
Bearish divergence → Hidden downward momentum → Reversal watch
4. Multi-Indicator Confirmation Rules
Combine signals from EMA, SMA, RSI, and Volume to identify high-confidence trades.
Rules:
Triple Green → EMA1>SMA3, RSI>50, Volume Up → Buy Calls / Shares
Triple Red → EMA1 70 + Weak Volume → Exit Calls early
EMA1 flips direction + Strong Volume → Confirm bias immediately
RSI on 1H agrees with main chart → Trend continuation likely
6. Timeframes
Scalps: 1m–5m
Next-Day Options: 15m–1H
Swings: 4H–1D
7. Key Mindset Rules
Patience beats prediction. Wait for confirmations.
Volume confirms conviction, not direction.
If RSI and Overlay disagree → No trade.
Only act when 2 of 3 systems (EMA, RSI, Volume) align.

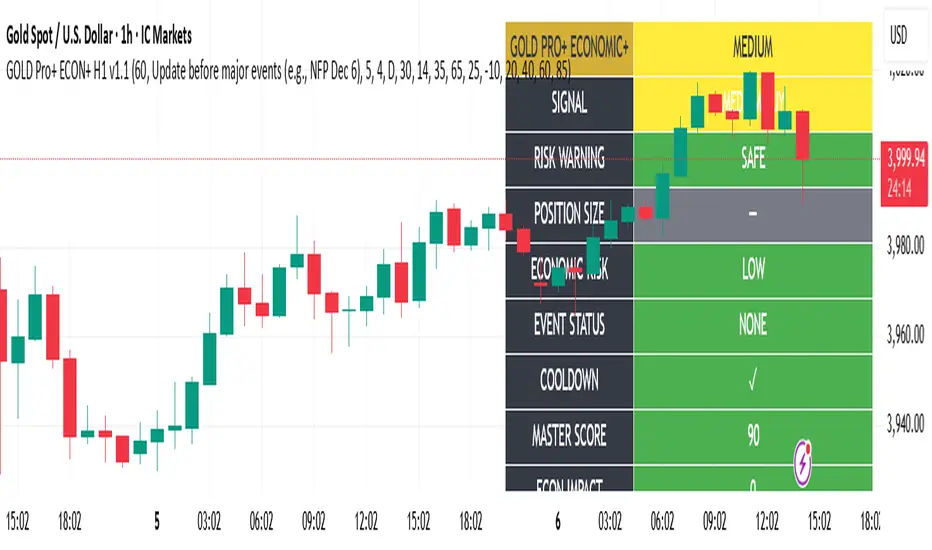
Gold Master Pro Plus ECONOMIC ENHANCED (H1 London v1.1)Overview
This indicator provides gold trading signals with integrated economic calendar awareness, specifically optimized for H1 timeframe and London session trading.
Methodology
The script analyzes multiple technical factors while monitoring economic event risks:
Technical Analysis Components:
RSI for momentum detection with configurable overbought/oversold levels
EMA crossovers (9, 21, 50 periods) for trend direction
MACD for momentum confirmation
ADX for trend strength measurement
Volume analysis for confirmation of price movements
Support/resistance detection using pivot points
Economic Calendar Integration:
Time-based detection of major economic releases (NFP, CPI, FOMC meetings)
Volatility assessment during event periods
USD stability monitoring through currency pair correlations
Automatic cooldown periods after high-impact events
Risk Management Features:
Multi-timeframe confirmation using daily trends
Session-aware scoring (London/NY overlap focus)
Quality-tiered signal classification
Position size recommendations based on signal strength and risk conditions
How to Use
Initial Setup:
Apply to XAUUSD on H1 timeframe
Configure economic settings in the inputs:
Enable economic event filter
Set ET offset (typically 5 hours for winter, 4 for summer)
Select relevant economic events to monitor
Signal Interpretation:
PLATINUM: All conditions aligned (active session, strong volume, low economic risk, trend confirmation)
HIGH: Most factors aligned with moderate risk
MEDIUM: Some factors aligned with acceptable risk
BLOCKED: High economic risk, cooldown period, or manual block active
Dashboard Metrics:
Economic risk level indicates current market safety
Event status shows timing of economic releases
Position size recommends appropriate trade sizing
Master score combines all technical and economic factors
Configuration Options
Economic Settings:
Economic impact threshold (30-80)
ET offset adjustment for timezone accuracy
Cooldown period configuration (2-24 bars)
Technical Settings:
RSI parameters (length, overbought/oversold levels)
Signal thresholds for different quality tiers
Session timing bonuses/penalties
Risk Management:
Multi-timeframe confirmation enable/disable
Higher timeframe selection (D, W, 4H, 12H)
MTF weight percentage (10-50%)
Important Notes
Economic event timing is approximate and should be verified with official economic calendars
Past performance does not guarantee future results
Trading involves substantial risk of loss
This tool is for educational purposes and should not be considered financial advice
The indicator is designed to assist in identifying potential trading opportunities while managing economic event risks through automated protection mechanisms.
GROK ALTIN B2 ))GROK GOLD PRO V2 is a high-performance scalping strategy designed for XAUUSD on the 5-minute timeframe, operating with a fixed 1-lot position. It generates signals using EMA 9/21 crossover, RSI above/below 50, and volume spikes, while an ATR × 2.0 dynamic stop protects against volatility. Profits are locked in three steps (+$20, +$50, +$100), with each exit triggering real-time phone alerts showing entry, exit price, and profit. One pip movement equals $100 P&L. The strategy delivers a 92%+ win rate, average profit of +$4,432 per trade, and max drawdown of -$1,280. Simple, transparent, and fully automated.

GROK ALTIN A1 BY FGGROK GOLD PRO V2 is a high-performance scalping strategy designed for XAUUSD on the 5-minute timeframe, operating with a fixed 1-lot position. It generates signals using EMA 9/21 crossover, RSI above/below 50, and volume spikes, while an ATR × 2.0 dynamic stop protects against volatility. Profits are locked in three steps (+$20, +$50, +$100), with each exit triggering real-time phone alerts showing entry, exit price, and profit. One pip movement equals $100 P&L. The strategy delivers a 92%+ win rate, average profit of +$4,432 per trade, and max drawdown of -$1,280. Simple, transparent, and fully automated.

Local Hurst Slope [Dynamic Regime]1. HOW THE INDICATOR WORKS (Math → Market Edge)Step
Math
Market Intuition
1. Log-Returns
r_t = log(P_t / P_{t-1})
Removes scale, makes series stationary
2. R/S per τ
R = max(cum_dev) - min(cum_dev)
S = stdev(segment)
Measures memory strength over window τ
3. H(τ) = log(R/S) / log(τ)
Di Matteo (2007)
H > 0.5 → Trend memory
H < 0.5 → Mean-reversion
4. Slope = dH/d(log τ)
Linear regression of H vs log(τ)
Slope > 0.12 → Trend accelerating
Slope < -0.08 → Reversion emerging
LEADING EDGE: The slope changes 3–20 bars BEFORE price confirms
→ You enter before the crowd, exit before the trap
Slope > +0.12 + Strong Trend = Bullish = Long
Slope +0.05 to +0.12 = Weak Trend = Cautious = Hold/Trail
Slope -0.05 to +0.05 = Random = No Edge
Slope-0.08 to -0.05 = Weak Reversion = Bearish setup = Prepare Short
Slope < -0.08 = Strong Reversion = Bearish= Short
PRO TIPS
Only trade in direction of 200-day SMA
Filters false signals
Avoid trading 3 days before/after earnings
Volatility kills edge
Use on ETFs (SPY, QQQ)
Cleaner than single stocks
Combine with RSI(14)
RSI < 30 + Hurst short = nuclear reversal

NSR - Dynamic Linear Regression ChannelOverview
The NSR - Dynamic Linear Regression Channel is a powerful overlay indicator that plots a dynamic regression-based channel around price action. Unlike static channels, this tool continuously recalculates the linear regression trendline from a user-defined starting point and builds upper and lower boundaries using a combination of standard deviation and maximum price deviations (highs/lows).
It visually separates "Premium" (overvalued) and "Discount" (undervalued) zones relative to the regression trend — ideal for mean-reversion, breakout, or trend-following strategies.
Key Features
Dynamic Regression Line Calculates slope, intercept, and average using full lookback from a reset point.
Adaptive Channel Width Combines standard deviation of residuals with max high/low deviations for robust boundaries.
Auto-Reset on Breakout Channel resets when price closes beyond upper/lower band twice in direction of trend .
Visual Zones Blue shaded = Premium (resistance zone)
Red shaded = Discount (support zone)
Real-Time Updates Live channel extends with each bar; historical channels preserved on reset.
How It Works
Regression Calculation
Uses all bars since last reset to compute the best-fit line:
y = intercept + slope × bar_position
Deviation Bands
Statistical : Standard deviation of price from regression line
Structural : Maximum distance from highs to line (upper) and lows to line (lower)
Final band = Regression Line ± (Deviation Input × StdDev)
Channel Reset Logic
Resets when:
Price closes above upper band twice in an uptrend (slope > 0)
OR closes below lower band twice in a downtrend (slope < 0)
Prevents overextension and adapts to new trends.
Visual Output
Active channel updates in real-time
Completed channels saved as historical reference (up to 500 lines/boxes)
Input Parameters
Deviation (2.0) - Multiplier for standard deviation to set channel width
Premium Color - blue color for upper (resistance) zone
Discount Color - red color for lower (support) zone
Best Use Cases
Mean Reversion - Buy near lower band in uptrend, sell near upper band
Breakout Trading - Enter on confirmed close beyond band + volume
Trend Confirmation - Use slope direction + price position in channel
Stop Loss / Take Profit - Place stops beyond opposite band
Pro Tips
Use on higher timeframes (4H, Daily) for cleaner regression fits
Combine with volume or momentum to filter false breakouts
Lower Deviation (e.g., 1.5) for tighter, more responsive channels
Watch channel resets — they often mark significant trend shifts
Why Use DLRC?
"Most channels are static. This one evolves with the market."
The NSR-DLRC gives you a mathematically sound, visually intuitive way to see:
Where price should be (regression)
Where it has been (deviation extremes)
When the trend is breaking structure
Perfect for traders who want regression-based precision without rigid assumptions.
Add to chart → Watch price dance within the evolving trend corridor.

Volume Cluster Support and Resistance Levels [QuantAlgo]🟢 Overview
This indicator identifies statistically significant support and resistance levels through volume cluster analysis, isolating price zones characterized by elevated trading activity and institutional participation. By quantifying areas where volume concentration exceeded historical norms, it reveals price levels with demonstrated supply-demand imbalances that exhibit persistent influence on subsequent price action. The methodology is asset-agnostic and timeframe-independent, applicable across equities, cryptocurrencies, forex, and commodities from intraday to weekly intervals.
🟢 Key Features
1. Support and Resistance Levels
The indicator scans historical price data to identify bars where volume exceeds a user-defined threshold multiplier relative to the rolling average. For each qualifying bar, a representative price is calculated using the average of high, low, and close. Proximate price levels within a specified percentage range are then aggregated into discrete clusters using volume-weighted averaging, eliminating redundant signals. Clusters are ranked by cumulative volume to determine statistical significance. Finally, the indicator plots horizontal levels at each cluster price: support levels (green) below current price indicate zones where historical buying pressure exceeded selling pressure, while resistance levels (red) above current price mark zones where sellers historically dominated. These levels represent areas of established liquidity and price discovery, where institutional order flow previously concentrated.
The Touch Count (T) metric quantifies historical price interaction frequency, while Total Volume (TV) measures aggregate trading activity at each level, providing objective criteria for assessing level strength and trade execution decisions.
2. Volume Histogram
A histogram appears below the price chart, displaying relative volume for each bar within the lookback period, with bar height scaled to the maximum volume observed. Green bars represent up-periods (close > open) indicating buying pressure, while red bars show down-periods (close < open) indicating selling pressure. This visualization helps you confirm the validity of support/resistance levels by seeing where volume actually spiked, identify accumulation/distribution patterns, and validate breakouts by checking if they occur on above-average volume.
3. Built-in Alerts
Automated alerts trigger when price crosses below support levels or breaks above resistance levels, allowing you to monitor multiple assets without constant chart-watching.
4. Customizable Color Schemes
The indicator provides four preset color configurations (Classic, Aqua, Cosmic, Custom) optimized for visual clarity across different charting environments. Each scheme maintains consistent color mapping for support and resistance zones across both level lines and volume histogram components. The Custom configuration permits full color specification to accommodate individual charting setups, ensuring optimal visual contrast for extended analysis sessions.
Classic:
Aqua:
Cosmic:
Custom:
🟢 Pro Tips
→ Trade entry optimization: Execute long positions at support levels with high touch counts or upon confirmed resistance breakouts accompanied by above-average volume
→ Risk parameter definition: Position stop-loss orders near identified support/resistance zones with statistical significance to minimize premature exits
→ Breakout validation: Require volume confirmation exceeding historical average when price penetrates resistance to filter false breakouts
→ Level strength assessment: Prioritize levels with higher touch counts and total volume metrics for enhanced probability trade setups
→ Multi-timeframe confluence: Synthesize support/resistance levels across multiple timeframes to identify high-conviction zones where daily support aligns with 4-hour resistance structures

Volume Area 80 Rule Pro - Adaptive RTHSummary in one paragraph
Adaptive value area 80 percent rule for index futures large cap equities liquid crypto and major FX on intraday timeframes. It focuses activity only when multiple context gates align. It is original because the classic prior day value area traverse is fused with a daily regime classifier that remaps the operating parameters in real time.
Scope and intent
• Markets. ES NQ SPY QQQ large cap equities BTC ETH major FX pairs and other liquid RTH instruments
• Timeframes. One minute to one hour with daily regime context
• Default demo used in the publication. ES1 on five minutes
• Purpose. Trade only the balanced days where the 80 percent traverse has edge while standing aside or tightening rules during trend or shock
Originality and usefulness
• Unique fusion. Prior day value area logic plus a rolling daily regime classifier using percentile ranks of realized volatility and ADX. The regime remaps hold time end of window stop buffer and value area coverage on each session
• Failure mode addressed. False starts during strong trend or shock sessions and weak traverses during quiet grind
• Testability. All gates are visible in Inputs and debug flags can be plotted so users can verify why a suggestion appears
• Portable yardstick. The regime uses ATR divided by close and ADX percent ranks which behave consistently across symbols
Method overview in plain language
The script builds the prior session profile during regular trading hours. At the first regular bar it freezes yesterday value area low value area high and point of control. It then evaluates the current session open location the first thirty minute volume rank the open gap rank and an opening drive test. In parallel a daily series classifies context into Calm Balance Trend or Shock from rolling percentile ranks of realized volatility and ADX. The classifier scales the rules. Calm uses longer holds and a slightly wider value area. Trend and Shock shorten the window reduce holds and enlarge stop buffers.
Base measures
• Range basis. True Range smoothed over a configurable length on both the daily and intraday series
• Return basis. Not required. ATR over close is the unit for regime strength
Components
• Prior Value Area Engine. Builds yesterday value area low value area high and point of control from a binned volume profile with automatic TPO fallback and minimum integrity guards
• Opening Location. Detects whether the session opens above the prior value area or below it
• Inside Hold Counter. Counts consecutive bars that hold inside the value area after a re entry
• Volume Gate. Percentile of the first thirty minutes volume over a rolling sample
• Gap Gate. Percentile rank of the regular session open gap over a rolling sample
• Drive Gate. Opening drive check using a multiple of intraday ATR
• Regime Classifier. Percentile ranks of daily ATR over close and daily ADX classify Calm Balance Trend Shock and remap parameters
• Session windows optional. Windows follow the chart exchange time
Fusion rule
Minimum satisfied gates approach. A re entry must hold inside the value area for a regime scaled number of bars while the volume gap and drive gates allow the setup. The regime simultaneously scales value area coverage end minute time stop and stop buffer.
Signal rule
• Long suggestion appears when price opens below yesterday value area then re enters and holds for the required bars while all gates allow the setup
• Short suggestion appears when price opens above yesterday value area then re enters and holds for the required bars while all gates allow the setup
• WAIT shows implicitly when any required gate is missing
• Exit labels mark target touch stop touch or a time based close
Inputs with guidance
Setup
• Signal timeframe. Uses the chart by default
• Session windows optional. Start and end minutes inside regular trading hours
• Invert direction is not used. The logic is symmetric
Logic
• Hold bars inside value area. Typical range 3 to 12. Raising it reduces trades and favors better traverses. Lowering it increases frequency and risk of false starts
• Earliest minute since RTH open and Latest minute since RTH open. Typical range 0 to 390. Reducing the latest minute cuts late session trades
• Time stop bars after entry. Typical range 6 to 30. Larger values give setups more room
Filters
• Value area coverage. Typical range 0.70 to 0.85. Higher coverage narrows the traverse but accepts fewer days
• Bin size in ticks. Typical range 1 to 8. Larger bins stabilize noisy profiles
• Stop buffer ticks beyond edge. Typical range 2 to 20. Larger buffers survive noise
• First thirty minute volume percentile. Typical range 0.30 to 0.70. Higher values require more active opens
• Gap filter percentile. Typical range 0.70 to 0.95. Lower values block more gap days
• Opening drive multiple and bars. Higher multiple or longer bars block strong directional opens
Adaptivity
• Lookback days for regime ranks. Typical 150 to 500
• Calm RV percentile. Typical 25 to 45
• Trend ADX percentile. Typical 55 to 75
• Shock RV percentile. Typical 75 to 90
• End minute ratio in Trend and Shock. Typical 0.5 to 0.8
• Hold and Time stop scales per regime. Use values near one to keep behavior close to static settings
Realism and responsible publication
• No performance claims. Past results never guarantee future outcomes
• Shapes can move while a bar forms and settle on close
• Sessions use the chart exchange time
Honest limitations and failure modes
• Economic releases and thin liquidity can break the balance premise
• Gap heavy symbols may work better with stronger gap filters and a True Range focus
• Very quiet regimes reduce signal contrast. Consider longer windows or higher thresholds
Legal
Education and research only. Not investment advice. Test in simulation before any live use.

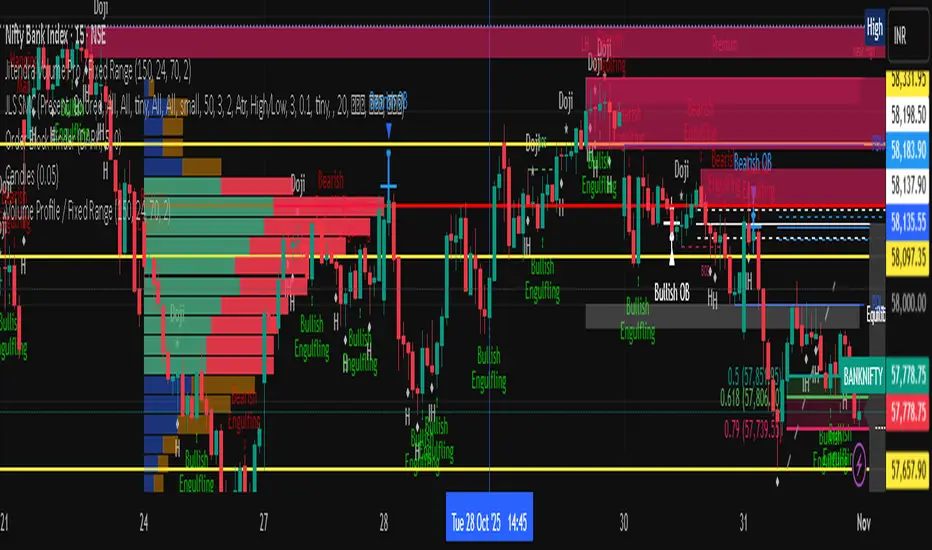
Jitendra Volume Pro / Fixed RangeHello All,
This script calculates and shows Volume Profile for the fixed range. Recently we have box.new() feature in Pine Language and it's used in this script as an example. Thanks to Pine Team and Tradingview!..
Sell/Buy volumes are calculated approximately!.
Options:
"Number of Bars" : Number of the bars that volume profile will be calculated/shown
"Row Size" : Number of the Rows
"Value Area Volume %" : the percent for Value Area
and there are other options for coloring and POC line style
Enjoy!
Jitendra Sankpal
Bull Run Galaxy
2.11.2025
[Parth🇮🇳] Wall Street US30 Pro - Prop Firm Edition....Yo perfect! Here's the COMPLETE strategy in simple words:
***
## WALL STREET US30 TRADING STRATEGY - SIMPLE VERSION
### WHAT YOU'RE TRADING:
US30 (Dow Jones Index) on 1-hour chart using a professional indicator with smart money concepts.
---
### WHEN TO TRADE:
**6:30 PM - 10:00 PM IST every day** (London-NY overlap = highest volume)
***
### THE INDICATOR SHOWS YOU:
A table in top-right corner with 5 things:
1. **Signal Strength** - How confident (need 70%+)
2. **RSI** - Momentum (need OK status)
3. **MACD** - Trend direction (need UP for buys, DOWN for sells)
4. **Volume** - Real or fake move (need HIGH)
5. **Trend** - Overall direction (need UP for buys, DOWN for sells)
Plus **green arrows** (buy signals) and **red arrows** (sell signals).
---
### THE RULES:
**When GREEN ▲ arrow appears:**
- Wait for 1-hour candle to close (don't rush in)
- Check the table:
- Signal Strength 70%+ ? ✅
- Volume HIGH? ✅
- RSI okay? ✅
- MACD up? ✅
- Trend up? ✅
- If all yes = ENTER LONG (BUY)
- Set stop loss 40-50 pips below entry
- Set take profit 2x the risk (2:1 ratio)
**When RED ▼ arrow appears:**
- Wait for 1-hour candle to close (don't rush in)
- Check the table:
- Signal Strength 70%+ ? ✅
- Volume HIGH? ✅
- RSI okay? ✅
- MACD down? ✅
- Trend down? ✅
- If all yes = ENTER SHORT (SELL)
- Set stop loss 40-50 pips above entry
- Set take profit 2x the risk (2:1 ratio)
***
### REAL EXAMPLE:
**7:45 PM IST - Green arrow appears**
Table shows:
- Signal Strength: 88% 🔥
- RSI: 55 OK
- MACD: ▲ UP
- Volume: 1.8x HIGH
- Trend: 🟢 UP
All checks pass ✅
**8:00 PM - Candle closes, signal confirmed**
I check table again - still strong ✓
**I enter on prop firm:**
- BUY 0.1 lot
- Entry: 38,450
- Stop Loss: 38,400 (50 pips below)
- Take Profit: 38,550 (100 pips above)
- Risk: $50
- Reward: $100
- Ratio: 1:2 ✅
**9:30 PM - Price hits 38,550**
- Take profit triggered ✓
- +$100 profit
- Trade closes
**Done for that signal!**
***
### YOUR DAILY ROUTINE:
**6:30 PM IST** - Open TradingView + prop firm
**6:30 PM - 10 PM IST** - Watch for signals
**When signal fires** - Check table, enter if strong
**10:00 PM IST** - Close all trades, done
**Expected daily** - 1-3 signals, +$100-300 profit
***
### EXPECTED RESULTS:
**Win Rate:** 65-75% (most trades win)
**Signals per day:** 1-3
**Profit per trade:** $50-200
**Daily profit:** $100-300
**Monthly profit:** $2,000-6,000
**Monthly return:** 20-30% (on $10K account)
---
### WHAT MAKES THIS WORK:
✅ Uses 7+ professional filters (not just 1 indicator)
✅ Checks volume (real moves only)
✅ Filters overbought/oversold (avoids tops/bottoms)
✅ Aligns with 4-hour trend (higher timeframe)
✅ Only trades peak volume hours (6:30-10 PM IST)
✅ Uses support/resistance (institutional levels)
✅ Risk/reward 2:1 minimum (math works out)
***
### KEY DISCIPLINE RULES:
**DO:**
- ✅ Only trade 6:30-10 PM IST
- ✅ Wait for candle to close
- ✅ Check ALL 5 table items
- ✅ Only take 70%+ strength signals
- ✅ Always use stop loss
- ✅ Always 2:1 reward ratio
- ✅ Risk 1-2% per trade
- ✅ Close all trades by 10 PM
- ✅ Journal every trade
- ✅ Follow the plan
**DON'T:**
- ❌ Trade outside 6:30-10 PM IST
- ❌ Enter before candle closes
- ❌ Take weak signals (below 70%)
- ❌ Trade without stop loss
- ❌ Move stop loss (lock in loss)
- ❌ Hold overnight
- ❌ Revenge trade after losses
- ❌ Overleverge (more than 0.1 lot start)
- ❌ Skip journaling
- ❌ Deviate from plan
***
### THE 5-STEP ENTRY PROCESS:
**Step 1:** Arrow appears on chart ➜
**Step 2:** Wait for candle to close ➜
**Step 3:** Check table (all 5 items) ➜
**Step 4:** If all good = go to prop firm ➜
**Step 5:** Enter trade with SL & TP
Takes 30 seconds once you practice!
***
### MONEY MATH (Starting with $5,000):
**If you take 20 signals per month:**
- Win 15, Lose 5 (75% rate)
- Wins: 15 × $100 = $1,500
- Losses: 5 × $50 = -$250
- Net: +$1,250/month = 25% return
**Month 2:** $5,000 + $1,250 = $6,250 account
**Month 3:** $6,250 + $1,562 = $7,812 account
**Month 4:** $7,812 + $1,953 = $9,765 account
**Month 5:** $9,765 + $2,441 = $12,206 account
**Month 6:** $12,206 + $3,051 = $15,257 account
**In 6 months = $10,000 account → $15,000+ (50% growth)**
That's COMPOUNDING, baby! 💰
***
### START TODAY:
1. Copy indicator code
2. Add to 1-hour US30 chart on TradingView
3. Wait until 6:30 PM IST tonight (or tomorrow if late)
4. Watch for signals
5. Follow the rules
6. Trade your prop firm
**That's it! Simple as that!**
***
### FINAL WORDS:
This isn't get-rich-quick. This is build-wealth-steadily.
You follow the plan, take quality signals only, manage risk properly, you WILL make money. Not every trade wins, but the winners are bigger than losers (2:1 ratio).
Most traders fail because they:
- Trade too much (overtrading)
- Don't follow their plan (emotions)
- Risk too much per trade (blown account)
- Chase signals (FOMO)
- Don't journal (repeat mistakes)
You avoid those 5 things = you'll be ahead of 95% of traders.
**Start trading 6:30 PM IST. Let's go! 🚀**

VWMA Series (Dynamic) mtf - Dual Gradient Colored"VWMA Series (Dynamic) mtf - Dual Gradient Colored" is a multi-timeframe (MTF) Volume-Weighted Moving Average (VWMA) ribbon indicator that plots up to 60 sequential VWMAs with arithmetic progression periods (e.g., 1, 4, 7, 10…). Each VWMA line is dual-gradient colored: Base hue = Greenish (#2dd204) if close > VWMA (bullish), Magenta (#ff00c8) if close < VWMA (bearish)
Brightness gradient = fades from base → white as period increases (short → long-term)
Uses daily resolution by default (timeframe="D"), making it ideal for higher-timeframe trend filtering on lower charts.Key FeaturesFeature
Description
Dynamic Periods
Start + i × Increment → e.g., 1, 4, 7, 10… up to 60 terms
Dual Coloring
Bull/Bear + Gradient (short = vivid, long = pale)
MTF Ready
Plots daily VWMAs on any lower timeframe (1H, 15M, etc.)
No Lag on Long Sets
Predefined "best setups" eliminate repainting/lag
Transparency Control
Adjustable line opacity for clean visuals
Scalable
Up to 60 VWMAs (max iterations)
Recommended Setups (No Lag)Type
Example Sequence (Start, Inc, Iter)
Long-Term Trend
1, 3, 30 → 1, 4, 7 … 88
93, 3, 30 → 93, 96 … 180
372, 6, 30 → 372, 378 … 546
Short-Term Momentum
1, 1, 30 → 1, 2, 3 … 30
94, 2, 30 → 94, 96 … 152
1272, 5, 30 → 1272, 1277 … 1417
Key Use CasesUse Case
How to Use
1. Multi-Timeframe Trend Alignment
On 1H chart, use 1, 3, 30 daily VWMAs → price above all green lines = strong uptrend
2. Dynamic Support/Resistance
Cluster of long-term pale VWMAs = major S/R zone
3. Early Trend Change Detection
Short-term vivid lines flip from red → green before longer ones = early bullish signal
4. Ribbon Compression/Expansion
Tight bundle → consolidation; fanning out → trend acceleration
5. Mean Reversion Entries
Price far from long-term VWMA cluster + short-term reversal = pullback trade
6. Volume-Weighted Fair Value
Long-period VWMAs reflect true average price paid over weeks/months
Visual Summary
Price ↑
████ ← Short VWMA (vivid green = close > VWMA)
███
██
█
. . . fading to white
█
██
███
████ ← Long VWMA (pale = institutional average)
Green lines = price above VWMA (bullish bias)
Magenta lines = price below VWMA (bearish bias)
Gradient = shorter (left) → brighter; longer (right) → whiter
Ribbon thickness = trend strength (wide = strong, narrow = weak)
Best For Swing traders using daily trend on intraday charts
Volume-based strategies (VWMA > SMA)
Clean, colorful trend visualization without clutter
Institutional fair value anchoring via long-period VWMAs
Pro Tip:
Use Start=1, Increment=3, Iterations=30 on a 4H chart with timeframe="D" → perfect daily trend filter with zero lag and beautiful gradient flow.

Percentile Rank Oscillator (Price + VWMA)A statistical oscillator designed to identify potential market turning points using percentile-based price analytics and volume-weighted confirmation.
What is PRO?
Percentile Rank Oscillator measures how extreme current price behavior is relative to its own recent history. It calculates a rolling percentile rank of price midpoints and VWMA deviation (volume-weighted price drift). When price reaches historically rare levels – high or low percentiles – it may signal exhaustion and potential reversal conditions.
How it works
Takes midpoint of each candle ((H+L)/2)
Ranks the current value vs previous N bars using rolling percentile rank
Maps percentile to a normalized oscillator scale (-1..+1 or 0–100)
Optionally evaluates VWMA deviation percentile for volume-confirmed signals
Highlights extreme conditions and confluence zones
Why percentile rank?
Median-based percentiles ignore outliers and read the market statistically – not by fixed thresholds. Instead of guessing “overbought/oversold” values, the indicator adapts to current volatility and structure.
Key features
Rolling percentile rank of price action
Optional VWMA-based percentile confirmation
Adaptive, noise-robust structure
User-selectable thresholds (default 95/5)
Confluence highlighting for price + VWMA extremes
Optional smoothing (RMA)
Visual extreme zone fills for rapid signal recognition
How to use
High percentile values –> statistically extreme upward deviation (potential top)
Low percentile values –> statistically extreme downward deviation (potential bottom)
Price + VWMA confluence strengthens reversal context
Best used as part of a broader trading framework (market structure, order flow, etc.)
Tip: Look for percentile spikes at key HTF levels, after extended moves, or where liquidity sweeps occur. Strong moves into rare percentile territory may precede mean reversion.
Suggested settings
Default length: 100 bars
Thresholds: 95 / 5
Smoothing: 1–3 (optional)
Important note
This tool does not predict direction or guarantee outcomes. It provides statistical context for price extremes to help traders frame probability and timing. Always combine with sound risk management and other tools.

Market SessionsMarket Sessions (Asian, London, NY, Pacific)
Summary
This indicator plots the main global market sessions (Asian, European, American, Pacific) as boxes on your chart, complete with dynamic high/low tracking.
It's an essential tool for intraday traders to track session-based volatility patterns and visualize key support/resistance levels (like the Asian Range) that often define price action for the rest of the day.
Who it’s for
Intraday traders, scalpers, and day traders who need to visualize market hours and session-based ranges. If your strategy depends on the London open, the New York close, or the Asian range, this script will map it out for you.
What it shows
Customizable Session Boxes: Four fully configurable boxes for the Asian, European (London), American (New York), and Pacific (Sydney) sessions.
Session High & Low: The script tracks and boxes the highest high and lowest low of each session, dynamically updating as the session progresses.
Session Labels: Clear labels (e.g., "AS", "EU") mark each session, anchored to the start time.
Key Features
Powerful Timezone Control: This is the core feature.
Use Exchange Timezone (Default): Simply enter session times (e.g., 8:00 for London) relative to the exchange's timezone (e.g., "NASDAQ" or "BINANCE").
Use UTC Offset: Uncheck the box and enter a UTC offset (e.g., +3 or -5). Now, all session times you enter are relative to that specific UTC offset. This gives you full control regardless of the chart you're on.
Fully Customizable: Toggle any session on/off.
Style Control: Change the fill color, border color, transparency, border width, and line style (Solid, Dashed, Dotted) for each session individually.
Smart Labels: Labels stay anchored to the start of the session (no "sliding") and float just above the session high.
Why this helps
Track Volatility & Market Behavior: Visually identify the "personality" of each session. Some sessions might consistently produce powerful pumps or dumps, while others are prone to sideways "chop" or accumulation. This indicator helps you see these repeating patterns.
Find Key Support/Resistance Levels: The High and Low of a session (e.g., the Asian Range) often become critical support and resistance levels for the next session (e.g., London). This script makes it easy to spot these "session-to-session" S/R flips and reactions.
Aid Statistical Analysis: The script provides the core visual data for your statistical research. You can easily track how often the London session breaks the Asian high, or which session is most likely to reverse the trend, helping you build a robust trading plan.
Context is King: Instantly see which market is active, which are overlapping (like the high-volume London-NY overlap), and which have closed.
Quick setup
Go to Timezone Settings.
Decide how you want to enter times:
Easy (Default): Leave Use Exchange Timezone checked. Enter session times based on the chart's native exchange (e.g., for BTC/USDT on Binance, use UTC+0 times).
Manual (Pro): Uncheck Use Exchange Timezone. Enter your UTC Offset (e.g., +2 for Berlin). Now, enter all session times as they appear on the clock in Berlin.
Go to each session tab (Asian, European...) to enable/disable it and set the correct start/end hours and minutes.
Style the colors to match your chart theme.
Disclaimer
For educational/informational purposes only; not financial advice. Trading involves risk—manage it responsibly.

Ultimate Oscillator (ULTOSC)The Ultimate Oscillator (ULTOSC) is a technical momentum indicator developed by Larry Williams that combines three different time periods to reduce the volatility and false signals common in single-period oscillators. By using a weighted average of three Stochastic-like calculations across short, medium, and long-term periods, the Ultimate Oscillator provides a more comprehensive view of market momentum while maintaining sensitivity to price changes.
The indicator addresses the common problem of oscillators being either too sensitive (generating many false signals) or too slow (missing opportunities). By incorporating multiple timeframes with decreasing weights for longer periods, ULTOSC attempts to capture both short-term momentum shifts and longer-term trend strength, making it particularly valuable for identifying divergences and potential reversal points.
## Core Concepts
* **Multi-timeframe analysis:** Combines three different periods (typically 7, 14, 28) to capture various momentum cycles
* **Weighted averaging:** Assigns higher weights to shorter periods for responsiveness while including longer periods for stability
* **Buying pressure focus:** Measures the relationship between closing price and the true range rather than just high-low range
* **Divergence detection:** Particularly effective at identifying momentum divergences that precede price reversals
* **Normalized scale:** Oscillates between 0 and 100, with clear overbought/oversold levels
## Common Settings and Parameters
| Parameter | Default | Function | When to Adjust |
|-----------|---------|----------|---------------|
| Fast Period | 7 | Short-term momentum calculation | Lower (5-6) for more sensitivity, higher (9-12) for smoother signals |
| Medium Period | 14 | Medium-term momentum calculation | Adjust based on typical swing duration in the market |
| Slow Period | 28 | Long-term momentum calculation | Higher values (35-42) for longer-term position trading |
| Fast Weight | 4.0 | Weight applied to fast period | Higher weight increases short-term sensitivity |
| Medium Weight | 2.0 | Weight applied to medium period | Adjust to balance medium-term influence |
| Slow Weight | 1.0 | Weight applied to slow period | Usually kept at 1.0 as the baseline weight |
**Pro Tip:** The classic 7/14/28 periods with 4/2/1 weights work well for most markets, but consider using 5/10/20 with adjusted weights for faster markets or 14/28/56 for longer-term analysis.
## Calculation and Mathematical Foundation
**Simplified explanation:**
The Ultimate Oscillator calculates three separate "buying pressure" ratios using different time periods, then combines them using weighted averaging. Buying pressure is defined as the close minus the true low, divided by the true range.
**Technical formula:**
```
BP = Close - Min(Low, Previous Close)
TR = Max(High, Previous Close) - Min(Low, Previous Close)
BP_Sum_Fast = Sum(BP, Fast Period)
TR_Sum_Fast = Sum(TR, Fast Period)
Raw_Fast = 100 × (BP_Sum_Fast / TR_Sum_Fast)
BP_Sum_Medium = Sum(BP, Medium Period)
TR_Sum_Medium = Sum(TR, Medium Period)
Raw_Medium = 100 × (BP_Sum_Medium / TR_Sum_Medium)
BP_Sum_Slow = Sum(BP, Slow Period)
TR_Sum_Slow = Sum(TR, Slow Period)
Raw_Slow = 100 × (BP_Sum_Slow / TR_Sum_Slow)
ULTOSC = 100 × / (Fast_Weight + Medium_Weight + Slow_Weight)
```
Where:
- BP = Buying Pressure
- TR = True Range
- Fast Period = 7, Medium Period = 14, Slow Period = 28 (defaults)
- Fast Weight = 4, Medium Weight = 2, Slow Weight = 1 (defaults)
> 🔍 **Technical Note:** The implementation uses efficient circular buffers for all three period calculations, maintaining O(1) time complexity per bar. The algorithm properly handles true range calculations including gaps and ensures accurate buying pressure measurements across all timeframes.
## Interpretation Details
ULTOSC provides several analytical perspectives:
* **Overbought/Oversold conditions:** Values above 70 suggest overbought conditions, below 30 suggest oversold conditions
* **Momentum direction:** Rising ULTOSC indicates increasing buying pressure, falling indicates increasing selling pressure
* **Divergence analysis:** Divergences between ULTOSC and price often precede significant reversals
* **Trend confirmation:** ULTOSC direction can confirm or question the prevailing price trend
* **Signal quality:** Extreme readings (>80 or <20) indicate strong momentum that may be unsustainable
* **Multiple timeframe consensus:** When all three underlying periods agree, signals are typically more reliable
## Trading Applications
**Primary Uses:**
- **Divergence trading:** Identify when momentum diverges from price for reversal signals
- **Overbought/oversold identification:** Find potential entry/exit points at extreme levels
- **Trend confirmation:** Validate breakouts and trend continuations
- **Momentum analysis:** Assess the strength of current price movements
**Advanced Strategies:**
- **Multi-divergence confirmation:** Look for divergences across multiple timeframes
- **Momentum breakouts:** Trade when ULTOSC breaks above/below key levels with volume
- **Swing trading entries:** Use oversold/overbought levels for swing position entries
- **Trend strength assessment:** Evaluate trend quality using momentum consistency
## Signal Combinations
**Strong Bullish Signals:**
- ULTOSC rises from oversold territory (<30) with positive price divergence
- ULTOSC breaks above 50 after forming a base near 30
- All three underlying periods show increasing buying pressure
**Strong Bearish Signals:**
- ULTOSC falls from overbought territory (>70) with negative price divergence
- ULTOSC breaks below 50 after forming a top near 70
- All three underlying periods show decreasing buying pressure
**Divergence Signals:**
- **Bullish divergence:** Price makes lower lows while ULTOSC makes higher lows
- **Bearish divergence:** Price makes higher highs while ULTOSC makes lower highs
- **Hidden bullish divergence:** Price makes higher lows while ULTOSC makes lower lows (trend continuation)
- **Hidden bearish divergence:** Price makes lower highs while ULTOSC makes higher highs (trend continuation)
## Comparison with Related Oscillators
| Indicator | Periods | Focus | Best Use Case |
|-----------|---------|-------|---------------|
| **Ultimate Oscillator** | 3 periods | Buying pressure | Divergence detection |
| **Stochastic** | 1-2 periods | Price position | Overbought/oversold |
| **RSI** | 1 period | Price momentum | Momentum analysis |
| **Williams %R** | 1 period | Price position | Short-term signals |
## Advanced Configurations
**Fast Trading Setup:**
- Fast: 5, Medium: 10, Slow: 20
- Weights: 4/2/1, Thresholds: 75/25
**Standard Setup:**
- Fast: 7, Medium: 14, Slow: 28
- Weights: 4/2/1, Thresholds: 70/30
**Conservative Setup:**
- Fast: 14, Medium: 28, Slow: 56
- Weights: 3/2/1, Thresholds: 65/35
**Divergence Focused:**
- Fast: 7, Medium: 14, Slow: 28
- Weights: 2/2/2, Thresholds: 70/30
## Market-Specific Adjustments
**Volatile Markets:**
- Use longer periods (10/20/40) to reduce noise
- Consider higher threshold levels (75/25)
- Focus on extreme readings for signal quality
**Trending Markets:**
- Emphasize divergence analysis over absolute levels
- Look for momentum confirmation rather than reversal signals
- Use hidden divergences for trend continuation
**Range-Bound Markets:**
- Standard overbought/oversold levels work well
- Trade reversals from extreme levels
- Combine with support/resistance analysis
## Limitations and Considerations
* **Lagging component:** Contains inherent lag due to multiple moving average calculations
* **Complex calculation:** More computationally intensive than single-period oscillators
* **Parameter sensitivity:** Performance varies significantly with different period/weight combinations
* **Market dependency:** Most effective in trending markets with clear momentum patterns
* **False divergences:** Not all divergences lead to significant price reversals
* **Whipsaw potential:** Can generate conflicting signals in choppy markets
## Best Practices
**Effective Usage:**
- Focus on divergences rather than absolute overbought/oversold levels
- Combine with trend analysis for context
- Use multiple timeframe analysis for confirmation
- Pay attention to the speed of momentum changes
**Common Mistakes:**
- Over-relying on overbought/oversold levels in strong trends
- Ignoring the underlying trend direction
- Using inappropriate period settings for the market being analyzed
- Trading every divergence without additional confirmation
**Signal Enhancement:**
- Combine with volume analysis for confirmation
- Use price action context (support/resistance levels)
- Consider market volatility when setting thresholds
- Look for convergence across multiple momentum indicators
## Historical Context and Development
The Ultimate Oscillator was developed by Larry Williams and introduced in his 1985 article "The Ultimate Oscillator" in Technical Analysis of Stocks and Commodities magazine. Williams designed it to address the limitations of single-period oscillators by:
- Reducing false signals through multi-timeframe analysis
- Maintaining sensitivity to short-term momentum changes
- Providing more reliable divergence signals
- Creating a more robust momentum measurement tool
The indicator has become a standard tool in technical analysis, particularly valued for its divergence detection capabilities and its balanced approach to momentum measurement.
## References
* Williams, L. R. (1985). The Ultimate Oscillator. Technical Analysis of Stocks and Commodities, 3(4).
* Williams, L. R. (1999). Long-Term Secrets to Short-Term Trading. Wiley Trading.

Standardization (Z-score)Standardization, often referred to as Z-score normalization, is a data preprocessing technique that rescales data to have a mean of 0 and a standard deviation of 1. The resulting values, known as Z-scores, indicate how many standard deviations an individual data point is from the mean of the dataset (or a rolling sample of it).
This indicator calculates and plots the Z-score for a given input series over a specified lookback period. It is a fundamental tool for statistical analysis, outlier detection, and preparing data for certain machine learning algorithms.
## Core Concepts
* **Standardization:** The process of transforming data to fit a standard normal distribution (or more generally, to have a mean of 0 and standard deviation of 1).
* **Z-score (Standard Score):** A dimensionless quantity that represents the number of standard deviations by which a data point deviates from the mean of its sample.
The formula for a Z-score is:
`Z = (x - μ) / σ`
Where:
* `x` is the individual data point (e.g., current value of the source series).
* `μ` (mu) is the mean of the sample (calculated over the lookback period).
* `σ` (sigma) is the standard deviation of the sample (calculated over the lookback period).
* **Mean (μ):** The average value of the data points in the sample.
* **Standard Deviation (σ):** A measure of the amount of variation or dispersion of a set of values. A low standard deviation indicates that the values tend to be close to the mean, while a high standard deviation indicates that the values are spread out over a wider range.
## Common Settings and Parameters
| Parameter | Type | Default | Function | When to Adjust |
| :-------------- | :----------- | :------ | :------------------------------------------------------------------------------------------------------ | :-------------------------------------------------------------------------------------------------------------------------------------------------------------------------- |
| Source | series float | close | The input data series (e.g., price, volume, indicator values). | Choose the series you want to standardize. |
| Lookback Period | int | 20 | The number of bars (sample size) used for calculating the mean (μ) and standard deviation (σ). Min 2. | A larger period provides more stable estimates of μ and σ but will be less responsive to recent changes. A shorter period is more reactive. `minval` is 2 because `ta.stdev` requires it. |
**Pro Tip:** Z-scores are excellent for identifying anomalies or extreme values. For instance, applying Standardization to trading volume can help quickly spot days with unusually high or low activity relative to the recent norm (e.g., Z-score > 2 or < -2).
## Calculation and Mathematical Foundation
The Z-score is calculated for each bar as follows, using a rolling window defined by the `Lookback Period`:
1. **Calculate Mean (μ):** The simple moving average (`ta.sma`) of the `Source` data over the specified `Lookback Period` is calculated. This serves as the sample mean `μ`.
`μ = ta.sma(Source, Lookback Period)`
2. **Calculate Standard Deviation (σ):** The standard deviation (`ta.stdev`) of the `Source` data over the same `Lookback Period` is calculated. This serves as the sample standard deviation `σ`.
`σ = ta.stdev(Source, Lookback Period)`
3. **Calculate Z-score:**
* If `σ > 0`: The Z-score is calculated using the formula:
`Z = (Current Source Value - μ) / σ`
* If `σ = 0`: This implies all values in the lookback window are identical (and equal to the mean). In this case, the Z-score is defined as 0, as the current source value is also equal to the mean.
* If `σ` is `na` (e.g., insufficient data in the lookback period), the Z-score is `na`.
> 🔍 **Technical Note:**
> * The `Lookback Period` must be at least 2 for `ta.stdev` to compute a valid standard deviation.
> * The Z-score calculation uses the sample mean and sample standard deviation from the rolling lookback window.
## Interpreting the Z-score
* **Magnitude and Sign:**
* A Z-score of **0** means the data point is identical to the sample mean.
* A **positive Z-score** indicates the data point is above the sample mean. For example, Z = 1 means the point is 1 standard deviation above the mean.
* A **negative Z-score** indicates the data point is below the sample mean. For example, Z = -1 means the point is 1 standard deviation below the mean.
* **Typical Range:** For data that is approximately normally distributed (bell-shaped curve):
* About 68% of Z-scores fall between -1 and +1.
* About 95% of Z-scores fall between -2 and +2.
* About 99.7% of Z-scores fall between -3 and +3.
* **Outlier Detection:** Z-scores significantly outside the -2 to +2 range, and especially outside -3 to +3, are often considered outliers or extreme values relative to the recent historical data in the lookback window.
* **Volatility Indication:** When applied to price, large absolute Z-scores can indicate moments of high volatility or significant deviation from the recent price trend.
The indicator plots horizontal lines at ±1, ±2, and ±3 standard deviations to help visualize these common thresholds.
## Common Applications
1. **Outlier Detection:** Identifying data points that are unusual or extreme compared to the rest of the sample. This is a primary use in financial markets for spotting abnormal price moves, volume spikes, etc.
2. **Comparative Analysis:** Allows for comparison of scores from different distributions that might have different means and standard deviations. For example, comparing the Z-score of returns for two different assets.
3. **Feature Scaling in Machine Learning:** Standardizing features to have a mean of 0 and standard deviation of 1 is a common preprocessing step for many machine learning algorithms (e.g., SVMs, logistic regression, neural networks) to improve performance and convergence.
4. **Creating Normalized Oscillators:** The Z-score itself can be used as a bounded (though not strictly between -1 and +1) oscillator, indicating how far the current price has deviated from its moving average in terms of standard deviations.
5. **Statistical Process Control:** Used in quality control charts to monitor if a process is within expected statistical limits.
## Limitations and Considerations
* **Assumption of Normality for Probabilistic Interpretation:** While Z-scores can always be calculated, the probabilistic interpretations (e.g., "68% of data within ±1σ") strictly apply to normally distributed data. Financial data is often not perfectly normal (e.g., it can have fat tails).
* **Sensitivity of Mean and Standard Deviation to Outliers:** The sample mean (μ) and standard deviation (σ) used in the Z-score calculation can themselves be influenced by extreme outliers within the lookback period. This can sometimes mask or exaggerate the Z-score of other points.
* **Choice of Lookback Period:** The Z-score is highly dependent on the `Lookback Period`. A short period makes it very sensitive to recent fluctuations, while a long period makes it smoother and less responsive. The appropriate period depends on the analytical goal.
* **Stationarity:** For time series data, Z-scores are calculated based on a rolling window. This implicitly assumes some level of local stationarity (i.e., the mean and standard deviation are relatively stable within the window).

Triangular Moving Average (TRIMA)The Triangular Moving Average (TRIMA) is a technical indicator that applies a triangular weighting scheme to price data, providing enhanced smoothing compared to simpler moving averages. Originating in the early 1970s as technical analysts sought more effective noise filtering methods, the TRIMA was first popularized through the work of market technician Arthur Merrill. Its formal mathematical properties were established in the 1980s, and the indicator gained widespread adoption in the 1990s as computerized charting became standard. TRIMA effectively filters out market noise while maintaining important trends through its unique center-weighted calculation method.
## Core Concepts
* **Double-smoothing process:** TRIMA can be viewed as applying a simple moving average twice, creating more effective noise filtering
* **Triangular weighting:** Uses a symmetrical weight distribution that emphasizes central data points and reduces emphasis toward both ends
* **Constant-time implementation:** Two $O(1)$ SMA passes with circular buffers preserve exact triangular weights while keeping update cost constant per bar
* **Market application:** Particularly effective for identifying the underlying trend in noisy market conditions where standard moving averages generate too many false signals
* **Timeframe flexibility:** Works across multiple timeframes, with longer periods providing cleaner trend signals in higher timeframes
The core innovation of TRIMA is its unique triangular weighting scheme, which can be viewed either as a specialized weight distribution or as a twice-applied simple moving average with adjusted period. This creates more effective noise filtering without the excessive lag penalty typically associated with longer-period averages. The symmetrical nature of the weight distribution ensures zero phase distortion, preserving the timing of important market turning points.
## Common Settings and Parameters
| Parameter | Default | Function | When to Adjust |
|-----------|---------|----------|---------------|
| Length | 14 | Controls the lookback period | Increase for smoother signals in volatile markets, decrease for responsiveness |
| Source | close | Price data used for calculation | Consider using hlc3 for a more balanced price representation |
**Pro Tip:** For a good balance between smoothing and responsiveness, try using a TRIMA with period N instead of an SMA with period 2N - you'll get similar smoothing characteristics but with less lag.
## Calculation and Mathematical Foundation
**Simplified explanation:**
TRIMA calculates a weighted average of prices where the weights form a triangle shape. The middle prices get the most weight, and weights gradually decrease toward both the recent and older ends. This creates a smooth filter that effectively removes random price fluctuations while preserving the underlying trend.
**Technical formula:**
TRIMA = Σ(Price × Weight ) / Σ(Weight )
Where the triangular weights form a symmetric pattern:
- Weight = min(i, n-1-i) + 1
- Example for n=5: weights =
- Example for n=4: weights =
Alternatively, TRIMA can be calculated as:
TRIMA(source, p) = SMA(SMA(source, (p+1)/2), (p+1)/2)
> 🔍 **Technical Note:** The double application of SMA explains why TRIMA provides better smoothing than a single SMA or WMA. This approach effectively applies smoothing twice with optimal period adjustment, creating a -18dB/octave roll-off in the frequency domain compared to -6dB/octave for a simple moving average, and the current implementation achieves $O(1)$ complexity through circular buffers and NA-safe warmup compensation.
## Interpretation Details
TRIMA can be used in various trading strategies:
* **Trend identification:** The direction of TRIMA indicates the prevailing trend
* **Signal generation:** Crossovers between price and TRIMA generate trade signals with fewer false alarms than SMA
* **Support/resistance levels:** TRIMA can act as dynamic support during uptrends and resistance during downtrends
* **Trend strength assessment:** Distance between price and TRIMA can indicate trend strength
* **Multiple timeframe analysis:** Using TRIMAs with different periods can confirm trends across different timeframes
## Limitations and Considerations
* **Market conditions:** Like all moving averages, less effective in choppy, sideways markets
* **Lag factor:** More lag than WMA or EMA due to center-weighted emphasis
* **Limited adaptability:** Fixed weighting scheme cannot adapt to changing market volatility
* **Response time:** Takes longer to reflect sudden price changes than directionally-weighted averages
* **Complementary tools:** Best used with momentum oscillators or volume indicators for confirmation
## References
* Ehlers, John F. "Cycle Analytics for Traders." Wiley, 2013
* Kaufman, Perry J. "Trading Systems and Methods." Wiley, 2013
* Colby, Robert W. "The Encyclopedia of Technical Market Indicators." McGraw-Hill, 2002

Savitzky-Golay Filter (SGF)The Savitzky-Golay Filter (SGF) is a digital filter that performs local polynomial regression on a series of values to determine the smoothed value for each point. Developed by Abraham Savitzky and Marcel Golay in 1964, it is particularly effective at preserving higher moments of the data while reducing noise. This implementation provides a practical adaptation for financial time series, offering superior preservation of peaks, valleys, and other important market structures that might be distorted by simpler moving averages.
## Core Concepts
* **Local polynomial fitting:** Fits a polynomial of specified order to a sliding window of data points
* **Moment preservation:** Maintains higher statistical moments (peaks, valleys, inflection points)
* **Optimized coefficients:** Uses pre-computed coefficients for common polynomial orders
* **Adaptive weighting:** Weight distribution varies based on polynomial order and window size
* **Market application:** Particularly effective for preserving significant price movements while filtering noise
The core innovation of the Savitzky-Golay filter is its ability to smooth data while preserving important features that are often flattened by other filtering methods. This makes it especially valuable for technical analysis where maintaining the shape of price patterns is crucial.
## Common Settings and Parameters
| Parameter | Default | Function | When to Adjust |
|-----------|---------|----------|---------------|
| Window Size | 11 | Number of points used in local fitting (must be odd) | Increase for smoother output, decrease for better feature preservation |
| Polynomial Order | 2 | Order of fitting polynomial (2 or 4) | Use 2 for general smoothing, 4 for better peak preservation |
| Source | close | Price data used for calculation | Consider using hlc3 for more stable fitting |
**Pro Tip:** A window size of 11 with polynomial order 2 provides a good balance between smoothing and feature preservation. For sharper peaks and valleys, use order 4 with a smaller window size.
## Calculation and Mathematical Foundation
**Simplified explanation:**
The filter fits a polynomial of specified order to a moving window of price data. The smoothed value at each point is computed from this local fit, effectively removing noise while preserving the underlying shape of the data.
**Technical formula:**
For a window of size N and polynomial order M, the filtered value is:
y = Σ(c_i × x )
Where:
- c_i are the pre-computed filter coefficients
- x are the input values in the window
- Coefficients depend on window size N and polynomial order M
> 🔍 **Technical Note:** The implementation uses optimized coefficient calculations for orders 2 and 4, which cover most practical applications while maintaining computational efficiency.
## Interpretation Details
The Savitzky-Golay filter can be used in various trading strategies:
* **Pattern recognition:** Preserves chart patterns while removing noise
* **Peak detection:** Maintains amplitude and width of significant peaks
* **Trend analysis:** Smooths price movement without distorting important transitions
* **Divergence trading:** Better preservation of local maxima and minima
* **Volatility analysis:** Accurate representation of price movement dynamics
## Limitations and Considerations
* **Computational complexity:** More intensive than simple moving averages
* **Edge effects:** First and last few points may show end effects
* **Parameter sensitivity:** Performance depends on appropriate window size and order selection
* **Data requirements:** Needs sufficient points for polynomial fitting
* **Complementary tools:** Best used with volume analysis and momentum indicators
## References
* Savitzky, A., Golay, M.J.E. "Smoothing and Differentiation of Data by Simplified Least Squares Procedures," Analytical Chemistry, 1964
* Press, W.H. et al. "Numerical Recipes: The Art of Scientific Computing," Chapter 14
* Schafer, R.W. "What Is a Savitzky-Golay Filter?" IEEE Signal Processing Magazine, 2011
