Crypto Pro Strategy (Entry Model + Risk)Imma try to use this on a prop firm but if you want to use it itss free or im going to try to make it free
Recherche dans les scripts pour "pro"

⚡ Elite Momentum Pro🎯 Key Features
1. Smart Signal Engine
3 Signal Modes: Aggressive, Balanced, Conservative
7-Point Scoring System - Ensures high-quality signals
Anti-Flip Protection - Prevents rapid signal changes
Multiple confirmations: Supertrend, MACD, RSI, EMA alignment, momentum
2. Advanced Risk Management
3 Take Profit Levels (TP1, TP2, TP3) for scaling out
ATR-Based Dynamic Stops - Adapts to volatility
Customizable Risk:Reward (default 2.5:1)
Visual stop and target levels
3. Clean Visual Design
Color-coded price bars based on trend strength
EMA Ribbon (9, 21, 50, 200) for trend clarity

QUANTUM MOMENTUMOverview
Quantum Momentum is a sophisticated technical analysis tool designed to help traders identify relative strength between assets through advanced momentum comparison. This cyberpunk-themed indicator visualizes momentum dynamics between your current trading symbol and any comparison asset of your choice, making it ideal for pairs trading, crypto correlation analysis, and multi-asset portfolio management.
Key Features
📊 Multi-Asset Momentum Comparison
Dual Symbol Analysis: Compare momentum between your chart symbol and any other tradable asset
Real-Time Tracking: Monitor relative momentum strength as market conditions evolve
Difference Visualization: Clear histogram display showing which asset has stronger momentum
🎯 Multiple Momentum Calculation Methods
Choose from four different momentum calculation types:
ROC (Rate of Change): Traditional percentage-based momentum measurement
RSI (Relative Strength Index): Oscillator-based momentum from 0-100 range
Percent Change: Simple percentage change over the lookback period
Raw Change: Absolute price change in native currency units
📈 Advanced Trend Filtering System
Enable optional trend filters to align momentum signals with prevailing market direction:
SMA (Simple Moving Average): Classic trend identification
EMA (Exponential Moving Average): Responsive trend detection
Price Action: Identifies trends through higher highs/lows or lower highs/lows patterns
ADX (Average Directional Index): Measures trend strength with customizable threshold
🎨 Futuristic Cyberpunk Design
Neon Color Scheme: Eye-catching cyan, magenta, and matrix green color palette
Glowing Visual Effects: Enhanced visibility with luminescent plot lines
Dynamic Background Shading: Subtle trend state visualization
Real-Time Data Table: Sleek information panel displaying current momentum values and trend status
How It Works
The indicator calculates momentum for both your current chart symbol and a comparison symbol (default: BTC/USDT) using your selected method and lookback period. The difference between these momentum values reveals which asset is exhibiting stronger momentum at any given time.
Positive Difference (Green): Your chart symbol has stronger momentum than the comparison asset
Negative Difference (Pink/Red): The comparison asset has stronger momentum than your chart symbol
When the trend filter is enabled, the indicator will only display signals that align with the detected market trend, helping filter out counter-trend noise.
Settings Guide
Symbol Settings
Compare Symbol: Choose any tradable asset to compare against (e.g., major indices, cryptocurrencies, forex pairs)
Momentum Settings
Momentum Length: Lookback period for momentum calculations (default: 14 bars)
Momentum Type: Select your preferred momentum calculation method
Display Options
Toggle visibility of current symbol momentum line
Toggle visibility of comparison symbol momentum line
Toggle visibility of momentum difference histogram
Optional zero line reference
Trend Filter Settings
Use Trend Filter: Enable/disable trend-based signal filtering
Trend Method: Choose from SMA, EMA, Price Action, or ADX
Trend Length: Period for trend calculations (default: 50)
ADX Threshold: Minimum ADX value to confirm trend strength (default: 25)
Best Use Cases
✅ Pairs Trading: Identify divergences in momentum between correlated assets
✅ Crypto Market Analysis: Compare altcoin momentum against Bitcoin or Ethereum
✅ Stock Market Rotation: Track sector or index relative strength
✅ Forex Strength Analysis: Monitor currency pair momentum relationships
✅ Multi-Timeframe Confirmation: Use alongside other indicators for confluence
✅ Mean Reversion Strategies: Spot extreme momentum divergences for potential reversals
Visual Indicators
⚡ Cyan Line: Your chart symbol's momentum
⚡ Magenta Line: Comparison symbol's momentum
📊 Green/Pink Histogram: Momentum difference (positive = green, negative = pink)
▲ Green Triangle: Bullish trend detected (when filter enabled)
▼ Red Triangle: Bearish trend detected (when filter enabled)
◈ Yellow Diamond: Neutral/sideways trend (when filter enabled)
Pro Tips
💡 Look for crossovers between the momentum lines as potential trade signals
💡 Combine with volume analysis for stronger confirmation
💡 Use momentum divergence (price making new highs/lows while momentum doesn't) for reversal signals
💡 Enable trend filter during ranging markets to reduce false signals
💡 Experiment with different momentum types to find what works best for your trading style
Technical Requirements
TradingView Pine Script Version: v6
Chart Type: Works on all chart types
Indicator Placement: Separate pane (overlay=false)
Data Requirements: Needs access to comparison symbol data

Illuminati Zone🟣 Illuminati Zone — Hidden Power of the 11 PM NZ Candle
The Illuminati Zone reveals the hidden footprints of liquidity and market imbalance formed by the 11 PM New Zealand 15-minute candle — a time when global liquidity transitions between major sessions.
This candle often defines key intraday supply and demand boundaries, serving as a magnet for price and a pivot point for high-probability reversals or breakouts.
🧠 How it works
Automatically detects and marks the 11 PM NZ 15-minute candle each day.
Draws a translucent zone box between its high and low.
Extends two reference lines at +1 × range and –1 × range above and below the zone — ideal for spotting overextensions or liquidity sweeps.
Supports custom lookback, colors, and visual options.
💡 How to use it
Watch how price interacts with the zone — rejection often signals smart-money activity.
Use +1 and –1 levels as overextended zones for potential reversals or breakout retests.
Combine with your own confluence tools or volume analysis for precision entries.
⚙️ Customization Options
Target hour (NZ time)
Days back to display
Zone and line colors
Transparency and visual preferences
🔮 Pro Tip: Pair it with a volume or imbalance indicator for surgical-level precision in identifying where smart money positions are built or released.

Supertrend + MACD + EMA200 (Pro) V2 — Strict & TrailingThis strategy uses Supertrend, MACD and EMA 200 as indicators. When all three indicators shows the sema direction, you enter the trade.

Bull Market Support Band Alert (20W SMA & 21W EMA) - Multi-Alert═══════════════════════════════════════════════════════════════════
🎯 WHAT THIS INDICATOR DOES:
═══════════════════════════════════════════════════════════════════
This indicator monitors the Bull Market Support Band (BMSB) - a popular trend-following system that uses the 20-week Simple Moving Average (SMA) and 21-week Exponential Moving Average (EMA) to identify major market trends. It alerts you when price crosses either moving average on any stock in your watchlist.
═══════════════════════════════════════════════════════════════════
📈 THE BULL MARKET SUPPORT BAND STRATEGY:
═══════════════════════════════════════════════════════════════════
- ABOVE both MAs = Bullish trend (consider holding/buying)
- BELOW both MAs = Bearish trend (consider caution/selling)
- CROSSING ABOVE = Potential trend change to bullish
- CROSSING BELOW = Potential trend change to bearish
Originally popularized by cryptocurrency analysts, the BMSB has proven effective across all markets for identifying major trend changes.
═══════════════════════════════════════════════════════════════════
⚡ KEY FEATURES:
═══════════════════════════════════════════════════════════════════
✅ Single alert monitors your ENTIRE watchlist
✅ Works on ANY timeframe (daily, 4H, 1H) while maintaining weekly MA accuracy
✅ Visual signals when crosses occur (green/red arrows)
✅ Real-time status table showing current values
✅ Background coloring for quick trend identification
✅ Customizable alert settings for crosses above/below
═══════════════════════════════════════════════════════════════════
🔔 HOW TO SET UP ALERTS:
═══════════════════════════════════════════════════════════════════
1. Add this indicator to your chart
2. Click Alert (alarm icon)
3. Select "BMSB Watchlist Alert" → "BMSB Cross Alert"
4. Choose your alert frequency:
• "Once Per Bar" = Immediate alerts (for active traders)
• "Once Per Bar Close" = Confirmed signals (fewer false alarms)
5. CHECK "Apply to all symbols in watchlist" ← IMPORTANT!
6. Select your watchlist and create
═══════════════════════════════════════════════════════════════════
⚙️ RECOMMENDED SETTINGS:
═══════════════════════════════════════════════════════════════════
📍 FOR SWING TRADERS:
- Chart: Daily timeframe
- Alert Trigger: Once Per Bar Close
- Both crosses enabled
📍 FOR ACTIVE TRADERS:
- Chart: 4H or Daily timeframe
- Alert Trigger: Once Per Bar
- Both crosses enabled
📍 FOR LONG-TERM INVESTORS:
- Chart: Weekly timeframe
- Alert Trigger: Once Per Bar Close
- Focus on crosses above
═══════════════════════════════════════════════════════════════════
📊 VISUAL ELEMENTS:
═══════════════════════════════════════════════════════════════════
- BLUE LINE = 20-week Simple Moving Average
- RED LINE = 21-week Exponential Moving Average
- GREEN ARROWS = Price crossed above BMSB
- RED ARROWS = Price crossed below BMSB
- GREEN BACKGROUND = Price above both MAs (bullish)
- RED BACKGROUND = Price below both MAs (bearish)
- STATUS TABLE = Current price position and MA values
═══════════════════════════════════════════════════════════════════
💡 PRO TIPS:
═══════════════════════════════════════════════════════════════════
1. The indicator calculates WEEKLY MAs regardless of your chart timeframe
2. Best used with liquid stocks/cryptos with good volume
3. Consider waiting for daily/weekly close for confirmation
4. Crosses are more significant after extended periods above/below
5. Works great with additional confirmation (volume, RSI, etc.)
═══════════════════════════════════════════════════════════════════
⚠️ IMPORTANT NOTES:
═══════════════════════════════════════════════════════════════════
- FREE accounts limited to 1 active alert
- Alerts check based on YOUR selected timeframe, not the weekly MA calculation
- False signals possible during ranging/choppy markets
- Not financial advice - use as one tool among many
═══════════════════════════════════════════════════════════════════
👨💻 AUTHOR'S NOTE:
═══════════════════════════════════════════════════════════════════
Built for traders who want to monitor multiple stocks efficiently without creating dozens of individual alerts. Perfect for identifying major trend changes across your entire portfolio with a single alert.
Tags: #BMSB #BullMarketSupportBand #20WeekSMA #21WeekEMA #TrendFollowing #MovingAverage #WatchlistAlert #MultiTimeframe #SwingTrading #TrendTrading

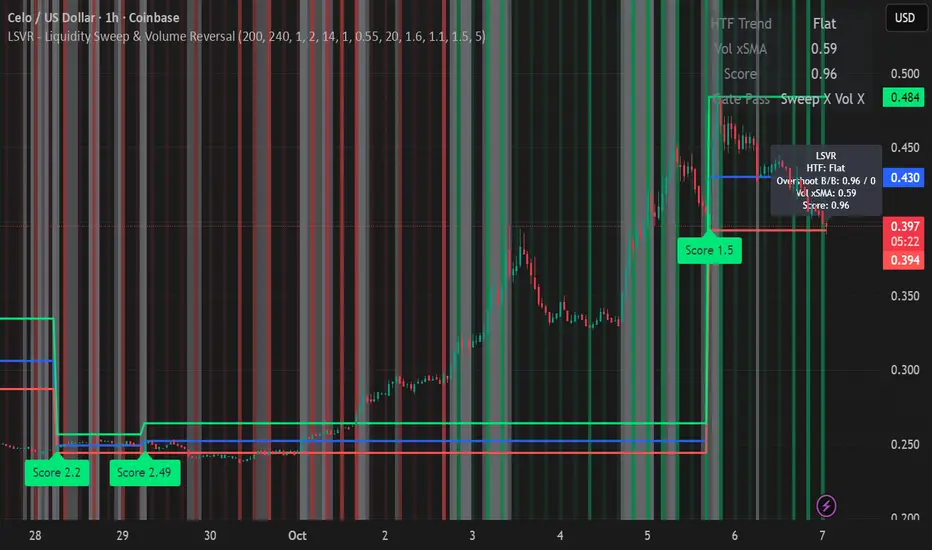
LSVR - Liquidity Sweep & Volume ReversalLSVR condenses a pro workflow into one visual overlay: Higher-Timeframe (HTF) Trend → Liquidity Sweep & Reclaim → Volume Confirmation. A signal only prints when all three gates align at bar close, and the chart shows everything you need—trend context, the sweep “trap” candle, and a projected Entry/SL/TP based on your chosen R multiple.
How it works
HTF Trend Filter: Projects a smoothed KAMA/EMA from a higher timeframe to the chart using a safe, lookahead-off request. Long signals are considered only above the HTF line; shorts only below.
Liquidity Sweep & Reclaim: Finds confirmed swing highs/lows, then detects an ATR-scaled overshoot through that swing followed by a reclaim (close back inside a configurable % of the bar range).
Volume Confirmation: Requires either a volume spike over Volume SMA × multiplier or optional OBV divergence. No participation = no signal.
Score: Each setup is scored: trend (0/1) + overshoot strength (0..1.5) + conviction (0/1). Signals fire only when the score ≥ Min Signal Score.
What you see
HTF Ribbon (subtle green/red backdrop) for bias.
Sweep Box on the signal candle (green = long, red = short).
Signal markers (“L” / “S”) with a small score label.
Projected lines that persist until the next signal: Entry (close), Stop (beyond swept swing), Target (R multiple).
Heatmap that intensifies when the score crosses your threshold.
Dashboard (top-right): HTF direction, Volume×SMA, current Score, gate pass status.
Tooltip on the last bar with quick stats.
Quick start
Apply to any liquid symbol and set HTF to ~3–6× your chart timeframe (e.g., 15m chart → 1H–4H).
Trade with the HTF trend: take L signals above the HTF line and S signals below it.
Entry = signal bar close, SL = beyond the swept swing, TP = your Projected Take-Profit (R).
Tighten or loosen selectivity with Min Signal Score, Reclaim %, Overshoot (ATR×), and Cooldown.
Recommended presets
Choppy/crypto 15m: minScore 1.25, reclaimPct 0.60–0.65, overshootATR 1.0–1.2, useOBVDiv=false, cooldown 8.
FX 5m / session trend: minScore 1.0–1.1, reclaimPct 0.50–0.55, overshootATR 0.8–1.0, useOBVDiv=true, cooldown 5.
Indices 1m (RTH): minScore 1.2, reclaimPct 0.55–0.60, useOBVDiv=false, cooldown 10.
Non-repainting by design
HTF values use lookahead_off with realtime offset.
Swings are confirmed pivots (no “forming” pivots).
Signals print at bar close only.
Notes
OBV divergence can add sensitivity on liquid markets; keep it off for stricter filtering.
Use Cooldown to avoid clustered sweeps.
This is an overlay/analysis tool, not financial advice. Test settings in Replay/Paper Trading before using live.
LA - EMA Bands with MTF DashboardDetailed Explanation of the LA - EMA Bands with MTF Dashboard Indicator
This custom Pine Script v6 indicator, designed for Trading View, overlays EMA-based price channels on the chart while incorporating a multi-timeframe (MTF) dashboard for broader market context. It focuses on visualizing trend direction and momentum through three sets of EMA bands, each representing different time horizons, and extends this with a tabular dashboard that summarizes signals across user-selected timeframes. The bands help identify support, resistance, and trend shifts, while the dashboard provides at-a-glance alignment across multiple periods, aiding in confirming trades or spotting divergences. Unlike volatility-based channels (e.g., Bollinger or Keltner), it relies solely on EMAs for simplicity and lag-reduced responsiveness.
Inputs Section
The script begins with user-configurable options grouped for ease. A timeframe input allows specifying a resolution for the EMA bands' data fetching, defaulting to the chart's timeframe if left empty—this enables higher-timeframe overlays on lower charts for context.
Next, a shared source input defines the price data for all midlines, defaulting to the midpoint of high and low (hl2) but customizable to close, open, or others.
The EMA bands have dedicated toggles and length inputs for each of the three sets: the first (long-term) defaults to 144 periods, the second (medium-term) to 72, and the third (short-term) to 12. These are inlined for compact settings panels, with minimum lengths of 1 to prevent errors.
A boolean toggle controls the visibility of the MTF dashboard. Following this are nine pairs of inputs for dashboard timeframes: each pair includes a show/hide toggle and an editable timeframe string (e.g., '1' for 1-minute, 'D' for daily). Defaults progress from short (1, 3, 5 minutes) to longer (15, 30, 60 minutes, daily, weekly, monthly), grouped in inlines for organization. Only enabled and non-empty timeframes appear in the dashboard.
Helpers Section
Two utility functions are defined here. The first computes an EMA on any source series over a specified length using Trading View's built-in function, reused throughout for midlines and bands.
The second function generates a signal string ("B" for buy/bullish, "S" for sell/bearish, or "-" for neutral) based on the direction of an EMA applied to high prices. It compares the current EMA value to the previous one, mirroring the band fill logic for consistency in the dashboard.
Core Components per Band Set:
Midline: An EMA calculated on a user-selectable source price (default: hl2, which is the midpoint between high and low prices). This acts as the central trend line.
Upper Band: An EMA applied directly to the high prices of each bar.
Lower Band: An EMA applied to the low prices of each bar.
These form a channel that captures the smoothed range of price action, highlighting potential support (lower band), resistance (upper band), and overall trend direction (midline).
Multiple Band Sets: The indicator includes three independent EMA band sets, each with its own length parameter for customization:
EMA1 (default length: 144) – Focuses on long-term trends.
EMA2 (default length: 72) – Targets medium-term trends.
EMA3 (default length: 12) – Emphasizes short-term momentum.
Each set can be toggled on or off via input checkboxes, allowing users to reduce chart clutter if needed.
Visual Elements:
Midline Plot: Displayed as a line colored based on its direction compared to the previous bar: green for rising (bullish), red for falling (bearish), and black for neutral (flat).
Band Fill: The area between the upper and lower bands is filled with a semi-transparent color indicating the trend of the upper band: light green for rising (suggesting expanding highs/upward momentum) and light pink for falling (contracting highs/downward pressure). The bands themselves are plotted in blue with a thin linewidth.
Multi-Timeframe Support: Users can input a custom timeframe (e.g., 'D' for daily), and the indicator fetches data from that resolution. This enables higher-timeframe context on lower-timeframe charts, such as viewing daily EMA bands on a 1-hour chart.
Calculation Mechanics:
All EMAs are computed using Trading View's built-in ta.ema() function.
Data is retrieved in a single request.security() call for efficiency, with lookahead enabled to avoid repainting.
No multipliers or volatility adjustments are included, making it a simple EMA-based envelope rather than a true volatility channel.
In practice, this indicator helps traders identify trend strength, potential breakouts (price crossing bands), or mean-reversion opportunities (price bouncing within bands). It's particularly useful for swing or position trading where multi-period alignment (e.g., all midlines green) signals conviction.
Pros
Multi-Period Insight: By combining short (12), medium (72), and long (144) periods, it offers a layered view of trends across time horizons, helping confirm alignments or divergences without needing multiple separate indicators.
Visual Clarity: Color-coded trends and fills make it easy to spot bullish/bearish shifts at a glance, reducing analysis time.
Flexibility: Custom timeframe input allows for multi-timeframe analysis, while shared source and toggles provide user control.
Simplicity and Efficiency: Purely EMA-based, it's computationally light and avoids overcomplication, making it accessible for beginners while still useful for spotting channel-based setups like squeezes or expansions.
No Repainting: With lookahead, plots are stable once bars close.
Cons
Lagging Nature: EMAs inherently lag price action, especially longer ones like 144-period, which may cause delayed signals in fast-moving or ranging markets.
Lack of Volatility Adjustment: Unlike Keltner Channels or Bollinger Bands, it doesn't incorporate ATR or standard deviation, so bands may not accurately reflect true volatility—potentially leading to false breakouts in high-volatility environments.
Chart Clutter: Displaying all three band sets simultaneously can overcrowd the chart, particularly on lower timeframes or volatile assets.
Subjective Interpretation: Color changes and band interactions require trader discretion; there's no built-in alerting or quantitative signals, which might lead to inconsistent results.
Market Dependency: Defaults may not suit all assets (e.g., stocks vs. crypto); shorter periods like 12 could whipsaw in noisy markets, while 144 might be too slow for intraday trading.
Justification for Default Values (12, 72, and 144)
The default lengths of 12, 72, and 144 are not arbitrary but draw from established trading principles, particularly W.D. Gann's geometric and numerical theories, as well as Fibonacci sequences, to create a harmonic progression for short-, medium-, and long-term analysis. Here's the rationale:
12 (Short-Term): This is a common period for capturing recent momentum in technical indicators, often seen in setups like the MACD (which uses 12- and 26-day EMAs). It aligns with natural cycles, such as the 12 months in a year, and in Gann theory, 12 serves as a base unit for squaring price and time (e.g., in the "Square of 12" where multiples like 12, 24, etc., measure cycles in days, weeks, or months). At 12 periods, the EMA reacts quickly to price changes without excessive noise, making it ideal for short-term trend detection.
72 (Medium-Term): This acts as an intermediate bridge, derived from Gann's divisions of the 360-degree circle (a key Gann concept representing a full cycle). Specifically, 72 is 360/5 (relating to pentagonal geometry and natural harmonics) and appears in Gann's time cycle measurements (e.g., as a multiple in the Square of 12: 12×6=72). It's roughly half of 144, providing a balanced midpoint for medium-term trends without overlapping too closely with the others. In practice, 72 periods smooth out short-term fluctuations while still responding to developing trends.
144 (Long-Term): This is a powerhouse number in trading lore, being both 12 squared (12×12=144, central to Gann's "Square of 144" for monthly charts and major cycle turns, as there are 12 months in a year) and a Fibonacci sequence value (1, 1, 2, 3, 5, 8, 13, 21, 34, 55, 89, 144...). Fibonacci periods are popular in moving averages for their alignment with natural growth patterns in markets, and 144 is often used for long-term regime definition (e.g., confirming trends over 144 bars). It helps identify major support/resistance in extended cycles.
Overall, these values form a geometric/harmonic series (12, 72=12×6, 144=12×12), promoting alignment with market cycles as per Gann and Fibonacci principles, rather than generic lengths like 50 or 200. They can be adjusted based on the asset or timeframe, but the defaults provide a starting point rooted in time-tested trading numerology for balanced multi-period analysis.
Please use this along with other indicators (eg. Pivot, MACD, etc) for better results.

MTF RSI Heatmap)# MTF RSI Heatmap — v2.7.2
**Hybrid Higher-TF Trend + Intraday Impulse Detection + Smart Counters & Alerts**
Turn your lower pane into a **multi-timeframe market bias dashboard**. This heatmap blends classic RSI momentum with a **hybrid Daily/Weekly MA-stack trend** and an **intraday impulse override** that flags fast moves *as they happen*. Clean, configurable, and built for real trading flow.
---
## What it shows
* **6 stacked rows = 6 timeframes** (bottom → top).
* **Colors**: Green = Bull, Red = Bear, Yellow = Neutral.
* **Header counter**: `Bull X/6 | Bear Y/6` = live agreement across visible rows.
* **Impulse markers** ▲/▼ on intraday rows (5m/15m/60m/240m) when a shock move triggers.
* **Signal bar**: A thin column above the top row when at least **N of 6** rows align (configurable).
---
## Why it’s different
* **Impulse Override (intraday)**
Detects sharp moves using % change over the last *N* bars, optionally gated by **volume > SMA × multiplier**. This catches dumps/pops earlier than RSI alone.
* **Hybrid D/W (structure over noise)**
Daily/Weekly rows can use an **MA stack (8/21/55)** instead of RSI for a more stable higher-timeframe trend read. Optional **price > fast MA** filter for stricter confirmation.
* **Intrabar option**
Flip rows **during the bar** for early reads (accepting repaint on TF close), or keep it close-only for no surprises.
---
## Key features
* 🌈 **Theme**: Classic or High-Contrast colors.
* 🧠 **RSI thresholds**: Bull above 55, Bear below 45 (editable).
* 🧲 **RSI smoothing** (EMA) for intraday rows to reduce flicker.
* 🧰 **Compact left legend** with adjustable text size & opacity.
* 🚨 **Alerts**:
* **Impulse-only** (per TF and “any intraday”)
* **N-of-6 confirmation** (bull/bear)
---
## Recommended settings (fast opens & news)
* **Impulse**: `Bars = 1–2`, `Threshold = 0.25–0.35%`, `Vol confirm = ON`, `Multiplier = 1.3–1.5`.
* **Hybrid D/W**: `ON`, `EMA 8/21/55`, `Price filter = ON`.
* **Intrabar**: `ON` if you want intra-bar updates (repaints at TF close).
---
## How to read it
1. **Row scan**: Are the bottom (fast) rows aligning first? That’s early momentum.
2. **Header counter**: Look for 4+/6 agreement as momentum broadens.
3. **Signal bar**: Acts as a “go/no-go” confirmation when your threshold is met.
4. **Impulse ▲/▼**: Use as a **heads-up** for acceleration; then watch if rows cascade in that direction.
---
## Alerts (exact names)
Create alerts with these built-ins:
* **Impulse UP — any intraday**
* **Impulse DOWN — any intraday**
* **Impulse UP — TF1 / TF2 / TF3 / TF4**
* **Impulse DOWN — TF1 / TF2 / TF3 / TF4**
* **Bull confirmation** (N-of-6)
* **Bear confirmation** (N-of-6)
Tip: Use **Once per bar** or **Once per bar close** depending on whether you enabled *Intrabar*.
---
## Inputs overview
* **Timeframes & visibility** per row.
* **RSI**: length, bull/bear thresholds, optional EMA smoothing (intraday only).
* **Impulse**: bars, %, volume confirm, SMA length, multiplier, markers.
* **Hybrid D/W**: MA type (EMA/SMA/HMA), 8/21/55 lengths, price filter.
* **Theme & Legend**: color theme, label size (Tiny/Small/Normal), legend opacity.
* **Signal**: N required for confirmation (default 4).
---
## Pro tips
* Combine with **session opens**, **VWAP**, and **liquidity levels**.
* If you trade breakouts, let **impulse triggers** cue attention, then wait for **N-of-6** confirmation.
* For swing bias, lean on **Hybrid D/W**—it changes slower, but with intent.
---
## Notes & limitations
* **Intrabar = repaint expected** on higher-TF closes—by design for earlier context.
* Colors/thresholds are general guidance, not signals by themselves.
* Past performance ≠ future results; **this is not financial advice**.
---
If you enjoy this, drop a ⭐ and tell me what you want next: background shading on confirmation, tooltips with RSI/ROC per row, or a MACD/RSI hybrid mode. Trade sharp! ✨

SMA Pro (Tick)Simple moving average based on 100 ticks, by default. Use for high volume markets like ES, NQ, and RTY.


Portfolio Simulator & BacktesterMulti-asset portfolio simulator with different metrics and ratios, DCA modeling, and rebalancing strategies.
Core Features
Portfolio Construction
Up to 5 assets with customizable weights (must total 100%)
Support for any tradable symbol: stocks, ETFs, crypto, indices, commodities
Real-time validation of allocations
Dollar Cost Averaging
Monthly or Quarterly contributions
Applies to both portfolio and benchmark for fair comparison
Model real-world investing behavior
Rebalancing
Four strategies: None, Monthly, Quarterly, Yearly
Automatic rebalancing to target weights
Transaction cost modeling (customizable fee %)
Key Metrics Table
CAGR: Annualized compound return (S&P 500 avg: ~10%)
Alpha: Excess return vs. benchmark (positive = outperformance)
Sharpe Ratio: Return per unit of risk (>1.0 is good, >2.0 excellent)
Sortino Ratio: Like Sharpe but only penalizes downside (better metric)
Calmar Ratio: CAGR / Max Drawdown (>1.0 good, >2.0 excellent)
Max Drawdown: Largest peak-to-trough decline
Win Rate: % of positive days (doesn't indicate profitability)
Visualization
Dual-chart comparison - Portfolio vs. Benchmark
Dollar or percentage view toggle
Customizable colors and line width
Two tables: Statistics + Asset Allocation
Adjustable table position and text size
🚀 Quick Start Guide
Enter 1-5 ticker symbols (e.g., SPY, QQQ, TLT, GLD, BTCUSD)
Make sure percentage weights total 100%
Choose date range (ensure chart shows full period - zoom out!)
Configure DCA and rebalancing (optional)
Select benchmark (default: SPX)
Analyze results in statistics table
💡 Pro Tips
Chart data matters: Load SPY or your longest-history asset as main chart
If you select an asset that was not available for the selected period, the chart will not show up! E.g. BTCUSD data: Only available from ~2017 onwards.
Transaction fees: 0.1% default (adjust to match your broker)
⚠️ Important Notes
Requires visible chart data (zoom out to show full date range)
Limited by each asset's historical data availability
Transaction fees and costs are modeled, but taxes/slippage are not
Past performance ≠ future results
Use for research and education only, not financial advice
Let me know if you have any suggestions to improve this simulator.

Market Mode Risk IndicatorMarket Mode Risk Indicator v1.1
This custom indicator helps traders gauge market risk sentiment by monitoring Exponential Moving Average (EMA) or Simple Moving Average (SMA) crossovers on key indices like BIST 100 (for Turkish markets), NASDAQ Composite (tech-focused US), or Dow Jones Industrial Average (industrial US). It dynamically categorizes the market into three actionable modes based on the index's position relative to layered MAs, providing a quick visual snapshot without cluttering your chart.
Risk Modes Explained:
RISK OFF (Red): Index closes below the Long MA (default 50 periods) – signals bearish caution; time to tighten stops or reduce exposure.
RISK TEST (Orange): Index above Medium MA1 (21 periods) and Extra Long MA (55 periods), but below Short MA (10 periods) and above Long MA – a transitional "test" phase; watch for confirmation before entering.
RISK ON (Green): Index above all MAs (Short, Medium, Long, Extra Long) – bullish green light; favorable for longs or momentum plays.
How It Works:
The core logic uses boolean checks on the index's close price against user-defined MA lengths. For example:
It pulls live data from your selected index via request.security.
Computes MAs with ternary operators for EMA (ta.ema) or SMA (ta.sma) based on your choice.
Mode detection relies on AND/OR conditions (e.g., aboveShort and aboveMed1 and aboveLong and aboveExtraLong for RISK ON) to filter noise and focus on meaningful shifts.
No lookahead bias – all calculations are historical and real-time compatible. Defaults (10/21/50/55) are inspired by common Fibonacci-inspired periods for balanced sensitivity.
Alerts fire only on mode transitions (e.g., from RISK OFF to ON) to prevent spam, using alertcondition with dynamic messages including price and ticker.
Customization Options:
Index & MA Settings: Switch EMA/SMA; tweak lengths (min 1 period) for your timeframe (e.g., shorter for intraday).
Display: Position the table (top/bottom, left/right); toggle MA values on/off.
Looks: Background/border/text colors, transparency (0-100%) for theme matching.
Built in Pine Script v5 for efficiency – lightweight, no repaints.
Usage Tips:
Add to any stock chart (e.g., GARAN for BIST analysis).
Select your index in settings; refresh chart if switching MA type.
Use on daily/4H timeframes for swing trading; alerts via email/SMS for hands-free monitoring.
Pro Tip: Combine with volume or RSI for confirmation – RISK ON + rising volume = stronger buy signal.

Candle Opens by HAZED🎯 Candle Opens by HAZED - Multi-Timeframe Open Levels Indicator
📊 Overview
This powerful indicator displays multiple timeframe opening prices on your chart, providing crucial reference levels that institutional traders and algorithms frequently monitor. Track up to 7 different timeframe opens simultaneously, from 1-hour to yearly, with advanced visualization features including dynamic coloring, heatmap analysis, and real-time status tracking.
✨ Key Features
📈 Multi-Timeframe Support:
- 1H, 4H, Daily, Weekly, Monthly, Quarterly, and Yearly opens
- Each timeframe can be individually enabled/disabled
- Automatic visibility adjustment based on chart timeframe
🎨 Dynamic Visual System:
- Smart Color Coding: Lines automatically change color based on price position (green above, red below)
- Customizable Styling: Adjust line thickness, transparency, and colors
- Intelligent Line Positioning: Choose between equal-length or staggered lines for better visibility
- Enhanced Labels: Display timeframe only or include price with colored background
🌈 Advanced Heatmap:
- Background coloring shows overall market sentiment across all timeframes
- Gradient or solid color modes
- Instantly see when multiple timeframes align bullish or bearish
📊 Status Table Dashboard:
- Real-time overview of all active opens
- Shows current price position relative to each open
- Simplified view when all timeframes align
- Customizable position and font style
⚙️ Professional Tools:
- Alert system for new open levels
- Extended hours session support
- Price discovery mode for EOD/intraday discrepancies
- Left/right line extensions for enhanced visibility
💡 Trading Applications
Support & Resistance:
Opening prices act as natural support/resistance levels. Price often reacts at these levels, providing entry/exit opportunities.
Trend Confirmation:
When price is above multiple opens (especially higher timeframes), it confirms bullish momentum. The opposite indicates bearish pressure.
Mean Reversion:
Price tends to revert to significant opens, particularly daily and weekly levels. Use these as targets for counter-trend trades.
Breakout Trading:
Monitor when price breaks above/below clustered opens for potential continuation moves.
Risk Management:
Use opens as logical stop-loss levels or position sizing references based on distance from key opens.
🔧 Indicator Settings
Timeframes Section:
- Toggle each timeframe on/off
- Customize individual colors
Visual Style Section:
- Dynamic Colors: Auto-color based on price position
- Line Thickness: 1-4 pixels
- Transparency: 0-80%
- Extension Length: How far lines extend right
- Label Style: Plain or enhanced with price
Heatmap Section:
- Enable/disable background coloring
- Adjust transparency
- Choose gradient or solid zones
Status Table Section:
- Position on chart
- Font selection
Advanced Section:
- Enable alerts for new opens
- Price discovery mode
- Extended hours inclusion
]📈 Best Practices
1. Timeframe Selection:
- For intraday: Focus on 1H, 4H, and Daily
- For swing trading: Daily, Weekly, Monthly
- For position trading: Monthly, Quarterly, Yearly
2. Color Coding:
- Enable dynamic colors for instant sentiment reading
- Use heatmap for overall market bias
3. Confluence Zones:
- Pay special attention when multiple opens cluster
- These zones often produce stronger reactions
4. Alignment Signals:
- When all timeframes show same color = strong trend
- Mixed colors = potential consolidation or reversal zone
🎯 Pro Tips
- Volume Confirmation: Combine with volume indicators to confirm reactions at open levels
- Multiple Instruments: Compare opens across correlated assets for divergences
- News Events: Opens often act as magnets after major news releases
- Options Trading: Weekly and monthly opens align with options expiry levels
- Algorithmic Levels: Many algorithms use these opens for entries/exits
🔄 Updates in Version 8.3
- Added 1H and 4H timeframe support
- Enhanced dynamic color system
- Implemented heatmap visualization
- Added real-time status table
- Optimized performance for smoother operation
- Improved label styling options
- Better yearly timeframe detection
⚡ Performance Optimizations
This indicator uses advanced Pine Script v6 features for optimal performance:
- Efficient object reuse instead of recreation
- Smart calculation loops
- Minimal repainting
- Optimized for real-time updates
📝 Notes
- Works on all markets (stocks, forex, crypto, futures)
- Best on timeframes lower than the opens you're tracking
- Lines automatically hide when their timeframe is lower than chart timeframe
- Past opens are not displayed (indicator shows current opens only)
🙏 Credits & Support
Created by HAZED | Version 8.3
Optimized for TradingView Pine Script v6
For questions, suggestions, or bug reports, please comment below.
If you find this indicator useful, please consider leaving a like and a follow!
Remember: No indicator is perfect. Always use proper risk management and combine multiple confirmation signals in your trading decisions.

Swing Dashboard - Pro Trader Metrics with MTF & Enhanced VolumeDESCRIPTION:
A comprehensive real-time dashboard designed for swing traders and active investors trading US equities. Displays all critical metrics in one customizable panel overlay - no need to clutter your chart with multiple indicators.
KEY FEATURES:
📊 Relative Strength Analysis:
Stock vs Market (SPY/QQQ/IWM/DIA)
Stock vs Sector (automatic sector ETF detection)
Sector vs Market comparison
Customizable lookback period (5-60 days)
📈 Price & Range Metrics:
Daily range, change, and gap percentages
Distance from SMA20, SMA50, VWAP
52-week position percentage
ATR% and ADR% for volatility assessment
Range/ADR ratio for breakout detection
💪 Advanced Volume Analysis:
RVOL (full day volume vs 20-day average)
Volume Strength (bar-by-bar analysis)
Volume Trend (5-day vs 20-day momentum)
Customizable RVOL alert thresholds
Non-repainting volume calculations
⚙️ Multi-Timeframe (MTF) Mode:
View daily charts with 5-min or 15-min metric updates
Perfect for monitoring positions without switching timeframes
All calculations remain accurate across timeframes
🎨 Fully Customizable:
Choose which metrics to display
9 position options for the dashboard
Adjustable text size and colors
Toggle individual metrics on/off
Sector-specific ETF mapping for accurate RS calculations
TECHNICAL SPECIFICATIONS:
✅ Non-repainting - all calculations use confirmed bar data
✅ No lookahead bias or future data
✅ Optimized for US stocks with proper sector mapping
✅ Works on any timeframe (best on 5m-Daily)
✅ Pine Script v6 with best practices
✅ Handles edge cases and missing data gracefully
IDEAL FOR:
Swing traders monitoring multiple positions
Day traders needing quick metric overview
Investors tracking relative strength and momentum
Anyone who wants institutional-grade metrics in one place
SECTOR ETF MAPPING:
Automatically maps to correct sector ETFs: XLK, XLF, XLV, XLY, XLP, XLE, XLB, XLI, XLRE, XLC, XLU
HOW TO USE:
Green = Positive/Strong | Red = Negative/Weak | White = Neutral
RS > 0 = Outperforming benchmark/sector
RVOL > 1.5x = High volume day
VWAP% negative = Price below VWAP (mean reversion opportunity)
R/ADR > 100% = Extended range (potential exhaustion)
Perfect for traders who need professional-grade analysis without chart clutter.
TAGS:
dashboard, swing, relativestrengrh, sectoranalysis, volume, rvol, multitimeframe, mtf, tradingdashboard, metrics, daytrading, swingtrading, momentum, vwap, atr, volatility, volumeanalysis

Relative Performance Indicator - TrendSpider StyleRelative Performance Indicator - TrendSpider Style
📈 Overview
This Relative Performance (RP) indicator measures how your stock is performing compared to a benchmark index, displayed as a percentile ranking from 0-100. Based on TrendSpider's methodology, it answers the critical question: "Is this stock a leader or a laggard?"
Unlike simple ratio charts, this indicator uses percentile ranking to normalize relative performance, making it easy to identify when a stock is showing exceptional strength (>80) or concerning weakness (<20) compared to its historical relationship with the benchmark.
✨ Key Features
Three Calculation Modes:
Quarterly: 3-month relative performance for swing trading
Yearly: Weighted 4-quarter performance for position trading
TechRank: Composite of 6 technical indicators for multi-factor analysis
Clean Visual Design:
Green fills above 80 (strong outperformance)
Red fills below 20 (significant underperformance)
Dotted median line at 50 for quick reference
Current value label for instant reading
Flexible Benchmarks:
Compare against major indices (SPY, QQQ, IWM)
Sector ETFs for within-sector analysis
Custom symbols for specialized comparisons
Built-in Alerts:
Strong performance zone entry (>80)
Weak performance zone entry (<20)
Median crossovers (50 level)
📊 How To Use
Buy Signals:
RP crosses above 80: Stock entering leadership status
RP holding above 60: Maintaining relative strength
RP rising while price consolidating: Accumulation phase
Sell/Avoid Signals:
RP drops below 50: Losing relative strength
RP below 20: Significant underperformance
RP falling while price rising: Bearish divergence
Sector Rotation:
Compare multiple assets to find strongest sectors
Rotate into high RP assets (>70)
Exit low RP positions (<30)
🎯 Reading The Values
80-100: Exceptional outperformance - Strong buy/hold
60-80: Moderate outperformance - Hold positions
40-60: Market perform - No edge
20-40: Underperformance - Caution/reduce
0-20: Severe underperformance - Avoid/exit
⚙️ Calculation Method
Calculates percentage performance of both your stock and the benchmark
Finds the performance differential
Ranks this differential against historical values using percentile analysis
Normalizes to 0-100 scale for easy interpretation
This percentile approach adapts to different market conditions and volatility regimes, providing consistent signals whether in trending or choppy markets.
💡 Pro Tips
For Growth Stocks: Use quarterly mode with QQQ as benchmark
For Value Stocks: Use yearly mode with SPY as benchmark
For Small Caps: Compare against IWM, not SPY
For Sector Analysis: Use sector ETFs (XLK, XLF, XLE, etc.)
Combine with Price Action: High RP + price breakout = powerful signal
⚠️ Important Notes
RP is relative, not absolute - stocks can fall with high RP if the market falls harder
Choose appropriate benchmarks for meaningful comparisons
Best used in conjunction with price action and volume analysis
Historical lookback period affects sensitivity (adjustable in settings)
🔧 Customization
Fully customizable visual settings, thresholds, calculation periods, and smoothing options. Adjust the normalization lookback period (default 252 days) to fine-tune sensitivity to your trading timeframe.
📌 Credit
Inspired by TrendSpider's Relative Performance implementation, adapted for TradingView with enhanced customization options and Pine Script v6 optimization.
Tags to include: relativeperformance, relativestrength, percentile, ranking, sectorrotation, benchmark, outperformance, trendspider, marketbreadth, strengthindicator
Category: Momentum Indicators / Trend Analysis
Feel free to modify this description to match your style or add any specific points you want to emphasize!

Gamma Exposure Levels by OMG (Oh My Gamma)OMG (Oh My Gamma) - Daily GEX Levels
An operational framework for Gamma analysis with daily data.
Indicator's Purpose & Demo Data
This indicator plots key strategic levels derived from Gamma Exposure (GEX) analysis. It showcases the operational logic of OhMyGamma analytical engine.
IMPORTANT: The levels plotted by this public script are based on a past date's snapshot for demonstration purposes. They are not valid for live trading and will not update automatically.
The real edge comes from using the fresh data structure provided daily.
How to Read the Levels
This indicator is designed to provide actionable intelligence, not just data. Here's how to read it:
The Levels: Each line represents a key strategic zone (Zero Gamma, Call/Put Walls, etc.) where a market reaction is statistically probable due to dealer hedging flows.
Line Thickness = Strategic Importance: The thickness of each line directly corresponds to its strategic rating. Thicker, solid lines represent higher-conviction zones.
Labels & Tooltips: Hover over a level's label on your chart to see its full description, confluences, and strategic rating.
Pro Tip: The Power of Confluence
This indicator is not a standalone "system". It's an institutional-grade intelligence layer. Its predictive power increases exponentially when used to find confluence with your own analysis.
The highest-probability trades occur when a key Gamma level aligns with:
Price Action: Key support/resistance zones, order blocks, or liquidity pools.
Volumetric Indicators: High/Low Volume Nodes (HVN/LVN) from Volume Profile, VWAP, and Anchored VWAP.
Use these levels to confirm your setups and gain the conviction to act.
How to Get the Daily Updated Script
This indicator requires a new Pine Script code each day to load the current session's data.
To get the daily updated code feel free to visit www.ohmygamma.com
Feedback & Suggestions
This tool is built for the community. Suggestions for improvements and new features are highly welcome and help the project evolve. Feel free to get in touch via the contact form on the website.
Disclaimer: This tool is for informational and educational purposes only. Trading involves significant risk. The authors assume no responsibility for any trading decisions.

BOCS Channel Scalper Indicator - Mean Reversion Alert System# BOCS Channel Scalper Indicator - Mean Reversion Alert System
## WHAT THIS INDICATOR DOES:
This is a mean reversion trading indicator that identifies consolidation channels through volatility analysis and generates alert signals when price enters entry zones near channel boundaries. **This indicator version is designed for manual trading with comprehensive alert functionality.** Unlike automated strategies, this tool sends notifications (via popup, email, SMS, or webhook) when trading opportunities occur, allowing you to manually review and execute trades. The system assumes price will revert to the channel mean, identifying scalp opportunities as price reaches extremes and preparing to bounce back toward center.
## INDICATOR VS STRATEGY - KEY DISTINCTION:
**This is an INDICATOR with alerts, not an automated strategy.** It does not execute trades automatically. Instead, it:
- Displays visual signals on your chart when entry conditions are met
- Sends customizable alerts to your device/email when opportunities arise
- Shows TP/SL levels for reference but does not place orders
- Requires you to manually enter and exit positions based on signals
- Works with all TradingView subscription levels (alerts included on all plans)
**For automated trading with backtesting**, use the strategy version. For manual control with notifications, use this indicator version.
## ALERT CAPABILITIES:
This indicator includes four distinct alert conditions that can be configured independently:
**1. New Channel Formation Alert**
- Triggers when a fresh BOCS channel is identified
- Message: "New BOCS channel formed - potential scalp setup ready"
- Use this to prepare for upcoming trading opportunities
**2. Long Scalp Entry Alert**
- Fires when price touches the long entry zone
- Message includes current price, calculated TP, and SL levels
- Notification example: "LONG scalp signal at 24731.75 | TP: 24743.2 | SL: 24716.5"
**3. Short Scalp Entry Alert**
- Fires when price touches the short entry zone
- Message includes current price, calculated TP, and SL levels
- Notification example: "SHORT scalp signal at 24747.50 | TP: 24735.0 | SL: 24762.75"
**4. Any Entry Signal Alert**
- Combined alert for both long and short entries
- Use this if you want a single alert stream for all opportunities
- Message: "BOCS Scalp Entry: at "
**Setting Up Alerts:**
1. Add indicator to chart and configure settings
2. Click the Alert (⏰) button in TradingView toolbar
3. Select "BOCS Channel Scalper" from condition dropdown
4. Choose desired alert type (Long, Short, Any, or Channel Formation)
5. Set "Once Per Bar Close" to avoid false signals during bar formation
6. Configure delivery method (popup, email, webhook for automation platforms)
7. Save alert - it will fire automatically when conditions are met
**Alert Message Placeholders:**
Alerts use TradingView's dynamic placeholder system:
- {{ticker}} = Symbol name (e.g., NQ1!)
- {{close}} = Current price at signal
- {{plot_1}} = Calculated take profit level
- {{plot_2}} = Calculated stop loss level
These placeholders populate automatically, creating detailed notification messages without manual configuration.
## KEY DIFFERENCE FROM ORIGINAL BOCS:
**This indicator is designed for traders seeking higher trade frequency.** The original BOCS indicator trades breakouts OUTSIDE channels, waiting for price to escape consolidation before entering. This scalper version trades mean reversion INSIDE channels, entering when price reaches channel extremes and betting on a bounce back to center. The result is significantly more trading opportunities:
- **Original BOCS**: 1-3 signals per channel (only on breakout)
- **Scalper Indicator**: 5-15+ signals per channel (every touch of entry zones)
- **Trade Style**: Mean reversion vs trend following
- **Hold Time**: Seconds to minutes vs minutes to hours
- **Best Markets**: Ranging/choppy conditions vs trending breakouts
This makes the indicator ideal for active day traders who want continuous alert opportunities within consolidation zones rather than waiting for breakout confirmation. However, increased signal frequency also means higher potential commission costs and requires disciplined trade selection when acting on alerts.
## TECHNICAL METHODOLOGY:
### Price Normalization Process:
The indicator normalizes price data to create consistent volatility measurements across different instruments and price levels. It calculates the highest high and lowest low over a user-defined lookback period (default 100 bars). Current close price is normalized using: (close - lowest_low) / (highest_high - lowest_low), producing values between 0 and 1 for standardized volatility analysis.
### Volatility Detection:
A 14-period standard deviation is applied to the normalized price series to measure price deviation from the mean. Higher standard deviation values indicate volatility expansion; lower values indicate consolidation. The indicator uses ta.highestbars() and ta.lowestbars() to identify when volatility peaks and troughs occur over the detection period (default 14 bars).
### Channel Formation Logic:
When volatility crosses from a high level to a low level (ta.crossover(upper, lower)), a consolidation phase begins. The indicator tracks the highest and lowest prices during this period, which become the channel boundaries. Minimum duration of 10+ bars is required to filter out brief volatility spikes. Channels are rendered as box objects with defined upper and lower boundaries, with colored zones indicating entry areas.
### Entry Signal Generation:
The indicator uses immediate touch-based entry logic. Entry zones are defined as a percentage from channel edges (default 20%):
- **Long Entry Zone**: Bottom 20% of channel (bottomBound + channelRange × 0.2)
- **Short Entry Zone**: Top 20% of channel (topBound - channelRange × 0.2)
Long signals trigger when candle low touches or enters the long entry zone. Short signals trigger when candle high touches or enters the short entry zone. Visual markers (arrows and labels) appear on chart, and configured alerts fire immediately.
### Cooldown Filter:
An optional cooldown period (measured in bars) prevents alert spam by enforcing minimum spacing between consecutive signals. If cooldown is set to 3 bars, no new long alert will fire until 3 bars after the previous long signal. Long and short cooldowns are tracked independently, allowing both directions to signal within the same period.
### ATR Volatility Filter:
The indicator includes a multi-timeframe ATR filter to avoid alerts during low-volatility conditions. Using request.security(), it fetches ATR values from a specified timeframe (e.g., 1-minute ATR while viewing 5-minute charts). The filter compares current ATR to a user-defined minimum threshold:
- If ATR ≥ threshold: Alerts enabled
- If ATR < threshold: No alerts fire
This prevents notifications during dead zones where mean reversion is unreliable due to insufficient price movement. The ATR status is displayed in the info table with visual confirmation (✓ or ✗).
### Take Profit Calculation:
Two TP methods are available:
**Fixed Points Mode**:
- Long TP = Entry + (TP_Ticks × syminfo.mintick)
- Short TP = Entry - (TP_Ticks × syminfo.mintick)
**Channel Percentage Mode**:
- Long TP = Entry + (ChannelRange × TP_Percent)
- Short TP = Entry - (ChannelRange × TP_Percent)
Default 50% targets the channel midline, a natural mean reversion target. These levels are displayed as visual lines with labels and included in alert messages for reference when manually placing orders.
### Stop Loss Placement:
Stop losses are calculated just outside the channel boundary by a user-defined tick offset:
- Long SL = ChannelBottom - (SL_Offset_Ticks × syminfo.mintick)
- Short SL = ChannelTop + (SL_Offset_Ticks × syminfo.mintick)
This logic assumes channel breaks invalidate the mean reversion thesis. SL levels are displayed on chart and included in alert notifications as suggested stop placement.
### Channel Breakout Management:
Channels are removed when price closes more than 10 ticks outside boundaries. This tolerance prevents premature channel deletion from minor breaks or wicks, allowing the mean reversion setup to persist through small boundary violations.
## INPUT PARAMETERS:
### Channel Settings:
- **Nested Channels**: Allow multiple overlapping channels vs single channel
- **Normalization Length**: Lookback for high/low calculation (1-500, default 100)
- **Box Detection Length**: Period for volatility detection (1-100, default 14)
### Scalping Settings:
- **Enable Long Scalps**: Toggle long alert generation on/off
- **Enable Short Scalps**: Toggle short alert generation on/off
- **Entry Zone % from Edge**: Size of entry zone (5-50%, default 20%)
- **SL Offset (Ticks)**: Distance beyond channel for stop (1+, default 5)
- **Cooldown Period (Bars)**: Minimum spacing between alerts (0 = no cooldown)
### ATR Filter:
- **Enable ATR Filter**: Toggle volatility filter on/off
- **ATR Timeframe**: Source timeframe for ATR (1, 5, 15, 60 min, etc.)
- **ATR Length**: Smoothing period (1-100, default 14)
- **Min ATR Value**: Threshold for alert enablement (0.1+, default 10.0)
### Take Profit Settings:
- **TP Method**: Choose Fixed Points or % of Channel
- **TP Fixed (Ticks)**: Static distance in ticks (1+, default 30)
- **TP % of Channel**: Dynamic target as channel percentage (10-100%, default 50%)
### Appearance:
- **Show Entry Zones**: Toggle zone labels on channels
- **Show Info Table**: Display real-time indicator status
- **Table Position**: Corner placement (Top Left/Right, Bottom Left/Right)
- **Long Color**: Customize long signal color (default: darker green for readability)
- **Short Color**: Customize short signal color (default: red)
- **TP/SL Colors**: Customize take profit and stop loss line colors
- **Line Length**: Visual length of TP/SL reference lines (5-200 bars)
## VISUAL INDICATORS:
- **Channel boxes** with semi-transparent fill showing consolidation zones
- **Colored entry zones** labeled "LONG ZONE ▲" and "SHORT ZONE ▼"
- **Entry signal arrows** below/above bars marking long/short alerts
- **TP/SL reference lines** with emoji labels (⊕ Entry, 🎯 TP, 🛑 SL)
- **Info table** showing channel status, last signal, entry/TP/SL prices, risk/reward ratio, and ATR filter status
- **Visual confirmation** when alerts fire via on-chart markers synchronized with notifications
## HOW TO USE:
### For 1-3 Minute Scalping with Alerts (NQ/ES):
- ATR Timeframe: "1" (1-minute)
- ATR Min Value: 10.0 (for NQ), adjust per instrument
- Entry Zone %: 20-25%
- TP Method: Fixed Points, 20-40 ticks
- SL Offset: 5-10 ticks
- Cooldown: 2-3 bars to reduce alert spam
- **Alert Setup**: Configure "Any Entry Signal" for combined long/short notifications
- **Execution**: When alert fires, verify chart visuals, then manually place limit order at entry zone with provided TP/SL levels
### For 5-15 Minute Day Trading with Alerts:
- ATR Timeframe: "5" or match chart
- ATR Min Value: Adjust to instrument (test 8-15 for NQ)
- Entry Zone %: 20-30%
- TP Method: % of Channel, 40-60%
- SL Offset: 5-10 ticks
- Cooldown: 3-5 bars
- **Alert Setup**: Configure separate "Long Scalp Entry" and "Short Scalp Entry" alerts if you trade directionally based on bias
- **Execution**: Review channel structure on alert, confirm ATR filter shows ✓, then enter manually
### For 30-60 Minute Swing Scalping with Alerts:
- ATR Timeframe: "15" or "30"
- ATR Min Value: Lower threshold for broader market
- Entry Zone %: 25-35%
- TP Method: % of Channel, 50-70%
- SL Offset: 10-15 ticks
- Cooldown: 5+ bars or disable
- **Alert Setup**: Use "New Channel Formation" to prepare for setups, then "Any Entry Signal" for execution alerts
- **Execution**: Larger timeframes allow more analysis time between alert and entry
### Webhook Integration for Semi-Automation:
- Configure alert webhook URL to connect with platforms like TradersPost, TradingView Paper Trading, or custom automation
- Alert message includes all necessary order parameters (direction, entry, TP, SL)
- Webhook receives structured data when signal fires
- External platform can auto-execute based on alert payload
- Still maintains manual oversight vs full strategy automation
## USAGE CONSIDERATIONS:
- **Manual Discipline Required**: Alerts provide opportunities but execution requires judgment. Not all alerts should be taken - consider market context, trend, and channel quality
- **Alert Timing**: Alerts fire on bar close by default. Ensure "Once Per Bar Close" is selected to avoid false signals during bar formation
- **Notification Delivery**: Mobile/email alerts may have 1-3 second delay. For immediate execution, use desktop popups or webhook automation
- **Cooldown Necessity**: Without cooldown, rapidly touching price action can generate excessive alerts. Start with 3-bar cooldown and adjust based on alert volume
- **ATR Filter Impact**: Enabling ATR filter dramatically reduces alert count but improves quality. Track filter status in info table to understand when you're receiving fewer alerts
- **Commission Awareness**: High alert frequency means high potential trade count. Calculate if your commission structure supports frequent scalping before acting on all alerts
## COMPATIBLE MARKETS:
Works on any instrument with price data including stock indices (NQ, ES, YM, RTY), individual stocks, forex pairs (EUR/USD, GBP/USD), cryptocurrency (BTC, ETH), and commodities. Volume-based features are not included in this indicator version. Multi-timeframe ATR requires higher-tier TradingView subscription for request.security() functionality on timeframes below chart timeframe.
## KNOWN LIMITATIONS:
- **Indicator does not execute trades** - alerts are informational only; you must manually place all orders
- **Alert delivery depends on TradingView infrastructure** - delays or failures possible during platform issues
- **No position tracking** - indicator doesn't know if you're in a trade; you must manage open positions independently
- **TP/SL levels are reference only** - you must manually set these on your broker platform; they are not live orders
- **Immediate touch entry can generate many alerts** in choppy zones without adequate cooldown
- **Channel deletion at 10-tick breaks** may be too aggressive or lenient depending on instrument tick size
- **ATR filter from lower timeframes** requires TradingView Premium/Pro+ for request.security()
- **Mean reversion logic fails** in strong breakout scenarios - alerts will fire but trades may hit stops
- **No partial closing capability** - full position management is manual; you determine scaling out
- **Alerts do not account for gaps** or overnight price changes; morning alerts may be stale
## RISK DISCLOSURE:
Trading involves substantial risk of loss. This indicator provides signals for educational and informational purposes only and does not constitute financial advice. Past performance does not guarantee future results. Mean reversion strategies can experience extended drawdowns during trending markets. Alerts are not guaranteed to be profitable and should be combined with your own analysis. Stop losses may not fill at intended levels during extreme volatility or gaps. Never trade with capital you cannot afford to lose. Consider consulting a licensed financial advisor before making trading decisions. Always verify alerts against current market conditions before executing trades manually.
## ACKNOWLEDGMENT & CREDITS:
This indicator is built upon the channel detection methodology created by **AlgoAlpha** in the "Smart Money Breakout Channels" indicator. Full credit and appreciation to AlgoAlpha for pioneering the normalized volatility approach to identifying consolidation patterns. The core channel formation logic using normalized price standard deviation is AlgoAlpha's original contribution to the TradingView community.
Enhancements to the original concept include: mean reversion entry logic (vs breakout), immediate touch-based alert generation, comprehensive alert condition system with customizable notifications, multi-timeframe ATR volatility filtering, cooldown period for alert management, dual TP methods (fixed points vs channel percentage), visual TP/SL reference lines, and real-time status monitoring table. This indicator version is specifically designed for manual traders who prefer alert-based decision making over automated execution.

Iron Condor Pro v6 – Full EngineIronCondor Engine v6.6 is a multi-mode options strategy tool for planning and managing iron condors, straddles, strangles, and butterflies. It supports both setup planning and live trade tracking with modeled delta, risk-based strike selection, IV rank estimation, and visual breach alerts.
Use Setup Mode to preview strike structures based on IV proxy, ATR, delta targeting, and risk tier (High/Mid/Low/Delta). Use Live Mode to track real trades, enter strike/premium data, and monitor live P&L, delta drift, and range status.
This script does not connect to live option chains. Volatility and delta are modeled using price history. All strikes and premiums must be confirmed using your broker before placing trades. Best used with strong support/resistance levels and high IV rank (30%+).
For educational purposes only.
Workflow Guide
Use this flow whether you're setting up on Sunday night or any day before placing a trade.
Step 0: Pre-Script Preparation
Before using the script:
Identify major support and resistance zones on your chart. Define the expected range or consolidation area. Use this context to help evaluate strike placement
1. Setup Phase (Pre-Trade Planning)
Step 1 – Load the Script
Add: IronCondor Engine v6.6 – Full Risk/Decay Edition to your chart
Step 2 – Set Mode = Setup
This enables planning mode, where the engine calculates strike combinations based on:
Your selected risk profile (High, Mid, Low, or Delta)
Historical volatility (20-day log return)
ATR (Average True Range)
Target short delta (adjustable)
Step 3 – Review Setup Table
Enable Show Setup Table to view calculated strikes and width by risk tier.
Adjust any of the following as needed:
Target Short Delta
Strike Interval ($)
Width multipliers (High/Mid/Low)
Risk tier under Auto-Feed Choice
Step 4 – Evaluate the Setup
Is the net credit at least 1.5–2.0x your max risk?
Are the short strikes clearly outside support/resistance zones?
Are the short deltas between 0.15 and 0.30?
Is the range wide enough to handle normal price movement?
Step 5 – Prep for Execution
Enable Auto-Feed Setup → Live to carry Setup strikes into Live mode
Or disable it if you prefer to manually enter strikes later
2. Trade Execution (Live Tracking Mode)
Step 1 – Place the Trade with Your Broker
Use your brokerage (TOS, Tasty, IBKR, etc.) to place the iron condor or other structure
Step 2 – Set Mode = Live
In Live mode:
If Auto-Feed is ON, the Setup strikes auto-populate
If Auto-Feed is OFF, manually enter:
Short and long strikes (Call and Put)
Premiums collected/paid per leg
Total net credit (Entry Credit)
Optional: Input current mid prices for each leg in the "Live Chain" section to track live mark-to-market P&L
Once all required fields are valid, the script activates:
Real-time profit/loss tracking
Max risk estimate
Delta monitoring on short legs
IV Rank estimate
Breach detection system
Chart visuals (if enabled)
3. Trade Management (During the Week)
While the trade is active, use the dashboard and visuals to monitor:
Key Metrics:
Unrealized P/L %
Mark-to-market value vs entry credit
Daily decay (theta)
Days until expiration
Breach status:
In Range
Near Breach
Breached
Alerts:
Price near short strike → suggests roll
Price breaches long strike → breach alert
50% or 75% profit → optional exit signal
Delta exceeds threshold → exposure may need adjustment
Management Tips:
At 50–75% profit: consider closing early
If price nears a short leg: roll, hedge, or manage
If nearing expiry: decide whether to hold or close
If IV collapses: may accelerate time decay or reduce exit value
4. End-of-Week or Expiration Management
If Profit Target Hit
Close early to reduce risk and lock gains
If Still Open Near Expiry
Close the position or
Hold through expiration only if you're fully prepared for pinning/gamma/assignment scenarios
Avoid holding open spreads over the weekend unless part of a defined strategy
Reference Notes
Strike Width
Defined as:
Width = Distance between Short and Long strike
Used for calculating max loss and breach visuals
Delta Guidelines
0.15–0.20 = safer, wider range, lower credit
0.25–0.30 = more aggressive, tighter range, higher credit
Use Target Short Delta input to adjust auto-selected strikes accordingly
Credit Example
Sell Call: $1.04
Sell Put: $0.23
Buy Call + Put wings: $0.14
Net Credit = $1.13 = $113 per contract (max profit)
This is the max profit if price stays between short strikes through expiration
IV Rank (Estimated)
This script does not use options chain IV data.
Instead, it calculates a volatility proxy:
ivRaw = ta.stdev(log returns, 20) * sqrt(252)
IV Rank is then calculated as the percentile of this value within the last 252 bars.
High IV Rank (30%–100%) → better premium-selling conditions
Low IV Rank (<30%) → lower edge for condors
Ideal to sell premium when IV Rank is above 30–50%
Disclosures and Limitations
This script is for educational use only
It does not connect to live option chains
All strikes, deltas, and premiums must be validated through your broker
Always confirm real-time IV, delta, and pricing before placing a trade

ORB 15m + MAs (v4.1)Session ORB Live Pro — Pre-Market Boxes & MA Suite (v4.1)
What it is
A precision Opening Range Breakout (ORB) tool that anchors every session to one specific 15-minute candle—then projects that same high/low onto lower timeframes so your 1m/5m levels always match the source 15m bar. Perfect for scalpers who want session structure without drift.
What it draws
Asia, Pre-London, London, Pre-New York, New York session boxes.
On 15m: only the high/low of the first 15-minute bar of each window (optionally persists for extra bars).
On 5m: mirrors the same 15m range, visible up to 10 bars.
On 1m: mirrors the same 15m range, visible up to 15 bars.
Levels update live while the 15m candle is forming, then lock.
Fully editable windows (easy UX)
Change session times with TradingView’s native input.session fields using the familiar format HHMM-HHMM:1234567. You can tweak each window independently:
Asia
Pre-London
London
Pre-New York
New York
Multi-TF logic (no guesswork)
Designed to show only on 1m, 5m, 15m (by default).
15m = ground truth. Lower timeframes never “recalculate a different range”—they mirror the 15m bar for that session, exactly.
Alerts
Optional breakout alerts when price closes above/below the session range.
Clean visuals
Per-session color controls (box + lines). Boxes extend only for the configured number of bars per timeframe, keeping charts uncluttered.
Built-in MA suite
SMA 50 and RMA 200.
Three extra MAs (SMA/EMA/RMA/WMA/HMA) with selectable color, width, and style (line, stepline, circles).
Why traders like it
Consistency: Lower-TF ranges always match the 15m source bar.
Speed: You see structure immediately—no waiting for N bars.
Control: Edit session times directly; tune how long boxes stay on chart per TF.
Clarity: Minimal, purposeful plotting with alerts when it matters.
Quick start
Set your session times via the five input.session fields.
Choose how long boxes persist on 1m/5m/15m.
Enable alerts if you want instant breakout notifications.
(Optional) Configure the MA suite for trend/bias context.
Best for
Intraday traders and scalpers who rely on repeatable session behavior and demand exact cross-TF alignment of ORB levels.

Seasonality con números RAMÓN SEGOVIAMonthly Bands – Colored Monthly Stripes for Statistical Analysis
Short Description
This indicator paints vertical background stripes by calendar month on your chart, making it easy to run statistical/seasonality analysis, compare monthly performance, and visually identify recurring patterns across assets and timeframes.
How It Works
Detects each new month and applies a background band spanning from the first to the last candle of that month.
Alternates colors automatically so consecutive months are easy to distinguish, or use a single uniform color for a clean look.
Optional: add dotted lines at the start/end of each month for precise separation.
Inputs / Settings
Color mode: alternating (odd/even months) or single.
Colors & opacity of the bands.
Border style: none / solid / dotted.
Highlight specific months: e.g., “Jan, Apr, Oct” with a different color.
Labels option: show month & year abbreviations at the top/bottom of the chart.
Drawing zone: full background vs. price-only area (to avoid covering lower indicators).
Typical Use Cases
Seasonality studies: identify historically bullish/bearish months.
Visual backtesting: segment the chart by months to evaluate strategy performance.
Context tracking: quickly locate reports, monthly closes, or economic cycles.
Compatibility
Works on all timeframes, including intraday (each band covers the full calendar month).
Lightweight and visual-only; doesn’t interfere with price or indicators.
Pro Tips
Combine with monthly returns (%) or candle counters to quantify each stripe.
Use labels when preparing clean presentations or trade journal screenshots.
Notes
This is a visual tool only, not a buy/sell signal generator.
Default settings are optimized for clarity and minimal clutter.

PongExperience PONG! The classic arcade game, now on your charts!
With this indicator, you can finally achieve your lifelong dream of beating the Markets. . . at PONG!
Pong is jam-packed with features! Such as:
2 Paddles
A moving dot
Floating numbers
The idea of a net
This indicator is solely a visualization, it serves simply as an exercise to depict what is capable through PineScript. It can be used to re-skin other indicators or data, but on its own, is not intended as a market indicator.
With that out of the way...
> PONG
The Pong indicator is a recreation of the classic arcade game Pong developed to pit the markets against the cold hard logic of a CPU player.
Given the lack of interaction that is capable, the game is not played in the typical sense, by a player and computer or 2 players.
This version of Pong uses the chart price movements to control the "Market" Paddle, and it is contrasted by a (not AI) "CPU" Paddle, which is controlled by its own set of logic.
> Market Paddle
The Market Paddle is controlled by a data source which can be input by the user.
By default (Auto Mode), the Market Paddle is controlled through a fixed length Donchian channel range, pinning the range high to 100 and range low to 0. As seen below.
This can be altered to use data from different symbols or indicators, and can optionally be smoothed using multiple types of Moving Averages.
In the chart below, you can see how the RSI indicator is imported and smoothed to control the Market Paddle.
Note: The Market Paddle follows the moving average. If not desired, simply set the "Smoothing" input to "NONE".
> CPU Paddle
In simple terms, the CPU Paddle is a handicapped Aimbot.
Its logic is, more or less, "move directly towards the ball's vertical location".
If it were allowed to have full range of the screen, it would be impossible for it to lose a point. Due to this, we must slow it down to "play fair"... as fair as that may be.
The CPU Paddle is allowed to move at a rate specified by a certain Percent of its vertical width. By default, this is set to 2%.
Each update, the CPU Paddle can advance up or down 2% of its vertical width. The directional movement is determined based on the angle of the ball, and it's current position relative to the CPU Paddle's position. Given that it is not a direct follow, it may at times seem more... "human".
When a point is scored, the CPU paddle maintains its position, similar to the original Pong game, the paddles were controlled solely by the raw output of the controllers and did not reset.
> Ball
At the start of each point, the ball begins at the center of the screen and moves in a randomly determined angle at its base speed.
The direction is determined by the player who scored the last point. The loser of the last point "serves" the ball.
Given the circumstances, serving is a gigantic advantage. So the loser serving is just another place where the Market is given an advantage.
The ball's base speed is 1, it will move 1 (horizontal) bar on each update of the script. This speed can "technically" increase to infinity over time, if given the perfect rally. This is due to the hit logic as described below.
Note: The minimum ball speed is also 1.
> Bonk Math
When the ball hits a paddle, essentially 3 outcomes can occur, each resulting in the ball's direction being changed from positive to negative.
Action A: Its angle is doubled, and its speed is doubled.
Action B: Its angle is reversed, and its speed is decreased if it is going faster than base speed.
Action C: Its angle is preserved, and its speed is preserved. "Basic Bounce"
Each paddle is segmented into 3 zones, with the higher and lower tips (20%) of the paddles producing special actions.
The central 60% of each paddle produces a basic bounce. The special actions are determined by the trajectory of the ball and location on the paddle.
> Custom Mode
As stated above, the script loads in "Auto Mode" by default. While this works fine to simply watch the gameplay, the Custom Mode unlocks the ability to visualize countless possibilities of indicators and analyses playing Pong!
In the chart below, we have set up the game to use the NYSE TICK Index as our Market Player. The NYSE TICK Index shows the number of NYSE stocks trading on an uptick minus those on a downtick. Its values fluctuate throughout the day, typically ranging between +1000 and -1000.
Therefore, we have set up Pong to use Ticker USI:TICK and set the Upper Boundary to 1000 and Lower Boundary to -1000. With this method, the paddle is directly controlled by the overall (NYSE) market behaviors.
As seen in a chart earlier, you can also take advantage of the Custom Mode to overlay Pong onto traditional oscillators for use anywhere!
> Styles
This version of Pong comes stocked with 5 colorways to suit your chart vibes!
> Pro Tips & Additional Information
- This game has sound! For the full experience, set alerts for this indicator and a notification sound will play on each hit!*
*Due to server processing, the notification sounds are not precisely played at each hit. :(
- In auto mode, decreasing the length used will give an advantage to the market, as its actions become more sporadic over this window.
- The CPU logic system actually allows the market to have a "technical" edge, since the Market Paddle is not bound to any speed, and is solely controlled by the raw market movements/data input.
- This type of visualization only works on live charts, charts without updates will not see any movement.
- Indicator sources can only be imported from other indicators on the same chart.
- The base screen resolution is 159 bars wide, with the height determined by the boundaries.
- When using a symbol and an outside source, be mindful that the script is attempting to pull the source from the input symbol. Data can appear wonky when not considering the interactions of these inputs.
There are many small interesting details that can't be seen through the description. For example, the mid-line is made from a box. This is because a line object would not appear on top of the box used for the screen. For those keen eye'd coders, feel free to poke around in the source code to make the game truly custom.
Just remember:
The market may never be fair, but now at least it can play Pong!
Enjoy!
