Multi-Timeframe VWAP DashboardMulti-Timeframe VWAP Dashboard with Advanced Customization**
Unlock the power of **Volume-Weighted Average Price (VWAP)** across multiple timeframes with this highly customizable and feature-rich Pine Script. Designed for traders who demand precision and flexibility, this script provides a **comprehensive VWAP dashboard** that adapts to your trading style and strategy. Whether you're a day trader, swing trader, or long-term investor, this tool offers unparalleled insights into market trends and price levels.
---
### **Key Features:**
1. **Multi-Timeframe VWAP Calculation:**
- Calculate VWAP across **12-minute, 48-minute, 96-minute, 192-minute, daily, weekly, monthly, and even yearly timeframes**.
- Supports **custom timeframes** for tailored analysis.
2. **Price Source Selection:**
- Choose from multiple price sources for VWAP calculation, including **Open, High, Low, Close, HL2, HLC3, HLCC4, and All**.
- Optimize VWAP for **uptrends and downtrends** by selecting the most relevant price source.
3. **Customizable Labels:**
- Add **dynamic labels** to each VWAP line for quick reference.
- Customize label **colors, sizes, and offsets** to suit your chart setup.
- Display **price values** and **session types** (e.g., "12 Min", "Daily", "Weekly") directly on the chart.
4. **Advanced Session Detection:**
- Automatically detect new sessions for **intraday, daily, weekly, monthly, and yearly timeframes**.
- Ensures accurate VWAP calculations for each session.
5. **Plot Visibility Control:**
- Toggle the visibility of individual VWAP plots to **reduce clutter** and focus on the most relevant timeframes.
- Includes options for **short-term, medium-term, and long-term VWAPs**.
6. **Comprehensive Timeframe Coverage:**
- From **12-minute intervals** to **12-month intervals**, this script covers all major timeframes.
- Perfect for traders who analyze markets across multiple horizons.
7. **User-Friendly Inputs:**
- Intuitive input options for **timeframes, colors, labels, and offsets**.
- Easily customize the script to match your trading preferences.
8. **Dynamic Label Positioning:**
- Labels adjust automatically based on price movements and session changes.
- Choose from **multiple offset options** to position labels precisely.
9. **Miscellaneous Customization:**
- Adjust **text color, label size, and price display settings**.
- Enable or disable **price values** and **session type labels** for a cleaner chart.
---
### **Why Use This Script?**
- **Versatility:** Suitable for all trading styles, including scalping, day trading, swing trading, and long-term investing.
- **Precision:** Accurate VWAP calculations across multiple timeframes ensure you never miss key price levels.
- **Customization:** Tailor the script to your specific needs with a wide range of input options.
- **Clarity:** Dynamic labels and customizable plots make it easy to interpret market trends at a glance.
---
### **How It Works:**
1. **Select Your Price Source:**
- Choose the price source (e.g., Open, Close, HL2) for VWAP calculation based on your trading strategy.
2. **Choose Timeframes:**
- Define the timeframes for VWAP calculation, from intraday to yearly intervals.
3. **Customize Labels and Plots:**
- Enable or disable labels and plots for each timeframe.
- Adjust colors, sizes, and offsets to match your chart setup.
4. **Analyze Market Trends:**
- Use the VWAP lines and labels to identify **support/resistance levels**, **trend direction**, and **potential reversal points**.
5. **Adapt to Market Conditions:**
- Switch between timeframes and price sources to adapt to changing market conditions.
---
### **Ideal For:**
- **Day Traders:** Use short-term VWAPs (e.g., 12-minute, 48-minute) to identify intraday trends and key levels.
- **Swing Traders:** Leverage medium-term VWAPs (e.g., 96-minute, daily) to spot swing opportunities.
- **Long-Term Investors:** Analyze long-term VWAPs (e.g., weekly, monthly) to gauge overall market direction.
---
### **How to Get Started:**
1. Add the script to your TradingView chart.
2. Customize the inputs to match your trading preferences.
3. Analyze the VWAP lines and labels to make informed trading decisions.
---
### **Pro Tip:**
Combine this script with other technical indicators (e.g., moving averages, RSI) for a **holistic view** of the market. Use the VWAP lines as dynamic support/resistance levels to enhance your entry and exit strategies.
This script is a must-have tool for traders who value precision, flexibility, and clarity. Share it with your audience to help them elevate their trading game. Whether they're beginners or seasoned professionals, this **Multi-Timeframe VWAP Dashboard** will become an essential part of their toolkit.
Recherche dans les scripts pour "pro"

Multi-Timeframe VWAP Master ProThe Multi-Timeframe VWAP Suite is a comprehensive and highly customizable indicator designed for traders who rely on Volume-Weighted Average Price (VWAP) across multiple timeframes and periods. This tool provides a complete suite of VWAP calculations, including daily, weekly, monthly, quarterly, yearly, and custom VWAPs, allowing traders to analyze price action and volume trends with precision. Whether you're a day trader, swing trader, or long-term investor, this indicator offers unparalleled flexibility and depth for your trading strategy.
Multi-Timeframe VWAPs:
Daily, Weekly, Monthly, Quarterly, and Yearly VWAPs: Track VWAP across various timeframes to identify key support and resistance levels.
Customizable Timeframes: Use the SMA timeframe input to adjust the period for moving averages and other calculations.
Previous Period VWAPs:
Previous Daily, Weekly, Monthly, and Quarterly VWAPs: Analyze historical VWAP levels to understand past price behavior and identify potential reversal zones.
Previous Year Quarterly VWAPs: Compare current price action to VWAP levels from specific quarters of the previous year.
Custom VWAPs:
Custom Start Date and Timeframe: Define your own VWAP periods by specifying a start date and timeframe, allowing for tailored analysis.
Dynamic Custom VWAP Calculation: Automatically calculates VWAP based on your custom inputs, ensuring flexibility for unique trading strategies.
Seasonal and Yearly VWAPs:
April, July, and October VWAPs: Analyze seasonal trends by tracking VWAP levels for specific months.
Yearly VWAP: Get a broader perspective on long-term price trends with the yearly VWAP.
SMA Integration:
SMA Overlay: Combine VWAP analysis with a Simple Moving Average (SMA) for additional confirmation of trends and reversals.
Customizable SMA Length and Timeframe: Adjust the SMA settings to match your trading style and preferences.
User-Friendly Customization:
Toggle Visibility and Labels: Easily enable or disable the display of specific VWAPs and their labels to keep your chart clean and focused.
Color Customization: Each VWAP line and label is color-coded for easy identification and can be customized to suit your preferences.
Dynamic Labeling:
Automatic Labels: Labels are dynamically placed on the last bar, providing clear and concise information about each VWAP level.
Customizable Label Text: Labels include detailed information, such as the timeframe or custom period, for quick reference.
Flexible Timeframe Detection:
Automatic Timeframe Detection: The indicator automatically detects new days, weeks, months, and quarters, ensuring accurate VWAP calculations.
Support for Intraday and Higher Timeframes: Works seamlessly on all chart timeframes, from 1-minute to monthly charts.
Previous Year Quarterly VWAPs:
Q1, Q2, Q3, Q4 VWAPs: Compare current price action to VWAP levels from specific quarters of the previous year.
User-Selectable Year: Choose the year for which you want to calculate previous quarterly VWAPs.
Persistent Monthly VWAPs:
Option to Persist Monthly VWAPs Year-Round: Keep monthly VWAP levels visible even after the month ends for ongoing analysis.
Comprehensive Analysis: Combines multiple VWAP timeframes and periods into a single tool, eliminating the need for multiple indicators.
Customizable and Flexible: Tailor the indicator to your specific trading strategy with customizable timeframes, periods, and settings.
Enhanced Decision-Making: Gain deeper insights into price action and volume trends across different timeframes, helping you make more informed trading decisions.
Clean and Organized Charts: Toggle visibility and labels to keep your chart clutter-free while still accessing all the information you need.
Ideal For:
Day Traders: Use daily and intraday VWAPs to identify intraday support and resistance levels.
Swing Traders: Analyze weekly and monthly VWAPs to spot medium-term trends and reversals.
Long-Term Investors: Leverage quarterly and yearly VWAPs to understand long-term price behavior and key levels.
Seasonal Traders: Track April, July, and October VWAPs to capitalize on seasonal trends.
The Multi-Timeframe VWAP Suite is a powerful and versatile tool for traders of all styles and timeframes. With its comprehensive suite of VWAP calculations, customizable settings, and user-friendly design, it provides everything you need to analyze price action and volume trends with precision and confidence. Whether you're looking to fine-tune your intraday strategy or gain a broader perspective on long-term trends, this indicator has you covered.

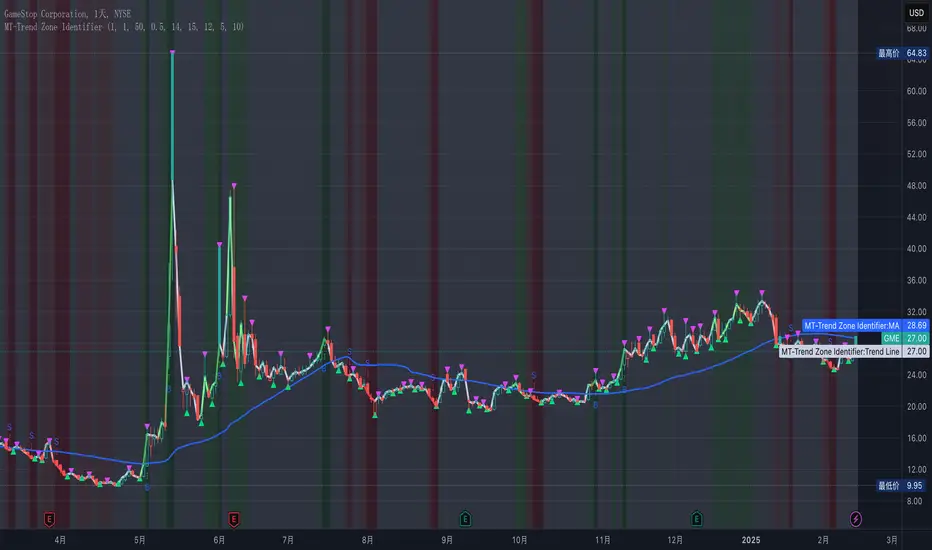
MT-Trend Zone IdentifierTrend Zone Identifier – A Dynamic Market Trend Mapping Tool
Overview
The Trend Zone Identifier is an advanced TradingView indicator that helps traders visualize different market trend phases. By leveraging Pivot Points, Moving Averages (MA), ADX (Average Directional Index), and Retest Confirmation, this tool identifies uptrend, downtrend, and ranging (sideways) conditions dynamically.
This indicator is designed to segment the market into clear trend zones, allowing traders to distinguish between confirmed trends, trend transitions (pending zones), and ranging markets. It provides an intuitive visual overlay to enhance market structure analysis and assist in decision-making.
Key Features
✔ Trend Zone Identification – Classifies price action into Uptrend (Green), Downtrend (Red), Pending Confirmation (Light Colors), and Sideways Market (Gray/Neutral)
✔ Pivot-Based Breakout & Breakdown Detection – Uses pivot highs/lows to determine trend shifts
✔ Moving Average & ADX Validation – Ensures the trend is backed by MA structure and ADX trend strength
✔ Pullback Confirmation – Allows trend confirmation based on price retesting key levels
✔ Extreme Volatility & Gaps Filtering – Optional ATR-based extreme movement filtering to avoid false signals
✔ Multi-Timeframe Support – Option to integrate higher timeframe trend validation
✔ Customizable Sensitivity – Fine-tune MA smoothing, ADX thresholds, pivot detection, and pullback range
How It Works
1. Trend Classification
• Uptrend (Green): Price is above a key MA, ADX confirms strength, and a pivot breakout occurs
• Downtrend (Red): Price is below a key MA, ADX confirms strength, and a pivot breakdown occurs
• Pending Trend (Light Colors): Initial trend breakout or breakdown is detected but requires further confirmation
• Sideways/Ranging (Gray): ADX signals a weak trend, and price remains within a neutral zone
2. Retest & Confirmation Logic
• A trend is only confirmed after a breakout or breakdown followed by a successful retest
• If the market fails the retest, the indicator resets to a neutral state
3. Custom Filters for Optimization
• Enable or disable volume filtering for confirmation
• Adjust pivot sensitivity to detect major or minor swing points
• Choose to require consecutive bars confirming the breakout/breakdown
Ideal Use Cases
🔹 Swing traders who want to capture trend transitions early
🔹 Trend-following traders who rely on confirmed market cycles
🔹 Range traders looking to identify sideways market zones
🔹 Algorithmic traders who need clean trend segmentation for automated strategies
Final Thoughts
The Trend Zone Identifier is a versatile market structure indicator that helps traders define trend cycles visually and avoid trading against weak trends. By providing clear breakout, breakdown, and retest conditions, it enhances market clarity and reduces decision-making errors.
➡ Add this to your TradingView workspace and start analyzing market trends like a pro! 🚀
EMA/SMA Ribbon Pro (AUTO HTF + Labels)This indicator is a multi-timeframe (MTF) moving average ribbon that dynamically adjusts to the next highest timeframe. It provides a visual representation of market trends by stacking multiple EMAs and SMAs with customizable color fills and labels.
Features
✅ Multi-Timeframe (MTF) Support: Automatically detects the next highest time frame or allows for manual selection
✅ Customizable Moving Averages: Supports EMA and SMA with different lengths for flexible configuration
✅ Ribbon Visualization: Smooth color transitions between different moving averages for better trend identification
✅ Crossover Labels: Detects bullish and bearish EMA/SMA crossovers and marks them on the chart
✅ Price Labels & Timeframe Display: Displays moving average values to the right of the price axis with customizable label padding and colors
How It Works
Select the HTF mode: Manual or automatic
Choose EMA/SMA lengths to create different ribbons
Enable/disable price labels for each moving average
Customize colors and transparency for ribbons and labels
Crossover labels appear when faster moving averages cross slower ones and vice versa
Use Cases
📌 Trend Identification: Identify bullish and bearish trends using multiple EMAs and SMAs
📌 Support & Resistance Zones: MAs can act as dynamic support and resistance levels
📌 Reversal & Confirmation Signals: Watch for MTF crossovers to confirm trend changes
Customization
🔹 Standard EMA Lengths: 6, 8, 13, 21, 34, 48, 100, 200, 300, 400
🔹 SMA Lengths: 48, 100, 200
🔹 Color Adjustments: Set custom colors for bullish/bearish ribbons
🔹 Crossovers: Enable/disable custom crossover pairs (e.g., 100/200 EMA, 200 EMA/SMA).
This indicator is perfect for traders who rely on multi-timeframe confluence while seeking to enhance their market analysis and decision-making process.
As always, by combining EMA/SMA Ribbon with other tools, traders ensure that they are not relying on a single indicator. This layered approach can reduce the likelihood of false signals and improve overall trading accuracy.
As always, be sure to use any indicator with price action and volume indicators for better trade confirmation!

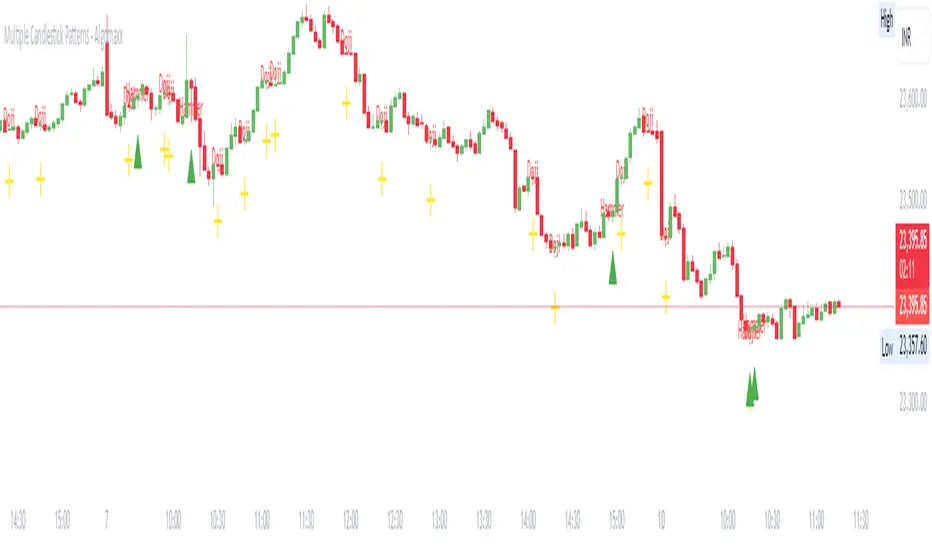
Multiple Candlestick Patterns - AlgomaxxA comprehensive candlestick pattern detection indicator that identifies seven major Japanese candlestick patterns in real-time. This indicator helps traders identify potential reversal and continuation patterns with customizable visual alerts and labels.
Features
Detects 7 major candlestick patterns:
Doji
Hammer
Shooting Star
Bullish Engulfing
Bearish Engulfing
Morning Star
Evening Star
Color-coded candlesticks for easy pattern identification
Customizable pattern indicators above/below candles
Optional pattern labels with adjustable position
Alert conditions for each pattern
Grouped settings for easy customization
Settings
General Settings
Lookback Period: Number of candles to analyze (default: 20)
Body Size Threshold: Minimum relative size for candle body (default: 0.6)
Pattern Settings
Toggle visibility for each pattern type:
Doji Pattern
Hammer Pattern
Shooting Star Pattern
Bullish Engulfing Pattern
Bearish Engulfing Pattern
Morning Star Pattern
Evening Star Pattern
Label Settings
Show Labels: Toggle pattern labels on/off
Label Text Color: Customize label color
Label Position: Choose between Left/Center/Right alignment
Label Offset: Adjust distance of labels from candles
Pattern Descriptions
Doji: Shows indecision when open and close prices are very close
Yellow color
Cross symbol below candle
Hammer: Potential bullish reversal with long lower shadow
Green color
Triangle up symbol below candle
Shooting Star: Potential bearish reversal with long upper shadow
Red color
Triangle down symbol above candle
Bullish Engulfing: Bullish reversal pattern where current green candle completely engulfs previous red candle
Light green color
Triangle up symbol below candle
Bearish Engulfing: Bearish reversal pattern where current red candle completely engulfs previous green candle
Light red color
Triangle down symbol above candle
Morning Star: Three-candle bullish reversal pattern
Seafoam green color
Triangle up symbol below candle
Evening Star: Three-candle bearish reversal pattern
Pink red color
Triangle down symbol above candle
How to Use
Add the indicator to your chart
Customize the settings based on your preferences:
Enable/disable specific patterns you want to monitor
Adjust label settings for better visibility
Set up alerts for patterns you want to be notified about
Pattern Recognition:
Watch for color changes in candlesticks indicating pattern formation
Look for shape indicators above/below candles
Read pattern labels for quick pattern identification
Trading Suggestions:
Use in conjunction with other technical indicators
Consider overall trend and support/resistance levels
Confirm patterns with volume and price action
Wait for pattern completion before making trading decisions
Tips
Patterns work best when used with multiple timeframes
Combine with trend lines and support/resistance levels
Use volume to confirm pattern strength
Consider market context and overall trend
Larger timeframes typically produce more reliable signals
Use alerts to avoid missing important pattern formations
Disclaimer
This indicator is for informational and educational purposes only. No guarantee is made regarding the accuracy of pattern detection or potential future price movements. Always use proper risk management and consider multiple factors before making trading decisions.
BullDozz Fibo ZigZagFibo ZigZag - Advanced Fibonacci Retracement Tool 🔥
📌 Overview
The Fibo ZigZag indicator is a powerful tool for trend structure analysis using the ZigZag pattern and Fibonacci retracement levels. It automatically identifies swing highs & lows, draws ZigZag lines, and overlays Fibonacci levels with price labels at the right end for better readability.
This indicator is designed for traders who use price action, trend reversal strategies, and support/resistance analysis.
🛠 Features
✅ Automatic ZigZag detection with customizable depth, deviation, and backstep
✅ Fibonacci retracement levels (0%, 23.6%, 38.2%, 50%, 61.8%, 100%, 161.8%, 261.8%, 423.6%)
✅ Price labels at Fibonacci levels (placed at the right end of the levels)
✅ Alerts for new swing highs & lows
✅ Customizable line colors, text colors, and label sizes
✅ Lightweight and optimized for fast performance
📊 How It Works
1️⃣ The script detects ZigZag structure points based on price swings
2️⃣ It connects recent highs & lows with a ZigZag line
3️⃣ Fibonacci retracement levels are calculated and drawn between the last two significant swing points
4️⃣ Each Fibo level is labeled with its percentage & exact price, placed at the right end for clarity
5️⃣ Alerts trigger automatically when a new swing high or low is detected
⚙ Customization Options
🔹 ZigZag Settings: Adjust Depth, Deviation, BackStep, and Leg length
🔹 Fibonacci Levels: Modify line colors, label text colors, and visibility
🔹 Alerts: Enable/disable trend change alerts
📈 Best Use Cases
🚀 Identifying Trend Reversals – Detect key turning points using Fibonacci levels
📉 Support & Resistance Trading – Use retracement levels as entry/exit points
📊 Swing Trading & Scalping – Combine ZigZag with price action for effective strategies
🔔 Alert-Based Trading – Get notified when new swing highs/lows form
🚀 How to Use
📌 Add the indicator to your chart
📌 Adjust the settings to match your trading strategy
📌 Use the Fibonacci levels & ZigZag lines to analyze trend direction & key price zones
📌 Wait for alerts or manually enter trades based on price reaction to Fibo levels
📢 Final Thoughts
The Fibo ZigZag is an essential tool for traders who rely on price action, trend reversals, and Fibonacci levels. Whether you're a beginner or a pro, this indicator helps you spot high-probability trading opportunities with ease.
⚡ Try it now & enhance your trading strategy! 🚀
💬 Let us know your feedback & suggestions in the comments! Happy trading! 📊🔥

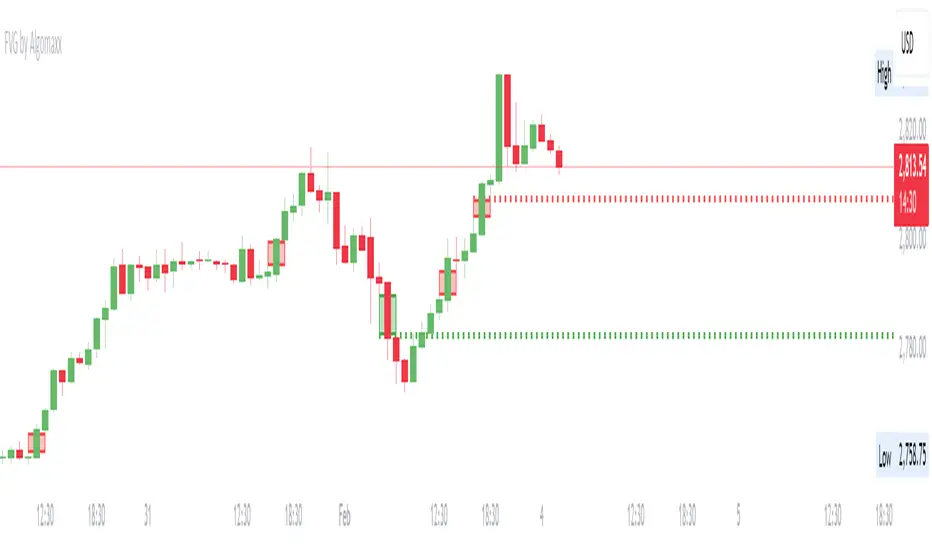
Fair Value Gap (FVG) by AlgoMaxxFair Value Gap (FVG) by AlgoMaxx
Advanced Fair Value Gap (FVG) detector with dynamic support/resistance lines. This professional-grade tool helps traders identify and track important market inefficiencies through Fair Value Gaps.
Features:
• Auto-detection of bullish and bearish FVGs
• Dynamic dotted extension lines for latest FVGs
• Smart gap filtering system
• Color-coded visualization
• Customizable parameters
• Clean, optimized code
Key Functions:
• Detects imbalance zones between candlesticks
• Marks FVGs with color-coded boxes
• Extends dotted lines for active reference levels
• Automatically updates with new gap formations
• Tracks gap fills in real-time
Inputs:
• Lookback Period: Historical gaps to display
• Minimum Gap Size %: Filter for gap significance
• Bullish/Bearish Colors: Visual customization
• Show Filled Gaps: Toggle filled gap visibility
Practical Applications:
1. Support/Resistance Levels
2. Mean Reversion Trading
3. Trend Continuation Setups
4. Market Structure Analysis
5. Price Action Trading
Usage Tips:
• Higher timeframes (1H+) provide more reliable signals
• Multiple FVGs in one zone indicate stronger levels
• Use in conjunction with other technical tools
• Monitor price reactions at FVG levels
• Consider gaps as zones rather than exact prices
Note: This is a premium-grade indicator designed for serious traders. Works best on higher timeframes where price inefficiencies are more significant.
═══════════════════
By Algomaxx
Version: 1.0
═══════════════════
Disclaimer:
This indicator is for informational purposes only. Trade at your own risk and always use proper risk management.
#FVG #technical #trading #algomaxx #premium
Gold Pro StrategyHere’s the strategy description in a chat format:
---
**Gold (XAU/USD) Trend-Following Strategy**
This **trend-following strategy** is designed for trading gold (XAU/USD) by combining moving averages, MACD momentum indicators, and RSI filters to capture sustained trends while managing volatility risks. The strategy uses volatility-adjusted stops to protect gains and prevent overexposure during erratic price movements. The aim is to take advantage of trending markets by confirming momentum and ensuring entries are not made at extreme levels.
---
**Key Components**
1. **Trend Identification**
- **50 vs 200 EMA Crossover**
- **Bullish Trend:** 50 EMA crosses above 200 EMA, and the price closes above the 200 EMA
- **Bearish Trend:** 50 EMA crosses below 200 EMA, and the price closes below the 200 EMA
2. **Momentum Confirmation**
- **MACD (12,26,9)**
- **Buy Signal:** MACD line crosses above the signal line
- **Sell Signal:** MACD line crosses below the signal line
- **RSI (14 Period)**
- **Bullish Zone:** RSI between 50-70 to avoid overbought conditions
- **Bearish Zone:** RSI between 30-50 to avoid oversold conditions
3. **Entry Criteria**
- **Long Entry:** Bullish trend, MACD bullish crossover, and RSI between 50-70
- **Short Entry:** Bearish trend, MACD bearish crossover, and RSI between 30-50
4. **Exit & Risk Management**
- **ATR Trailing Stops (14 Period):**
- Initial Stop: 3x ATR from entry price
- Trailing Stop: Adjusts to lock in profits as price moves favorably
- **Position Sizing:** 100% of equity per trade (high-risk strategy)
---
**Key Logic Flow**
1. **Trend Filter:** Use the 50/200 EMA relationship to define the market's direction
2. **Momentum Confirmation:** Confirm trend momentum with MACD crossovers
3. **RSI Validation:** Ensure RSI is within non-extreme ranges before entering trades
4. **Volatility-Based Risk Management:** Use ATR stops to manage market volatility
---
**Visual Cues**
- **Blue Line:** 50 EMA
- **Red Line:** 200 EMA
- **Green Triangles:** Long entry signals
- **Red Triangles:** Short entry signals
---
**Strengths**
- **Clear Trend Focus:** Avoids counter-trend trades
- **RSI Filter:** Prevents entering overbought or oversold conditions
- **ATR Stops:** Adapts to gold’s inherent volatility
- **Simple Rules:** Easy to follow with minimal inputs
---
**Weaknesses & Risks**
- **Infrequent Signals:** 50/200 EMA crossovers are rare
- **Potential Missed Opportunities:** Strict RSI criteria may miss some valid trends
- **Aggressive Position Sizing:** 100% equity allocation can lead to large drawdowns
- **No Profit Targets:** Relies on trailing stops rather than defined exit targets
---
**Performance Profile**
| Metric | Expected Range |
|----------------------|---------------------|
| Annual Trades | 4-8 |
| Win Rate | 55-65% |
| Max Drawdown | 25-35% |
| Profit Factor | 1.8-2.5 |
---
**Optimization Recommendations**
1. **Increase Trade Frequency**
Adjust the EMAs to shorter periods:
- `emaFastLen = input.int(30, "Fast EMA")`
- `emaSlowLen = input.int(150, "Slow EMA")`
2. **Relax RSI Filters**
Adjust the RSI range to:
- `rsiBullish = rsi > 45 and rsi < 75`
- `rsiBearish = rsi < 55 and rsi > 25`
3. **Add Profit Targets**
Introduce a profit target at 1.5% above entry:
```pine
strategy.exit("Long Exit", "Long",
stop=longStopPrice,
profit=close*1.015, // 1.5% target
trail_offset=trailOffset)
```
4. **Reduce Position Sizing**
Risk a smaller percentage per trade:
- `default_qty_value=25`
---
**Best Use Case**
This strategy excels in **strong trending markets** such as gold rallies during economic or geopolitical crises. However, during sideways or choppy market conditions, the strategy might require manual intervention to avoid false signals. Additionally, integrating fundamental analysis—like monitoring USD weakness or geopolitical risks—can enhance its effectiveness.
---
This strategy offers a balanced approach for trading gold, combining trend-following principles with risk management tailored to the volatility of the market.

Johnny's Machine Learning Moving Average (MLMA) w/ Trend Alerts📖 Overview
Johnny's Machine Learning Moving Average (MLMA) w/ Trend Alerts is a powerful adaptive moving average indicator designed to capture market trends dynamically. Unlike traditional moving averages (e.g., SMA, EMA, WMA), this indicator incorporates volatility-based trend detection, Bollinger Bands, ADX, and RSI, offering a comprehensive view of market conditions.
The MLMA is "machine learning-inspired" because it adapts dynamically to market conditions using ATR-based windowing and integrates multiple trend strength indicators (ADX, RSI, and volatility bands) to provide an intelligent moving average calculation that learns from recent price action rather than being static.
🛠 How It Works
1️⃣ Adaptive Moving Average Selection
The MLMA automatically selects one of four different moving averages:
📊 EMA (Exponential Moving Average) – Reacts quickly to price changes.
🔵 HMA (Hull Moving Average) – Smooth and fast, reducing lag.
🟡 WMA (Weighted Moving Average) – Gives recent prices more importance.
🔴 VWAP (Volume Weighted Average Price) – Accounts for volume impact.
The user can select which moving average type to use, making the indicator customizable based on their strategy.
2️⃣ Dynamic Trend Detection
ATR-Based Adaptive Window 📏
The Average True Range (ATR) determines the window size dynamically.
When volatility is high, the moving average window expands, making the MLMA more stable.
When volatility is low, the window shrinks, making the MLMA more responsive.
Trend Strength Filters 📊
ADX (Average Directional Index) > 25 → Indicates a strong trend.
RSI (Relative Strength Index) > 70 or < 30 → Identifies overbought/oversold conditions.
Price Position Relative to Upper/Lower Bands → Determines bullish vs. bearish momentum.
3️⃣ Volatility Bands & Dynamic Support/Resistance
Bollinger Bands (BB) 📉
Uses standard deviation-based bands around the MLMA to detect overbought and oversold zones.
Upper Band = Resistance, Lower Band = Support.
Helps traders identify breakout potential.
Adaptive Trend Bands 🔵🔴
The MLMA has built-in trend envelopes.
When price breaks the upper band, bullish momentum is confirmed.
When price breaks the lower band, bearish momentum is confirmed.
4️⃣ Visual Enhancements
Dynamic Gradient Fills 🌈
The trend strength (ADX-based) determines the gradient intensity.
Stronger trends = More vivid colors.
Weaker trends = Lighter colors.
Trend Reversal Arrows 🔄
🔼 Green Up Arrow: Bullish reversal signal.
🔽 Red Down Arrow: Bearish reversal signal.
Trend Table Overlay 🖥
Displays ADX, RSI, and Trend State dynamically on the chart.
📢 Trading Signals & How to Use It
1️⃣ Bullish Signals 📈
✅ Conditions for a Long (Buy) Trade:
The MLMA crosses above the lower band.
The ADX is above 25 (confirming trend strength).
RSI is above 55, indicating positive momentum.
Green trend reversal arrow appears (confirmation of a bullish reversal).
🔹 How to Trade It:
Enter a long trade when the MLMA turns bullish.
Set stop-loss below the lower Bollinger Band.
Target previous resistance levels or use the upper band as take-profit.
2️⃣ Bearish Signals 📉
✅ Conditions for a Short (Sell) Trade:
The MLMA crosses below the upper band.
The ADX is above 25 (confirming trend strength).
RSI is below 45, indicating bearish pressure.
Red trend reversal arrow appears (confirmation of a bearish reversal).
🔹 How to Trade It:
Enter a short trade when the MLMA turns bearish.
Set stop-loss above the upper Bollinger Band.
Target the lower band as take-profit.
💡 What Makes This a Machine Learning Moving Average?
📍 1️⃣ Adaptive & Self-Tuning
Unlike static moving averages that rely on fixed parameters, this MLMA automatically adjusts its sensitivity to market conditions using:
ATR-based dynamic windowing 📏 (Expands/contracts based on volatility).
Adaptive smoothing using EMA, HMA, WMA, or VWAP 📊.
Multi-indicator confirmation (ADX, RSI, Volatility Bands) 🏆.
📍 2️⃣ Intelligent Trend Confirmation
The MLMA "learns" from recent price movements instead of blindly following a fixed-length average.
It incorporates ADX & RSI trend filtering to reduce noise & false signals.
📍 3️⃣ Dynamic Color-Coding for Trend Strength
Strong trends trigger more vivid colors, mimicking confidence levels in machine learning models.
Weaker trends appear faded, suggesting uncertainty.
🎯 Why Use the MLMA?
✅ Pros
✔ Combines multiple trend indicators (MA, ADX, RSI, BB).
✔ Automatically adjusts to market conditions.
✔ Filters out weak trends, making it more reliable.
✔ Visually intuitive (gradient colors & reversal arrows).
✔ Works across all timeframes and assets.
⚠️ Cons
❌ Not a standalone strategy → Best used with volume confirmation or candlestick analysis.
❌ Can lag slightly in fast-moving markets (due to smoothing).

Percent Change HistogramThis indicator shows you percent changes in a super visual way using a color-coded histogram.
Here's how the colors work:
🟩 Dark green = percent change is growing stronger
🟢 Light green = still positive but losing steam
🟥 Dark red = getting more negative
🔴 Light red = negative but improving
The cool part? You can set any lookback period you want. For example:
24 periods on 1H chart = last 24 hours
30 periods on daily = last month
7 periods on daily = last week
Pro tip: You're not locked to your chart's timeframe! Want to see monthly changes while trading on 5min?
No problem.
You can even stack multiple indicators to watch different intervals simultaneously (daily, weekly, monthly) - super helpful for multi-timeframe analysis.
Perfect for spotting momentum shifts across different timeframes without switching between charts.

PlanDeFi: Adaptive Trend Ribbons [ATR+RSI]#### **Overview**
The **Crypto Half-Trend Pro ** is a trend-following indicator designed to identify bullish and bearish market conditions using a combination of **moving averages, volatility adjustments, and dynamic ATR bands**. This enhanced version improves on the traditional Half-Trend system by incorporating **EMA smoothing, volatility-based adjustments, and additional fakeout/reversal detection mechanisms**.
#### **Key Features**
✅ **Trend Detection:**
- Uses a combination of fast and slow moving averages (EMA/SMA) to determine trend direction.
- Implements **Hull Moving Average (HMA)** smoothing for better trend visualization.
✅ **Dynamic ATR Bands:**
- Adjusts bands based on market volatility using **RSI-based ATR multipliers**.
- Helps identify potential **breakouts and trend reversals**.
✅ **Fakeout & Reversal Detection:**
- Detects potential **fake breakouts** by analyzing price action against extended ATR bands.
- Identifies **early reversal signals** using price crossovers and volume confirmation.
✅ **Customizable Alerts & Visuals:**
- Built-in **buy & sell signals** for trend confirmation.
- Color-coded bullish/bearish trend lines and **fakeout warnings**.
- **TradingView alerts** for trend shifts and reversals.
#### **How It Works**
🔹 The indicator calculates a **smoothed trend line** using a Hull Moving Average on dynamic price levels.
🔹 ATR bands expand/contract dynamically based on **market volatility** to improve signal accuracy.
🔹 Trend direction is confirmed when price crosses the trend line **with volume confirmation**.
🔹 **Fakeouts** are detected when price temporarily exceeds extended bands but fails to hold momentum.
🔹 **Reversal signals** are generated when price breaks back into the ATR zone with volume spikes.
#### **How to Use It**
- 📈 **Buy Signal:** When price breaks above the trend line, confirmed by volume and crossover signals.
- 📉 **Sell Signal:** When price breaks below the trend line with confirmed bearish conditions.
- 🚨 **Reversal Warning:** If price sharply re-enters the ATR zone with volume confirmation, expect a potential trend shift.
- 🛑 **Fakeout Alert:** If price temporarily breaks resistance but closes back inside, it may be a false move.
#### **Ideal For**
✔️ Crypto & Forex traders looking for **dynamic trend signals**
✔️ Swing traders wanting to **avoid fakeouts & catch reversals**
✔️ Traders seeking a **customizable, volatility-adjusted trend system**
🚀 **Try PlanDeFi: Adaptive Trend Ribbons today and improve your trend analysis!**

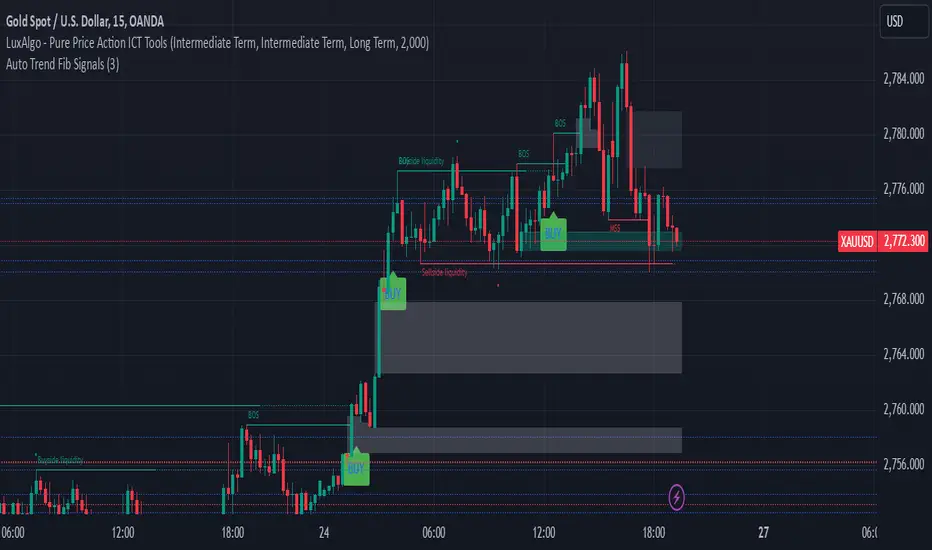
Auto Trend Fib Signals BY studio DivinKey Features
Dynamic SL using ATR volatility measure
Two-Tier Profit Taking for partial/full exits
Automatic Level Calculation based on Fibonacci extensions
Clear Visual Labels with exact price levels
Consistent Risk Management (1.5-2% per trade)
Optimization Table
Parameter Scalping Day Trading Swing Trading
ATR Multiplier 1.0 1.5 2.0
TP1 (1.272) 70% Position 50% Position 30% Position
TP2 (1.618) 30% Position 50% Position 70% Position
Time Frame 15-min 1-hour 4-hour
Pro Tips
Confirm with Volume: Increase volume at Fib levels improves signal reliability
Adjust in Ranging Markets: Use tighter SL (1.0x ATR) during consolidation
Trailing Stop: Move SL to breakeven at TP1 hit
Session Timing: Trade during London/NY overlap for best volatility
Adaptive Fourier Transform Supertrend [QuantAlgo]Discover a brand new way to analyze trend with Adaptive Fourier Transform Supertrend by QuantAlgo , an innovative technical indicator that combines the power of Fourier analysis with dynamic Supertrend methodology. In essence, it utilizes the frequency domain mathematics and the adaptive volatility control technique to transform complex wave patterns into clear and high probability signals—ideal for both sophisticated traders seeking mathematical precision and investors who appreciate robust trend confirmation!
🟢 Core Architecture
At its core, this indicator employs an adaptive Fourier Transform framework with dynamic volatility-controlled Supertrend bands. It utilizes multiple harmonic components that let you fine-tune how market frequencies influence trend detection. By combining wave analysis with adaptive volatility bands, the indicator creates a sophisticated yet clear framework for trend identification that dynamically adjusts to changing market conditions.
🟢 Technical Foundation
The indicator builds on three innovative components:
Fourier Wave Analysis: Decomposes price action into primary and harmonic components for precise trend detection
Adaptive Volatility Control: Dynamically adjusts Supertrend bands using combined ATR and standard deviation
Harmonic Integration: Merges multiple frequency components with decreasing weights for comprehensive trend analysis
🟢 Key Features & Signals
The Adaptive Fourier Transform Supertrend transforms complex wave calculations into clear visual signals with:
Dynamic trend bands that adapt to market volatility
Sophisticated cloud-fill visualization system
Strategic L/S markers at key trend reversals
Customizable bar coloring based on trend direction
Comprehensive alert system for trend shifts
🟢 Practical Usage Tips
Here's how you can get the most out of the Adaptive Fourier Transform Supertrend :
1/ Setup:
Add the indicator to your favorites, then apply it to your chart ⭐️
Start with close price as your base source
Use standard Fourier period (14) for balanced wave detection
Begin with default harmonic weight (0.5) for balanced sensitivity
Start with standard Supertrend multiplier (2.0) for reliable band width
2/ Signal Interpretation:
Monitor trend band crossovers for potential signals
Watch for convergence of price with Fourier trend
Use L/S markers for trade entry points
Monitor bar colors for trend confirmation
Configure alerts for significant trend reversals
🟢 Pro Tips
Fine-tune Fourier parameters for optimal sensitivity:
→ Lower Base Period (8-12) for more reactive analysis
→ Higher Base Period (15-30) to filter out noise
→ Adjust Harmonic Weight (0.3-0.7) to control shorter trend influence
Customize Supertrend settings:
→ Lower multiplier (1.5-2.0) for tighter bands
→ Higher multiplier (2.0-3.0) for wider bands
→ Adjust ATR length based on market volatility
Strategy Enhancement:
→ Compare signals across multiple timeframes
→ Combine with volume analysis
→ Use with support/resistance levels
→ Integrate with other momentum indicators

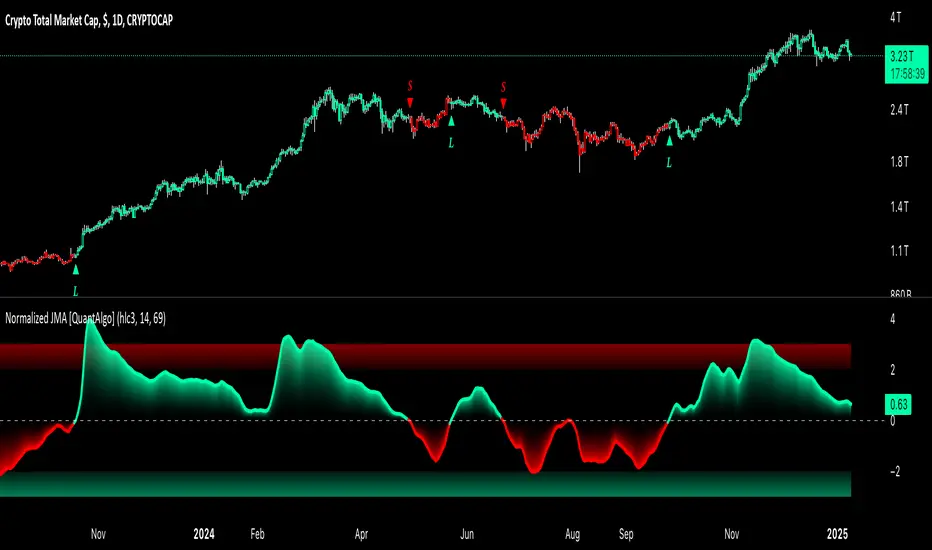
Normalized Jurik Moving Average [QuantAlgo]Upgrade your investing and trading strategy with the Normalized Jurik Moving Average (JMA) , a sophisticated oscillator that combines adaptive smoothing with statistical normalization to deliver high-quality signals! Whether you're a swing trader looking for momentum shifts or a medium- to long-term investor focusing on trend validation, this indicator's statistical approach offers valuable analytical advantages that can enhance your trading and investing decisions!
🟢 Core Architecture
The foundation of this indicator lies in its unique dual-layer calculation system. The first layer implements the Jurik Moving Average, known for its superior noise reduction and responsiveness, while the second layer applies statistical normalization (Z-Score) to create standardized readings. This sophisticated approach helps identify significant price movements while filtering out market noise across various timeframes and instruments.
🟢 Technical Foundation
Three key components power this indicator are:
Jurik Moving Average (JMA): An advanced moving average calculation that provides superior smoothing with minimal lag
Statistical Normalization: Z-Score based scaling that creates consistent, comparable readings across different market conditions
Dynamic Zone Detection: Automatically identifies overbought and oversold conditions based on statistical deviations
🟢 Key Features & Signals
The Normalized JMA delivers market insights through:
Color-adaptive oscillator line that reflects momentum strength and direction
Statistically significant overbought/oversold zones for trade validation
Smart gradient fills between signal line and zero level for enhanced visualization
Clear long (L) and short (S) markers for validated momentum shifts
Intelligent bar coloring that highlights the current market state
Customizable alert system for both bullish and bearish setups
🟢 Practical Usage Tips
Here's how to maximize your use of the Normalized JMA:
1/ Setup:
Add the indicator to your favorites, then apply it to your chart ⭐️
Begin with the default smoothing period for balanced analysis
Use the default normalization period for optimal signal generation
Start with standard visualization settings
Customize colors to match your chart preferences
Enable both bar coloring and signal markers for complete visual feedback
2/ Reading Signals:
Watch for L/S markers - they indicate validated momentum shifts
Monitor oscillator line color changes for direction confirmation
Use the built-in alert system to stay informed of potential trend changes
🟢 Pro Tips
Adjust Smoothing Period based on your trading style:
→ Lower values (8-12) for more responsive signals
→ Higher values (20-30) for more stable trend identification
Fine-tune Normalization Period based on market conditions:
→ Shorter periods (20-25) for more dynamic markets
→ Longer periods (40-50) for more stable markets
Optimize your analysis by:
→ Using +2/-2 zones for primary trade signals
→ Using +3/-3 zones for extreme market conditions
→ Combining with volume analysis for trade confirmation
→ Using multiple timeframe analysis for strategic context
Combine with:
→ Volume indicators for trade validation
→ Price action for entry timing
→ Support/resistance levels for profit targets
→ Trend-following indicators for directional bias
Volume Trend Analysis ProKey Features of Volume Analysis Script
1. Volume Threshold Detection
Identifies significant volume spikes
Compares current volume against 20-period moving average
Configurable sensitivity for precise signal generation
2. Trend Confirmation Mechanisms
Uses short and long-term moving averages
Validates volume signals with price action
Reduces false positive trading signals
3. Advanced Visualization
Color-coded volume bars
Triangular buy/sell signal markers
Clear visual representation of volume dynamics
4. Risk Management Components
Customizable volume threshold
Deviation sensitivity adjustment
Built-in alert conditions for real-time monitoring

EMA Crossover Strategy with Take Profit and Candle HighlightingStrategy Overview:
This strategy is based on the Exponential Moving Averages (EMA), specifically the EMA 20 and EMA 50. It takes advantage of EMA crossovers to identify potential trend reversals and uses multiple take-profit levels and a stop-loss for risk management.
Key Components:
EMA Crossover Signals:
Buy Signal (Uptrend): A buy signal is generated when the EMA 20 crosses above the EMA 50, signaling the start of a potential uptrend.
Sell Signal (Downtrend): A sell signal is generated when the EMA 20 crosses below the EMA 50, signaling the start of a potential downtrend.
Take Profit Levels:
Once a buy or sell signal is triggered, the strategy calculates multiple take-profit levels based on the range of the previous candle. The user can define multipliers for each take-profit level.
Take Profit 1 (TP1): 50% of the previous candle's range above or below the entry price.
Take Profit 2 (TP2): 100% of the previous candle's range above or below the entry price.
Take Profit 3 (TP3): 150% of the previous candle's range above or below the entry price.
Take Profit 4 (TP4): 200% of the previous candle's range above or below the entry price.
These levels are adjusted dynamically based on the previous candle's high and low, so they adapt to changing market conditions.
Stop Loss:
A stop-loss is set to manage risk. The default stop-loss is 3% from the entry price, but this can be adjusted in the settings. The stop-loss is triggered if the price moves against the position by this amount.
Trend Direction Highlighting:
The strategy highlights the bars (candles) with colors:
Green bars indicate an uptrend (when EMA 20 crosses above EMA 50).
Red bars indicate a downtrend (when EMA 20 crosses below EMA 50).
These visual cues help users easily identify the market direction.
Strategy Entries and Exits:
Entries: The strategy enters a long (buy) position when the EMA 20 crosses above the EMA 50 and a short (sell) position when the EMA 20 crosses below the EMA 50.
Exits: The strategy exits the positions at any of the defined take-profit levels or the stop-loss. Multiple exit levels provide opportunities to take profit progressively as the price moves in the favorable direction.
Entry and Exit Conditions in Detail:
Buy Entry Condition (Uptrend):
A buy position is opened when EMA 20 crosses above EMA 50, signaling the start of an uptrend.
The strategy calculates take-profit levels above the entry price based on the previous bar's range (high-low) and the multipliers for TP1, TP2, TP3, and TP4.
Sell Entry Condition (Downtrend):
A sell position is opened when EMA 20 crosses below EMA 50, signaling the start of a downtrend.
The strategy calculates take-profit levels below the entry price, similarly based on the previous bar's range.
Exit Conditions:
Take Profit: The strategy attempts to exit the position at one of the take-profit levels (TP1, TP2, TP3, or TP4). If the price reaches any of these levels, the position is closed.
Stop Loss: The strategy also has a stop-loss set at a default value (3% below the entry for long trades, and 3% above for short trades). The stop-loss helps to protect the position from significant losses.
Backtesting and Performance Metrics:
The strategy can be backtested using TradingView's Strategy Tester. The results will show how the strategy would have performed historically, including key metrics like:
Net Profit
Max Drawdown
Win Rate
Profit Factor
Average Trade Duration
These performance metrics can help users assess the strategy's effectiveness over historical periods and optimize the input parameters (e.g., multipliers, stop-loss level).
Customization:
The strategy allows for the adjustment of several key input values via the settings panel:
Take Profit Multipliers: Users can customize the multipliers for each take-profit level (TP1, TP2, TP3, TP4).
Stop Loss Percentage: The user can also adjust the stop-loss percentage to a custom value.
EMA Periods: The default periods for the EMA 50 and EMA 20 are fixed, but they can be adjusted for different market conditions.
Pros of the Strategy:
EMA Crossover Strategy: A classic and well-known strategy used by traders to identify the start of new trends.
Multiple Take Profit Levels: By taking profits progressively at different levels, the strategy locks in gains as the price moves in favor of the position.
Clear Trend Identification: The use of green and red bars makes it visually easier to follow the market's direction.
Risk Management: The stop-loss and take-profit features help to manage risk and optimize profit-taking.
Cons of the Strategy:
Lagging Indicators: The strategy relies on EMAs, which are lagging indicators. This means that the strategy might enter trades after the trend has already started, leading to missed opportunities or less-than-ideal entry prices.
No Confirmation Indicators: The strategy purely depends on the crossover of two EMAs and does not use other confirming indicators (e.g., RSI, MACD), which might lead to false signals in volatile markets.
How to Use in Real-Time Trading:
Use for Backtesting: Initially, use this strategy in backtest mode to understand how it would have performed historically with your preferred settings.
Paper Trading: Once comfortable, you can use paper trading to test the strategy in real-time market conditions without risking real money.
Live Trading: After testing and optimizing the strategy, you can consider using it for live trading with proper risk management in place (e.g., starting with a small position size and adjusting parameters as needed).
Summary:
This strategy is designed to identify trend reversals using EMA crossovers, with customizable take-profit levels and a stop-loss to manage risk. It's well-suited for traders looking for a systematic way to enter and exit trades based on clear market signals, while also providing flexibility to adjust for different risk profiles and trading styles.

Dual Bayesian For Loop [QuantAlgo]Discover the power of probabilistic investing and trading with Dual Bayesian For Loop by QuantAlgo , a cutting-edge technical indicator that brings statistical rigor to trend analysis. By merging advanced Bayesian statistics with adaptive market scanning, this tool transforms complex probability calculations into clear, actionable signals—perfect for both data-driven traders seeking statistical edge and investors who value probability-based confirmation!
🟢 Core Architecture
At its heart, this indicator employs an adaptive dual-timeframe Bayesian framework with flexible scanning capabilities. It utilizes a configurable loop start parameter that lets you fine-tune how recent price action influences probability calculations. By combining adaptive scanning with short-term and long-term Bayesian probabilities, the indicator creates a sophisticated yet clear framework for trend identification that dynamically adjusts to market conditions.
🟢 Technical Foundation
The indicator builds on three innovative components:
Adaptive Loop Scanner: Dynamically evaluates price relationships with adjustable start points for precise control over historical analysis
Bayesian Probability Engine: Transforms market movements into probability scores through statistical modeling
Dual Timeframe Integration: Merges immediate market reactions with broader probability trends through custom smoothing
🟢 Key Features & Signals
The Adaptive Dual Bayesian For Loop transforms complex calculations into clear visual signals:
Binary probability signal displaying definitive trend direction
Dynamic color-coding system for instant trend recognition
Strategic L/S markers at key probability reversals
Customizable bar coloring based on probability trends
Comprehensive alert system for probability-based shifts
🟢 Practical Usage Tips
Here's how you can get the most out of the Dual Bayesian For Loop :
1/ Setup:
Add the indicator to your TradingView chart by clicking on the star icon to add it to your favorites ⭐️
Start with default source for balanced price representation
Use standard length for probability calculations
Begin with Loop Start at 1 for complete price analysis
Start with default Loop Lookback at 70 for reliable sampling size
2/ Signal Interpretation:
Monitor probability transitions across the 50% threshold (0 line)
Watch for convergence of short and long-term probabilities
Use L/S markers for potential trade signals
Monitor bar colors for additional trend confirmation
Configure alerts for significant trend crossovers and reversals, ensuring you can act on market movements promptly, even when you’re not actively monitoring the charts
🟢 Pro Tips
Fine-tune loop parameters for optimal sensitivity:
→ Lower Loop Start (1-5) for more reactive analysis
→ Higher Loop Start (5-10) to filter out noise
Adjust probability calculation period:
→ Shorter lengths (5-10) for aggressive signals
→ Longer lengths (15-30) for trend confirmation
Strategy Enhancement:
→ Compare signals across multiple timeframes
→ Combine with volume for trade validation
→ Use with support/resistance levels for entry timing
→ Integrate other technical tools for even more comprehensive analysis

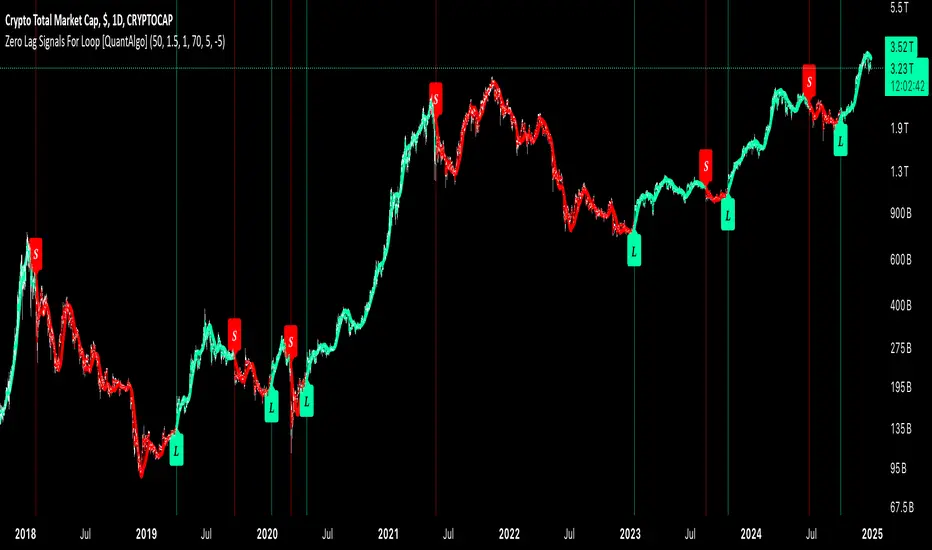
Zero Lag Signals For Loop [QuantAlgo]Elevate your trend-following investing and trading strategy with Zero Lag Signals For Loop by QuantAlgo , a simple yet effective technical indicator that merges advanced zero-lag mechanism with adaptive trend analysis to bring you a fresh take on market momentum tracking. Its aim is to support both medium- to long-term investors monitoring broader market shifts and precision-focused traders seeking quality entries through its dual-focused analysis approach!
🟢 Core Architecture
The foundation of this indicator rests on its zero-lag implementation and dynamic trend assessment. By utilizing a loop-driven scoring system alongside volatility-based filtering, each market movement is evaluated through multiple historical lenses while accounting for current market conditions. This multi-layered approach helps differentiate between genuine trend movements and market noise across timeframe and asset classes.
🟢 Technical Foundation
Three distinct components of this indicator are:
Zero Lag EMA : An enhanced moving average calculation designed to minimize traditional lag effects
For Loop Scoring System : A comprehensive scoring mechanism that weighs current price action against historical contexts
Dynamic Volatility Analysis : A sophisticated ATR-based filter that adjusts signal sensitivity to market conditions
🟢 Key Features & Signals
The Zero Lag Signals For Loop provides market insights through:
Color-coded Zero Lag line that adapts to trend direction
Dynamic fills between price and Zero Lag basis for enhanced visualization
Trend change markers (L/S) that highlight potential reversal points
Smart bar coloring that helps visualize market momentum
Background color changes with vertical lines at significant trend shifts
Customizable alerts for both bullish and bearish reversals
🟢 Practical Usage Tips
Here's how you can get the most out of the Zero Lag Signals For Loop :
1/ Setup:
Add the indicator to your TradingView chart by clicking on the star icon to add it to your favorites ⭐️
Start with the default Zero Lag length for balanced sensitivity
Use the standard volatility multiplier for proper filtering
Keep the default loop range for comprehensive trend analysis
Adjust threshold levels based on your investing and/or trading style
2/ Reading Signals:
Watch for L/S markers - they indicate validated trend reversals
Pay attention to Zero Lag line color changes - they confirm trend direction
Monitor bar colors for additional trend confirmation
Configure alerts for trend changes in both bullish and bearish directions, ensuring you can act on significant technical developments promptly.
🟢 Pro Tips
Fine-tune the Zero Lag length based on your timeframe:
→ Lower values (20-40) for more responsive signals
→ Higher values (60-100) for stronger trend confirmation
Adjust volatility multiplier based on market conditions:
→ Increase multiplier in volatile markets
→ Decrease multiplier in stable trending markets
Combine with:
→ Volume analysis for trade validation
→ Multiple timeframe analysis for broader context
→ Other technical tools for comprehensive analysis
MERCURY-PRO by DrAbhiramSivprasd“MERCURYPRO”
The MERCURYPRO indicator is a custom technical analysis tool designed to provide dynamic trend signals based on a combination of the Chande Momentum Oscillator (CMO) and Standard Deviation (StDev). This indicator helps traders identify trend reversals or continuation based on the behavior of the price and momentum.
Key Features:
• Source Input: The indicator works with any price data, with the default set to close, which represents the closing price of each bar.
• Length Input: A period (default value 9) is used to determine the calculation window for the Chande Momentum Oscillator and Standard Deviation.
• Fixed CMO Length Option: Users can choose whether to use a fixed CMO length of 9 or adjust the length to the user-defined pds value.
• Calculation Method: The indicator allows switching between using the Chande Momentum Oscillator (CMO) or Standard Deviation (StDev) for the momentum calculation.
• Alpha: The smoothing factor used in the calculation of the MERCURYPRO value, which is based on the length of the period input (pds).
Core Calculation:
1. Momentum Calculation: The script calculates the momentum by determining the change in the source price (e.g., close) from one period to the next.
2. Chande Momentum Oscillator (CMO): The positive and negative momentum components are calculated and then summed over the specified period. This value is normalized to a percentage to determine the momentum strength.
3. K Value Calculation: The script selects either the CMO or Standard Deviation (depending on the user setting) to calculate the k value, which represents the dynamic price momentum.
4. MERCURYPRO Line: The final output of the indicator, MERCURYPRO, is computed using a weighted average of the k value and the previous MERCURYPRO value. The line is smoothed using the Alpha parameter.
Plot and Signal Generation:
• Color Coding: The line is color-coded based on the direction of MERCURYPRO:
• Blue: The trend is bullish (MERCURYPRO is rising).
• Maroon: The trend is bearish (MERCURYPRO is falling).
• Default Blue: Neutral or sideways market conditions.
• Plotting: The MERCURYPRO line is plotted with varying colors depending on the trend direction.
Alerts:
• Color Change Alert: The indicator has an alert condition based on when the MERCURYPRO line crosses its previous value. This helps traders stay informed about potential trend reversals or continuation signals.
Use Case:
• Trend Confirmation: Traders can use the MERCURYPRO indicator to identify whether the market is in a strong trend or not.
• Signal for Entries/Exits: The color change and crossovers of the MERCURYPRO line can be used as entry or exit signals, depending on the trader’s strategy.
Overall Purpose:
The MERCURYPRO indicator combines momentum analysis with smoothing techniques to offer a dynamic, responsive tool for identifying market trends and potential reversals. It is particularly useful in conjunction with other technical indicators to provide confirmation for trade setups.
How to Use the MERCURYPRO Indicator:
The MERCURYPRO indicator is designed to help traders identify trend reversals and market conditions. Here are a few ways you can use it:
1. Trend Confirmation (Bullish or Bearish)
• Bullish Trend: When the MERCURYPRO line is colored Blue, it indicates a rising trend, suggesting that the market is bullish.
• Action: You can consider entering long positions when the line turns blue, or holding your existing positions if you’re already long.
• Bearish Trend: When the MERCURYPRO line is colored Maroon, it signals a downward trend, indicating a bearish market.
• Action: You may consider entering short positions or closing any long positions when the line turns maroon.
2. Trend Reversal Alerts
• Color Change: The MERCURYPRO indicator changes color when there’s a trend reversal. The alert condition triggers when the MERCURYPRO crosses above or below its previous value, signaling a potential shift in the trend.
• Action: You can use this alert as a signal to monitor potential entry or exit points for trades. For example, a crossover from maroon to blue could indicate a potential buying opportunity, while a crossover from blue to maroon could suggest a selling opportunity.
3. Use with Other Indicators for Confirmation
• While the MERCURYPRO provides valuable trend insights, it’s often more effective when used in combination with other indicators like RSI (Relative Strength Index), MACD, or moving averages to confirm signals.
• Example: If MERCURYPRO turns blue and RSI is above 50, it may signal a strong bullish trend, enhancing the confidence to enter a long trade.
4. Divergence
• Watch for divergence between the MERCURYPRO line and the price chart:
• Bullish Divergence: If the price makes new lows while MERCURYPRO is showing higher lows, it suggests a potential bullish reversal.
• Bearish Divergence: If the price makes new highs while MERCURYPRO is showing lower highs, it suggests a potential bearish reversal.
Example of Use:
• Example 1: If the MERCURYPRO line changes from maroon to blue, you might enter a long position. After the MERCURYPRO line turns blue, use an alert to monitor the price action. If other indicators (like RSI) also suggest strength, your confidence in the trade will increase.
• Example 2: If the MERCURYPRO line shifts from blue to maroon, it could be a signal to close long positions and consider shorting the market if other conditions align (e.g., moving averages also turn bearish).
Warning for Using the MERCURYPRO Indicator:
1. Lagging Indicator:
• The MERCURYPRO is a lagging indicator, meaning it responds to price changes after they have occurred. This may delay entry and exit signals, and it’s crucial to combine it with other leading indicators to get timely information.
2. False Signals in Range-bound Markets:
• In choppy or sideways markets, the MERCURYPRO line can produce false signals, flipping between blue and maroon frequently without showing a clear trend. It’s important to avoid trading based on these false signals when the market is not trending.
3. Overreliance on One Indicator:
• Relying solely on MERCURYPRO can be risky. Always confirm signals with additional tools like volume analysis, price action, or other indicators to increase the accuracy of your trades.
4. Market Conditions Matter:
• The indicator may work well in trending markets, but in highly volatile or news-driven environments, it may provide misleading signals. Ensure that you take market fundamentals and external news events into consideration before acting on the indicator’s signals.
5. Risk Management:
• As with any technical indicator, MERCURYPRO is not infallible. Always use appropriate risk management techniques such as stop-loss orders to protect your capital. Never risk more than you can afford to lose on a trade.
6. Backtest First:
• Before implementing MERCURYPRO in live trading, make sure to backtest it on historical data. Test the strategy with various market conditions to assess its effectiveness and identify any potential weaknesses.
By considering these guidelines and warnings, you can use the MERCURYPRO indicator more effectively and mitigate potential risks in your trading strategy.

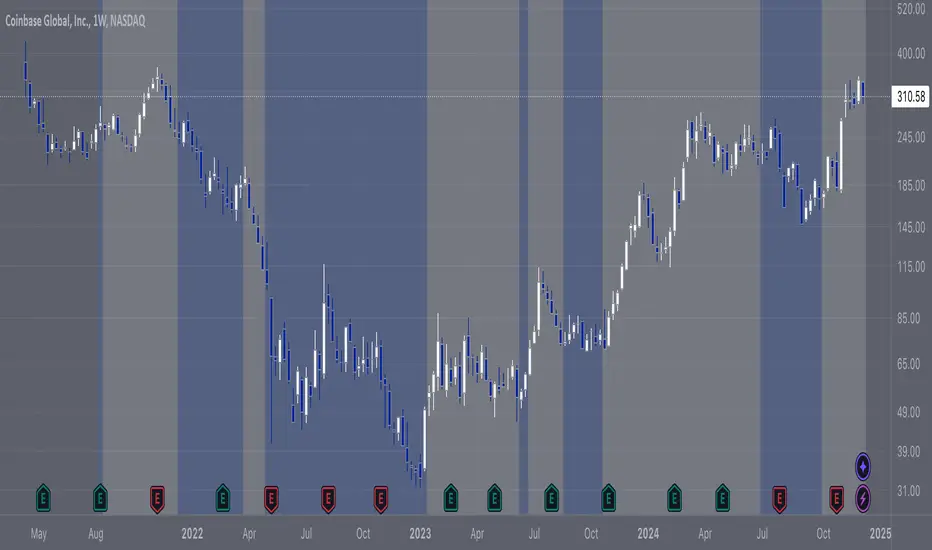
COIN/BTC Trend OscillatorThe COIN/BTC Trend Oscillator is a versatile tool designed to measure and visualize momentum divergences between Coinbase stock ( NASDAQ:COIN ) and Bitcoin ( CRYPTOCAP:BTC ). It helps identify overbought and oversold conditions, while also highlighting potential trend reversals.
Key Features:
VWAP-Based Divergence Analysis:
• Tracks the difference between NASDAQ:COIN and CRYPTOCAP:BTC relative to their respective VWAPs.
• Highlights shifts in momentum between the two assets.
Normalized Oscillator:
• Uses ATR normalization to adapt to different volatility conditions.
• Displays momentum shifts on a standardized scale for better comparability.
Overbought and Oversold Conditions:
• Identifies extremes using customizable thresholds (default: ±80).
• Dynamic background colors for quick visual identification:
• Blue for overbought zones (potential sell).
• White for oversold zones (potential buy).
Rolling Highs and Lows Detection:
• Tracks turning points in the oscillator to identify possible trend reversals.
• Useful for spotting exhaustion or accumulation phases.
Use Case:
This indicator is ideal for trading Coinbase stock relative to Bitcoin’s momentum. It’s especially useful during strong market trends, helping traders time entries and exits based on extremes in relative performance.
Limitations:
• Performance may degrade in choppy or sideways markets.
• Assumes a strong correlation between NASDAQ:COIN and CRYPTOCAP:BTC , which may not hold during independent events.
Pro Tip: Use this oscillator with broader trend confirmation tools like moving averages or RSI to improve reliability. For macro strategies, consider combining with higher timeframes for alignment.
DemaRSI StrategyThis is a repost to a old script that cant be updated anymore, the request was made on Feb, 27, 2016.
Here's a engaging description for the tradingview script:
**DemaRSI Strategy: A Proven Trading System**
Join thousands of traders who have already experienced the power of this highly effective strategy. The DemaRSI system combines two powerful indicators - DEMA (Double Exponential Moving Average) and RSI (Relative Strength Index) - to generate profitable trades with minimal risk.
**Key Features:**
* **Trend-Following**: Our algorithm identifies strong trends using a combination of DEMA and RSI, allowing you to ride the waves of market momentum.
* **Risk Management**: The system includes built-in stop-loss and take-profit levels, ensuring that your gains are protected and losses are minimized.
* **Session-Based Trading**: Trade during specific sessions only (e.g., London or New York) for even more targeted results.
* **Customizable Settings**: Adjust the length of moving averages, RSI periods, and other parameters to suit your trading style.
**What You'll Get:**
* A comprehensive strategy that can be used with any broker or platform
* Easy-to-use interface with customizable settings
* Real-time performance metrics and backtesting capabilities
**Start Trading Like a Pro Today!**
This script is designed for intermediate to advanced traders who want to take their trading game to the next level. With its robust risk management features, this strategy can help you achieve consistent profits in various market conditions.
**Disclaimer:** This script is not intended as investment advice and should be used at your own discretion. Trading carries inherent risks, and losses are possible.
~Llama3

MicuRobert EMA Cross StrategyThis is a repost of a old strategy that cant be updated anymore, it was a request for a user made in Oct, 6, 2015
Here's a possible engaging description for the tradingview script:
**MicuRobert EMA Cross V2: A Powerful Trading Strategy**
Join the ranks of successful traders with this advanced strategy, designed to help you profit from market trends. The MicuRobert EMA Cross V2 combines two essential indicators - Exponential Moving Average (EMA) and Divergence EMA (DEMA) - to generate buy and sell signals.
**Key Features:**
* **Trading Session Filter**: Only trade during your preferred session, ensuring you're in sync with market conditions.
* **Trailing Stop**: Automatically adjust stop-loss levels to lock in profits or limit losses.
* **Customizable Trade Size**: Set the size of each trade based on your risk tolerance and trading goals.
**How it Works:**
The script uses two EMAs (5-period and 34-period) to identify trends. When the shorter EMA crosses above the longer one, a buy signal is generated. Conversely, when the shorter EMA falls below the longer one, a sell signal is triggered. The strategy also incorporates divergence analysis between price action and the EMAs.
**Visual Aids:**
* **EMA Plots**: Visualize the two EMAs on your chart to gauge market momentum.
* **Buy/Sell Signals**: See when buy or sell signals are generated, along with their corresponding entry prices.
* **Trailing Stop Lines**: Monitor stop-loss levels as they adjust based on price action.
**Get Started:**
Download this script and start trading like a pro! With its robust features and customizable settings, the MicuRobert EMA Cross V2 is an excellent addition to any trader's arsenal.
~Llama3

Structure Pilot Vision [Wang Indicators]Built and refined with Dave Teaches, the HTF Vision Pro supercharges the trader, providing them with the tools to approach price with a layered analysis.
Providing the trader the instruments to put on the spotlight significant zones to anticipate price deliveries
HTF CANDLE VISION
Displays up to 3 series of HTF Candles
Shows candlesticks from a higher time frame (e.g., daily, 4-hour, weekly) on a lower time frame chart (e.g., 1-hour, 15-minute). This allows traders to simultaneously observe both short-term and long-term market dynamics.
Customizable Time Frames: Users can select any higher time frame to overlay on the current chart. Common time frames include daily, weekly, and monthly candles, but other custom time frames can also be used.
Color Coding: The HTF candles are color-coded for easy differentiation from the lower time frame candles. Users can customize colors to suit their preferences.
Open, High, Low, Close (OHLC) Representation: The indicator displays the full candlestick pattern for the chosen HTF, including the open, high, low, and close values. This helps traders easily identify key price levels and trends.
Settings :
Number of candles
Space between the chart and the HTF candles
Space between candles sets
Size : from Tiny (2x regular candle size) to Large (x8 regular candle size)
Space between candles
Colors of candles, borders and wicks
Incorporating a Higher Time Frame (HTF) candle into your Lower Time Frame (LTF) chart can be immensely beneficial for traders looking to enhance their analysis and decision-making process.
Use Cases for HTF Candles on LTF Charts:
Trend Confirmation:
Use Case: A trader might be looking at a 15-minute chart (LTF) but wants to confirm if the short-term trends align with the daily trend (HTF). Plotting a daily candle on the 15-minute chart helps visualize whether the short-term movements are part of a broader, longer-term trend.
Support and Resistance Identification:
Use Case: By plotting a weekly candle on a daily chart, traders can quickly identify levels that have acted as significant support or resistance in the past on the higher time frame, which might not be as visible or influential on the daily chart alone.
Entry and Exit Points Enhancement:
Use Case: When preparing to enter a trade based on a 1-hour chart, overlaying a 4-hour candle can provide insights into potential reversal points or continuation patterns that are more significant on the higher time frame, thus refining entry and exit strategies.
Volatility and Breakout Analysis:
Use Case: Seeing how a single HTF candle (like a monthly candle on a weekly chart) closes can give traders an idea of the market's volatility or the strength behind breakouts. A long wick on the HTF candle might suggest a rejected breakout or a potential reversal.
Risk Management:
Use Case: Using an HTF candle can help set more informed stop-loss levels. For instance, if a trader uses a 4-hour candle on a 1-hour chart, they might place their stop-loss just beyond the low of the HTF candle, assuming this represents a significant level of support or resistance.
Contextual Trading Decisions:
Use Case: For scalpers or day traders, understanding where the current price action sits within the context of a higher timeframe can lead to better decision-making. For instance, trading within an HTF consolidation range might suggest less aggressive moves, while being near the top or bottom of such a range might indicate potential for larger movements.
Market Sentiment Analysis:
Use Case: The color (red for bearish, green for bullish) and size of the HTF candle can give a quick visual cue of the market sentiment over that period, helping traders assess whether they are going with or against the broader market flow.
Swing Trading:
Use Case: Swing traders might plot a weekly candle on a daily chart to align their trades with the direction of the weekly trend, ensuring they're not fighting the broader market momentum.
Educational and Visual Reference:
Use Case: For educational purposes, having an HTF candle overlay can serve as a visual reminder for students or new traders about how price movements on different time frames can influence each other, aiding in teaching concepts like "the trend is your friend."
Wang use cases :
The way it is intended to be used is as follow
If you trade the 1 min chart and have a set of 5 min HTF candles plotted on your charts it could be used as follow :
As long as the 5 min keep providing close below the last 5 min candle if you're short you're safe ... if the 5 min candle stop closing below the last ones and start giving up-close you should consider closing your trade
Another use of HTF Candle is to find fractals responsible (up or down internal mouv before the breakout that creates a new zone). This fractal acts as supply and demand zone responsible for maintening the trend or for a reversal.
See examples below :
These fractals are interesting zones because they often cause the price to react, so following a flip in the fractal, you can take a short in bearish zones and a long in bullish zones. Fractals are easier to detect thanks to the HTF candles function, and allow you to enter positions with greater confidence. They can be used in the same way as the 70%, 50% and 30% interest zones, or they can be used simultaneously.
Use with zones :
▫️ VERTICAL BARS VISION ▫️
The vertical bars provide a view of market fractality: on a low time frame chart, they show the size of a candle in a higher time frame, and thus give a better understanding of the price fractality essential to the strategy we use.
Example :
For your information, when you modify data in the vertical bars or HTF candles parameters, the two are synchronized automatically.
The Vertical HTF Candle Closures Indicator is a simple yet effective tool that helps traders visually track the closing times of higher time frame (HTF) candles (such as 4H, 1H, 15M) on a lower time frame chart (e.g., 1-minute).
This feature plots vertical lines on the chart at the exact closure time of each selected HTF, allowing traders to quickly recognize key moments when the HTF candles close, or better yet when we trade above / below the last one and reverse ''sweepy sweepy'' .
Its more like a vertical and more micro visualisation than the HTF Candles.
Wang usage :
its a great tool to be able to reverse engineer what's in a HTFcandle precisely its a good combination with HTF candle projections to train the eyes of the traders about Whats is inside a candle that formed on the higher time frame
Limitation & know issues :
The chart may become cluttered with too many lines if multiple time frames are selected. Adjusting the line style or disabling certain time frames can help reduce visual noise.
On low time frame (<30s), some bar may notshow exactly on time (e.g : in 10sec timeframe, the 15min bar can be displayed at 01:15:10 instead of 01:15:00).
Because of the data provider and the interpreter of Trading View, if there is not data for a candle, Trading view just "skip" the candle. Sometime, those skip are on the candle that goes to 15min, 1 hour or 4 hour. As this is a Trading View issue. There is pretty much nothing we can do.
Some users may experience vertical bars at 1am, 5am, 9am ... instead of 0am, 4am, 8am ... That is because of the difference between the Timezone set on the chart and the timezone of the market they trade. Vertical bar will always refer to the symbol displayed
