Smart Volume S/R Pro [The_lurker]مؤشر "Smart Volume S/R Pro " هو أداة تحليل فني متقدمة مصممة لمساعدة المتداولين في تحديد مستويات الدعم والمقاومة القوية بناءً على حجم التداول، مع إضافة ميزات تحليلية متطورة مثل تصفية الاتجاه ، مناطق الثقة ، تقييم القوة ، حساب احتمالية الاختراق ، قياس السيولة ، تحديد الأهداف السعرية ، ومستويات فيبوناتشي . وايضا تقديم تسميات (Labels) بجانب كل مستوى دعم ومقاومة، تحتوي على أرقام ومعلومات دقيقة تعكس حالة السوق. هذه التسميات ليست مجرد زينة، بل أدوات تحليلية تساعد المتداولين على اتخاذ قرارات مستنيرة بناءً على بيانات السوقيهدف هذا المؤشر إلى توفير رؤية شاملة للسوق .
الوظائف الرئيسية للمؤشر
1- تحديد مستويات الدعم والمقاومة بناءً على حجم التداول العالي
يقوم المؤشر بتحليل الأشرطة (Bars) السابقة (حتى 300 شريط افتراضيًا) لتحديد النقاط التي شهدت أعلى مستويات حجم التداول.
يرسم خطوط أفقية تمثل مستويات المقاومة (عند أعلى سعر في تلك الأشرطة) والدعم (عند أدنى سعر)، ويمكن للمستخدم اختيار عدد الخطوط المعروضة (من 1 إلى 6).
2- تصفية الاتجاه باستخدام مؤشر ADX
يستخدم المؤشر مؤشر الاتجاه المتوسط (ADX) لتقييم قوة الاتجاه في السوق.
عندما تكون قوة الاتجاه عالية (تتجاوز عتبة محددة، 25 افتراضيًا)، يقلل المؤشر عدد مستويات الدعم والمقاومة المعروضة للتركيز فقط على المستويات الأكثر أهمية.
3- مناطق الثقة الديناميكية
يضيف المؤشر مناطق حول مستويات الدعم والمقاومة بناءً على متوسط المدى الحقيقي (ATR)، مما يساعد المتداولين على تصور النطاقات التي قد يتفاعل فيها السعر مع هذه المستويات.
يمكن تعديل عرض هذه المناطق باستخدام مضاعف ATR.
4- تقييم قوة المستويات
يحسب المؤشر قوة كل مستوى بناءً على حجم التداول، عدد المرات التي تم اختبار المستوى فيها (Touch Count)، وقرب السعر الحالي من المستوى.
يتم عرض درجة القوة (من 0 إلى 100) بجانب كل مستوى إذا تم تفعيل هذه الخاصية.
5- احتمالية الاختراق
يقدّر المؤشر احتمالية اختراق كل مستوى بناءً على الزخم (ROC)، قوة المستوى، والمسافة بين السعر الحالي والمستوى.
يظهر الاحتمال كنسبة مئوية إذا تم تفعيل الخيار، مما يساعد المتداولين على توقع الحركات المحتملة.
6- تحليل السيولة التاريخية
يقيس المؤشر السيولة حول كل مستوى بناءً على حجم التداول في النطاقات القريبة منه.
يمكن عرض قيم السيولة في التسميات أو استخدامها لتعديل عرض الخطوط (الخطوط الأكثر سيولة تظهر أعرض).
7- الأهداف السعرية
عند تفعيل هذه الخاصية، يحسب المؤشر أهداف سعرية للاختراق (Breakout) والارتداد (Reversal) بناءً على الزخم وقوة المستوى وATR.
يمكن عرض هذه الأهداف كنصوص في التسميات أو كخطوط أفقية على الرسم البياني.
8- مستويات فيبوناتشي
يرسم المؤشر مستويات فيبوناتشي (0.0، 0.236، 0.382، 0.5، 0.618، 0.786، 1.0) بناءً على أعلى وأدنى سعر في فترة النظرة الخلفية.
يمكن للمستخدم اختيار أي من هذه المستويات لعرضها أو إخفائها.
9- تنبيه شامل للاختراق
يوفر المؤشر تنبيهًا واحدًا يشمل جميع المستويات، حيث يُطلق التنبيه عندما يخترق السعر أي مستوى دعم أو مقاومة مع رسالة توضح نوع الاختراق والمستوى المخترق.
كيفية عمل المؤشر
الخطوة الأولى: يحدد المؤشر الأشرطة ذات الحجم العالي خلال فترة النظرة الخلفية المحددة (Lookback Period).
الخطوة الثانية: يرسم مستويات الدعم والمقاومة بناءً على أعلى وأدنى الأسعار في تلك الأشرطة، مع مراعاة عدد الخطوط المختارة من المستخدم.
الخطوة الثالثة: يطبق مرشح الاتجاه (إذا كان مفعلاً) لتقليل عدد المستويات في حالة الاتجاه القوي.
الخطوة الرابعة: يضيف التحليلات الإضافية مثل القوة، السيولة، احتمالية الاختراق، والأهداف السعرية، ويرسم مناطق الثقة ومستويات فيبوناتشي حسب الإعدادات.
الخطوة الخامسة: يراقب السعر ويطلق تنبيهًا عند الاختراق.
الإعدادات القابلة للتخصيص
1- فترة النظرة الخلفية (Lookback Period): عدد الأشرطة التي يتم تحليلها (افتراضيًا 300).
2- عدد الخطوط (Number of Lines): من 1 إلى 6 مستويات دعم ومقاومة.
3- الألوان والأنماط: يمكن تغيير ألوان الخطوط وأنماطها (ممتلئة، متقطعة، منقطة).
4- التسميات: تفعيل/تعطيل التسميات، وحجمها، وموقعها، ولون النص.
5- مرشح الاتجاه: تفعيل/تعطيل ADX، وتعديل طوله وعتبته.
6- مناطق الثقة: تفعيل/تعطيل، وتعديل طول ATR ومضاعفه.
7- القوة واحتمالية الاختراق: تفعيل/تعطيل العرض، وتعديل طول ROC.
8- السيولة: تفعيل/تعطيل تأثير السيولة على عرض الخطوط وقيمها في التسميات.
9- الأهداف السعرية: تفعيل/تعطيل الأهداف وعرضها كخطوط.
10- فيبوناتشي: اختيار المستويات المعروضة ولون الخطوط.
فوائد المؤشر
دقة عالية: يعتمد على حجم التداول لتحديد المستويات، مما يجعله أكثر موثوقية من المستويات العشوائية.
مرونة: يوفر خيارات تخصيص واسعة تتيح للمتداولين تكييفه حسب استراتيجياتهم.
تحليل شامل: يجمع بين الدعم والمقاومة، الاتجاه، السيولة، والأهداف في أداة واحدة.
سهولة الاستخدام: التسميات والتنبيهات تجعل من السهل متابعة السوق دون تعقيد.
==================================================================================تسميات (Labels) بجانب كل مستوى دعم ومقاومة، تحتوي على أرقام ومعلومات دقيقة تعكس حالة السوق. هذه التسميات ليست مجرد زينة، بل أدوات تحليلية تساعد المتداولين على اتخاذ قرارات مستنيرة بناءً على بيانات السوق. في هذا الشرح، سنستعرض كل رقم أو قيمة تظهر في التسميات ومعناها العملي.
مكونات التسميات
التسميات تظهر بجانب كل مستوى دعم (Support) ومقاومة (Resistance) وتبدأ بحرف "S" للدعم أو "R" للمقاومة، تليها مجموعة من الأرقام والقيم التي يمكن تفعيلها أو تعطيلها حسب إعدادات المستخدم. إليك تفصيل كل عنصر:
1- عدد اللمسات (Touch Count)
الرمز: يظهر مباشرة بعد "S" أو "R" (مثال: "R: 5" أو "S: 3").
المعنى: يشير إلى عدد المرات التي اختبر فيها السعر هذا المستوى دون اختراقه.
الفائدة: كلما زاد عدد اللمسات، كلما كان المستوى أقوى وأكثر أهمية. على سبيل المثال، إذا كان "R: 5"، فهذا يعني أن السعر ارتد من هذا المستوى 5 مرات، مما يجعله مقاومة قوية محتملة.
2- قوة المستوى (Strength Rating)
الرمز: يظهر بين قوسين مربعين (مثال: " ").
المعنى: قيمة من 0 إلى 100 تعكس قوة المستوى بناءً على عوامل مثل حجم التداول، عدد اللمسات، وقرب السعر الحالي من المستوى.
الفائدة: القيم العالية (مثل 75 أو أكثر) تشير إلى مستوى قوي يصعب اختراقه، بينما القيم المنخفضة (مثل 30 أو أقل) تدل على ضعف المستوى وسهولة اختراقه. يمكن للمتداول استخدام هذا لتحديد المستويات الأكثر موثوقية.
3- احتمالية الاختراق (Breakout Probability)
الرمز: يبدأ بحرف "B" متبوعًا بنسبة مئوية (مثال: "B: 60%").
المعنى: نسبة من 0% إلى 100% تُظهر احتمالية اختراق السعر للمستوى بناءً على الزخم الحالي، قوة المستوى، والمسافة بين السعر والمستوى.
الفائدة: نسبة مرتفعة (مثل 60% أو أكثر) تعني أن السعر قد يخترق المستوى قريبًا، بينما النسب المنخفضة (مثل 20%) تشير إلى احتمال ارتداد السعر. هذا مفيد لتوقع الحركة التالية.
4- قيمة السيولة (Liquidity Value)
الرمز: يبدأ بحرف "L" متبوعًا برقم (مثال: "L: 1200").
المعنى: يمثل متوسط حجم التداول في النطاق القريب من المستوى، مما يعكس السيولة التاريخية حوله.
الفائدة: القيم العالية تدل على وجود سيولة كبيرة، مما يعني أن السعر قد يتفاعل بقوة مع هذا المستوى (إما بالارتداد أو الاختراق). القيم المنخفضة تشير إلى سيولة ضعيفة، مما قد يجعل المستوى أقل تأثيرًا.
5- الأهداف السعرية (Price Targets)
الرمز: يبدأ بـ "BT" (هدف الاختراق) و"RT" (هدف الارتداد) متبوعين بأرقام (مثال: "BT: 150.50 RT: 148.20").
المعنى:
BT (Breakout Target): السعر المحتمل الذي قد يصل إليه السعر بعد اختراق المستوى.
RT (Reversal Target): السعر المحتمل الذي قد يصل إليه السعر إذا ارتد من المستوى.
الفائدة: تساعد المتداولين في تحديد نقاط الخروج المحتملة بعد الاختراق أو الارتداد، مما يسهل وضع خطة تداول دقيقة.
أمثلة عملية
تسمية مقاومة: "R: 4 B: 25% L: 1500 BT: 155.00 RT: 152.00"
المستوى اختُبر 4 مرات، قوته 80 (قوي جدًا)، احتمالية الاختراق 25% (منخفضة، أي احتمال ارتداد أعلى)، السيولة 1500 (مرتفعة)، هدف الاختراق 155.00، هدف الارتداد 152.00.
الاستنتاج: المستوى قوي ومن المرجح أن يرتد السعر منه، لكن إذا اخترق، فقد يصل إلى 155.00.
تسمية دعم: "S: 2 B: 70% L: 800 BT: 145.00 RT: 147.50"
المستوى اختُبر مرتين، قوته 40 (متوسطة إلى ضعيفة)، احتمالية الاختراق 70% (مرتفعة)، السيولة 800 (متوسطة)، هدف الاختراق 145.00، هدف الارتداد 147.50.
الاستنتاج: المستوى ضعيف ومن المحتمل أن يخترقه السعر ليهبط إلى 145.00.
كيفية الاستفادة من التسميات
تحديد القوة والضعف: استخدم قوة المستوى (Strength) لمعرفة ما إذا كان المستوى موثوقًا للارتداد أو عرضة للاختراق.
توقع الحركة: انظر إلى احتمالية الاختراق (Breakout Probability) لتحديد ما إذا كنت ستنتظر اختراقًا أو ترتدًا.
إدارة المخاطر: استخدم الأهداف السعرية (BT وRT) لتحديد نقاط جني الأرباح أو وقف الخسارة.
تقييم السيولة: ركز على المستويات ذات السيولة العالية لأنها غالبًا تكون نقاط تحول رئيسية في السوق.
تأكيد التحليل: ادمج عدد اللمسات مع القوة والسيولة للحصول على صورة كاملة عن أهمية المستوى.
تخصيص التسميات
يمكن للمستخدم تفعيل أو تعطيل أي من هذه القيم (القوة، الاحتمالية، السيولة، الأهداف) من إعدادات المؤشر.
يمكن أيضًا تغيير حجم التسميات (صغير، عادي، كبير)، موقعها (يمين، يسار، أعلى، أسفل)، ولون النص لتناسب احتياجاتك.
التسميات في هذا المؤشر هي بمثابة لوحة تحكم صغيرة بجانب كل مستوى دعم ومقاومة، تقدم لك معلومات فورية عن قوته، احتمالية اختراقه، سيولته، وأهدافه السعرية. بفهم هذه الأرقام، يمكنك تحسين قراراتك في التداول، سواء كنت تبحث عن نقاط دخول، خروج، أو إدارة مخاطر. إذا كنت تريد أداة تجمع بين البساطة والعمق التحليلي .
تنويه:
المؤشر هو أداة مساعدة فقط ويجب استخدامه مع التحليل الفني والأساسي لتحقيق أفضل النتائج.
إخلاء المسؤولية
لا يُقصد بالمعلومات والمنشورات أن تكون، أو تشكل، أي نصيحة مالية أو استثمارية أو تجارية أو أنواع أخرى من النصائح أو التوصيات المقدمة أو المعتمدة من TradingView.
The Smart Volume S/R Pro indicator is an advanced technical analysis tool designed to help traders identify strong support and resistance levels based on trading volume, with the addition of advanced analytical features such as trend filtering, confidence zones, strength assessment, breakout probability calculation, liquidity measurement, price target identification, and Fibonacci levels. It also provides labels next to each support and resistance level, containing accurate numbers and information that reflect the market condition. These labels are not just decorations, but analytical tools that help traders make informed decisions based on market data. This indicator aims to provide a comprehensive view of the market.
Main functions of the indicator
1- Identifying support and resistance levels based on high trading volume
The indicator analyzes previous bars (up to 300 bars by default) to identify the points that witnessed the highest levels of trading volume.
It draws horizontal lines representing resistance levels (at the highest price in those bars) and support (at the lowest price), and the user can choose the number of lines displayed (from 1 to 6).
2- Filtering the trend using the ADX indicator
The indicator uses the Average Directional Index (ADX) to assess the strength of a trend in the market.
When the strength of the trend is high (exceeding a specified threshold, 25 by default), the indicator reduces the number of support and resistance levels displayed to focus only on the most important levels.
3- Dynamic Confidence Zones
The indicator adds zones around support and resistance levels based on the Average True Range (ATR), helping traders visualize the ranges in which the price may interact with these levels.
The width of these zones can be adjusted using the ATR multiplier.
4- Assessing the Strength of Levels
The indicator calculates the strength of each level based on trading volume, the number of times the level has been tested (Touch Count), and the proximity of the current price to the level.
A strength score (from 0 to 100) is displayed next to each level if this feature is enabled.
5- Breakout Probability
The indicator estimates the probability of breaking each level based on momentum (ROC), the strength of the level, and the distance between the current price and the level.
The probability is displayed as a percentage if the option is enabled, helping traders anticipate potential moves.
6- Historical Liquidity Analysis
The indicator measures liquidity around each level based on the trading volume in the ranges near it.
The liquidity values can be displayed in the labels or used to adjust the width of the lines (the most liquid lines appear wider).
7- Price Targets
When this feature is enabled, the indicator calculates price targets for breakout and reversal based on momentum, level strength and ATR.
These targets can be displayed as text in the labels or as horizontal lines on the chart.
8- Fibonacci Levels
The indicator plots Fibonacci levels (0.0, 0.236, 0.382, 0.5, 0.618, 0.786, 1.0) based on the highest and lowest price in the lookback period.
The user can choose which of these levels to display or hide.
9- Comprehensive Breakout Alert
The indicator provides a single alert that includes all levels, where the alert is triggered when the price breaks any support or resistance level with a message explaining the type of breakout and the level broken.
How the indicator works
Step 1: The indicator identifies the bars with high volume during the specified Lookback Period.
Step 2: Draws support and resistance levels based on the highest and lowest prices in those bars, taking into account the number of lines selected by the user.
Step 3: Apply the trend filter (if enabled) to reduce the number of levels in case of a strong trend.
Step 4: Adds additional analyses such as strength, liquidity, breakout probability, and price targets, and draws confidence zones and Fibonacci levels according to the settings.
Step 5: Monitors the price and triggers an alert when the breakout occurs.
Customizable Settings
1- Lookback Period: Number of bars to analyze (default 300).
2- Number of Lines: From 1 to 6 support and resistance levels.
3- Colors and Styles: Line colors and styles can be changed (filled, dashed, dotted).
4- Labels: Enable/disable labels, their size, location, and text color.
5- Trend Filter: Enable/disable ADX, and modify its length and threshold.
6- Confidence Zones: Enable/disable, and modify the ATR length and multiplier.
7- Strength and Breakout Probability: Enable/disable the display, and modify the ROC length.
8- Liquidity: Enable/disable the effect of liquidity on the display of the lines and their values in the labels.
9- Price Targets: Enable/disable the targets and display them as lines.
10- Fibonacci: Choose the displayed levels and the color of the lines.
Indicator Benefits
High Accuracy: It relies on trading volume to determine the levels, which makes it more reliable than random levels.
Flexibility: It provides extensive customization options that allow traders to adapt it to their strategies.
Comprehensive Analysis: Combines support and resistance, trend, liquidity, and targets in one tool. Ease of Use: Labels and alerts make it easy to follow the market without complexity.
Labels next to each support and resistance level contain accurate numbers and information that reflect the market situation. These labels are not just decorations, but analytical tools that help traders make informed decisions based on market data. In this explanation, we will review each number or value that appears in the labels and their practical meaning.
Label Components
Labels appear next to each support and resistance level and begin with the letter "S" for support or "R" for resistance, followed by a set of numbers and values that can be enabled or disabled according to the user's settings. Here is a breakdown of each element:
1- Touch Count
Symbol: Appears immediately after "S" or "R" (example: "R: 5" or "S: 3").
Meaning: Indicates the number of times the price has tested this level without breaking it.
Benefit: The more touches, the stronger and more important the level. For example, if it is "R: 5", it means that the price has bounced off this level 5 times, making it a potentially strong resistance.
2- Strength Rating
Symbol: Appears between square brackets (example: " ").
Meaning: A value from 0 to 100 that reflects the strength of the level based on factors such as trading volume, number of touches, and proximity of the current price to the level.
Benefit: High values (such as 75 or more) indicate a strong level that is difficult to break, while low values (such as 30 or less) indicate a weak level that is easy to break. A trader can use this to determine the most reliable levels.
3- Breakout Probability
Symbol: Starts with the letter "B" followed by a percentage (example: "B: 60%").
Meaning: A percentage from 0% to 100% that shows the probability of the price breaking the level based on the current momentum, the strength of the level, and the distance between the price and the level.
Interest: A high percentage (such as 60% or more) means that the price may soon break through the level, while low percentages (such as 20%) indicate that the price may bounce. This is useful for anticipating the next move.
4- Liquidity Value
Symbol: Starts with the letter "L" followed by a number (example: "L: 1200").
Meaning: Represents the average trading volume in the range near the level, reflecting historical liquidity around it.
Interest: High values indicate high liquidity, meaning that the price may react strongly to this level (either by bouncing or breaking through). Low values indicate low liquidity, which may make the level less influential.
5- Price Targets
Symbol: Starts with "BT" (breakout target) and "RT" (rebound target) followed by numbers (example: "BT: 150.50 RT: 148.20").
Meaning:
BT (Breakout Target): The potential price that the price may reach after breaking the level.
RT (Reversal Target): The potential price that the price may reach if it rebounds from the level.
Utility: Helps traders identify potential exit points after a breakout or rebound, making it easier to develop an accurate trading plan.
Working examples
Resistance label: "R: 4 B: 25% L: 1500 BT: 155.00 RT: 152.00"
Level tested 4 times, strength 80 (very strong), probability of breakout 25% (low, i.e. higher probability of rebound), liquidity 1500 (high), breakout target 155.00, rebound target 152.00.
Conclusion: The level is strong and the price is likely to rebound from it, but if it breaks, it may reach 155.00.
Support Label: "S: 2 B: 70% L: 800 BT: 145.00 RT: 147.50"
Level tested twice, Strength 40 (medium to weak), Breakout Probability 70% (high), Liquidity 800 (medium), Breakout Target 145.00, Rebound Target 147.50.
Conclusion: The level is weak and the price is likely to break it to drop to 145.00.
How to use labels
Determine strength and weakness: Use the level's strength to see if the level is reliable for a bounce or vulnerable to a breakout.
Predict the move: Look at the Breakout Probability to determine whether to wait for a breakout or a bounce.
Risk Management: Use price targets (BT and RT) to set take profit or stop loss points.
Liquidity Evaluation: Focus on levels with high liquidity as they are often key turning points in the market.
Analysis Confirmation: Combine the number of touches with strength and liquidity to get a complete picture of the level’s importance.
Customize Labels
The user can enable or disable any of these values (strength, probability, liquidity, targets) from the indicator settings.
The size of the labels (small, normal, large), their position (right, left, top, bottom), and the color of the text can also be changed to suit your needs.
The labels in this indicator act as a small dashboard next to each support and resistance level, providing you with instant information about its strength, probability of breakout, liquidity, and price targets. By understanding these numbers, you can improve your trading decisions, whether you are looking for entry points, exit points, or risk management. If you want a tool that combines simplicity with analytical depth.
Disclaimer:
The indicator is an auxiliary tool only and should be used in conjunction with technical and fundamental analysis for best results.
Disclaimer
The information and posts are not intended to be, or constitute, any financial, investment, trading or other types of advice or recommendations provided or endorsed by TradingView.
Recherche dans les scripts pour "pro"

Mean Reversion Pro Strategy [tradeviZion]Mean Reversion Pro Strategy : User Guide
A mean reversion trading strategy for daily timeframe trading.
Introduction
Mean Reversion Pro Strategy is a technical trading system that operates on the daily timeframe. The strategy uses a dual Simple Moving Average (SMA) system combined with price range analysis to identify potential trading opportunities. It can be used on major indices and other markets with sufficient liquidity.
The strategy includes:
Trading System
Fast SMA for entry/exit points (5, 10, 15, 20 periods)
Slow SMA for trend reference (100, 200 periods)
Price range analysis (20% threshold)
Position management rules
Visual Elements
Gradient color indicators
Three themes (Dark/Light/Custom)
ATR-based visuals
Signal zones
Status Table
Current position information
Basic performance metrics
Strategy parameters
Optional messages
📊 Strategy Settings
Main Settings
Trading Mode
Options: Long Only, Short Only, Both
Default: Long Only
Position Size: 10% of equity
Starting Capital: $20,000
Moving Averages
Fast SMA: 5, 10, 15, or 20 periods
Slow SMA: 100 or 200 periods
Default: Fast=5, Slow=100
🎯 Entry and Exit Rules
Long Entry Conditions
All conditions must be met:
Price below Fast SMA
Price below 20% of current bar's range
Price above Slow SMA
No existing position
Short Entry Conditions
All conditions must be met:
Price above Fast SMA
Price above 80% of current bar's range
Price below Slow SMA
No existing position
Exit Rules
Long Positions
Exit when price crosses above Fast SMA
No fixed take-profit levels
No stop-loss (mean reversion approach)
Short Positions
Exit when price crosses below Fast SMA
No fixed take-profit levels
No stop-loss (mean reversion approach)
💼 Risk Management
Position Sizing
Default: 10% of equity per trade
Initial capital: $20,000
Commission: 0.01%
Slippage: 2 points
Maximum one position at a time
Risk Control
Use daily timeframe only
Avoid trading during major news events
Consider market conditions
Monitor overall exposure
📊 Performance Dashboard
The strategy includes a comprehensive status table displaying:
Strategy Parameters
Current SMA settings
Trading direction
Fast/Slow SMA ratio
Current Status
Active position (Flat/Long/Short)
Current price with color coding
Position status indicators
Performance Metrics
Net Profit (USD and %)
Win Rate with color grading
Profit Factor with thresholds
Maximum Drawdown percentage
Average Trade value
📱 Alert Settings
Entry Alerts
Long Entry (Buy Signal)
Short Entry (Sell Signal)
Exit Alerts
Long Exit (Take Profit)
Short Exit (Take Profit)
Alert Message Format
Strategy name
Signal type and direction
Current price
Fast SMA value
Slow SMA value
💡 Usage Tips
Consider starting with Long Only mode
Begin with default settings
Keep track of your trades
Review results regularly
Adjust settings as needed
Follow your trading plan
⚠️ Disclaimer
This strategy is for educational and informational purposes only. It is not financial advice. Always:
Conduct your own research
Test thoroughly before live trading
Use proper risk management
Consider your trading goals
Monitor market conditions
Never risk more than you can afford to lose
📋 Release Notes
14 January 2025
Added New Fast & Slow SMA Options:
Fibonacci-based periods: 8, 13, 21, 144, 233, 377
Additional period: 50
Complete Fast SMA options now: 5, 8, 10, 13, 15, 20, 21, 34, 50
Complete Slow SMA options now: 100, 144, 200, 233, 377
Bug Fixes:
Fixed Maximum Drawdown calculation in the performance table
Now using strategy.max_drawdown_percent for accurate DD reporting
Previous version showed incorrect DD values
Performance metrics now accurately reflect trading results
Performance Note:
Strategy tested with Fast/Slow SMA 13/377
Test conducted with 10% equity risk allocation
Daily Timeframe
For Beginners - How to Modify SMA Levels:
Find this line in the code:
fastLength = input.int(title="Fast SMA Length", defval=5, options= )
To add a new Fast SMA period: Add the number to the options list, e.g.,
To remove a Fast SMA period: Remove the number from the options list
For Slow SMA, find:
slowLength = input.int(title="Slow SMA Length", defval=100, options= )
Modify the options list the same way
⚠️ Note: Keep the periods that make sense for your trading timeframe
💡 Tip: Test any new combinations thoroughly before live trading
"Trade with Discipline, Manage Risk, Stay Consistent" - tradeviZion

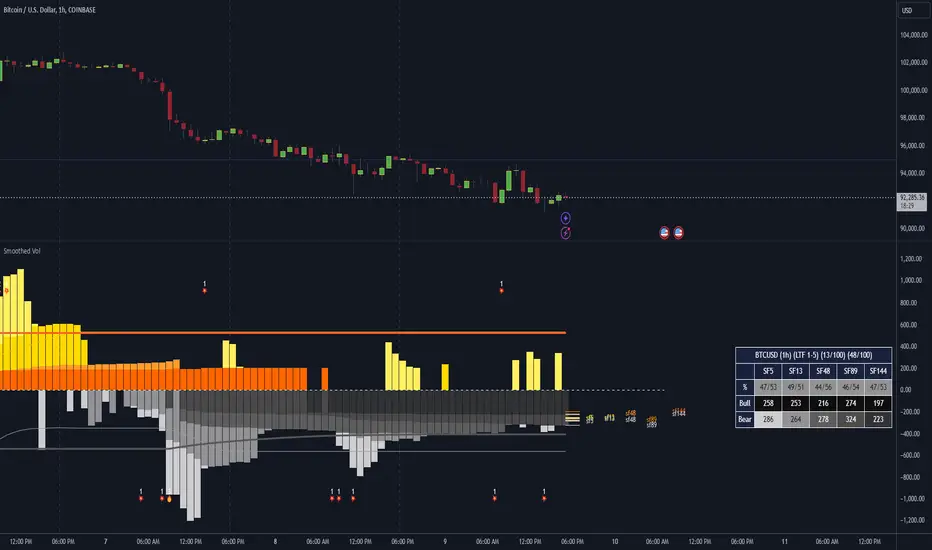
Dominant Smoothed Volume Pro Smoothed Volume Pro provides a useful tool designed to provide traders with a deeper understanding of market dynamics by analyzing buy and sell volume across multiple timeframes. Unlike traditional volume indicators, this script normalizes volume data from lower timeframes to align with the current chart's timeframe, providing an apples-to-apples comparison. The result is a visual histogram representation of the dominant buy or sell activity, smoothed over 5 different periods to reflect momentum shifts and enhance clarity.
Core Methodology
1. Multi-Timeframe Volume Analysis
This indicator leverages data from five different lower timeframes, each chosen dynamically based on the current chart's timeframe. By aggregating and normalizing these granular data points, the indicator captures subtle shifts in buy and sell volume that might otherwise go unnoticed. This multi-timeframe approach allows for a more detailed and accurate representation of market activity.
2. Data Normalization
Normalization is a critical component of this indicator. It ensures that volume data from lower timeframes is scaled appropriately to match the total volume of the current chart's timeframe. This step eliminates discrepancies caused by varying time intervals, providing a more meaningful comparison of volume trends across different periods.
3. Smoothing for Momentum Representation
The indicator employs five customizable smoothing factors to smooth out noisy volume data.
Each smoothing factor is distinctly color-coded in the histogram and table for intuitive analysis, helping traders quickly identify prevailing trends.
Features and Benefits
➖Customizable Smoothing Factors: Choose from five different smoothing factors, each with its unique settings for line styles, colors, and extensions.
➖Normalized Buy and Sell Volume: Displays normalized buy and sell volumes as a percentage of total activity, aiding in quick decision-making.
➖Visual Cues: Color-coded columns and labels help identify dominant trends at a glance, with high-opacity fills for visual clarity.
➖Dynamic Table: A built-in table summarizes smoothed volume data for each smoothing factor, offering a quick overview of bullish and bearish percentages.
➖Momentum Signals: Detect significant shifts in volume momentum with visually distinct alerts for high relative volumes, including special symbols like "⚡" and "🔥."
Practical Applications
➖Identifying Market Sentiment: Quickly determine whether the market is dominated by buyers or sellers at any given moment.
➖Spotting Reversals: Use momentum shifts in smoothed volume to anticipate potential trend reversals.
➖Enhancing Entry and Exit Points: Combine this indicator with other technical tools to refine entry and exit points in your trading strategy.
Why This Indicator Stands Out
Many existing volume indicators focus solely on raw or single-timeframe data, which can be misleading or incomplete. This indicator sets itself apart by:
Utilizing multi-timeframe data to provide a holistic view of market activity.
Applying robust normalization techniques to ensure data consistency.
Offering advanced smoothing options to emphasize actionable momentum signals.
This unique combination of features makes it an indispensable tool for traders seeking to enhance their market analysis and decision-making process.
As always, by combining the Smoothed Volume Pro with other tools, traders ensure that they are not relying on a single indicator. This layered approach can reduce the likelihood of false signals and improve overall trading accuracy.
Here's an additional visual representation using the plot fills:
Correlation Pro
Smart Correlation Pro is an indicator for assessing the correlation between two assets in the market. It analyzes correlation over a selected period and provides traders with flexible tools for making informed decisions.
Key Features:
1. Correlation coefficient (-1 to 1):
• 1: Perfect positive correlation (movement in the same direction).
• 0: No correlation (assets are independent).
• -1: Perfect negative correlation (movement in opposite directions).
2. Dynamic analysis:
• Changes the color of the line depending on the strength of the correlation:
• Green — high positive correlation.
• Red — high negative correlation.
• Gray — weak or no correlation.
3. Trading signals:
• Automatic alerts when important correlation levels are reached (> 0.8 or < -0.8).
• Visual cues for identifying potential entry points or risk diversification.
4. Customizable settings:
• Compare any two assets (e.g., BTC and ETH).
• Ability to choose the correlation calculation period.
Who it’s for:
• Traders analyzing coin movements in the cryptocurrency market.
• Investors looking for the strongest or weakest assets for their portfolio.
• Those working with hedging or diversification strategies.
How to Use:
1. Set the second asset in the indicator settings.
2. Analyze the correlation change on the chart:
• High positive correlation → similar price movement, opportunity for hedging.
• High negative correlation → opposite movement, suitable for diversification.
• Low correlation → independence of assets, opportunity to choose the stronger asset.
Benefits:
• Easy to use.
• Instant analysis of asset correlations.
• Increases decision-making accuracy in the market.
(Опис:
Smart Correlation Pro — це індикатор для оцінки взаємозв’язку між двома активами на ринку. Він аналізує кореляцію за обраним періодом та надає трейдерам гнучкі інструменти для ухвалення обґрунтованих рішень.
Основні можливості:
1. Коефіцієнт кореляції (-1 до 1):
• 1: Ідеальна позитивна кореляція (рух в одному напрямку).
• 0: Відсутність кореляції (активи незалежні).
• -1: Ідеальна негативна кореляція (рух у протилежних напрямках).
2. Динамічний аналіз:
• Змінює колір лінії залежно від сили кореляції:
• Зелений — висока позитивна кореляція.
• Червоний — висока негативна кореляція.
• Сірий — слабка або відсутня кореляція.
3. Сигнали для трейдингу:
• Автоматичні оповіщення при досягненні важливих рівнів кореляції (> 0.8 або < -0.8).
• Візуальні підказки для визначення можливих точок входу або диверсифікації ризиків.
4. Гнучкість налаштувань:
• Порівнюйте будь-які два активи (наприклад, BTC та ETH).
• Можливість обирати період розрахунку кореляції.
Кому підходить:
• Трейдерам, які аналізують рух монет на криптовалютному ринку.
• Інвесторам, що шукають найсильніші або найслабші активи для портфеля.
• Тих, хто працює з хеджуванням або диверсифікацією.
Як використовувати:
1. Встановіть другий актив у параметрах індикатора.
2. Аналізуйте зміну кореляції на графіку:
• Висока позитивна кореляція → схожий рух цін, можливість хеджування.
• Висока негативна кореляція → протилежний рух, підходить для диверсифікації.
• Низька кореляція → незалежність активів, можливість вибору сильнішого активу.
Переваги:
• Простота у використанні.
• Миттєвий аналіз взаємозв’язків між активами.
• Підвищує точність рішень на ринку.)

Chandelier Exit Pro w/ExtensionsChandelier Exit Pro w/Extensions
The Chandelier Exit Pro w/Extensions indicator is designed to assist traders in managing risk and identifying trend reversals. The strategy is based on the Chandelier Exit concept, originally created by Charles Le Beau. It uses the Average True Range (ATR) to calculate dynamic stop levels that adjust based on market volatility. This script not only implements the standard Chandelier Exit, but also introduces extension levels and alerts to enhance decision-making.
Key Features:
➡️Dynamic Stop Levels: The indicator calculates stop levels for both long and short positions based on an ATR multiple. This allows traders to determine exit points by monitoring when the price crosses above or below these levels. These levels adapt in real-time based on price volatility, making them a versatile tool for trend-following strategies.
➡️Extension Levels: In addition to the primary stop levels, the script includes extension levels for more advanced stop-loss management. Traders can view active and extension levels separately, providing more flexibility in their exit strategies.
➡️Labels and Visual Cues: The indicator provides dynamic labels that automatically update and follow the plotted stop levels. Labels include the ATR multiplier value (e.g., "2.5" or "2.5ext"), clearly showing the significance of each level. When price crosses below or above a level, the corresponding label is highlighted, aiding traders in quickly identifying the most relevant stop level.
➡️Bar Confirmation and Alerts: The script includes an "await bar confirmation" option to ensure that the stop levels and alerts only trigger after the bar has closed. Alerts are customizable and will notify traders when price crosses critical levels, helping to make timely decisions without the need to constantly monitor charts.
➡️Multiple ATR Levels for Enhanced Precision: The indicator supports up to four different ATR levels, each with customizable multipliers. This allows traders to set different thresholds for exits based on varying degrees of volatility. For example, Level 1 (2.5x ATR) might represent a tighter stop, while Level 4 (10x ATR) could serve as a wider stop for long-term positions.
➡️Calc_bars_count: Improves efficiency of the indicator by reducing the on-chart calculations in to the past. This input can be found at the bottom of the INPUTS tab.
How it Helps Traders:
💥Trend Identification: By using the Chandelier Exit levels, traders can identify when the trend is likely to reverse. When the price crosses below the stop level in a long trade or above the stop level in a short trade, it signals a potential exit point.
💥Volatility-based Adjustments: Unlike static stop-loss methods, the ATR-based stop levels dynamically adjust based on the market’s volatility. This means tighter stops during low volatility periods and wider stops during high volatility periods, reducing the chance of being stopped out prematurely.
💥Risk Management: The dynamic stop levels and extension levels provide a structured way to manage risk. Traders can set tighter stops for short-term trades and wider stops for longer-term trades. The script's visual labels make it easy to track these levels in real-time.
💥Automation with Alerts: The built-in alert system ensures that traders are notified when key levels are crossed. This helps to avoid emotional decision-making and allows for better execution of trading strategies.
Confluence and Price Fluidity:
One of the powerful ways to enhance the effectiveness of the Chandelier Exit indicator is by using it in conjunction with other technical analysis tools to create confluence. Confluence occurs when multiple indicators or price action signals align, providing stronger confirmation for a trade decision. For example:
🎯Support and Resistance Levels: Traders can use the Chandelier Exit levels in combination with key support and resistance zones. If the price is nearing a support level and the Chandelier Exit signals a bullish reversal, this alignment strengthens the case for entering a long position.
🎯Moving Averages: When the Chandelier Exit signals a trend reversal and this is confirmed by a crossover in moving averages (such as a 50-day and 200-day moving average), traders gain additional confidence in the trade direction.
🎯Momentum Indicators: Traders can also look for momentum indicators like RSI or MACD to confirm the strength of a trend or potential reversal. For instance, if the Chandelier Exit triggers a short signal and the RSI also shows overbought conditions, this could provide stronger confirmation to exit a long trade or enter a short position.
🎯Candlestick Patterns: Price fluidity can be monitored using candlestick formations. For example, a bearish engulfing pattern near a Chandelier Exit resistance level offers confluence, adding confidence to the signal to close or short the trade.
By combining the Chandelier Exit with other tools, traders ensure that they are not relying on a single indicator. This layered approach can reduce the likelihood of false signals and improve overall trading accuracy.
Practical Use Case:
Imagine a trader enters a long position, and the price moves favorably. Using the Chandelier Exit, the trader sets the initial stop level at 2.5x ATR below the highest close. As the price continues to rise, the stop level follows the price, locking in profits. If the market suddenly turns, the price crossing below the stop level signals an exit, helping the trader preserve gains. With extension levels, the trader can further refine exits, adjusting based on their risk tolerance and market conditions.
Good luck and I hope that you can find a place in your tool bag to use this dynamic indicator 🙏

DB Change Forecast ProDB Change Forecast Pro
What does the indicator do?
The DB Change Forecast Pro is a unique indicator that uses price change on HLC3 to detect buy and sell periods along with plotting a linear regression price channel with oversold and undersold zones. It also has a linear regression change forecast mode to optionally project market direction.
Change is calculated by taking a two-bar change of HLC3 and dividing that by the price or, optionally, a fixed divisor.
A fast-moving change cloud is then calculated and displayed as the "regular version" plot (shown in light gray). When the cloud bottom is above low, a buy zone is detected. When the cloud top is below the high, a sell zone is detected.
The linear regression price channel is calculated similarly but using a much slower change rate. The linear regression price channel shows reasonable high, low and HLC3 ranges. At the bar's opening, the channel will be more compact and come fairly accurate about 1/4 into the bar timeframe.
The change forecasted price is projected on the right side of the current bar to indicate the current timeframe direction. Please note this forecasting feature is shown in orange when it's early in the timeframe and gray when the timeframe is more likely to produce an accurate direction forecast for the upcoming bar.
You can use these projected dashed lines to see possible market movements for the Current bar and possible market direction for the next bar. Kindly note these projects change; they should be used to understand possible extreme highs/lows for the current bar or market direction.
The indicator includes an optional change forecast projection feature hidden by default. It will project the market forecast channel with an offset of 1. The forecast is defaulted to an offset of 1 to show market direction. However, you can modify to zero the offset to show the current bar forecast and forecast history.
How should this indicator be used?
First, very important,
1. Settings > Set Symbol to Desired
2. Settings > Set High Timeframe to "Chart"
3. Settings > Ensure "Use price as divisor" is checked.
It's recommended to use this indicator in higher timeframes. Buy and sell signals are displayed in real-time. However, waiting until 1/4 to 1/2 into the current bar is recommended before taking action, and change can happen.
The buy/sell signals (zones) provide recommendations on playing a long vs. a short. When in a buy sone, only play longs. When in a sell zone, only play shorts.
Then use the linear regression price channel oversold and undersold zones to optionally open and close positions within the buy/sell zones.
For example, consider opening a long in a buy zone when the linear regression price channel shows undersold. Then consider closing the long when the price moves into the linear regression oversold or higher. Then repeat as long as it's in the buy zone. Then vice versa for sell zones and shorting.
At basic design, buy in the buy zone, sell or short in the sell zone. If you are up for higher trading frequencies, use the linear regression price channel as described in the example above.
Please note, as, with all indicators, you may need to adjust to fit the indicator to your symbol and desired timeframe.
This is only an example of use. Please use this indicator as your own risk and after doing your due diligence.
Does the indicator include any alerts?
Yes,
"DB CFHLC3: Signal BUY" - Is triggered when a buy signal is fired.
"DB CFHLC3: Signal SELL" - Is triggered when a sell signal is fired.
"DB CFHLC3: Zone BUY" - Is triggered when a buy zone is detected.
"DB CFHLC3: Zeon SELL" - Is triggered when a sell zone is detected.
"DB CFHLC3: Oversold SELL" - Is triggered when the price exceeds the oversold level.
"DB CFHLC3: Undersold BUY" - Is triggered when the price goes below the undersold level.
Any other tips?
Once you have configured the indicator for your symbol and chart timeframe. Meaning the plots are displayed over the price. Check out larger timeframes such as W, 2W, 3W, 4W, M, and 4M. It works wonderfully for showing market lows and highs for long-term investing too!
Another, tip is to combine it with your favorite indicator, such as TTM Squeeze or MACD for confirmation purposes. You may be surprised how fast the indicator shows market direction changes on higher timeframes.
You can just as easily use a high timeframe such as D, 2D, or 3D for day trading due to how the linear price channel works.
Why am I not selling this indicator?
I would like to bless the TradingView community, and I enjoy publishing custom indicators.
If you enjoy this indicator, please consider leaving a thumbs up or a comment for others to know about your experience or recommendations.
Enjoy!
Lawyers Trend ProThis indicator basilcy has 2 sections
A. Lawyers Trend Pro
B. Lawyers Band
A. Lawyers Trend Pro
This indicator basicly using 2 different calculations average.
And you can see this average as line on this script.
This line has 2 functions
1. Buy and Sell Strategy
-İf the line colored BLUE this means you can BUY
-İf the line colored RED this means you can SELL
As you can see the picture you can buy and sell with this line
2. Support and Resistance Function
You can use the line as resistance and support.
B. Lawyer's Band
This indicator has 3 bands
1. Upper Band
2. Middle Band
3. Lower Band
1. Upper Band
Average of Moving Average of the Close (add Standard Deviations) and Highest price reached in the prior period
2. Middle Band
Average of upper and middle bands. And middle band also has BUY-SELL function. If middle band is blue you can BUY and if the middle band colored red you can SELL
3. Lower Band
Average of Moving Average of the Close(subtract Standard Deviations) and Lowest price reached in the prior period
Upper and Lower bands can be used for BUY&SELL strategy.
You can buy when price touches the lower band
You can sell when price touches the upper band
Indicator can work with long and short positions aswell
As you can see when price touches the lower band you can be LONG
and when the price touches the upper band you can be SHORT
When stock prices continually touch the upper Lawyers Band, the prices are thought to be overbought; conversely, when they continually touch the lower band, prices are thought to be oversold, triggering a buy signal. When using Lawyers Bands, designate the upper and lower bands as price targets.

REBOTE PRO EMA
//@version=5
indicator(title="REBOTE PRO EMA", overlay=true)
// === CONFIGURACIÓN ===
emaRapida = input.int(20, "EMA Rápida")
emaLenta = input.int(50, "EMA Lenta (Tendencia)")
rsiPeriodo = input.int(14, "RSI Periodo")
// === CÁLCULOS ===
emaFast = ta.ema(close, emaRapida)
emaSlow = ta.ema(close, emaLenta)
rsiVal = ta.rsi(close, rsiPeriodo)
// === CONDICIONES DE TENDENCIA ===
tendenciaAlcista = emaFast > emaSlow
tendenciaBajista = emaFast < emaSlow
// === CONDICIONES DE REBOTE ===
reboteBuy = tendenciaAlcista and low <= emaFast and close > emaFast and rsiVal > 40
reboteSell = tendenciaBajista and high >= emaFast and close < emaFast and rsiVal < 60
// === GRÁFICOS ===
plot(emaFast, color=color.orange, linewidth=2)
plot(emaSlow, color=color.red, linewidth=2)
// === SEÑALES ===
plotshape(reboteBuy,
title="BUY",
style=shape.triangleup,
location=location.belowbar,
color=color.lime,
size=size.small)
plotshape(reboteSell,
title="SELL",
style=shape.triangledown,
location=location.abovebar,
color=color.red,
size=size.small)

REBOTE PRO EMA//@version=5
indicator(title="REBOTE PRO EMA", overlay=true)
// === CONFIGURACIÓN ===
emaRapida = input.int(20, "EMA Rápida")
emaLenta = input.int(50, "EMA Lenta (Tendencia)")
rsiPeriodo = input.int(14, "RSI Periodo")
// === CÁLCULOS ===
emaFast = ta.ema(close, emaRapida)
emaSlow = ta.ema(close, emaLenta)
rsiVal = ta.rsi(close, rsiPeriodo)
// === CONDICIONES DE TENDENCIA ===
tendenciaAlcista = emaFast > emaSlow
tendenciaBajista = emaFast < emaSlow
// === CONDICIONES DE REBOTE ===
reboteBuy = tendenciaAlcista and low <= emaFast and close > emaFast and rsiVal > 40
reboteSell = tendenciaBajista and high >= emaFast and close < emaFast and rsiVal < 60
// === GRÁFICOS ===
plot(emaFast, color=color.orange, linewidth=2)
plot(emaSlow, color=color.red, linewidth=2)
// === SEÑALES ===
plotshape(reboteBuy,
title="BUY",
style=shape.triangleup,
location=location.belowbar,
color=color.lime,
size=size.small)
plotshape(reboteSell,
title="SELL",
style=shape.triangledown,
location=location.abovebar,
color=color.red,
size=size.small)

REBOTE PRO May//@version=5
indicator(title="REBOTE PRO EMA", overlay=true)
// === CONFIGURACIÓN ===
emaRapida = input.int(20, "EMA Rápida")
emaLenta = input.int(50, "EMA Lenta (Tendencia)")
rsiPeriodo = input.int(14, "RSI Periodo")
// === CÁLCULOS ===
emaFast = ta.ema(close, emaRapida)
emaSlow = ta.ema(close, emaLenta)
rsiVal = ta.rsi(close, rsiPeriodo)
// === CONDICIONES DE TENDENCIA ===
tendenciaAlcista = emaFast > emaSlow
tendenciaBajista = emaFast < emaSlow
// === CONDICIONES DE REBOTE ===
reboteBuy = tendenciaAlcista and low <= emaFast and close > emaFast and rsiVal > 40
reboteSell = tendenciaBajista and high >= emaFast and close < emaFast and rsiVal < 60
// === GRÁFICOS ===
plot(emaFast, color=color.orange, linewidth=2)
plot(emaSlow, color=color.red, linewidth=2)
// === SEÑALES ===
plotshape(reboteBuy,
title="BUY",
style=shape.triangleup,
location=location.belowbar,
color=color.lime,
size=size.small)
plotshape(reboteSell,
title="SELL",
style=shape.triangledown,
location=location.abovebar,
color=color.red,
size=size.small)

Candle Rush ProCandle Rush Pro highlights strong directional price moves formed by consecutive candles of the same direction.
The indicator tracks runs of bullish or bearish candles and measures the total price displacement of each run.
When the movement exceeds a user-defined threshold (in ticks/pipettes), it marks the chart with a clear visual signal.
🔹 Core features:
• Detects consecutive bullish and bearish candle runs
• Measures total displacement using Open–Close or High–Low range
• Signals only once per run (no repeated spam)
• Optional doji handling (ignore or break the run)
• Clean triangle markers anchored to candles
• Optional display of bar count per run
• Adjustable marker and text size
• Works on any timeframe and any symbol
• Non-repainting
🔹 Doji handling:
Users can choose whether doji candles should:
• Break the run
• Or be ignored (treated as neutral)
🔹 Typical use cases:
• Momentum detection
• Impulse move identification
• Breakout confirmation
• Trade filtering
• Market structure analysis
🔹 How it works:
A signal is plotted when:
• A minimum number of consecutive candles move in the same direction
• The total price displacement of the run exceeds the selected threshold
• The run has not already been signaled
This indicator does not predict direction.
It visually highlights significant directional price movement already in progress.
Best used together with:
• Trend filters
• Support & resistance
• Moving averages
• Market structure tools

EMA VWAP Pro StrategyEMA VWAP Pro Strategy - Quick Summary
What it does: Generates CALL/PUT signals for day trading (designed for SPY options on 1-5 min charts)
Entry Criteria:
EMA 9 crosses above EMA 20 → CALL
EMA 9 crosses below EMA 20 → PUT
Must be confirmed by VWAP (price above for calls, below for puts)
Requires elevated volume (1.2x average)
Needs 3 candles of confirmation
Optional: 15-min timeframe must agree
Time Filters:
Trades: 10am-12pm ET & 3-3:45pm ET only
Avoids: First 15 min after open & lunch hours
Quality Score (1-5 stars):
Higher score = stronger setup
Only shows signals rated 3+ stars
4-5 star signals highlighted as "strong"
Best for: Scalping SPY 0DTE options during high-probability windows with multiple confirmations.


BTC Accum/Dist BUY SELL PRO(ZeeShan)BTC Accum/Dist BUY SELL PRO is a volume-based indicator designed for Bitcoin. It uses Accumulation/Distribution with EMA cross and trend slope to highlight smart-money buying and selling zones, showing clear BUY/SELL arrows, trend background, and alerts.

Institutional Confluence Nexus [Pro]The Problem: Noise vs. Signal
In the world of Smart Money Concepts (SMC), traders are often overwhelmed by "chart clutter." Standard indicators blindly highlight every Fair Value Gap (FVG) and Order Block (OB), regardless of whether the market is trending, ranging, or dead. This leads to analysis paralysis and low-probability entries.
The Institutional Confluence Nexus was built to solve this. It is not just a structure detector; it is a filtering engine. It uses a multi-factor model to hide low-probability zones and only highlight setups where Structure, Volume, and Momentum align.
The "Quantum" Integration
This script includes a built-in Quantum Regression Oscillator (QRO) engine running in the background. Unlike standard RSI or MACD which are reactive (lagging), the QRO uses Linear Regression mathematics to project momentum trajectory.
By combining institutional structure (Price Action) with quantum momentum (Math), this tool generates specific high-probability signals that only appear when price action and momentum are in perfect agreement.
How It Works & Visual Guide
This indicator is a complete trading suite. Here is what every symbol and color on your chart represents:
1. The "Nexus" Reversal Signals (Triangles)
Symbol : Green Triangle (Up) / Red Triangle (Down) labeled NEXUS.
Logic : These appear when price taps a valid Order Block that aligns with the macro trend (200 EMA).
Meaning : These are your primary "Trend Join" setups. They indicate that the institutional trend is resuming after a retracement.
2. High-Volume Breakouts (Bar Colors)
Symbol : Yellow Candles (Bullish) / Orange Candles (Bearish).
Logic : The script detects when a Break of Structure (BOS) occurs with Above-Average Volume.
Meaning : A breakout without volume is often a fakeout. These colored bars confirm that institutions are fueling the move. If you see a Yellow bar, it means "Smart Money" is buying the breakout.
3. QRO Confluence Signals (Labels)
These are the most advanced signals in the suite, combining Price Action with the internal Oscillator:
SNIPER (Blue/Purple) : The strongest reversal signal.
Condition : Price taps a Fair Value Gap + The internal QRO is at extreme volatility bands (Oversold/Overbought).
PB BUY / PB SELL (Aqua/Orange) : A trend continuation signal.
Condition : Price pulls back into a Fair Value Gap + The internal QRO confirms momentum is still healthy (above/below midline).
Note : These signals automatically draw a Red Line at the invalidation point (Stop Loss) to help you manage risk immediately.
4. The Confluence Dashboard
A non-intrusive Heads-Up Display (HUD) in the corner gives you a snapshot of the market state:
Trend : Is price above/below the 200 EMA?
Volume : Is current volume anomalous (High) or normal?
Structure : Are we breaking up, down, or ranging?
Settings & Customization
Smart Money Structure: Toggle FVGs and Order Blocks on/off.
FVG Extend: Control how far the gap "zones" extend to the right to see them as support/resistance zones.
Volume Filter: Enable/Disable the volume requirement (Keep enabled for higher strike rate).
Risk Management: Adjust the "Lookback" period for the automatic Stop Loss lines.
For Developers (Open Source)
I have kept the code open-source to foster learning in the Pine Script community. You can study how:
ta.linreg is used to smooth RSI data for the internal QRO engine.
box.new and line.new are used for dynamic drawing and extending zones.
var variables are used to store historical FVG levels to detect precise crossovers.
Disclaimer:
This tool is designed to assist with technical analysis and educational purposes. It does not guarantee profits. Always manage your risk and use this in conjunction with your own analysis.

NVentures Liquidity Radar ProInstitutional Liquidity Radar Pro
OVERVIEW
This indicator combines three institutional trading concepts into a unified confluence scoring system: Liquidity Zones (swing-based), Order Blocks, and Fair Value Gaps. The unique value lies not in these individual concepts, but in HOW they interact through the confluence scoring algorithm to filter high-probability zones.
HOW THE CONFLUENCE SCORING WORKS
The core innovation is the calcConfluence() function that assigns a numerical score to each detected level:
1. Base Score: Every swing pivot starts with score = 1
2. Zone Overlap Detection: The algorithm iterates through all active zones within confDist * ATR proximity. Each overlapping zone adds +1 to the score
3. Order Block Proximity: If an Order Block's midpoint (top + bottom) / 2 falls within the confluence distance, +1 is added
4. HTF Validation: Using request.security(), the indicator fetches higher timeframe swing pivots. If the current zone aligns with an HTF swing within 2 * confDist * ATR_htf, a +2 bonus is awarded
Zones scoring 4+ are highlighted as high confluence - these represent areas where multiple institutional concepts converge.
HOW LIQUIDITY ZONES ARE CALCULATED
Detection: ta.pivothigh() and ta.pivotlow() with configurable lookback (default: 5 bars left/right)
Zone Width - Three modes available:
- ATR Dynamic: ATR(14) * multiplier (default 0.25)
- Fixed %: close * (percentage / 100)
- Wick Based: max(upperWick, lowerWick) * 1.5
Proximity Filter: isTooClose() prevents clustering by enforcing minimum ATR * minATRdist between zones
HOW ORDER BLOCKS ARE DETECTED
The detectBullishOB() / detectBearishOB() functions identify the last opposing candle before an impulse move:
1. Check if candle is opposing direction (bearish before bullish impulse, vice versa)
2. Validate consecutive candles in impulse direction (configurable, default: 3)
3. Volume confirmation: volume >= volMA * volMult (using 50-period SMA)
4. Minimum move validation: abs(close - close ) > ATR
This filters out weak OBs and focuses on those with institutional volume footprints.
HOW FAIR VALUE GAPS ARE DETECTED
FVGs represent price imbalances:
- Bullish FVG: low - high > ATR * fvgMinSize
- Bearish FVG: low - high > ATR * fvgMinSize
The ATR-relative sizing ensures gaps are significant relative to current volatility.
HOW SWEEP DETECTION WORKS
The checkSweep() function identifies false breakouts through wick analysis:
1. Calculate wick percentage: upperWick / totalRange or lowerWick / totalRange
2. Sweep conditions for resistance: high > zone.upper AND close < zone.price AND wickPct >= threshold
3. Sweep conditions for support: low < zone.lower AND close > zone.price AND wickPct >= threshold
A sweep indicates liquidity was grabbed without genuine continuation - often preceding reversals.
HOW FRESHNESS DECAY WORKS
The calcFreshness() function implements linear decay:
freshness = 1.0 - (age / decayBars)
freshness = max(freshness, minFresh)
This ensures old, tested zones fade visually while fresh zones remain prominent.
WHY THESE COMPONENTS WORK TOGETHER
The synergy is based on the principle that institutional activity leaves multiple footprints:
- Swing Pivots = where retail stops cluster
- Order Blocks = where institutions entered
- FVGs = where aggressive institutional orders created imbalances
- HTF Alignment = where higher timeframe participants are active
When these footprints converge at the same price level (high confluence score), the probability of significant price reaction increases.
CONFIGURATION
- Swing Detection Length: 5-8 for intraday, 8-15 for swing trading
- HTF Timeframe: One level above trading TF (e.g., D for H4)
- Min Confluence to Display: 2 for comprehensive view, 3-4 for high-probability only
- FVGs: Disabled by default for cleaner charts
STATISTICS PANEL
Displays: Active resistance/support zones, high confluence count, swept zones, active OBs, active FVGs, current ATR, selected HTF.
ALERTS
- Price approaching high confluence zone
- Liquidity sweep detected
- Bullish/Bearish Order Block formed
- Bullish/Bearish FVG detected
TECHNICAL NOTES
- Uses User-Defined Types (UDTs) for clean data structure management
- Respects Pine Script drawing limits (500 boxes/labels/lines)
- All calculations are ATR-normalized for cross-market compatibility

Axis-Pro System | Trend Structure + Fibonacci Pullbacks Axis-Pro System is a comprehensive Trend Following strategy designed to trade high-probability pullbacks. Unlike indicators that merely chase price, this system patiently waits for market structure alignment before seeking an entry.
The system is built on the premise of "Quality over Quantity", utilizing volatility and structure filters to avoid choppy markets (ranges) and false breakouts.
🧠 Strategy Logic
The system makes decisions based on a strict 4-step hierarchy:
Higher Timeframe (HTF) Bias:
Analyzes the trend on a higher timeframe to ensure we are trading in the direction of the dominant flow.
Structure & BOS (Break of Structure):
Identifies clear impulses that break previous highs or lows. Once a BOS is confirmed, the system "arms" the trade and waits.
Fibonacci Zone Pullback:
It does not chase the breakout. Instead, it waits for a pullback into the "Discount Zone" (Golden Zone, configurable between 0.382 and 0.618) to improve the Risk/Reward ratio.
Validation & Trigger:
Uses an ATR expansion check to filter out low-volatility periods.
Requires candle confirmation and alignment with fast EMAs before pulling the trigger.
🛡️ Risk Management
The system incorporates advanced position management using a split execution model (50/50):
Dynamic Stop Loss: Automatically calculated using an ATR multiplier or the recent Swing High/Low (whichever offers better protection).
TP1 (Take Profit 1): Closes 50% of the position at a fixed R-multiple (e.g., 1.5R) to lock in profit and moves the Stop Loss to Break-Even.
TP2 (Runner): The remaining 50% is left to run for higher targets (e.g., 3.0R) or until the trend bends, maximizing gains during strong moves.
Trailing Stop: Optional feature to trail price with a fast EMA once the first target is hit.
⚙️ Settings & Features
The script is highly customizable for different assets (Crypto, Forex, Indices):
Date Range Filter: Includes a date selector to perform precise Backtesting on specific periods (e.g., testing specifically during a Bear Market vs. Bull Market).
Auto Trendlines: Automatically draws relevant trendlines for visual support.
Quality Filters: Options to toggle the EMA 200 filter and breakout buffers.
⚠️ Disclaimer
This strategy is a tool for analysis and backtesting purposes. Past performance does not guarantee future results. It is highly recommended to test the strategy on a Demo account first and adjust parameters according to the volatility of the specific asset being traded. Always use responsible risk management.

CURRY HEDGEFUND PRO (MTF/VWAP/ADX + Tight Trail) [no ta.adx]Improved HedgeFund Pro Script by Tony Curry for momentum and reversal trading. Primarily focused on ADX and directional movement.

james S/R Trend Pro v6//@version=6
strategy("james S/R Trend Pro v6", overlay=true,
initial_capital=10000,
default_qty_type=strategy.percent_of_equity,
default_qty_value=100,
commission_type=strategy.commission.percent,
commission_value=0.05,
slippage=1)
// --- 사용자 입력 (Inputs) ---
group_date = "1. 백테스트 기간"
start_date = input.time(timestamp("2024-01-01 00:00:00"), "시작일", group=group_date)
end_date = input.time(timestamp("2026-12-31 23:59:59"), "종료일", group=group_date)
is_within_date = time >= start_date and time <= end_date
group_main = "2. 지표 설정 (S/R & Trend)"
lookback_sr = input.int(15, "지지/저항 탐색 기간", minval=5, group=group_main)
atr_period = input.int(14, "ATR 기간", group=group_main)
atr_mult = input.float(3.5, "추세선 민감도", step=0.1, group=group_main)
group_color = "3. 다크모드 색상 설정"
trend_up_color = input.color(color.rgb(200, 200, 200), "상승 추세선 (밝은 회색)", group=group_color)
trend_down_color = input.color(color.rgb(255, 255, 255), "하락 추세선 (흰색)", group=group_color)
res_color = input.color(#ff1100, "저항선 (네온 레드)", group=group_color)
sup_color = input.color(#00e1ff, "지지선 (네온 사이언)", group=group_color)
// --- 데이터 처리 (Calculations) ---
// 1. 추세선 (검은색 배경용 고대비 설정)
= ta.supertrend(atr_mult, atr_period)
// 2. 지지/저항선 (피벗 기반)
ph = ta.pivothigh(high, lookback_sr, lookback_sr)
pl = ta.pivotlow(low, lookback_sr, lookback_sr)
var float res_line = na
var float sup_line = na
if not na(ph)
res_line := high
if not na(pl)
sup_line := low
// --- 전략 로직 (Condition) ---
long_condition = direction < 0 and ta.crossover(close, sup_line)
short_condition = direction > 0 and ta.crossunder(close, res_line)
// --- 주문 실행 (Execution) ---
if is_within_date
if long_condition
strategy.entry("Long", strategy.long, comment="BUY")
if short_condition
strategy.entry("Short", strategy.short, comment="SHORT")
// 청산 로직
if strategy.position_size > 0
strategy.exit("TP-L", "Long", limit=res_line, qty_percent=50, comment="분할익절")
if ta.crossunder(close, trend_line)
strategy.close("Long", comment="추세이탈")
if strategy.position_size < 0
strategy.exit("TP-S", "Short", limit=sup_line, qty_percent=50, comment="분할익절")
if ta.crossover(close, trend_line)
strategy.close("Short", comment="추세이탈")
// --- 시각화 (Visualization - 다크 모드 최적화) ---
// 1. 추세선: 검은 배경에서 잘 보이도록 하얀색/회색 계열 사용
plot(trend_line, color=direction < 0 ? trend_up_color : trend_down_color, linewidth=2, title="Trend Line")
// 2. 지지/저항선: 네온 컬러로 시인성 극대화
plot(res_line, color=color.new(res_color, 0), style=plot.style_linebr, linewidth=2, title="Resistance")
plot(sup_line, color=color.new(sup_color, 0), style=plot.style_linebr, linewidth=2, title="Support")
// 3. 진입 시그널 라벨
plotshape(long_condition, style=shape.triangleup, location=location.belowbar, color=sup_color, size=size.small, title="Buy Label")
plotshape(short_condition, style=shape.triangledown, location=location.abovebar, color=res_color, size=size.small, title="Short Label")
// 4. 추세 배경색 (매우 옅게 설정하여 캔들을 방해하지 않음)
fill_color = direction < 0 ? color.new(sup_color, 90) : color.new(res_color, 90)
fill(plot(trend_line), plot(close), color=fill_color, title="Trend Fill")

CJ Oscillator Matrix PRO (Flow + Momentum + Heatmap)CJ Oscillator Matrix PRO is not a buy/sell signal indicator and does not follow price candle by candle.
It is a market context and momentum analysis tool designed to help traders understand trend strength, impulse, and overall market conditions.
This indicator combines momentum (TSI) and money flow (CMF) into a single oscillator, while the heatmap background highlights when the market is balanced or extended.
Strong colors represent high pressure or potential exhaustion zones, not automatic entries or reversals.
Use this tool to:
Identify trend direction and strength
Understand impulse vs. consolidation
Avoid chasing price during extended moves
Add context to your technical analysis
Best used alongside price action, structure, EMAs, and risk management.
This indicator does not predict price — it helps you understand market behavior.

SMC Liquidity Grab ProSMC LIquidity GRab Pro is an high probability strategy for the Smart Money Concept (SMC).
It looks for liquidity sweeps also known as stop hunts, where large financial institutions move the price beyond significant levels in order to trigger market orders and then reverse the price quickly.
Features
1. Liquidity Sweeps : It follows the previous 4 hour high/low liquidity in order to pinpoint stop runs.
2. Liquidity grab confirmation: Trade setup where price momentarily breaks through the liquidity level but then ends up again inside the range suggests that there’s been a false breakout.
3.Structure-Based Risk Management: Stop losses are placed beyond the latest swing high/low pivot, instead of basing it on a pip value.
- Live Performance Dashboard - Allows you to display real-time data such as net profit, win rate, and active trade on your chart.
-Customizable Risk-to-Reward- Traders can set risk/reward ratio as per their requirement. Default value is 2.0 RR. Graph Timeframe: This strategy is used on 5-minute or 15-minute charts.
Chart Timeframe: Apply the strategy to 5-minute or 15-minute charts.
HTF Configuration: Set the higher timeframe above your execution chart e.g., 240 minutes for 4-hours.
Fine-Tuning: Adjust the swing lookback parameter to adapt stop-loss placement according to market volatility.

Atilla EMA Cloud PRO (FINAL - FIXED)Atilla EMA Cloud PRO (FINAL – FIXED) is a professional trend-filtering indicator designed to eliminate noise and keep traders out of low-probability, sideways markets.
This indicator is built around a multi-EMA structure (EMA 9 / 21 / 35 / 55) combined with an ATR-based sensitivity filter and candle confirmation logic. Its primary goal is not to generate constant signals, but to clearly define when the market is worth trading — and when it is not.
Key Features:
Advanced EMA Cloud that defines clear NO-TRADE ZONES
ATR-based sideways market detection to suppress fake trends
Trend confirmation using momentum + candle structure
Adjustable sensitivity for different market conditions
Optimized for 15-minute charts, suitable for both crypto and forex
Designed to favor quality over quantity
How to use:
Trade only when price is outside the EMA Cloud
Ignore signals during gray / flat conditions
Focus on sustained color changes confirmed by EMA alignment
Best used with proper risk management and higher timeframe context
This indicator does not chase every move.
It waits for structure, momentum, and clarity.
Built for traders who value discipline, patience, and consistency over noise.
