PS3X MACD CompanionPS3X MACD Companion to be used as a visual tool alongside "Profit Sniper 3.0" Strategy, MACD Companion uses the standard MACD with signals for Histo cross & Histo change in % or absolute value to indicate trend changes.
If you would like access, please send me a PM.
Recherche dans les scripts pour "profit"

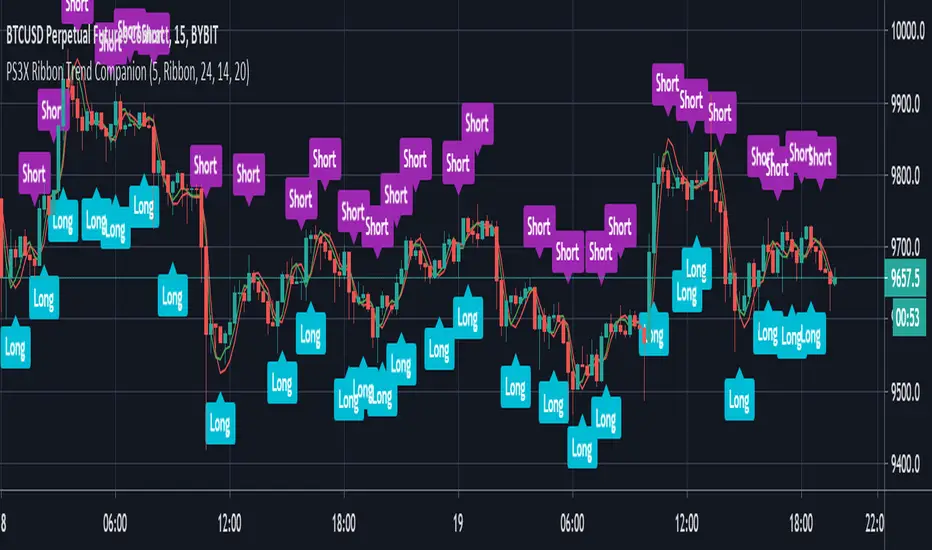
PS3X Ribbon Trend CompanionPS3X Ribbon Trend Companion indicator to use ideally on higher timeframes (HTF) to alert on trend changes and potential trade exits.
To be used as a visual tool alongside "Profit Sniper 3.0" Indicator to allow you to identify market changing between trending & ranging state and trade Long or Short accordingly, example use is on the 30 minute Heiken Ashi to identify bullish or bearish trends to guide lower timeframe trading plays.
If you would like access, please send me a PM.
PS3X BB CompanionTo be used as a visual tool alongside "Profit Sniper 3.0" Indicator to allow you to identify suitable exit points for trades relating to price crossing Bollinger Bands, example use is on the 30 minute chart to identify bullish or bearish trends to guide lower timeframe trading plays.
Send me a PM to get access.

PS3X BB CompanionPS3X BB Companion indicator to use ideally on higher timeframes (HTF) to alert on trend changes and potential trade exits.
To be used as a visual tool alongside "Profit Sniper 3.0" Indicator to allow you to identify suitable exit points for trades relating to price crossing Bollinger Bands, example use is on the 30 minute chart to identify bullish or bearish trends to guide lower timeframe trading plays.
Send me a PM to get access.

RSI LevelsRSI Levels
- The relative strength index ( RSI ) is a technical indicator used in the analysis of financial markets.
It is intended to chart the current and historical strength or weakness of a stock or market based on the closing prices of a recent trading period.
- This indicator allows us to visualize the levels of rsi in the chart, so that we can calculate take profit and stop points in a simple way,
knowing what position the price is currently in relation to these levels and how much space we have.
- We can also visualize the slope of the three levels of rsi , overbought, oversold and level 50, something that is not possible in the oscillator version.
- It allows you to display 2 rsi values at the same time.
- Allows to change the color of candlesticks based on rsi.

ATR based Stop and Take-Profit levels in realtime Little tool to quickly identify stops and take-profit levels based on Average True Range. User can change ATR multipiers, as well as the ATR length used. Green and red lines show these levels; plot is visible over last 8 bars only to reduce clutter. Label showing the current ATR, up above the last bar

Algorithm Builder UNIVERSAL (m30)Hello traders 👋
I. 💎 SCRIPTS ACCESS AND TRIALS 💎
1. Every 3 weeks trial request access has to be done through my website .
2. My website URL is in this script signature at the very bottom (you'll have to scroll down a bit and going past the long description) and in my profile status available here : Daveatt
3. Many video tutorials explaining clearly how all our indicators work are available on your website > guides section.
4. You may also contact me directly for more information regarding the trading method included in the indicator or how to access it
2.1 Forewords
This indicator/trading framework is available only to our PREMIUM users.
We decided to call it "UNIVERSAL" because the tool gives very decent signals for STOCKS/PENNY STOCKS/FOREX/CRYPTO (USD & BTC pairing)/INDICES/COMMODITIES trading
(the asset classes that I'm not listing are not tested yet; though we should cover a wide range of tradable assets here)
This is a by-product of defining an algorithmic trading method... we were surprised ourselves those past few weeks while trading with it.
The entries displayed are most of the time amazing, and the invalidations allow to reduce the losses considerably (more wins and less losses => delighted trader)
A few examples below showing why it's "universal"
FOREX
INDICES
COMMODITIES
CRYPTO (BTC pairing)
The tool works in m30 timeframe but won't work with any other timeframe . Even if applied on a 30-minutes chart; we included higher timeframe indicators to enter more securely.
It includes :
- our proprietary method with fixed entries
- a hard exit system (built-in stop-loss)
- 🔔 Compatible with dynamic alerts 🔔
Dynamic alerts are bringing automated trading to a whole new level. The third-party solutions capturing TradingView alerts are able to use them.
- (optional) we let the users decide to use or not our built-in Trade Manager.
Regardless of the Trade Manager is used or not, one must mandatory exit, once a vertical hard exit bar appears.
- the Algorithmic Supports and Resistances used as safeguards and take profit zones.
Final words
We made it as simple as we could (to be honest it's a very simple system for the end-user) - even with several hundreds of calculations in the indicator.
Please hit me up for any question/feedback/comment
Become the BEST trader that you can be
Dave

L&S PROFIT SCALP Indicator for scalp trades for TF 1-15 minutes. 1-4 signals per day depending on the currency pair. Suitable for all crypto exchanges, Forex, binary options. Signals+ take profit Levels.

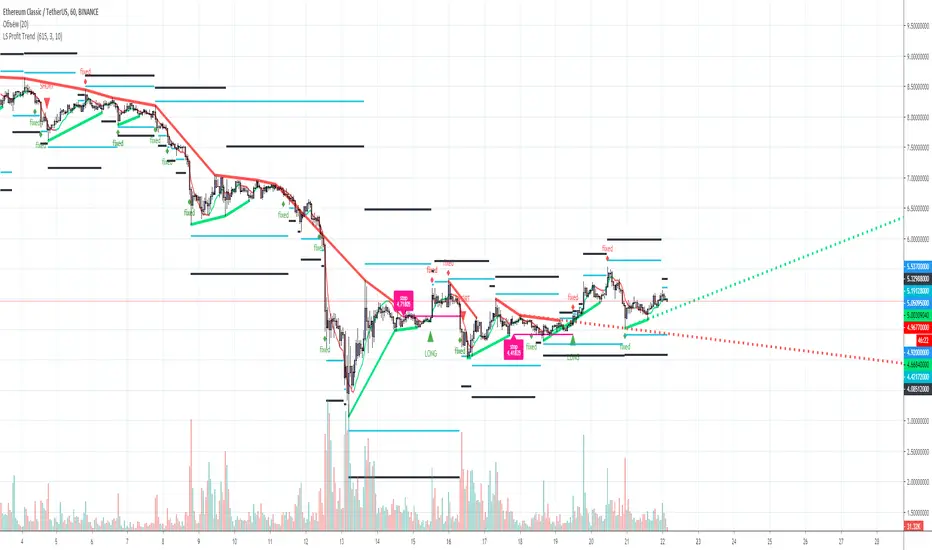
L&S PROFIT TREND Trend indicator for TF from 1 hour and above, for any trading pair, any exchange, binary options. Signals+ Take profit levels. 90% good signal and take profit 1.
P/L count for MACDSimple and effective P/L Count (based on MACD indicator) shows you when MACD give profit and when it lead to loss. PL Count consist of three plots: green (profit), red (loss) and orange (0 by default, but you can setup it as minimum profit level. Go into deal when green(profit) crossover red(loss) and exit when red crossover green. Use it together with MACD for determine deal direction. For some instruments deal opens when green crossover orange minimum profit level (not cross green and red)) .

HL ChannelHL Channel
- The channel shows the trend based on highs and lows, and possible points of take profit and exists
- Trend Indicator for Long and Short entries
- It can be used as a trend indicator or as a trailing stop loss
- Long and Short Labels and Alerts
- Configurable in Periods and Simple Mode
Simple Mode:


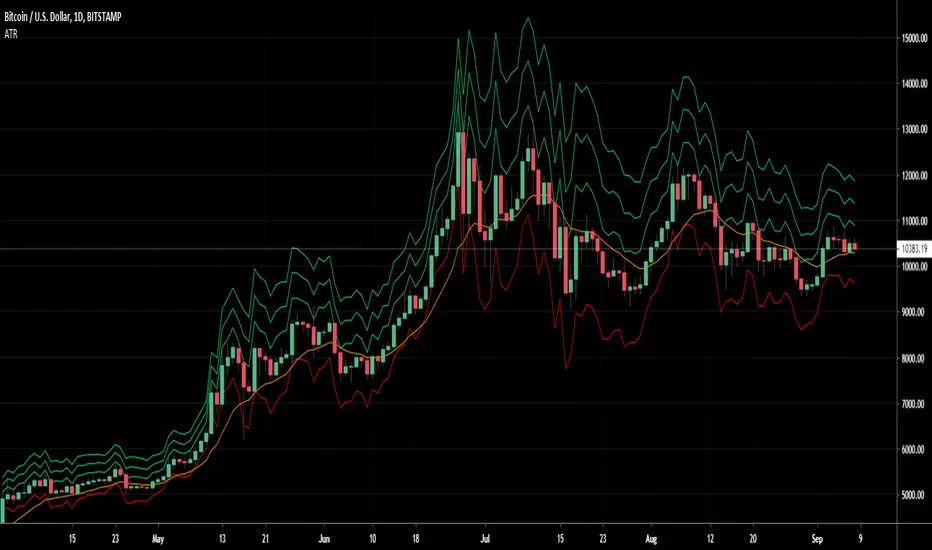
Average True Range Take profit (ATR)Average True Range Take Profit
An objective method of determining an initial Take Profit and Stop Loss, based on true market volatility and not arbitrary price levels.
Take Profit Levels and Stop Loss Levels are calculated based on multiples of Average True Range
Features & Functions
Option to switch between long or short
Default Value
Take Profit 1 = 1x ATR.
Take Profit 3 = 2x ATR.
Take Profit 5 = 3x ATR.
Stop Loss 2 = 1.5x ATR.
Basline 13 exponential moving average (EMA) (2)
Extra options ATR
Take Profit 2 = 1,5x ATR.
Take Profit 4 = 2,5x ATR.
Take Profit 6 = 3,5x ATR.
Take Profit 7 = 4x ATR.
Take Profit 8 = 4,5x ATR.
Take Profit 9 = 5x ATR.
Stop Loss 1 = 1x ATR.
Stop Loss 3 = 2x ATR.
Extra options MA
Simple moving average (SMA) (1)
Weighted Moving Average (WMA) (3)
Hull moving average (HMA) (4)
Volume Weighted Moving Average (VWMA) (5)
R moving average (RMA) (6)
Triple exponential moving average (TEMA) (7)
Crypto Break-even FeeWhen I started trading cryptocurrency, I lost money because I didn't take the fees enough into account. Therefore I created my own indicator to quicqly see the break-even selling price of the selling price if I want a predifined profit level.
2 lines are added to the graph. These lines move together with the current price.
- One line indicating the break-even selling price (depending on your maker/taker strategy). For beginners I suggest taking the taker strategy (mostly 0.25%)
- Another line indicating the selling price in order to make a predifined profit %
There are 2 parameters you can set:
- Desired profit (%)
- Maker/Taker Fee (%)
Always happy with a little appreciation ;-) Bitcoin wallet: 18522cAc7YDwwXTvtckXKb1kP33upVDRFR

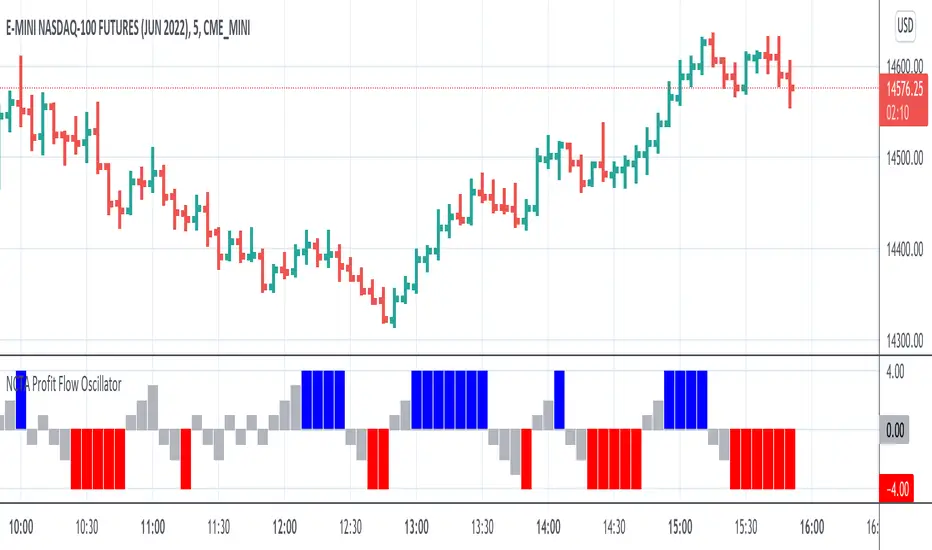
NCTA Profit Flow OscillatorProfit Flow Oscillator
The Profit Flow Oscillator is one of two technical pattern indicators that are part of the Profit Flow Analytics.
New Cycle Trading and Analytics is a group of traders creating market analytics for traders. The objective is to take complex combinations of multiple technical pattern indicators and present to the trader a simple, single signal entry.
The Profit Flow Oscillator is excellent in short 1, 3, and 5 minute timeframes for futures traders and short term options traders. Longer timeframes such as the 5, 10, and 30 minute timeframes work well for options traders.
The Profit Flow Oscillator consists of a simple, single entry indicator designed to provide an entry very close to the shift on the intra-day cycle. It is designed to filter out false signals and provide the trader with an optimum timing of an entry.
HOW TO USE: Go long when a blue bar appears and go short when a red bar appears. These prints very closely identify the beginning of a new cycle
The Profit Flow Oscillator, which is part of the Profit Flow Analytics set of indicators, is traded in a live trading room every market day, hosted by our friends at Options Money Maker.
To learn more and to get a free trial of the Profit Flow Oscillator, use the following link:
www.newcycletrading.com
NQU2019
SP:SPX
Pulse Profits+ Study v2.0Here is the updated version of our Pulse Profits+ study based on the combination of the Chande Momentum Oscillator and Elder's Force Index . This version was updated to include stop-loss and improved signals
Red background highlights mark sell signals and green highlights represent buy signals. All signals are accompanied by corresponding alerts that can be tailored for the various automated trading platforms.
All indicators can be found on our website in the bio and come with their strategy equivalents


High Profit RunIdentify regions of high profit runs. Long or short. The line shows the profit percent in the current run.
Those might be the places that it is wise to take a profit instead of waiting longer.
Or a reverse counter reaction could be expected.
Take ProfitThis simple indicator shows gains/ losses and profit taking opportunities for a strategy that consists of regularly investing a static sum to an asset (ex: adding $25 to BTC every week).
White = Investment (new money)
Green = Take-profit
Purple = Total Gains / Losses on + investment
Blue = Total Gains / Losses on + investment - take-profit
Red = Total Gains / Losses on - investment
Orange = Total Gains / Losses on - investment - take-profit
RedBG = Orange < 0
GreyBG = Weekend
Settings:
- Amount to invest each week
- Day of the week to invest (1 = Sunday, time is defaulted to 12:01 AM of that day)
- Amount at which to take profit
- Start time (This is calculated in weeks since UNIX Epoch; increasing the number by 1 means moving the start time forward 1 week)
Enjoy!

ATR based Pivots mcbwHey everyone this is an exciting new script I have prepared for you.
I was reading an old forex bulletin article some time ago when I came across this: solar.murty.net (or you can download the full bulletin with lots of other good articles here: www.forexfactory.com).
You can already buy this for metatrader (www.mql5.com) so I figured to make it for free for tradingview.
This bulletin suggested that you can reasonably predict daily volatility by adding or subtracting multiples of the daily ATR to the daily opening. Using this you can choose multiples to use as price targets and alternatively as stop losses. For example, if you already have a sense of market direction you can buy at market open place a stop loss at - 1 daily ATR and a profit target at + 3 ATRs for a risk to reward ratio of 3. If you are looking for smaller/quicker moves with a ratio of 3 you can have a stop loss at -0.25 ATR and a take profit at +0.75 ATR.
Alternatively this article also suggests to use this method to catch volatility breakouts. If price is higher than the + 1 ATR area then you can safely assume it will be going to the +2 ATR area so you can put a buy stop at + 1 ATR with a profit target at + 2 ATR with a stop loss at +0.5 ATR to catch a volatility breakout with a risk to reward ratio of 2!
Even further there are methods that you can use with ATRs of multiple window sizes, for example by opening two copies of this indicator and measuring recent volatility with a 1 week window and long term volatility within a 1 month window. If the short term volatility is crossing the long term volatility then there is a high probability chance that even more price movement will occur.
However I have found that this method is good for more than daily volatility , it can also be used to measure weekly volatility , and monthly volatility and use these multiples as good long term price targets.
To select if you want daily, weekly, or monthly values of the ATR of volatility you're using go to the settings and click on the options in the "Opening period". The default window of the ATR here is 14 periods, but you can change this if you want to in "ATR period". Most importantly you are able to select which multiples of the ATR you would like to use in the settings in "ATR multiple 1" which is the green line, "ATR multiple 2" which is the blue line, and "ATR multiple 3" which is the purple line. You can select any values you want to put in these, the choice of 0.25, 0.5, and 1 is not special, some people use fibonacci numbers here or simply 0.33, 0.66, and 0.99.
Repainting issue: This script uses the daily value of the Average True Range (ATR), which measures the volatility that is happening today. If price becomes more volatile then the value of the ATR can increase throughout the day, but it can never decrease. What this means is that the ATR based pivots are able to expand away from the opening price, which should not affect the trades that you take based on these areas. If you base your take profit on one of these ATR multiples and the daily volatility increase this means that your take profit area will be closer to your entry than the ATR multiple. Meaning that your trades will be more conservative.
While this all may sound very technical it is super intuitive, throw this on your chart and play around with it :)
Happy trading!

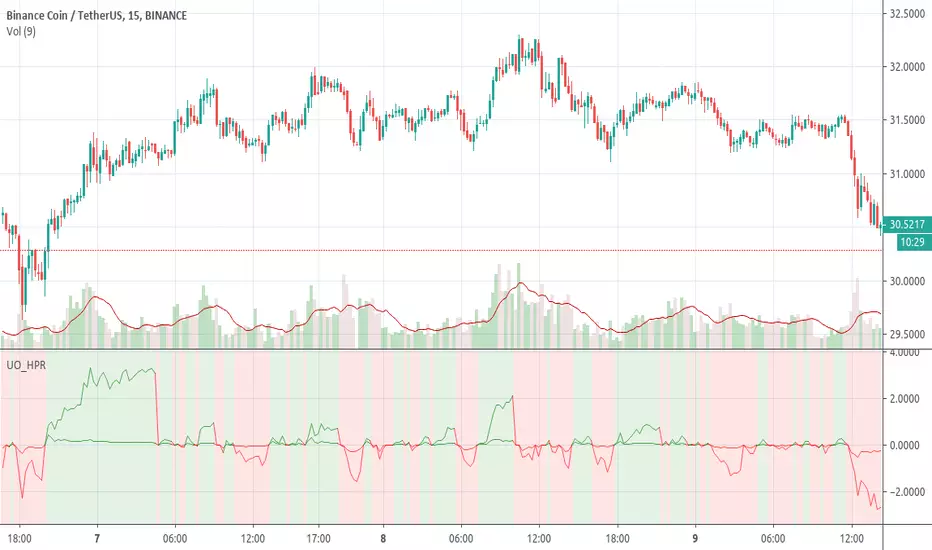
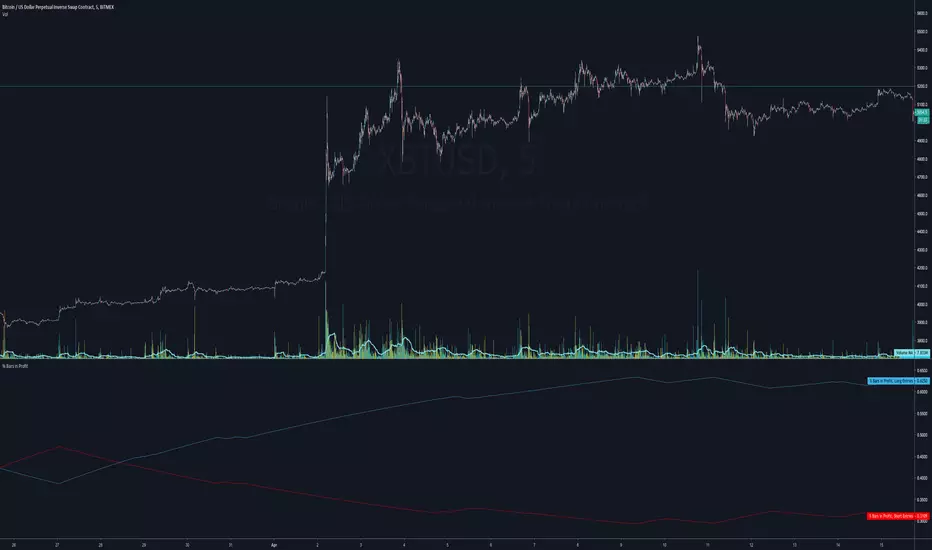
% Bars in ProfitUse this to determine how often your average entry price for shorts and longs over the last 11 trades are in profit or not.
DEMARSIV1 alerts and take profitThis version is the same as DEMARSI with following differences
I add take profit to short and long when DEMA MTF 1 is crossing DEMA MTF 2 (they are calculated different that why when you increase int2 in min to longer time the difference between them increse)
if you want the TP to be on signal of fast and slow DEMA RSI 2 (just change the code inside) by putting the long cond to be as the buy cond
for any questions please ask

poki buy and sell Take profit and stop lossThis indicator is based on modelius model of lazy bear weis model with ATR for the buy=B sell =S
in addition there is Take profit and stop loss in % both for short and for long
next stage is to know the resistance level and support based on bollinger marked in blue and red dots
Also included Parabolic Sar (blue and red dots rising up or down)
The color of bulish or bearish zone is based on the cross of Hull avreage and linear regression ( for each time set may need different setting for accuracy )
So how to use this scrupt to better profit
1. if you have B signal and its on lower support level then its good starting place for buy. look at the Parabolic Sar if its in agreement. The exit can be either by S =sell, Take profit that you decide on % or by end of Parabolic SAR upward
2. exact the oposite for short
Play with setting for the desired results or change modify this script for your purpose
