WaveTrend+ Strategy [SystemAlpha]This is a WaveTrend strategy based on WaveTrend Oscillator. In addition to using the normal crossovers, we use trend filters, trailing stop loss and take profit targets. WT+ Strategy was developed for crypto, forex and stocks for 15 minutes to daily timeframe. The main goal was to catch long term trends and ride them.
In this strategy you have a choice of:
Trend Filters:
- Average Directional Index (ADX) – buy when price is trend is up and sell when trend is down.
- Moving Average (MA) – buy when price close above the defined moving average and sell when price close below moving average
- Parabolic SAR – buy when SAR is above price is above price and sell when SAR is below price.
- All - Use ADX, MA and SAR as filters
For MA Filter , you can use the “TF MA Type” and "TF MA Period" parameter to select Simple or Exponential Moving Average and length.
Stop Loss:
- Average True Range (ATR) – ATR % stop as trailing stop loss.
- Parabolic SAR (SAR) – Parabolic SAR adapted as trailing stop loss.
For ATR , you can use the “ATR Trailing Stop Multiplier” parameter to set an initial offset for trailing stop loss.
Take Profit Target:
- Average True Range (ATR) – ATR % stop as trailing stop loss.
- Standard % – Percent as target profit
For ATR , you can use the “ATR Take Profit Multiplier” parameter to set an initial offset for trailing stop loss.
Additional feature include:
- Regular and Hidden Divergence display and alerts
- Filter Overbought and Oversold
- Use WT Cross for Exit
STRATEGY ONLY:
- Set backtest dates
- Set Trade direction - Long, Short or Both
- Use timed exit - Select method and bars
- Method 1: Exit after specified number of bars.
- Method 2: Exit after specified number of bars, ONLY if position is currently profitable.
- Method 3: Exit after specified number of bars, ONLY if position is currently losing.
TradingView Links:
WT+ Oscillator Companion:
WT+ Alerts:
How to use:
1. Apply the script by browsing through Indicators --> Invite-Only scripts and select the indicator
2. Once loaded, click the gear (settings) button to select/adjust the parameters based on your preference.
3. Wait for the next BUY or SELL signal to enter the trade!
Disclaimer:
The indicator and signals generated do not constitute investment advice; are provided solely for informational purposes and therefore is not an offer to buy or sell a security; are not warranted to be correct, complete or accurate; and are subject to change without notice.
Recherche dans les scripts pour "range"

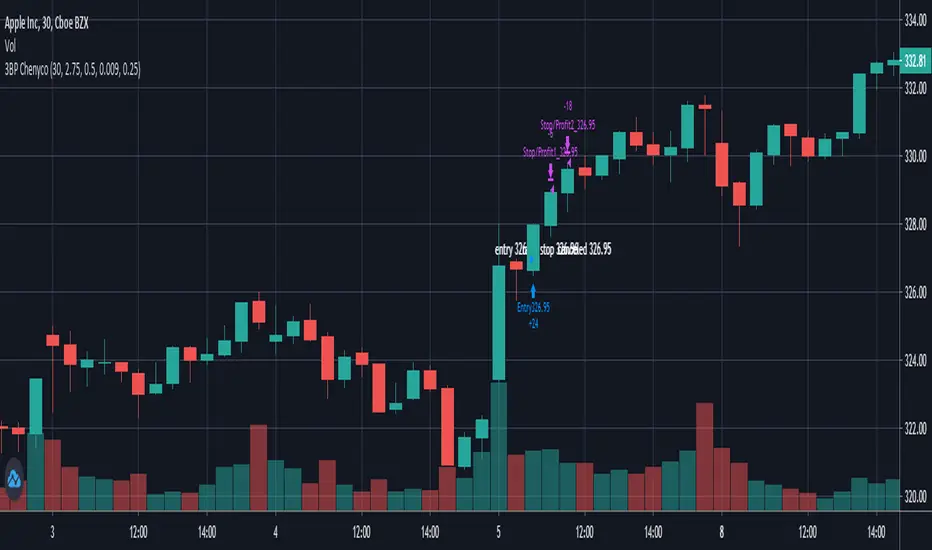
3 bar play partial1 1:1, take all 2:1 By ChenycoThis script is trying to find 3 Bar Play pattern and take profit of 2:1 with option to partial at 1:1.
The pattern has a weighted first bar and then a smaller bar with relative equally high. The first entry should be by the next bar only.
Parameters:
* Default strategy parameters, including initial capital and commissions.
* Risk Unit $ - The risk unit per trade in currency.
* Weighted Bar ATR Ratio - the ratio between the weighted bar true range to the ATR.
* Small Bar Ratio - The ratio between the smaller bar true range to weighted bar.
* Equal Price Ratio - The ratio of acceptable price change in compare to the stock price.
* Partial Qty Ratio - The ratio of the first partial equity.
Good luck!
Chen.
[STRATEGY] Moving Average CrossoverHello friends,
This is a comprehensive backtesting engine for Moving Average crossover strategies, supporting over 63 types of moving averages and filters. It allows you to test, compare, and optimize crossover behaviors between any two moving averages with flexible profit and risk management tools.
Built upon the Moving Average Crossover foundation, this advanced version lets you manually backtest more than 4096 combinations of moving average types. When combined with customizable periods, take-profits, and stop-loss levels, the total number of possible configurations becomes virtually unlimited.
🛠 How It Works
The system tests crossovers between two selected moving averages, with full control over their types, lengths, and trading direction. Integrated bracket settings enable dynamic take-profit, stop-loss, and trailing-stop management using units such as % , ATR , points , pips , or ticks .
You can restrict backtesting to a custom date range for focused performance evaluation or run it across the instrument’s full history.
🔥 Key Features
Supports 63+ moving average and filter types — including algorithms by Ehlers , Jurik , Kaufman , Apirine , Tillson , and Dürschner
Customizable MA types, periods, and strategy direction
Full-featured bracket control: TP, SL, and TSL in ATR, %, points, pips, or ticks
Backtest window customization (start, end, or range)
Direction filter: Longs only, Shorts only, or Both
Dynamic trade labeling and color-coded visualization
Option to exit only at TP, SL, or TSL
If you'd like access or have any questions, feel free to reach out to me directly via DM.
👋 Good luck and happy trading!
Script payant

MystockMoney Trend Trading Tool 0.2THIS INDICATOR IS ADVANCE VERSION OF MystockMoney Trend Trading Tool
This indicator is a trend following indicator its a mix of CPR , VOLUME + TREND INDICATOR. This will help You to understand Market Trend.
CPR Frank Ochoa call it It Pivot Range Histogram in his book.
Use it in conjunction with the Central Pivot Range indicator.
Once the trigger of the trend direction is made, the FollowLine will be placed at High or Low (depending of the trend).

2. AutoBots Trading - BACKTEST: StochasticBACKTEST: Stochastic
1. Description: a momentum indicator comparing a particular closing price of a security to a range of its prices over a certain period of time. The sensitivity of the oscillator to market movements is reducible by adjusting that time period or by taking a moving average of the result. It is used to generate overbought and oversold trading signals, utilizing a 0-100 bounded range of values.
2. Strategy rules: defined based on the component, signal count, entry prices, open order count, position check, position averages, conditional closes and close signals.
3. Risk management: system was defined based on the choice of only long, only short or both sides. Defining the choice of take profit, stop loss and trailing stos (no repaint).
4. Symbol: BTCUSD (only)
5. Suggested Timeframe: D
6. Parameter for optimization: 7, 11, 1, false, 20, 80, side: both, tp: 5%, sl: 2.5%, ts: 2%/2%
7. Walk forward simulation
7.1. In sample period: jan/2018-jan/2020
7.2. Out of sample period: jan/2020 - ago/2020
** For purpose educate only

Strategy TimeframeHello!
Until now, it was among all my strategy codes, but I wanted to share it alone. You can use this code to see strategy results or indicator results within a specific date range. It will be sufficient to add window() condition to the trading or alarm conditions. If time information is also important, you can change the Timestamp interval in the code.
Türkçe
Şimdiye kadar tüm strateji kodlarım arasında bulunuyordu fakat tek başına paylaşmak istedim. Strateji sonuçlarını ya da indikatör sonuçlarını belirli bir tarih aralığında görmek için bu kodu kullanabilirsiniz. Alım-satım ya da alarm koşullarına window() şartını da eklemeniz yeterli olacaktır. Saat bilgisi de önemli ise kod içerisindeki Timestamp aralığını değişebilirsiniz.

MystockMoney Trend Trading ToolThis indicator is a trend following indicator its a mix of CPR , VOLUME + TREND INDICATOR. This will help You to understand Market Trend.
CPR Frank Ochoa call it It Pivot Range Histogram in his book.
Use it in conjunction with the Central Pivot Range indicator.
Once the trigger of the trend direction is made, the FollowLine will be placed at High or Low (depending of the trend).

KBL Trend - Filter Pro v1KBL Trend Filter is a combination of Average true range and range breakout settings.
When KBL Trend -Filter Vertical line indicated with Green color and price cross over the candle on which the green vertical indicator came, then it is considered as a buy trades.
And same for sell trade,
When KBL Trend -Filter Vertical line indicated with Red color and price cross below the candle on which the Red vertical indicator came, then it is considered as a sell trades.
Change-log :
Few optimizations added for more smooth curves,
separated from main chart and added to separate chart window just below the main chart for easy visibility.
PM us to obtain access.

Crypto Tipster Pro===========
Crypto Tipster Pro Strategy
===========
Crypto Tipster Pro is a trading strategy with indicators based on Technical Analysis , Price Action and Momentum Swings for TradingView's charting platform.
We've compiled and continue to maintain a trading strategy that adapts to changes in the market; with custom indicator settings, fixed SL/TP, Trailing Stop, Safe Mode, Heikin Ashi Confirmation, Multi-Time Frame Analysis and more!
Our efforts have been focused towards the 1D time frame - using a larger time frame benefits most part-time or evening traders in multiple ways, catching bigger swings and earning a higher percentage per trade, the ability to reduce or remove any leverage associated with the trade, and only having to place a trade or move a stop loss ONCE per day ~ Meaning you are still able to go to work, tidy the house, play with the kids AND be a successful trader.
-----------
What's Included?
Crypto Tipster Pro comes with a host of features and is being continually updated, these features include (but are not limited to):
- Date Range Settings
Setting custom Start/End dates can help hone your strategy to suit the current times, or get a general overview of the market over the years.
- Heikin Ashi Confirmation
We added HA confirmation for both Entry & Exit of trades. This started as a form of "Safe Mode", we have since adapted this mode beyond Heikin Ashi; but kept this confirmation as an added extra.
- Variable Indicator Settings
As well as our Fixed Indicators and Price Action analysis going on in the background of the strategy, we've also included some Variable Indicators that you have access to edit.
Trend Detection Length for detecting trend over a given length! Higher numbers detect longer trends, but will inevitably make fewer trades and possibly miss the start of a new trend; a lower length will create more opportunities to trade but may get confused when in choppy markets.
Range Short/Long Lengths are used for detecting percentage price movements over a given number of bars back. This enables you to effectively "zoom in" on market data and catch trends within trends.
- Safe Mode
Enabling Safe Mode will add a couple more confirmation indicators to the strategy - the aim of Safe Mode is, in essence, to remove any trading signals that would end of being false/bad moves. Usually resulting in less Overall Trades, a higher Net Profit, higher % Profitable, higher Profit Factor AND a lower Drawdown. Use Safe Mode to help eliminate orders that would otherwise be placed in choppy markets.
- Stop Loss/Take Profit Settings
This is where Crypto Tipster Pro really proves itself, Money Management. We have an editable Fixed SL/TP, as well as Trailing Stops for Long or Short orders, all of which you can use on their own, or combined with each other. Playing with these settings can turn an un-profitable system into a very-profitable trading plan!
- Custom Stop Loss Indicator
This is a little extra indicator that we have found very useful over the years of trading markets, a custom Stop Loss Indicator. Simply turn it on, enter the price you want to calculate from, tick Long or Short, enter a % movement and see your new stop loss level plotted on the chart. This is especially useful for when the strategy doesn't marry up with the prices you've actually obtained (for better or for worse!)
We've tried to make this strategy as comprehensive and as accurate as possible, it works consistently over many trading pairs on many time frames. We would however Love your assistance! -please forward any notes or helpful tips to us either by commenting below, on Twitter or a direct message through our website.
-----------
For more information and a FREE 7-Day Trial with the Crypto Tipster Pro Strategy visit the link in our signature.
Good Luck and Happy Trading!
KBL Trend - FilterKBL Trend Filter is a combination of Average true range and range breakout settings.
When KBL Trend -Filter Vertical line indicated with Green color and price cross over the candle on which the green vertical indicator came, then it is considered as a buy trades.
And same for sell trade,
When KBL Trend -Filter Vertical line indicated with Red color and price cross below the candle on which the Red vertical indicator came, then it is considered as a sell trades.

BITCOIN-BTCUSD Trading Strategy-1This Trading Strategy is for BTCUSD which is traded on BITSTAMP exchange. The aim of this strategy is to ride the market with its ebbs and flows.
The strategy works best on 1 Hour timeframe. The results may very different depending upon time-frame and date range of your choice and different exchanges.
Parameters details:
1. Trade Trigger - You can adjust it depending upon your risk management. Default value is 20.
2. Partial Profit Points – Part profit booking points. Default value is 350.
3. Lookback Period 1 – Default is 11.
4. Lookback Period 2 – Default is 5.
The default trading quantity is 2. I have added functionality for part profit booking which increase profit and always keeps you in trade. Book 1 lot for certain points (350 points gives better results) and continue other with 1 lot till the position reversed.
I have tested this indicator on 1 Hour time-frame on BITSTAMP exchange and the time period is maximum available on Tradingview.
Period : 02/01/2019 to 30/03/2020.
Points = $ 17720.56
No. of trades = 129
% Profitable = 44.96%
Profit Factor = 2.464
Sharpe Ratio = 0.674
For free trial, send me a private message in order to access this script.
Thanks © allanster for Date Range functionality and ©LonesomeTheBlue for non-repaint concepts.
Disclaimer: This script/strategy is for educational and information purpose only. The author of this script/strategy will not accept any liability for loss or damage as a result of reliance on the information contained in the charts and buy/sell signals. Please be fully informed regarding the risks and costs associated with trading the financial markets.

Grasim Trading Strategy-1This Trading Strategy is for Grasim Industries (GRASIM) which is traded on National Stock Exchange (India).
The strategy works best on 5 min timeframe. The results may very different depending upon time-frame and date range of your choice.
The default trading quantity is 2. I have added functionality for part profit booking which increase profit and always keeps you in trade.
I have tested this indicator on 5 minutes time-frame on National Stock of Exchange(India) which gives good results and the time period is almost 6 months.
Period : 19/08/2019 to 06/03/2020.
Points = 688.25
No. of trades = 58
Profit Factor = 2.934
It is non-repainting indicator and uses @version=4.
For free trial, send me a private message in order to access this script as this Invite Only script.
Thanks © allanster for Date Range functionality script.
Disclaimer: This script/strategy is for educational and information purpose only. The author of this script/strategy will not accept any liability for loss or damage as a result of reliance on the information contained in the charts and buy/sell signals. Please be fully informed regarding the risks and costs associated with trading the financial markets.

TCS Trading Strategy -1This Trading Strategy is for TATA Consultancy Services (TCS) which is traded on National Stock Exchange (India).
The strategy works best on 5 min timeframe. The results may very different depending upon time-frame and date range of your choice.
The default trading quantity is 2. I have added functionality for part profit booking which increase profit and always keeps you in trade.
It is non-repainting indicator and uses @version=4.
For free trial, send me a private message in order to access this script as this Invite Only script.
Thanks © allanster for Date Range functionality script.
Disclaimer: This script/strategy is for educational and information purpose only. The author of this script/strategy will not accept any liability for loss or damage as a result of reliance on the information contained in the charts and buy/sell signals. Please be fully informed regarding the risks and costs associated with trading the financial markets.

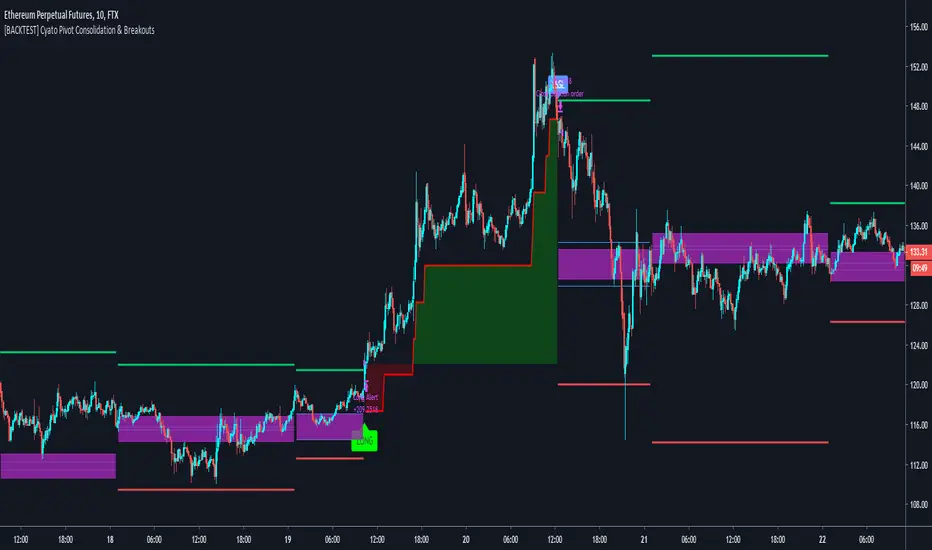
Cyatophilum Pivot Consolidation & Breakouts [BACKTEST]Intraday Strategy built on Pivot Points Standard and Pivot Range.
The idea is to wait for a consolidation period AND a breakout. This really strong condition allows to set a 1/1 Risk/Reward ratio.
Starting from there we secure the profits with a Trailing Stop loss and/or Take Profit system integrated in the script.
This is the Backtest version and you can see the results below. Default settings work great on the 15m chart.
You can change the timeframe of the pivot points as well as the consolidation band in the settings. The SL/TP system is also configurable. This script includes a DCA feature.
To get the indicator, please use the link below, thanks!
Blackbox (Backtesting version)Blackbox Backtest version is a script with 12 built-in indicators, a list of different conditions you can check/uncheck to enter and exit the market on specific points and 3 different strategies styles.
Use this script to backtest different strategies.
It can't be used to create alerts.
If you found a good strategy and you want to do set alerts too you have to switch to Blackbox Alert version. It's the same script but without the strategy part.
Indicators:
Chaikin Money Flow
Chaikin Money Flow
Chaikin Oscillator
Volume Oscillator
Ichimoku Baseline
SSL
William R%
RSI
Bollinger Bands
ROC
RSI probability (custom)
EMAs
Aroon
ATR
... new indicators very soon
Conditions
Check/uncheck different conditions from setting panel for both entries and exits.
Combine them to create complex strategies and alerts.
This list is constantly updated.
Data Range
Set a data range to backtest.
From Year, Month, Day, Hour, Minute to Year, Month, Day, Hour, Minute.
Order size/settings
ATR Period
TP Multiplier (Used for Take Profit = ATR*TP Multiplier strategies)
SL Multiplier (Used for Stop Loss = ATR*SL Multiplier strategies)
Pips_tp Set a fixed amount of pips for your Take Profit level
Pips_sl Set a fixed amount of pips for your Stop Loss level
Select a strategy style
ATR as TP/SL
Fixed TP/SL
With Exit conditions
Stop Loss for exit conditions
Last update: 13/02/2020
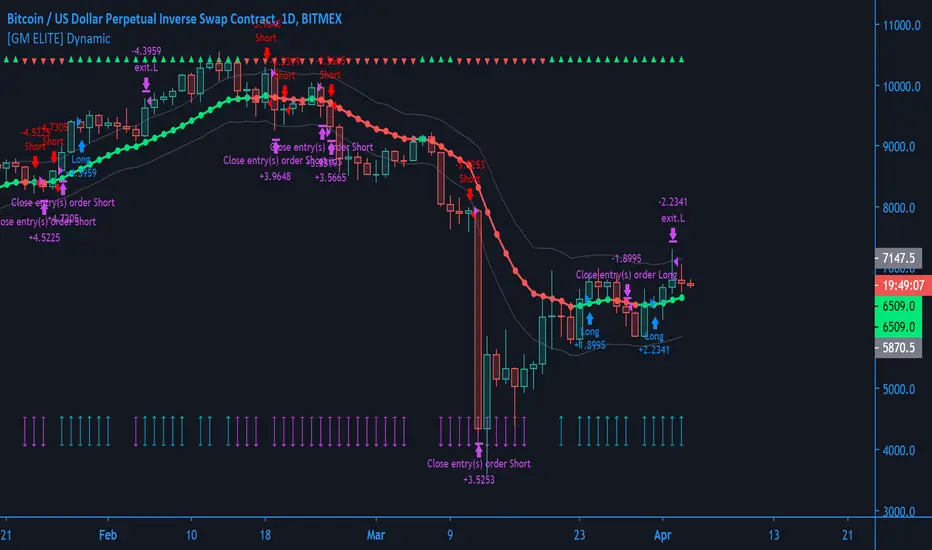
[GM ELITE] Dynamic Introduction
This is the first of the GM ELITE indicator range. Designed for Algorithmic Traders looking to speed up their process of testing and optimizing their algorithm. This script contains an entire suite of indicators, that work together in unison to find optimal trade entries, based on NNFX rules. There are two versions of this script. One is a strategy and built in back-tester, and the other will update in real time designed for live trading and forward testing.
Entries/Exits
The System has 5 indicator slots, and the user can choose one indicator per slot
- Trend Confirmation Indicators to pick when the market has taken off
- Volume and volatility Indicators to determine the strength of the trend or whether tha market is ranging.
- Moving Averages for trend bias
- Exit Indicators to signal when to get out!
Money Management
Dynamic allows you to choose your Stop Loss and Take Profit distance based on a multiplier x ATR.
Options to exit the whole trade at TP or at a signal from the exit indicator of your choosing.
Start and End times (Window) to backtest.
Forex - $EVZ
Euro Volatility FX Vix (aka $EVZ) is built in. You can toggle a filter for low $EVZ or whether or not EVZ is above average. No signals will be given if EVZ is below threshold. EVZ is one of the best indicators of overall forex market volume and volatility.
Customization
Several visual and color customization options. Thousands of possible parameter combinations.
The "bias" or mode of the Confirmation Indicators appears at the top and bottom of the screen as horizontal rows of triangles.
For any two-line Indicator (eg MACD ) if the fast line is above the slow line, the triangles are green, other-wise, they are red.
For any "Level Cross" indicator, when the line is above the level, the triangles are green, otherwise, they are red.
The Arrows at the bottom of the screen determine whether or not there is sufficient volume
Out of the Box
The Indicators and parameters out of the box are chosen based on defaults. Please optimize for the market that you trade.My recommendation is to paper trade once you have found a combination of settings with good back-testing results, and have different settings for different markets, as not all markets behave in the same manner.
Harsachs Grinder StrategyThis is the first public script of Harsachs.
Harsachs Grinder Strategy buys and sells depending on the Average True Range and Moving Average data.
It has 4 functions; Buy, sell, buy stop and sell stop.
Use this strategy to trade all equities in 15 minutes timeframes. Don't forget to take profit manually because Harsachs Grinder Strategy may wait for Average True Range to hit to buy or sell stop.
Please like the script before using it. Ask your questions in the comment section below!

BITMEX Bybit binance bitstamp Coinbase HUOBI BTC ETH TRENDBITMEX Bybit binance bitstamp Coinbase HUOBI BTC ETH TREND
This is a very effective trend strategy.
Strategy principle
Constructs the trailing ATR stop above or below the price, and switches directions when the source price breaks the ATR stop.
Uses the Average Directional Index (ADX) to switch between ATR multipliers. The higher multiplier is used when the ADX is rising, and the lower ATR multiplier is used with the ADX is falling.
This ADX criteria further widens the gap between the source price and the trailing ATR stop when the price is trending,and lessens the gap between the ATR and the price when then price is not trending.
The ATR-ADX stop is effectively a double adapative stop that trails the price,by both adapting to the true range of the price, and the average directional change.
HOW TO USE
set long position when a green arrow appears in the chart.
When the stop is below the price (long trade) the value never decreases until the price intersects the stop, and it reverses to being above the price (short trade)。
set short position when a red arrow appears in the chart.
When the stop is above the price it will never increase until it is intersected by the price. As the true range and ADX change, the stop will move more quickly or more slowly.
For the long position and the short direction, you can set the stop profit & stop loss or trailing profit stop & trailing stop loss respectively.
When a purple arrow appears to close a position, an aggressive trader can go in the opposite direction when it is purple.
Strategy applicability
The default setting is for bitmex perpetual swap contract XBTUSD , bybit BTCUSD perpetual futures contract ,binance btcusdt Spot,Bitfinex BTCUSD Spot,bitflyer BTCJPY Spot,bithumb BTCKRW Spot,bitso BTCMXN Spot, bitstamp BTCUSD Spot,bittrex BTCUSDT Spot,Coinbase BTCUSD spot, deribit BTCPERP perpetual futures contract,gemini BTCUSD Spot,Hitbit BTCUSDT Spot,huobi BTCUSDT Spot KRAKEN XBTUSD spot,OKCOIN OKEX BTCUSD3M BTCUSD BTCUSD2W,Poloniex BTCUSDT Spot etc btc symbol with 2 hour timeframe.
This indicator has broad applicability and can be applied to multiple different symbols.
This indicator also applies to the ETHUSD ETHBTC EOSBTC BNBBTC symbol etc, just adjust the default configuration.
Using the alert of the indicator, it can work well on the trading robot like Gunbot,autoview, without repaint false signals.
这是非常有效的趋势策略。
策略原理
在价格之上或之下构造追踪的支撑压力位并在源价格突破压力位时的切换操作方向,使用平均趋向指数(ADX)与ATR系数之间切换。
当ADX上升时使用上升的ATR系数,而ADX时下降时使用下降的ATR系数。
当价格趋势变化时,ADX参数在价格趋向变大时使源价格止损点与后续ATR进一步扩大,并在价格趋向平缓时减小了ATR与价格之间的差距。
如何使用
ATR-ADX压力线通过适应价格的真实波动范围和平均趋向变动达到跟随价格的双适应性止损目的。当做多时,止损线低于价格,并随价格升高,直到止损线与价格相交,然后反转至高于价格,此时启动空头交易;
在图表中出现绿色箭头就做多。
当做空时,止损线高于价格,并随价格降低,直到止损线与价格相交,然后反转至低于价格,此时启动多头交易;在图表中出现红色箭头就做空。随着真实波动和ADX的变化,止损线将移动得更快或更慢。
对于多头头寸和空头方向,您可以分别设置止损和止损或尾随利润止损和尾随止损;当出现紫色箭头时平仓,激进的交易者,可以在紫色时就做反方向。
策略适用性
默认设置是针对bitmex交易所 XBTUSD永久掉期合约,BYBIT交易所 BTCUSD永续期货合约,binance币安交易所 btcusdt现货,Bitfinex交易所 BTCUSD现货,bitflyer交易所 BTCJPY现货,bithumb交易所 BTCKRW现货,bitso交易所 BTCMXN现货,bitstamp交易所 BTCUSD现货,bittrex交易所 BTCUSDT现货,Coinbase交易所 BTCUSD现货,deribit交易所 BTCPERP永续期货合约,gemini双子星交易所 BTCUSD现货,Hitbit交易所 BTCUSDT现货,huobi火币交易所 BTCUSDT现货,KRAKEN交易所 XBTUSD现货,OKCOIN OKEX交易所 BTCUSD3M OK BTC季度合约 BTCUSD BTCUSD2W OK BTC次周合约,Poloniex BTCUSDT现货等2小时区间的btc交易。
Bitmex XBTUSD 2H 比特币合约
Binance币安 BTCUSDT 2H 比特币现货
Bitfinex BTCUSD 2H 比特币现货
Bitstamp BTCUSD 2H 比特币现货
COINBASE BTCUSD 2H 比特币现货
HUOBI火币 BTCUSDT 2H 比特币现货
OKEX BTCUSD3M 2H 比特币季度合约
Bybit BTCUSD 2H 比特币合约
这个指标具有广泛的适用性,可以适用多个不同交易品种。
该指标还适用于ETHUSD ETHBTC EOSBTC BNBBTC交易品种等,只需调整默认配置即可。
bitmex ETHUSD 2H期货
binance ETHUSDT 2H现货
Bybit ETHUSD 2H合约
HUOBI火币 ETHUSDT 2H现货
OKCOIN ETHUSD1W 2H期货
binance币安EOSBTC 2H
Binance币安 ETHBTC 2H
使用该指标的警报设置,它可以在自动交易机器人上很好地工作,而无重绘错误的信号。

Strategy VS Buy & HoldSUMMARY:
A strategy wrapper that makes a detailed and visual comparison between a given strategy and the buy & hold returns of the traded security.
DESCRIPTION:
TradingView has a "Buy & Hold Return" metric in the strategy tester that is often enough to assess how our strategy compares to a simple buy hold. However, one may want more information on how and when your strategy beats or is beaten by a simple buy & hold strategy. This script aims to show such detail by providing a more comprehensive metrics and charting the profit/loss of the given strategy against buy & hold.
As seen in the script, it plots/draws 4 elements:
1) Strategy P/L: strategy net profit + strategy open profit
2) Buy & Hold P/L: unrealized return
3) Difference: Strategy P/L - Buy & Hold P/L
4) Strategy vs Buy Hold Stats
> Percent of bars strategy P/L is above Buy & Hold
> Percent of bars strategy P/L is below Buy & Hold
> All Time Average Difference
ADJUSTABLE PARAMETERS:
All labels/panels can be disabled by unchecking these two options:
>bnh_info_panel = input(true, title='Enable Info Panel')
>bnh_indicator_panel = input(true, title='Enable Indicator Panel')
Comparison Date Range can be changed to better isolate specific areas:
>From Year, From Month, From Day
default: 1970 01 01
>To Year, To Month, To Day
default: 2050 12 31
Default settings basically covers all historical data.
HOW TO USE:
The default script contains a simple 50-200 SMA cross strategy, just delete and replace it. Those are everything between these lines:
/////////////////////////////////////////////////////////////////////////////////////
//////////////////////////////STRATEGY SCRIPT START//////////////////////////////////
(STRATEGY SCRIPT GOES HERE)
//////////////////////////////STRATEGY SCRIPT END////////////////////////////////////
/////////////////////////////////////////////////////////////////////////////////////
Removing all plots and drawings from your strategy is advisable.
If you are going to use the Comparison Date Range, apply "bnh_timeCond" to your strategy to align the dates. A sample on how it’s applied can be seen on the Placeholder MA cross strategy.
Note: bnh_timeCond returns a boolean series

BOMBA Trend*LazyBear's WaveTrend port has been praised for highlighting trend reversals with precision and punctuality (minimal lag). But strong "3rd Wave" trends can "embed" or saturate any oscillator flashing several premature crosses while stuck overbought/oversold. This happens when the trend stretches over a longer timescale than the oscillator's averaging window or filter time constant. Our solution: simultaneously monitor many oscillator timescales. Watch for fresh crossovers in "dominant" timescales alternating most smoothly between the overbought (red shade) and oversold (green shade) range.

[BERA] KEANU REEVES STRATEGY TESTThis is a strategy test of my indicator.
Indicator based on Average true range.
LIME ARROW = LONG
RED ARROW = SHORT
LIME COLOR BARS IF GREEN ARROW CONDITION VALID.
RED COLOR BARS IF RED ARROW CONDITION VALID.

[rs] TrendLazyBear's WaveTrend port has been praised for highlighting trend reversals with precision and punctuality (minimal lag). But strong "3rd Wave" trends can "embed" or saturate any oscillator flashing several premature crosses while stuck overbought/oversold. This happens when the trend stretches over a longer timescale than the oscillator's averaging window or filter time constant. Our solution: simultaneously monitor many oscillator timescales. Watch for fresh crossovers in "dominant" timescales alternating most smoothly between the overbought (red shade) and oversold (green shade) range.

Simple 17 BF 🚀A Simple Moving Average of period 17 based on ohlc4 values. We go long when price closes above it. We go short when price closes below it. No stop loss. No take profit.
This strategy is really to showcase how effective a basic system can be, and that with discipline and patience, trading does not need to be complex to yield good results over time.
You can change the Moving Average type, source and period in the settings as well as the backtesting range. I found 17 period SMA with ohlc4 to be a good fit for XBT/USD on Daily timeframe but for other pairs, the type, source and period will likely differ.
INSTRUCTIONS
Red turns to Green = Long Entry/Short Exit
Green turns to Red = Short Entry/Long Exit
The entries are based on when price crosses the MA and this is what the backtest is based on. We exit the current trade when we get an opposing signal and enter the new trade.
