Volume Profile - Custom Range, Interactive by DGTVolume Profile - Custom Range aims to display trading activity at specific price levels over user defined Custom Range of trading. Start and End Time is Interactive , they can be adjusted simply by clicking on the chart and drag the lines to specify the desired custom range. Same as is with the drawing tools available in TV
Please note, while switching between timeframes or switching to different instruments with different exchange timezones you may need to adjust the locations in case the plotting is not displied
Volume Profile - Custom Range is plotted as two horizontal histograms on the finacial isntrumnet's chart that highlights the trader's common interest at specific price levels as well as aims to reveal dominant party of who is in control, bulls or bears
You are also invated to galnce at Volume-Profile-and-Volume-Indicator , Anchored-Volume-Profile , and Price Action-Support-Resistance for different perspective of Volume Profiles
Special thanks to everyone who commented and presented their valuable suggestions
Disclaimer: Trading success is all about following your trading strategy and the indicators should fit within your trading strategy, and not to be traded upon solely
The script is for informational and educational purposes only. Use of the script does not constitutes professional and/or financial advice. You alone the sole responsibility of evaluating the script output and risks associated with the use of the script. In exchange for using the script, you agree not to hold dgtrd TradingView user liable for any possible claim for damages arising from any decision you make based on use of the script
Recherche dans les scripts pour "range"

Central Pivot Range 2xBased on a modified Hancock Pivot Range.
Displays the Central Pivot Range for 2 customisable Timeframes Along with Targets which are based on Classic Pivot Point Extensions.
The Pivot Point Extensions are Extended to the right of the price chart which helps eliminate unnecessary clutter
TF1 Displays Right Extensions R3 to S3 + the pivot point
TF2 Displays only Right Extensions R2 to S2
I would have liked to have provided more Right Extensions plus Labels however that would have exceeded Tradingviews memory limits, having said that R3 to S3 for both timeframes can still be displayed as historical levels
Central Pivot Range High Low and Mid Levels + the Targets work great as Support and Resistance and help with analysing the trend
A Thick Central Pivot Range generally indicates consolidation whereas a Thin Central Pivot Range generally indicates a trending market

Average Daily Range TableThis is the last script to complete Vladimir Poltoratskiy's setup found in his books.
Poltoratskiy argues that you should not take any fractal corridors higher than 50% of the Average Daily Range. To be honest, even 40% is a lot, because then, your target will be 160% ADR away from your entry and one "fracture" just can't be enough to predict moves this big.
I chose a table to visually represent the indicator because it doesn't change its value during the day. It takes far less room on the chart.
There are also two simple moving averages. You may use the as an indicator if the relative volatility as of late is extremely low and in that case, perhaps, expect an increase in the coming days. They are applied to the Average Daily Range, not one day range!

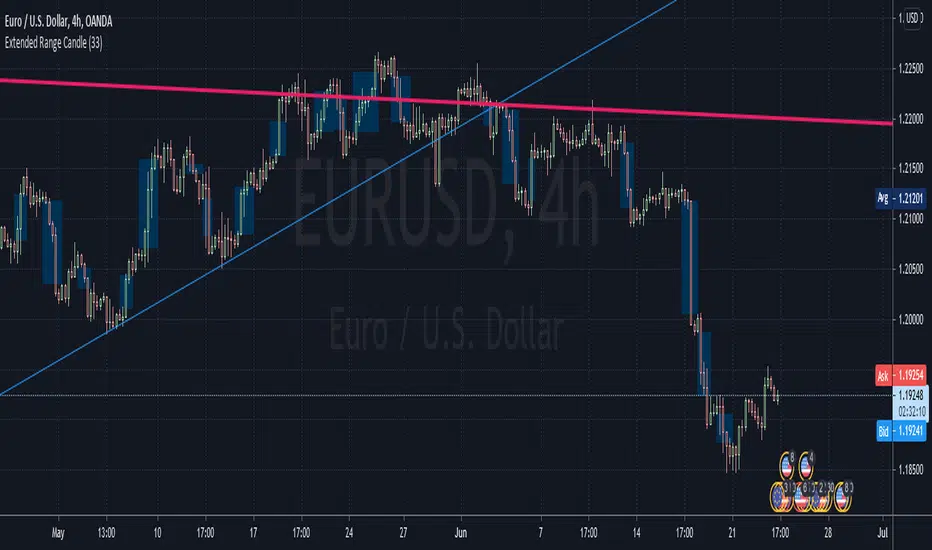
LKK - Extended Range Candles GapOANDA:EURUSD
The indicator will highlight the Extended Range Candles (ERC) price gap.
Extended Range is the price excessively moving in one direction, it can be one or more candles.
ERC Gap is the range of price that doesn’t have any resistant.
To classified as ERC I use the range (highest price minus lowest price) of the candle before the ERC and divide with ERC range. If result less than given percentage (ERC %) then confirm it is ERC.
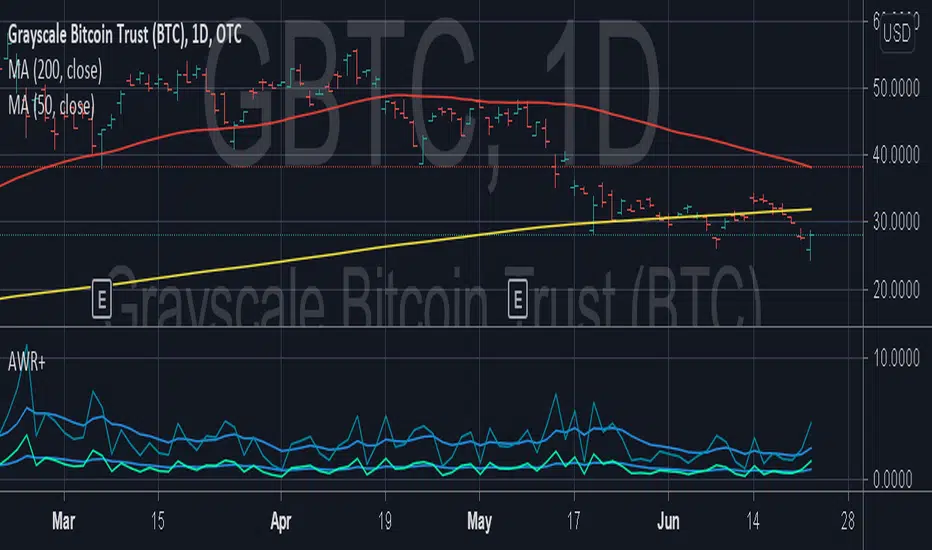
Average Weekly Ranger PlusThis is an updated version of the average weekly ranger which now includes ATR and TR values for the period, as well as the /3 divisor used by scalerz. Just swinging from the trees here. Enjoy. Tarzan.
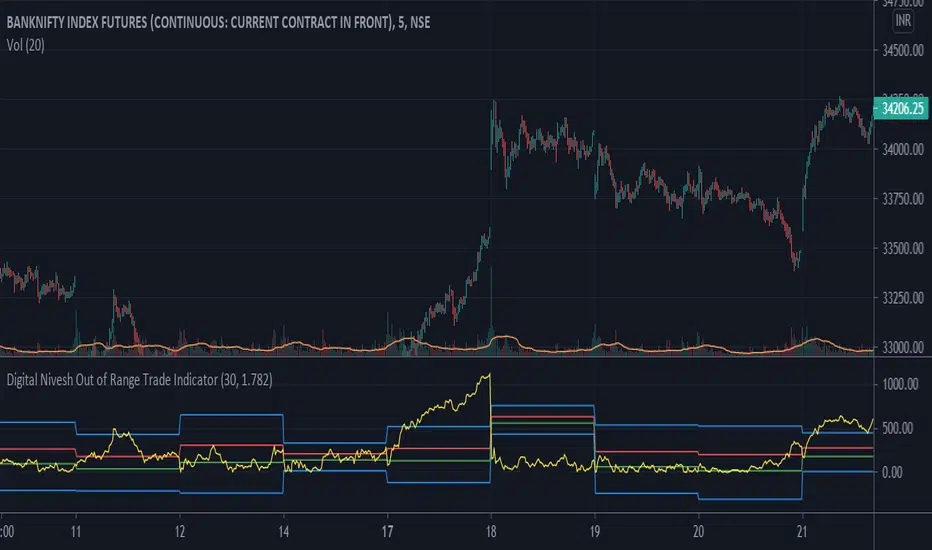
Digital Nivesh Out of Range Trade IndicatorThis indicator is for intraday with the basic logic that any script will always trade in its range.
So , if any script moves away from its range, it will try to come back to its normal range movement.
Suppose average movement of any share is 100 points, and share has moved more than 150 points there is high probability that it will move in opposite direction in order to have average movement of price of 100.
For Stocks please use average period as 15 days for index 30 days.
If share price(YELLOW LINE) moves away from higher or lower blue line, then with the help of volume confirmation a trade can be initiated in opposite direction.
Please note direction needs to be opposite of what has happened in the day.
for eg. upper blue line could be broken , in both situation i.e.. share price is rising or falling,
so if share price is rising and upper blue line is broken:
Bearsish trade can be initiated with the help of price action n volume.
if share price has falledn and upper blue is broken:
Bullish trade can be initiated with the help of volume n price action confirmation.
Volume using Candle RangeAnother way of finding out a rough estimate of the volume or how much bulls or bears were in control using only the range of the candlesticks in relation to the closing price. If the close is in the higher range zone then the volume is said to have been positive, if the close is in the lower range zone then the volume is said to have been negative. The close is compared to the midpoint of the candle to see how far from the midpoint the close was.
The columns bars show how far each candlestick's close price is to the midpoint of its high and low. It's possible for the column bar to be a different color than the candlestick itself if the close was above or below the midpoint. An average line is shown that takes the average of a given length amount of column bars. There is an option to show the absolute value only of the columns and the average line.
This is based on an idea I found about candlestick range bars implying volume. This is an attempt to put that theory into practice and to see if there's any truth to it. It's not exactly volume and may not always look like it, and it does not show how many trades took place but instead tries to use price in relation to the high and low range.

Decomposed Average True RangeThis simple script decomposes the value of the Average True Range into a bullish component and a bearish component .
The script supports two plotting methods; Mirrored and Two Lines . If Mirrored is chosen, the indicator plots the bullish component as a positive number, and the bearish component as a negative number. If Two Lines is chosen, the indicator plots two lines, both of positive values. It is the same data, just visualized differently.
Side note: This is very similar to how the strength (average gain) part in the Relative Strength Index calculation works. However, the RSI uses the realized range (close - previous close) rather than true range. If we were to use the bullish component of the ATR as the average bullish gain part in the RSI calculation, and the bearish component of the ATR as the average bearish gain part in the RSI calculation, we would get very similar (but not equal) results to the standard RSI. This shows how the ATR and the RSI are related to each other.

Average Ranges - MMFxThis is a script that has Average Daily Ranges, as well as Weekly, Monthly, and Yearly Ranges
Users can edit:
ADR display limit - Set the number of historical ADR to display.
AWR display limit - Set the number of historical AWR to display.
AMR display limit - Set the number of historical AMR to display.
AYR display limit - Set the number of historical AYR to display.
ADR Length parameter - Set the length parameter of ADR.
WDR Length parameter - Set the length parameter of AWR.
MDR Length parameter - Set the length parameter of AMR.
YDR Length parameter - Set the length parameter of AYR.
Ranges are to be used with price action, and Market Maker Method knowledge to catch reversals and stop hunt points
Kendall Garro 2021
MasterMind FX

Closing rangeIndicates percentage of daily closing range and absolute daily closing range. Absolute daily closing range take prior day highs as a low in case of gap down or prior day highs in case of gap up

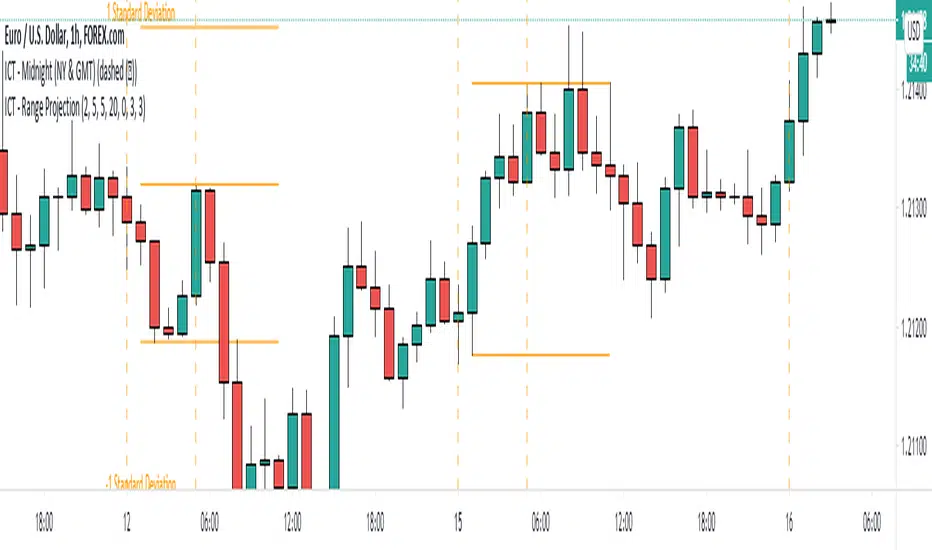
ICT - Range ProjectionThis script helps you to project future intra-day range or weekly range based on the Asia range.
It draws multiple horizontal lines on the standard deviation levels. (There is a limitation of around 50 vertical lines per script)
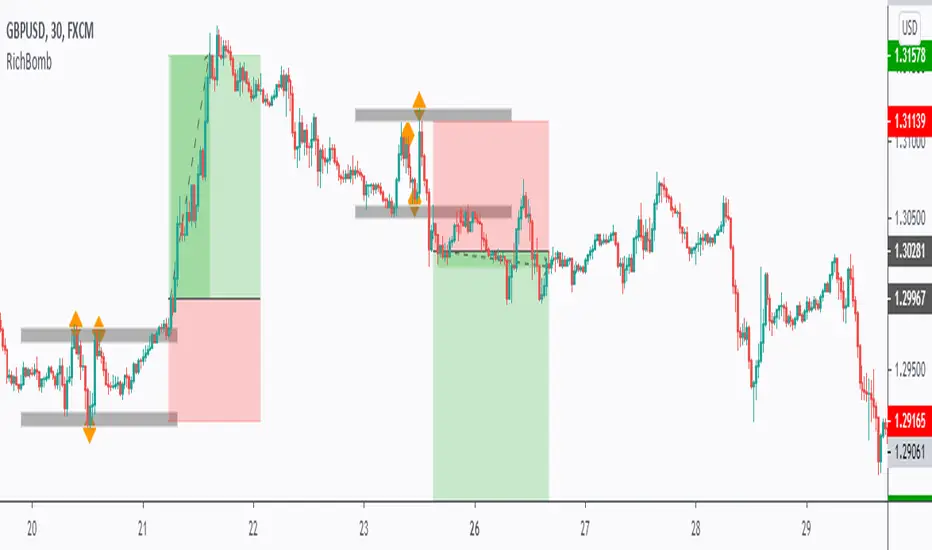
RichBomb Tool/IndicatorThis is a customized strategy by RichTL indicator.
RichBomb helps traders catch explosive movements in the market.
RichBomb color the dots/diamonds by orange when at least three RichTL dots/diamonds come very close to each other forming a small range.
We usually on the break of the RichBomb range upward or downward. Stop Loss goes on the last major swing from the other side, and we target a 2/1 Reward/Risk Ratio.
RichBomb is not a stand-alone strategy, but acts as one confluence in your trading plan.
For example, if the price is sitting around resistance, we would be only interested in selling on the RichBomb range breakout downward, not upward.
RichBomb works on all instruments (Forex, Crypto, Index, Stock, Commodity...) and all Timeframes.
Good Luck!
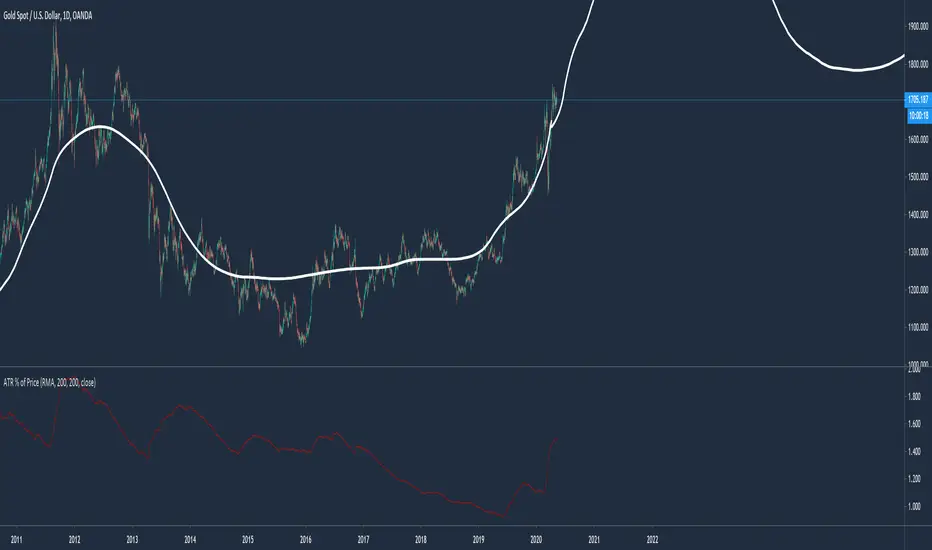
Average True Range % of PriceThis script easily shows in an indicator window the Average True Range % of Price, which helps people understand the volatility of an asset in % terms defined by custom MA periods for custom ATR periods.
The MA Period gives the average price.
The ATR Period gives the average range.
The Average Range / Average Price = Average Range % of Price.
Understanding the volatility of an asset can help people manage risk e.g. if an asset has a low entry cost, but very high volatility it may be more risky than another asset with a high entry cost, but much lower volatility.
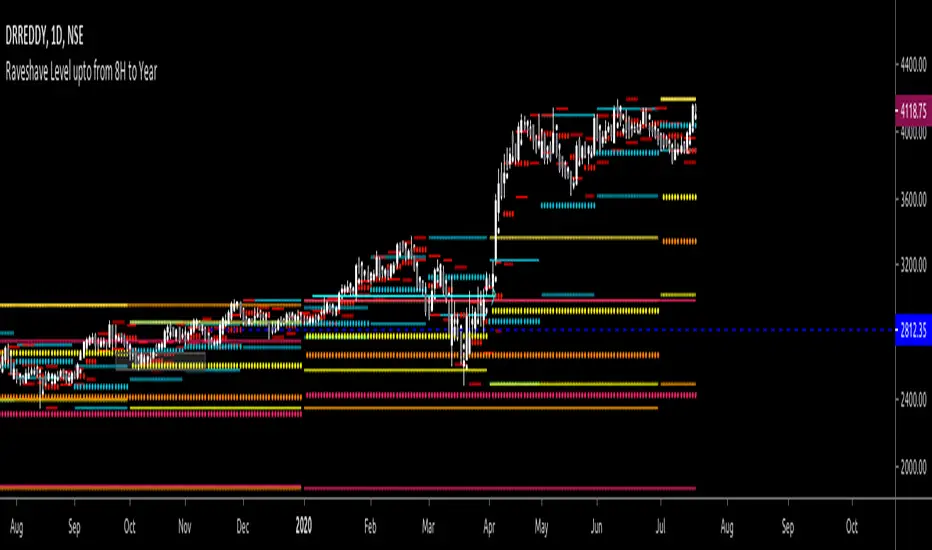
All past LevelsContains all past levels that we need
1. Previous Monthly High
2. Previous Monthly Low
3. Previous Weekly High
4. Previous Weekly Low
5. Previous Daily High
6. Previous Daily Low
7. Previous Monthly Range Average (PMH+PML)/2
8. Previous WeeklyRange Average (PWH+PWL)/2
9. Previous Daily Range Average (PDH+PDL)/2
10. Monthly Open
11. Weekly Open
12. Daily Open
BKN ATR Trading RangeThis script allows you to view ATR extremes based on the open of the candle. Average True Range gives you the average move of an asset during a period of time. If you're viewing the Daily timeframe , The Average True Range represents the average size of a move that occurs in a one day timespan over the specified period. Reaching the upper or lower boundary could signify that a trend is reaching exhaustion as the asset is reaching it's expected move for the period.
You can manually set a timeframe to use for the ATR value. By default, we are viewing a Daily timeframe . For lower timeframe trading you may want to look at the hourly or four hour ATR range.

VPTbollfib & Camarilla (Danarilla)I do not own the original indicators. This is just a combination of the two because of their nature to work in a similar way.
Camarilla Pivots run on the basis of intraday range trading. Usually after daily open you look the fade whatever move happened before. by shorting R3/H3 levels or longing R3/L3. Targeting the other side of the range. This is the infamous PivotBoss level calculations and you would want to activate camarilla and turn off the normal pivots. They use the previous days volatility to plot the next days levels.
But what about some confirmation?
Well RafaelIzoni (who made it open source for improvement) threw together this VPTbollfib. It is volume price trend crossing down a fib line using bollinger bands as price envelope. The beauty of this is that It will signal usually counter to current price action based on selling into uptrends or vise versa. Meaning you get signals to counter price. Which is what you might be looking for on range day trade scalps for camarilla. A wick reversal or engulfing + volume based signal is a very happy pairing together. And those signals are usually suitable for the target of the range you are day trading. Hourly time frame works quite well for both. And camarilla should also be on daily settings.
Special Thanks to Nanda (who published the pivotboss indicator AND) Helped to merge the scripts together.
This indicator alone is an entire trade system. Camarilla already is. If you know the rules. it can be used for entries, exits, risk management to trade the range on TREND, COUNTER TREND, and BREAKOUT plays. The bollinger band fibs add confirmation to the trends levels. And the VPT adds a secondary confirmation to take a camarilla trade.
Try it out. I think you will find both the levels on camarilla and the VPT signals quite suprising.
