Ultimate Scalping IndicatorOverview
The Confluence Signal Indicator is a precision-built scalping tool designed to identify high-probability reversal points in the market.
It combines three core technical elements:
Trend
Mean reversion
Momentum
into a single, efficient system.
By filtering out weak RSI signals and focusing only on setups that align with trend direction and recent momentum shifts, this indicator delivers cleaner and more accurate short-term trade signals.
Core Components
200-Period Moving Average (MA200, 5-Minute Timeframe)
The MA200 is always calculated from the 5-minute chart, regardless of your current timeframe. It defines the macro trend direction and ensures that all trades align with the prevailing momentum.
Session VWAP (Volume-Weighted Average Price)
The VWAP tracks the real-time average price weighted by volume for the current trading session. It acts as a dynamic mean-reversion level and helps identify key areas of institutional activity and short-term balance.
RSI (Relative Strength Index)
The indicator uses a standard 14-period RSI to detect overbought and oversold market conditions.
A “recency filter” is added to ensure signals only appear when RSI has recently transitioned from strength to weakness or vice versa, reducing false signals in trending markets.
Signal Logic
Bullish Signal (Green Arrow)
A bullish reversal signal is plotted below a candle when:
Price is above both the 5-minute MA200 and the Session VWAP.
RSI is oversold (below 30).
The last time RSI was above 50 occurred within the last 10 candles before going oversold.
This ensures that the dip is a fresh pullback within an uptrend, not a prolonged oversold condition.
Bearish Signal (Red Arrow)
A bearish reversal signal is plotted above a candle when:
Price is below both the 5-minute MA200 and the Session VWAP.
RSI is overbought (above 70).
The last time RSI was below 50 occurred within the last 10 candles before going overbought.
This ensures that the overbought reading follows a recent move from weakness, identifying potential short entries in a downtrend.
Recommended Usage
This is a scalping-focused indicator, intended for use on timeframes of 5 minutes or lower. Therefore I would highly recommend to use it on Equity futures trading, such as NQ!, ES!, GC! and so on.
It performs best when combined with additional tools such as support and resistance zones, order blocks, or liquidity levels for context.
Avoid counter-trend signals unless confirmed by price structure or volume behavior.
Recherche dans les scripts pour "reversal"

Percentile Rank Oscillator (Price + VWMA)A statistical oscillator designed to identify potential market turning points using percentile-based price analytics and volume-weighted confirmation.
What is PRO?
Percentile Rank Oscillator measures how extreme current price behavior is relative to its own recent history. It calculates a rolling percentile rank of price midpoints and VWMA deviation (volume-weighted price drift). When price reaches historically rare levels – high or low percentiles – it may signal exhaustion and potential reversal conditions.
How it works
Takes midpoint of each candle ((H+L)/2)
Ranks the current value vs previous N bars using rolling percentile rank
Maps percentile to a normalized oscillator scale (-1..+1 or 0–100)
Optionally evaluates VWMA deviation percentile for volume-confirmed signals
Highlights extreme conditions and confluence zones
Why percentile rank?
Median-based percentiles ignore outliers and read the market statistically – not by fixed thresholds. Instead of guessing “overbought/oversold” values, the indicator adapts to current volatility and structure.
Key features
Rolling percentile rank of price action
Optional VWMA-based percentile confirmation
Adaptive, noise-robust structure
User-selectable thresholds (default 95/5)
Confluence highlighting for price + VWMA extremes
Optional smoothing (RMA)
Visual extreme zone fills for rapid signal recognition
How to use
High percentile values –> statistically extreme upward deviation (potential top)
Low percentile values –> statistically extreme downward deviation (potential bottom)
Price + VWMA confluence strengthens reversal context
Best used as part of a broader trading framework (market structure, order flow, etc.)
Tip: Look for percentile spikes at key HTF levels, after extended moves, or where liquidity sweeps occur. Strong moves into rare percentile territory may precede mean reversion.
Suggested settings
Default length: 100 bars
Thresholds: 95 / 5
Smoothing: 1–3 (optional)
Important note
This tool does not predict direction or guarantee outcomes. It provides statistical context for price extremes to help traders frame probability and timing. Always combine with sound risk management and other tools.

Delta Volume ReversalThis script displays Delta Volume-based reversal arrows by analyzing buying vs. selling volume from a lower timeframe. An up arrow appears when a red candle closes with dominant buying volume (bullish delta), while a down arrow appears on green candles with dominant selling volume (bearish delta). This highlights potential hidden strength or weakness in price action.
Credits:
Original from Delta Volume by SiddWolf — adapted and enhanced with reversal arrow visualization.

Estimated Manipulation Movement Signal [AlgoPoint]Follow the Footprints of Whale Movements That Drive the Market
Overview
The market is not always driven by natural supply and demand. Large players—often called "whales" or institutions—can create artificial price movements to trigger stop-losses, induce panic or FOMO, and build their large positions at favorable prices. These events are known as "stop hunts" or "liquidity grabs."
The EMMS indicator is a specialized tool designed to detect these specific moments of potential market manipulation. It does not follow trends in a traditional sense; instead, it identifies high-probability reversal points created by the calculated actions of Smart Money trapping other market participants.
How It Works: The 3-Module Logic
The indicator uses a multi-stage confirmation process to identify a potential stop hunt:
1. Anomaly Detection: The engine first scans the chart for "Anomaly Candles." These are candles with unusually high volume and a very long wick relative to their body. This combination signals a sudden, forceful, and potentially unnatural price push.
2. Liquidity Zone Detection: The indicator automatically identifies and tracks recent significant swing highs and lows. These levels are considered "Liquidity Zones" because they are areas where a large number of stop-loss orders are likely clustered. These are the "hunting grounds" for whales.
3. The Stop Hunt Signal: A final signal is generated only when these two events align in a specific sequence:
An Anomaly Candle (high volume, long wick) spikes through a previously identified Liquidity Zone.
The same candle then reverses, closing back inside the previous price range.
This sequence confirms that the move was likely a "trap" designed to engineer liquidity, and a reversal in the opposite direction is now highly probable.
How to Interpret & Use This Indicator
BUY Signal: A BUY signal appears after a sharp price drop that pierces a recent swing low (taking out the stops of long positions) and then aggressively reverses to close higher. This suggests that Smart Money has absorbed the panic selling they just induced. The signal indicates a potential move UP.
SELL Signal: A SELL signal appears after a sharp price spike that pierces a recent swing high (taking out the stops of short positions) and then aggressively reverses to close lower. This suggests that Smart Money has sold into the FOMO buying they just created. The signal indicates a potential move DOWN.
This indicator is best used as a high-probability confirmation tool, ideally in conjunction with your understanding of the overall market trend and structure.

Peak Reversal v3# Peak Reversal v3
## Summary
Peak Reversal v3 adds new configurability, clearer visuals, and a faster trader workflow. The release introduces a new Squeeze Detector , expanded Keltner Channels , and streamlined Momentum signals , with no repaints and improved performance. The menus have been reorganized and simplified. Color swatches have been added for better customization. All other colors will be derived from these swatches.
## Highlights
New Squeeze Detector to mark low-volatility periods and prepare for breakouts.
New: Bands are now fully configurable with independent MA length, ATR length, and multipliers.
Five moving average bases for bands: EMA (from v2), SMA, RMA, VMA, HMA.
Simplified color system: three swatches drive candles, on-chart marks, and band fill.
Reorganized menu with focused sections and tooltips for each parameter making the entire trader experience more intuitive.
No repaints and faster performance across calculations.
## Overview
Configuration : Pick from three color swatches and apply them to candles, plotted characters, and band fill for consistent chart context. Use the reorganized menu to reach Keltner settings, momentum signals, and squeeze detection without extra clicks; tooltips clarify each input.
Bands and averages: Choose the band basis from EMA, SMA, RMA, VMA, or HMA to match your strategy. Configure two bands independently by setting MA length, ATR length, and band multipliers for the inner and outer envelopes.
Signals : Select the band responsible for momentum signals. Choose wick or close as the price source for entries and exits. Control the window for extreme momentum with “Max Momentum Bars,” a setting now exposed in v3 for direct tuning.
Squeeze detection : The Squeeze Detector normalizes band width and uses percentile ranking to highlight volatility compression. When the market falls below a user-defined threshold, the indicator colors the region with a gradient to signal potential expansion.
## Details about major features and changes
### New
Squeeze Detector to highlight low-volatility conditions.
Five MA bases for bands: EMA, SMA, RMA, VMA, HMA.
“Max Momentum Bars” to cap the bars used for extreme momentum.
### Keltner channel improvements
Refactored Keltner settings for flexible inner and outer band control.
MA type selection added; band calculations updated for consistency.
Removed the third Keltner band to reduce noise and simplify setup.
### Display and signals
Gradient fills for band breakouts, mean deviations, and squeeze periods.
“Show Mean EMA?” set to true and default “Signal Band” set to “Inner.”
Clearer tooltips and input descriptions.
### Reliability and performance
No more repaints. The indicator waits for confirmation before drawing occurs.
Faster execution through targeted refactors.
All algorithms have been reviewed and now use a consistent logic, naming, and structure.

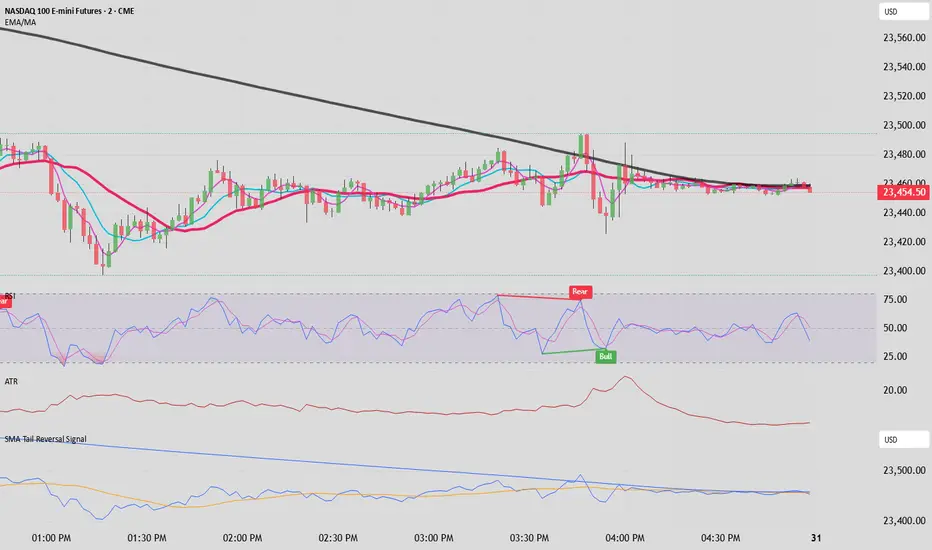
SMA Tail Reversal Signalrubber band trade possible trend reversal bottom and top tail bars a distance away from 200sma can very well start the reversal back toward the 200sma
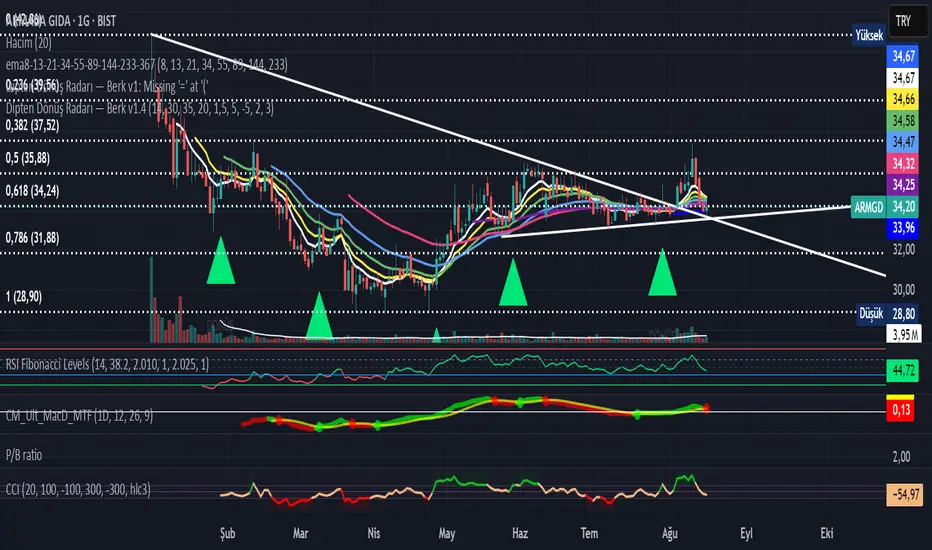
Bottom Reversal Radar — Berk v1.4Bottom Reversal Radar — Berk v1.4
What it does:
Combines RSI recovery after oversold, MACD bull cross, close above EMA8, near-EMA200 proximity, volume expansion, and simple bullish divergence (pivot lows) into a single score.
Signal: Trigger when Score ≥ Threshold (default 3). Set alert via Create Alert → “Dipten Dönüş — Ana Sinyal” → Once per bar close.
How it works
RSI recovery: After touching oversold (30), RSI crosses up 35 within last X bars.
MACD bull cross: MACD Line crosses above Signal.
Close above EMA8 and BOS (close above recent swing high) confirm momentum.
Near EMA200: Price within −5%…+2% band adds a point.
Volume spike: Volume ≥ 1.5× SMA(20) adds a point.
Bullish divergence: Lower price low + higher RSI low (pivot 3/3) adds a point.
Inputs
RSI(14), rsiOS=30, rsiRecover=35, Volume SMA(20) with 1.5× multiplier, EMA200 proximity band −5%…+2%, lookbackBars=5, Score threshold default 3.
Usage tips
Best on Daily / 4H. If too many false positives: raise threshold to 4 and volume to 1.8–2.0×.
Pair with Screener filters: RSI≥35, MACD Line>Signal, Price above EMA8, Volume/Avg(20)≥1.5, and near EMA200 (%).
Disclaimer
For educational purposes only. Not financial advice.
Release notes (v1.4)
Fixed bullDiv typo; simplified visuals; Pine v5.
Tags: rsi, macd, ema, volume, divergence, reversal, trend, screener, bist, stocks, crypto
DTLLC Time & PriceDTLLC Time and Price with Signals
This indicator is built for traders who understand ICT concepts and want a structured, visual way to align time-based price action with key market levels. By combining customizable trading windows, breakout logic, and daily reference points, it helps you identify high-probability trade opportunities while filtering out market noise.
Key Features
1. Dual Custom Time Ranges (Kill Zones)
Set two independent time ranges per day (start/end hour and minute).
Each range identifies the highest high and lowest low within its window.
Built-in breakout detection generates buy/sell signals when price moves beyond these levels.
2. Volatility Filtering
Adjustable volatility threshold based on True Range relative to ATR.
Filters out low-quality signals during choppy, low-volatility conditions.
3. ATR-Based Stop Loss
Custom ATR length and stop-loss multiplier settings.
Automatically plots ATR-based stop levels for triggered trades.
4. Daily Key Levels
Plots Previous Day High, Previous Day Low, and Midnight Open continuously on the chart.
Useful for spotting breakout and reversal opportunities in line with ICT market structure concepts.
5. Liquidity & Engulfing Candle Highlights
Highlights potential liquidity grab zones (yellow candles) when significant highs/lows are set within your lookback period.
Detects bullish (green) and bearish (red) engulfing patterns for added confluence.
6. Visual & Signal Tools
Buy/Sell signals plotted directly on chart (separate colors for Range 1 and Range 2). Continuous plotting of reference levels to maintain market context throughout the session.
Example Use Case:
A common ICT-inspired reversal setup:
Wait for price to sweep the Previous Day’s High or Low during your chosen time range.
Look for a buy or sell signal with volatility confirmation.
Manage risk using the ATR-based stop-loss plot.
Disclaimer: This script is for educational purposes only and is not financial advice. Trade responsibly and always test strategies before applying them in live markets.

WT + Stoch RSI Reversal ComboOverview – WT + Stoch RSI Reversal Combo
This custom TradingView indicator combines WaveTrend (WT) and Stochastic RSI (Stoch RSI) to detect high-probability market reversal zones and generate Buy/Sell signals.
It enhances accuracy by requiring confirmation from both oscillators, helping traders avoid false signals during noisy or weak trends.
🔧 Key Features:
WaveTrend Oscillator with optional Laguerre smoothing.
Stochastic RSI with adjustable smoothing and thresholds.
Buy/Sell combo signals when both indicators agree.
Histogram for WT momentum visualization.
Configurable overbought/oversold levels.
Custom dotted white lines at +100 / -100 levels for reference.
Alerts for buy/sell combo signals.
Toggle visibility for each element (lines, signals, histogram, etc.).
✅ How to Use the Indicator
1. Add to Chart
Paste the full Pine Script code into TradingView's Pine Editor and click "Add to Chart".
2. Understand the Signals
Green Triangle (BUY) – Appears when:
WT1 crosses above WT2 in oversold zone.
Stoch RSI %K crosses above %D in oversold region.
Red Triangle (SELL) – Appears when:
WT1 crosses below WT2 in overbought zone.
Stoch RSI %K crosses below %D in overbought region.
⚠️ A signal only appears when both WT and Stoch RSI agree, increasing reliability.
3. Tune Settings
Open the settings ⚙️ and adjust:
Channel Lengths, smoothing, and thresholds for both indicators.
Enable/disable visibility of:
WT lines
Histogram
Stoch RSI
Horizontal level lines
Combo signals
4. Use with Price Action
Use this indicator in conjunction with support/resistance zones, chart patterns, or trendlines.
Works best on lower timeframes (5m–1h) for scalping or 1h–4h for swing trading.
5. Set Alerts
Set alerts using:
"WT + Stoch RSI Combo BUY Signal"
"WT + Stoch RSI Combo SELL Signal"
This helps you catch setups in real time without watching the chart constantly.
📊 Ideal Use Cases
Reversal trading from extremes
Mean reversion strategies
Timing entries/exits during consolidations
Momentum confirmation for breakouts

ATR Trailing + Alerts + Price LabelsATR Trend is a clean and intelligent trend-following overlay built for traders who want clarity during both trending and ranging markets.
This indicator dynamically detects bullish and bearish market trends using the Average True Range (ATR), applying a confirmation-based approach to filter out false signals and minor pullbacks.
The trend line is:
Blue 🔵 during uptrends.
Black ⚫ during downtrends.
Continuous, recalculating only when the market truly shifts — not just when price temporarily crosses the line.
When a confirmed trend reversal occurs:
A 🔼 or 🔽 label shows the exact price of the flip.
An alert can be triggered to notify the user immediately.
💡 Features:
✅ Single-line trend direction
✅ Filters out short-term noise
✅ Exact price labeling on trend change
✅ Built-in alerts for up/down trend shifts
⚙️ Inputs:
ATR Period – Length of ATR calculation (default: 14)
ATR Multiplier – Offset for trend line placement (default: 2.0)
Flip Sensitivity – Number of bars required to confirm a trend reversal (default: 3)
This tool is suitable for:
Swing traders avoid false breakouts
Scalpers looking for high-probability trend entries
Algorithmic setups requiring structured trend logic

Pin Bar Reversal StrategyStrategy: Pin Bar Reversal with Trend Filter
One effective high-probability setup is a Pin Bar reversal in the direction of the larger trend. A pin bar is a candlestick with a tiny body and a long wick, signaling a sharp rejection of price
By itself, a pin bar often marks a potential reversal, but not all pin bars lead to profitable moves. To boost reliability, this strategy trades pin bars only when they align with the prevailing trend – for example, taking a bullish pin bar while the market is in an uptrend, or a bearish pin bar in a downtrend. The trend bias can be determined by a long-term moving average or higher timeframe analysis.
Why it works: In an uptrend, a bullish pin bar after a pullback often indicates that sellers tried to push price down but failed, and buyers are resuming control. Filtering for pin bars near key support or moving averages further improves odds of success. This aligns the entry with both a strong price pattern and the dominant market direction, yielding a higher win rate. The pin bar’s own structure provides natural levels for stop and target placement, keeping risk management straightforward.
Example Setup:
USDCHF - 4 Hour Chart
Trend SMA 12
Max Body - 34
Min Wick - 66
ATR -15
ATR Stop Loss Multiplier - 2.3
ATR Take Profit Multiplier - 2.9
Minimum ATR to Enter - 0.0025

Liquidity Sweep Reversal [Grimoire]The Liquidity Sweep Reversal indicator is designed to spot potential turning points by watching for “liquidity sweeps” above key prior highs. Specifically, it marks when price briefly pushes above levels such as:
The high of the previous candle
The high of the prior trading day
The high of the previous week
These sweeps often trigger stop-hunts or liquidity hunts, after which price frequently reverses. By highlighting those moments, the indicator helps you anticipate and trade these reversal moves more easily.

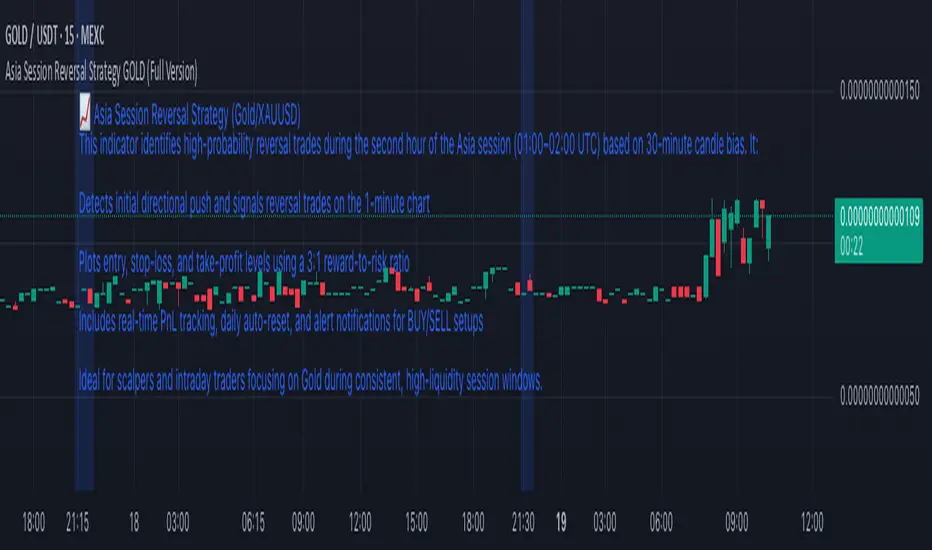
Asia Session Reversal Strategy GOLD (Full Version)📈 Asia Session Reversal Strategy (Gold/XAUUSD)
This indicator identifies high-probability reversal trades during the second hour of the Asia session (01:00–02:00 UTC) based on 30-minute candle bias. It:
Detects initial directional push and signals reversal trades on the 1-minute chart
Plots entry, stop-loss, and take-profit levels using a 3:1 reward-to-risk ratio
Includes real-time PnL tracking, daily auto-reset, and alert notifications for BUY/SELL setups
Ideal for scalpers and intraday traders focusing on Gold during consistent, high-liquidity session windows.
OB Sweeps ReversalOB Sweeps Reversal is a high-precision market structure tool that identifies and dynamically tracks bullish and bearish order blocks — key zones where institutional participants are likely to be active. These zones act as support and resistance levels, adapting to market behavior in real time.
The script monitors price interaction with each OB and classifies its status as:
Unmitigated (price has not yet returned)
Mitigating (price is testing the zone)
Invalidated (zone has been broken)
Traders can use these zones directly as actionable support/resistance — or wait for additional confirmation via the system’s liquidity sweep detection and optional filters.
🔍 Key Features:
Automatically detects and plots bullish and bearish OBs
Tracks mitigation status and updates visuals accordingly
Detects liquidity sweeps of recent highs/lows
Optional filters:
• 200 EMA trend direction
• Momentum of current or previous candle
Plots stop-loss and take-profit lines using ATR-based logic
Clean entry labels with full contextual data
Built-in alert system with constant-string messages (automation ready)
📈 How to Use:
Load the script on any timeframe (15m–4H recommended)
Observe the live OB zones as they develop
Trade based on price interaction:
• Bounce off a bullish OB = potential long setup
• Rejection from a bearish OB = potential short
• Sweep + snapback into an OB = optional trap reversal entry
SL/TP levels are drawn automatically for reference
Use alerts to automate or monitor high-conviction setups
The order blocks themselves are valuable on their own — even without waiting for a signal. They can be used as dynamic support and resistance zones, offering excellent structure-based trading opportunities.
🧠 Ideal For:
Traders who follow price action and market structure
Those using support/resistance, OBs, or supply/demand
Intraday and swing traders looking for cleaner structure alignment
Users who prefer low-frequency, high-quality setups
⚠️ Note:
This tool does not produce frequent signals. It is designed for precision and discipline, with a focus on clarity and confluence. It complements — not replaces — a trader’s decision-making process.
This script is open-source and designed with integrity, precision, and trader usability in mind. No links, no upsells, no promotions — just a reliable system for structural market analysis.

Auto TrendLines [TradingFinder] Support Resistance Signal Alerts🔵 Introduction
The trendline is one of the most essential tools in technical analysis, widely used in financial markets such as Forex, cryptocurrency, and stocks. A trendline is a straight line that connects swing highs or swing lows and visually indicates the market’s trend direction.
Traders use trendlines to identify price structure, the strength of buyers and sellers, dynamic support and resistance zones, and optimal entry and exit points.
In technical analysis, trendlines are typically classified into three categories: uptrend lines (drawn by connecting higher lows), downtrend lines (formed by connecting lower highs), and sideways trends (moving horizontally). A valid trendline usually requires at least three confirmed touchpoints to be considered reliable for trading decisions.
Trendlines can serve as the foundation for a variety of trading strategies, such as the trendline bounce strategy, valid breakout setups, and confluence-based analysis with other tools like candlestick patterns, divergences, moving averages, and Fibonacci levels.
Additionally, trendlines are categorized into internal and external, and further into major and minor levels, each serving unique roles in market structure analysis.
🔵 How to Use
Trendlines are a key component in technical analysis, used to identify market direction, define dynamic support and resistance zones, highlight strategic entry and exit points, and manage risk. For a trendline to be reliable, it must be drawn based on structural principles—not by simply connecting two arbitrary points.
🟣 Selecting Pivot Types Based on Trend Direction
The first step is to determine the market trend: uptrend, downtrend, or sideways.
Then, choose pivot points that match the trend type :
In an uptrend, trendlines are drawn by connecting low pivots, especially higher lows.
In a downtrend, trendlines are formed by connecting high pivots, specifically lower highs.
It is crucial to connect pivots of the same type and structure to ensure the trendline is valid and analytically sound.
🟣 Pivot Classification
This indicator automatically classifies pivot points into two categories :
Major Pivots :
MLL : Major Lower Low
MHL : Major Higher Low
MHH : Major Higher High
MLH : Major Lower High
These define the primary structure of the market and are typically used in broader structural analysis.
Minor Pivots :
mLL: minor Lower Low
mHL: minor Higher Low
mHH: minor Higher High
mLH: minor Lower High
These are used for drawing more precise trendlines within corrective waves or internal price movements.
Example : In a downtrend, drawing a trendline from an MHH to an mHH creates structural inconsistency and introduces noise. Instead, connect points like MHL to MHL or mLH to mLH for a valid trendline.
🟣 Drawing High-Precision Trendlines
To ensure a reliable trendline :
Use pivots of the same classification (Major with Major or Minor with Minor).
Ensure at least three valid contact points (three touches = structural confirmation).
Draw through candles with the least deviation (choose wicks or bodies based on confluence).
Preferably draw from right to left for better alignment with current market behavior.
Use parallel lines to turn a single trendline into a trendline zone, if needed.
🟣 Using Trendlines for Trade Entries
Bounce Entry: When price approaches the trendline and shows signs of reversal (e.g., a reversal candle, divergence, or support/resistance), enter in the direction of the trend with a logical stop-loss.
Breakout Entry: When price breaks through the trendline with strong momentum and a confirmation (such as a retest or break of structure), consider trading in the direction of the breakout.
🟣 Trendline-Based Risk Management
For bounce entries, the stop-loss is placed below the trendline or the last pivot low (in an uptrend).
For breakout entries, the stop-loss is set behind the breakout candle or the last structural level.
A broken trendline can also act as an exit signal from a trade.
🟣 Combining Trendlines with Other Tools (Confluence)
Trendlines gain much more strength when used alongside other analytical tools :
Horizontal support and resistance levels
Moving averages (such as EMA 50 or EMA 200)
Fibonacci retracement zones
Candlestick patterns (e.g., Engulfing, Pin Bar)
RSI or MACD divergences
Market structure breaks (BoS / ChoCH)
🔵 Settings
Pivot Period : This defines how sensitive the pivot detection is. A higher number means the algorithm will identify more significant pivot points, resulting in longer-term trendlines.
Alerts
Alert :
Enable or disable the entire alert system
Set a custom alert name
Choose how often alerts trigger (every time, once per bar, or on bar close)
Select the time zone for alert timestamps (e.g., UTC)
Each trendline type supports two alert types :
Break Alert : Triggered when price breaks the trendline
React Alert : Triggered when price reacts or bounces off the trendline
These alerts can be independently enabled or disabled for all trendline categories (Major/Minor, Internal/External, Up/Down).
Display :
For each of the eight trendline types, you can control :
Whether to show or hide the line
Whether to delete the previous line when a new one is drawn
Color, line style (solid, dashed, dotted), extension direction (e.g., right only), and width
Major lines are typically thicker and more opaque, while minor lines appear thinner and more transparent.
All settings are designed to give the user full control over the appearance, behavior, and alert system of the indicator, without requiring manual drawing or adjustments.
🔵 Conclusion
A trendline is more than just a line on the chart—it is a structural, strategic, and flexible tool in technical analysis that can serve as the foundation for understanding price behavior and making trading decisions. Whether in trending markets or during corrections, trendlines help traders identify market direction, key zones, and high-potential entry and exit points with precision.
The accuracy and effectiveness of a trendline depend on using structurally valid pivot points and adhering to proper market logic, rather than relying on guesswork or personal bias.
This indicator is built to solve that exact problem. It automatically detects and draws multiple types of trendlines based on actual price structure, separating them into Major/Minor and Internal/External categories, and respecting professional analytical principles such as pivot type, trend direction, and structural location.

SMA7 Tail Reversal📌 Description:
The SMA7 Tail Reversal indicator is designed to identify potential counter-trend trading opportunities by checking if candle wicks (tails) respect a key moving average level (SMA7).
This indicator highlights price action where candles are clearly separated from the moving average, suggesting a possible reversal or temporary correction.
📌 How It Works:
Moving Average Calculation:
Calculates a simple moving average (SMA) of length 7 to act as the primary trend filter.
Candle Classification:
Bullish Candle: A candle where the closing price is higher than the opening price, with a short upper wick.
Bearish Candle: A candle where the closing price is lower than the opening price, with a short lower wick.
Conditions for Coloring Candles:
Long Condition (Green Candle):
High & Low are both below the SMA7 line.
Volume is above the 20-period average.
A bullish candle is detected.
Short Condition (Red Candle):
High & Low are both above the SMA7 line.
Volume is above the 20-period average.
A bearish candle is detected.
📌 Visual Representation:
Green Candles: Potential long signals when price action stays below the SMA7 line.
Red Candles: Potential short signals when price action stays above the SMA7 line.
Yellow Line: SMA7, used as the dynamic threshold for signal generation.
📌 Usage:
Best applied to volatile markets with clear trends.
Effective in detecting counter-trend opportunities where price diverges from the SMA7 line.
Works well with additional confirmation tools for better accuracy.

FVG Reversal Sentinel🔵 FVG Reversal Sentinel – Multi-Timeframe Fair Value Gap Indicator
The FVG Reversal Sentinel is a powerful TradingView indicator designed to help traders identify and track Fair Value Gaps (FVGs) across multiple timeframes, all within a single chart.
This tool allows you to select up to five separate timeframes, ensuring you never miss key market shifts, whether you are scalping, day trading, or swing trading. You can use this indicator in any asset (Cryptos, Futures, Indices, Forex Pairs, etc.).
🔵 - Key Features -
Multi-Timeframe FVG Tracking – Select and display up to five different timeframes on one chart, providing a comprehensive view of market structure.
Customizable Colors – Adjust bullish and bearish FVG colors to match your chart theme for a seamless trading experience.
Enhanced Market Context – Quickly identify key liquidity zones and refine your entries and exits with precision.
Hide the lower timeframes FVGs to get a clear view in a custom timeframe.
Show or hide mitigated FVGs to declutter the chart.
FVGs boxes are going to be displayed only when the candle bar closes
FVGs are going to be mitigated only when the body of the candle closes above or below the FVG area.
No repainting
Whether you're looking to fine-tune your entries or gain a broader market perspective, the FVG Reversal Sentinel indicator ensures you have the tools to stay ahead of price action and capitalize on market inefficiencies.
🔵 - Customization-
You can change the indicator settings as you see fit to achieve the best results for your use case.
TIMEFRAMES
This indicator provides the ability to select up to 5 timeframes. These timeframes are based on the trader's timeframes including any custom timeframes.
Select the desired timeframe from the options list.
Add the label text you would like to show for the selected timeframe.
Check or uncheck the box to display or hide the timeframe from your chart.
FVG SETTINGS
Length of boxes: allows you to select the length of the box that is going to be displayed for the FVGs.
Delete boxes after fill?: allows you to show or hide mitigated FVGs on your chart.
Hide FVGs lower than enabled timeframes?: allows you to show or hide lower timeframe FVGs on your chart. Example - You are in a 15 minutes timeframe chart, if you choose to hide lower timeframe FVGs you will not be able to see 5 minutes FVG defined in your Timeframes Settings, only 15 minutes or higher timeframe FVGs will be displayed on your chart.
BOX VISUALS
Bullish FVG box color: the color and opacity of the box for the bullish FVGs.
Bearish FVG box color: the color and opacity of the box for the bearish FVGs.
LABELS VISUALS
Bullish FVG labels color: the color for bullish labels.
Bearish FVG labels color: the color for bearish labels.
Labels size: the size of the text displayed in the labels.
Labels position: the position of the label inside the FVGs boxes (right, left or center).
BORDER VISUALS
Border width: the width of the border (the thickness).
Bullish FVG border color: the color and the opacity of the bullish box border.
Bearish FVG border color: the color and the opacity of the bearish box border.
🔵 - How to use the indicator -
Just add the indicator in your chart and click in the settings option to customize it.
Make sure you select the desired timeframes and set the colors and opacity for the FVGs boxes.
This indicator can be used in many trading strategies, such as:
SILVER BULLET
iFVG
iFVG RETEST
These strategies are based on the use of FVGs, this tool can help you analyze the market and make the right decision.
🔵 - How was the indicator designed? -
I have spent a lot of time testing other open source indicators from the community. All of these indicators do a great job, but they have a problem, they not only mitigate FVGs when a candle closes above or below the FVG, they also mitigate FVGs when the candle closes exactly to the tick (not above or below the FVG). This is a problem for many strategies that rely on FVGs mitigation.
What makes this indicator different is that it focuses on just mitigating imbalances at the right time for these strategies.
I have taken ideas and some pieces of code from many community indicator developers, such as:
@twingall
@tflab
@marktools
@nacho-fx
@pmk07
... and many other people, to whom I thank for their valuable work and have allowed me to create this tool by making modifications to their source code.
🔵 - Disclaimer -
This tool is intended solely for informational and educational purposes and should not be regarded as financial, investment, or trading advice. It's not designed to predict market movements or offer specific recommendations. Users should be aware that past performance is not indicative of future results and should not rely on any indicator for financial decisions.

Buy on 5 day low Strategy█ STRATEGY DESCRIPTION
The "Buy on 5 Day Low Strategy" is a mean-reversion strategy designed to identify potential buying opportunities when the price drops below the lowest low of the previous five days. It enters a long position when specific conditions are met and exits when the price exceeds the high of the previous day. This strategy is optimized for use on daily or higher timeframes.
█ WHAT IS THE 5-DAY LOW?
The 5-Day Low is the lowest price observed over the last five days. This level is used as a reference to identify potential oversold conditions and reversal points.
█ SIGNAL GENERATION
1. LONG ENTRY
A Buy Signal is triggered when:
The close price is below the lowest low of the previous five days (`close < _lowest `).
The signal occurs within the specified time window (between `Start Time` and `End Time`).
2. EXIT CONDITION
A Sell Signal is generated when the current closing price exceeds the high of the previous day (`close > high `). This indicates that the price has shown strength, potentially confirming the reversal and prompting the strategy to exit the position.
█ ADDITIONAL SETTINGS
Start Time and End Time: The time window during which the strategy is allowed to execute trades.
█ PERFORMANCE OVERVIEW
This strategy is designed for mean-reverting markets and performs best when the price frequently oscillates around key support levels.
It is sensitive to oversold conditions, as indicated by the 5-Day Low, and overbought conditions, as indicated by the previous day's high.
Backtesting results should be analyzed to optimize the strategy for specific instruments and market conditions.

3-Bar Low Strategy█ STRATEGY DESCRIPTION
The "3-Bar Low Strategy" is a mean-reversion strategy designed to identify potential buying opportunities when the price drops below the lowest low of the previous three bars. It enters a long position when specific conditions are met and exits when the price exceeds the highest high of the previous seven bars. This strategy is suitable for use on various timeframes.
█ WHAT IS THE 3-BAR LOW?
The 3-Bar Low is the lowest price observed over the last three bars. This level is used as a reference to identify potential oversold conditions and reversal points.
█ WHAT IS THE 7-BAR HIGH?
The 7-Bar High is the highest price observed over the last seven bars. This level is used as a reference to identify potential overbought conditions and exit points.
█ SIGNAL GENERATION
1. LONG ENTRY
A Buy Signal is triggered when:
The close price is below the lowest low of the previous three bars (`close < _lowest `).
The signal occurs within the specified time window (between `Start Time` and `End Time`).
If the EMA Filter is enabled, the close price must also be above the 200-period Exponential Moving Average (EMA).
2. EXIT CONDITION
A Sell Signal is generated when the current closing price exceeds the highest high of the previous seven bars (`close > _highest `). This indicates that the price has shown strength, potentially confirming the reversal and prompting the strategy to exit the position.
█ ADDITIONAL SETTINGS
MA Period: The lookback period for the 200-period EMA used in the EMA Filter. Default is 200.
Use EMA Filter: Enables or disables the EMA Filter for long entries. Default is disabled.
Start Time and End Time: The time window during which the strategy is allowed to execute trades.
█ PERFORMANCE OVERVIEW
This strategy is designed for mean-reverting markets and performs best when the price frequently oscillates around key support and resistance levels.
It is sensitive to oversold conditions, as indicated by the 3-Bar Low, and overbought conditions, as indicated by the 7-Bar High.
Backtesting results should be analyzed to optimize the MA Period and EMA Filter settings for specific instruments.

Dynamic Support and Resistance Pivot Strategy The Dynamic Support and Resistance Pivot Strategy is a flexible and adaptive tool designed to identify short-term support and resistance levels using the concept of price pivots.
### Key Elements of the Strategy
1. Pivot points as support and resistance levels
Pivots are significant turning points on the price chart, often marking local highs and lows where the price has reversed direction. A pivot high occurs when the price forms a local peak, while a pivot low occurs when the price forms a local trough. When a new pivot high is formed, it creates a resistance level. Conversely, when a new pivot low is formed, it creates a support level.
The strategy continuously updates these levels as new pivots are detected, ensuring they remain relevant to the current market conditions. By identifying these price levels, the strategy dynamically adjusts to market conditions, allowing it to adapt to both trending and ranging markets, since it has a long target and can perform reversal operations.
2. Entry Criteria
- Buy (Long): A long position is triggered when the price is near the support level and then crosses it from below to above. This suggests that the price has found support and may start moving upwards.
- Sell (Short): A short position is triggered when the price is near the resistance level and then crosses it from above to below. This indicates that the price may be reversing and moving downward.
3. Support/Resistance distance (%)
- This parameter establishes a percentage range around the identified support and resistance level. For example, if the Support Resistance Distance is 0.4% (default), the closing price must be within a range of 0.4% above support or below the resistance to be considered "close" and trigger a trade.
4. Exit criteria
- Take profit = 27 %
- Stop loss = 10 %
- Reversal if a new entry point is identified in the opposite direction
5. No Repainting
- The Dynamic Support and Resistance Pivot Strategy is not subject to repainting.
6. Position Sizing by Equity and risk management
- This strategy has a default configuration to operate with 35% of the equity. The stop loss is set to 10% from the entry price. This way, the strategy is putting at risk about 10% of 35% of equity, that is, around 3.5% of equity for each trade. The percentage of equity and stop loss can be adjusted by the user according to their risk management.
7. Backtest results
- This strategy was subjected to backtest and operations in replay mode on **1000000MOGUSDT.P**, with the inclusion of transaction fees at 0.12% and slipagge of 5 ticks, and the past results have shown consistent profitability. Past results are no guarantee of future results. The strategy's backtest results may even be due to overfitting with past data.
8. Chart Visualization
- Support and resistance levels are displayed as green (support) and red (resistance) lines.
- Pivot prices are displayed as green (pivot low) and red (pivot high) labels.
In this image above, the Support/Resistance distance (%) parameter was set to 0.8.
9. Default Configuration
Chart Timeframe: 1h
Pivot Lengh: 2
Support/Resistance distance (%): 0.4*
Stop Loss: 10 %
Take Profit: 27 %
* This parameter can alternatively be set to 0.8.
10. Alternative Configuration
Chart Timeframe: 20 min
Pivot Lengh: 4
Support/Resistance distance (%): 0.1
Stop Loss: 10 %
Take Profit: 25 %
BYBIT:1000000MOGUSDT.P

VRS (Vegas Reversal Strategy)It is based on the reversal of the price after an accentuated volatility of the previous day. It is tested only on BTC, TF Day, and has an activation value equal to a spike of minimum 2.4% amplitude, a value that I have left in the settings free to be modified if it is found valid for other assets.
In the settings you can change how many of the latest longs or shorts I want to view in the past, colors and various aesthetics.
When the system detects a spike at the end of the day from 2.4% onwards it will signal the direction of Reversal, generating the 3 TP, dotted lines.
Entry into the market must be done at the close of the candle day, unfortunately at night time if you want to enter on the tick.
Stop above/below the spike that generated the condition.
If the Day2 candle closes FULL inside the spike, immediate and early closing of the operation.
There cannot be two consecutive Day events: if you are Long or Short and have taken a stop on the next candle, even if the latter generates another entry, this must not be activated.
TP 1 and 2 are both mandatory at 33% of the position, TP3, based on the current movement, can be considered to be left to run to the bitter end or in any case to structuring confirmations of a slowdown in the price.
Upon reaching TP1 it is mandatory to move the STOP to even.
In the event of the presence of extremely strong directional movements, for example Long direction, an opposite activation, Short, must be done but with reduced capital, on the contrary an activation in the same direction as the trend movement can be done with a surcharge. Always pay attention to Money Management and Risk Management.
Always manage Risk and Money Management in an adequate, technical and sustainable manner in relation to your capital. A fair exposure per transaction is between 1% and 2% of the capital.

VAWSI and Trend Persistance Reversal Strategy SL/TPThis is a completely revamped version of my "RSI and ATR Trend Reversal Strategy."
What's New?
The RSI has been replaced with an original indicator of mine, the "VAWSI," as I've elected to call it.
The standard RSI measures a change in an RMA to determine the strength of a movement.
The VAWSI performs very similarly, except it uses another original indicator of mine, the VAWMA.
VAWMA stands for "Volume (and) ATR Weight Moving Average." It takes an average of the volume and ATR and uses the ratio of each bar to weigh a moving average of the source.
It has the same formula as an RSI, but uses the VAWMA instead of an RMA.
Next we have the Trend Persistence indicator, which is an index on how long a trend has been persisting for. It is another original indicator. It takes the max deviation the source has from lowest/highest of a specified length. It then takes a cumulative measure of that amount, measures the change, then creates a strength index with that amount.
The VAWSI is a measure of an emerging trend, and the Trend Persistence indicator is a measure of how long a trend has persisted.
Finally, the 3rd main indicator, is a slight variation of an ATR. Rather than taking the max of source - low or high- source and source - source , it instead takes the max of high-low and the absolute value of source - the previous source. It then takes the absolute value of the change of this, and normalizes it with the source.
Inputs
Minimum SL/TP ensures that the Stop Loss and Take Profit still exist in untrendy markets. This is the minimum Amount that will always be applied.
VAWSI Weight is a divided by 100 multiplier for the VAWSI. So value of 200 means it is multiplied by 2. Think of it like a percentage.
Trend Persistence weight and ATR Weight are applied the same. Higher the number, the more impactful on the final calculation it is.
Combination Mult is an outright multiplier to the final calculation. So a 2.0 = * 2.0
Trend Persistence Smoothing Length is the length of the weighted moving average applied to the Trend Persistence Strength index.
Length Cycle Decimal is a replacement of length for the script.
Here we used BlackCat1402's Dynamic Length Calculation, which can be found on his page. With his permission we have implemented it into this script. Big shout out to them for not only creating, but allowing us to use it here.
The Length Cycle Decimal is used to calculate the dynamic length. Because TradingView only allows series int for their built-in library, a lot of the baseline indicators we use have to be manually recreated as functions in the following section.
The Strategy
As usual, we use Heiken Ashi values for calculations.
We begin by establishing the minimum SL/TP for use later.
Next we determine the amount of bars back since the last crossup or crossdown of our threshold line.
We then perform some normalization of our multipliers. We want a larger trend or larger VAWSI amount to narrow the threshold, so we have 1 divide them. This way, a higher reading outputs a smaller number and vice versa. We do this for both Trend Persistence, and the VAWSI.
The VAWSI we also normalize, where rather than it being a 0-100 reading of trend direction and strength, we absolute it so that as long as a trend is strong, regardless of direction, it will have a higher reading. With these normalized values, we add them together and simply subtract the ATR measurement rather than having 1 divide it.
Here you can see how the different measurements add up. A lower final number suggests imminent reversal, and a higher final number suggests an untrendy or choppy market.
ATR is in orange, the Trend Persistence is blue, the VAWSI is purple, and the final amount is green.
We take this final number and depending on the current trend direction, we multiply it by either the Highest or Lowest source since the last crossup or crossdown. We then take the highest or lowest of this calculation, and have it be our Stop Loss or Take Profit. This number cannot be higher/lower than the previous source to ensure a rapid spike doesn't immediately close your position on a still continuing trend. As well, the threshold cannot be higher/ lower than the the specified Stop Loss and Take Profit
Only after the source has fully crossed these lines do we consider it a crossup or crossdown. We confirm this with a barstate.isconfirmed to prevent repainting. Next, each time there is a crossup or crossdown we enter a long or a short respectively and plot accordingly.
I have the strategy configured to "process on order close" to ensure an accurate backtesting result. You could also set this to false and add a 1 bar delay to the "if crossup" and "if crossdown" lines under strategy so that it is calculated based on the open of the next bar.
Final Notes
The amounts have been preconfigured for performance on RIOT 5 Minute timeframe. Other timeframes are viable as well. With a few changes to the parameters, this strategy has backtested well on NVDA, AAPL, TSLA, and AMD. I recommend before altering settings to try other timeframes first.
This script does not seem to perform nearly as well in typically untrendy and choppy markets such as crypto and forex. With some setting changes, I have seen okay results with crypto, but overfitting could be the cause there.
Thank you very much, and please enjoy.

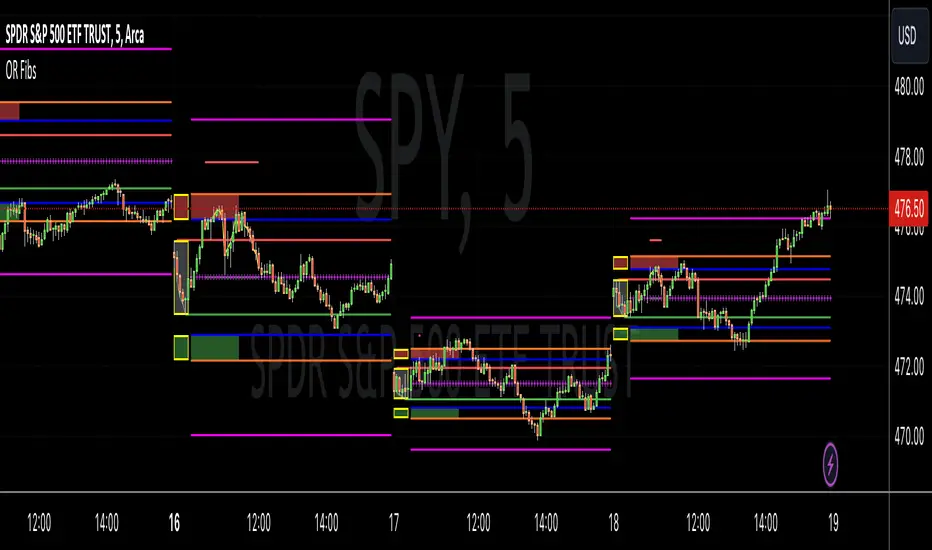
Opening Range Reversal ZonesThis script finds a reversal zone beyond the opening range for the selected period. I borrowed most of the opening range script itself from asenski.
I added a few things:
Trade Entry Times -- this restricts the "alert times."
Shading for the above mentioned times for the two "reversal" zones
A couple of other visuals for lines for the hi, mid, low of the opening range and lines for the fibs
Alerts while in the trading entry time session for fibbonacci crossovers.
I use this on NDX, SPY, and QQQs and have found buying "at the money" 0DTE puts in the "red zone" or 0DTE calls in the "green zone" frequently wins.
I have no statistics, as I am very methodical when I choose to enter, paying attention to the news, recent momentum, etc, and am not blindly entering when alert comes, but when one does, I do research and enter a trade.
In any case, thought I would share.