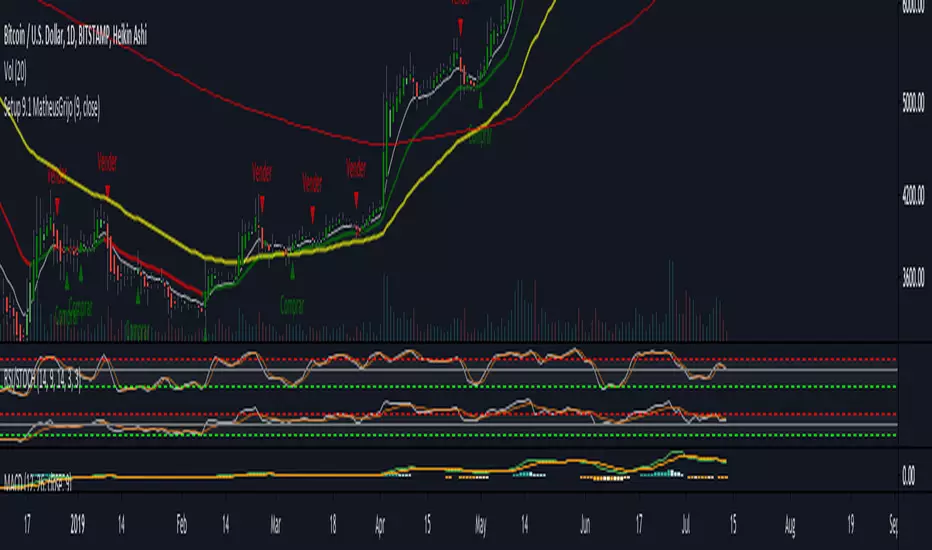
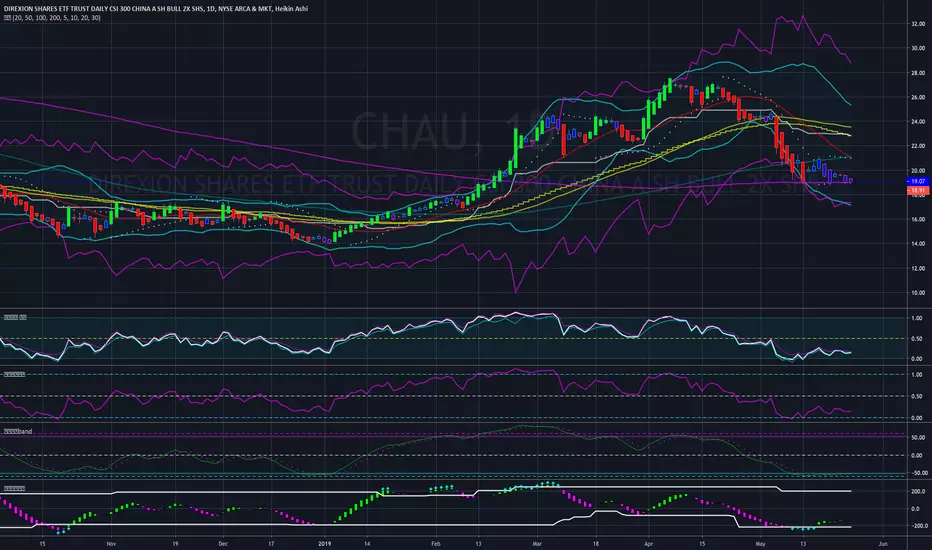
RSI + EMA and STOCHRSI with control zones and highlighted EMA, plotted with stochastic oscillator Indicateur Pine Script®par xespirit163
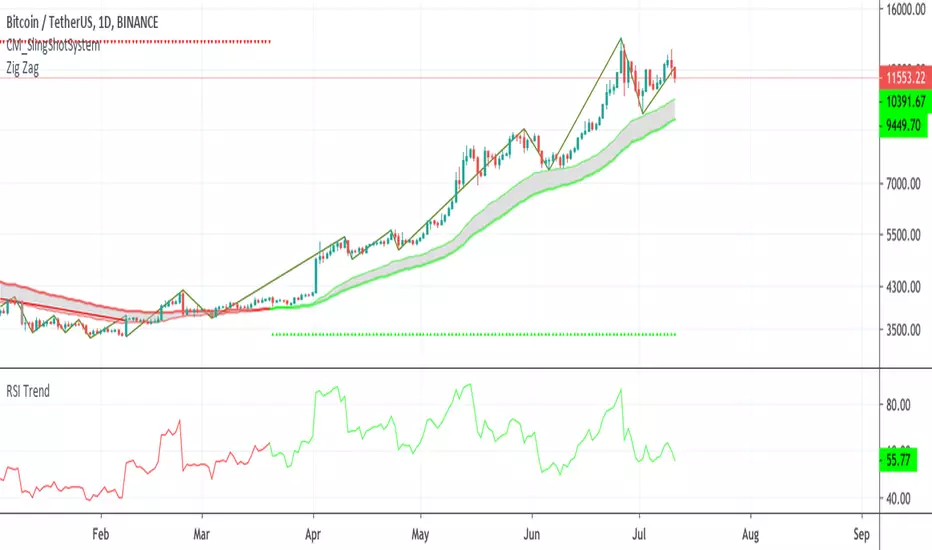
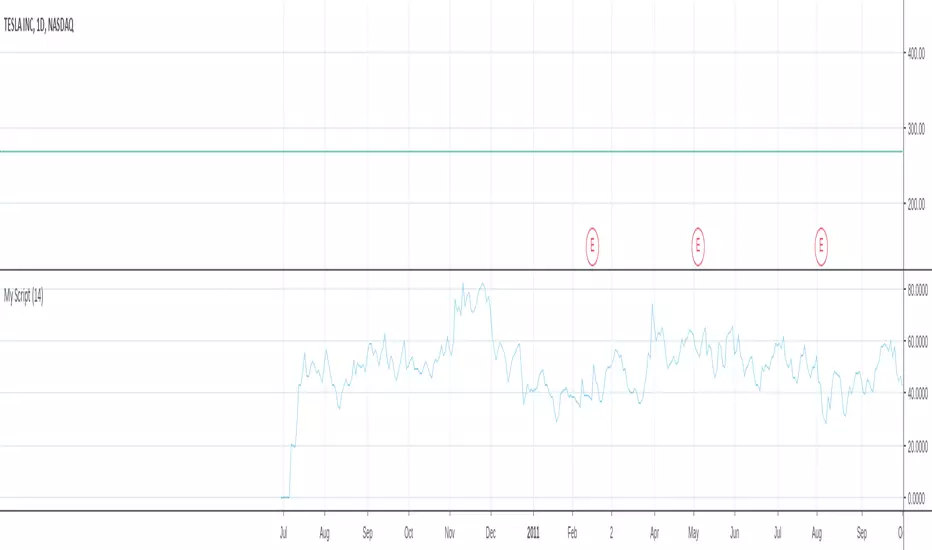
RSI Chart by Atilla YurtsevenRSI Chart helps me to spot divergences easily. Give this a try. Disclaimer: This is not financial advice Trade safe, Atilla YurtsevenIndicateur Pine Script®par AtillaYurtseven1010424
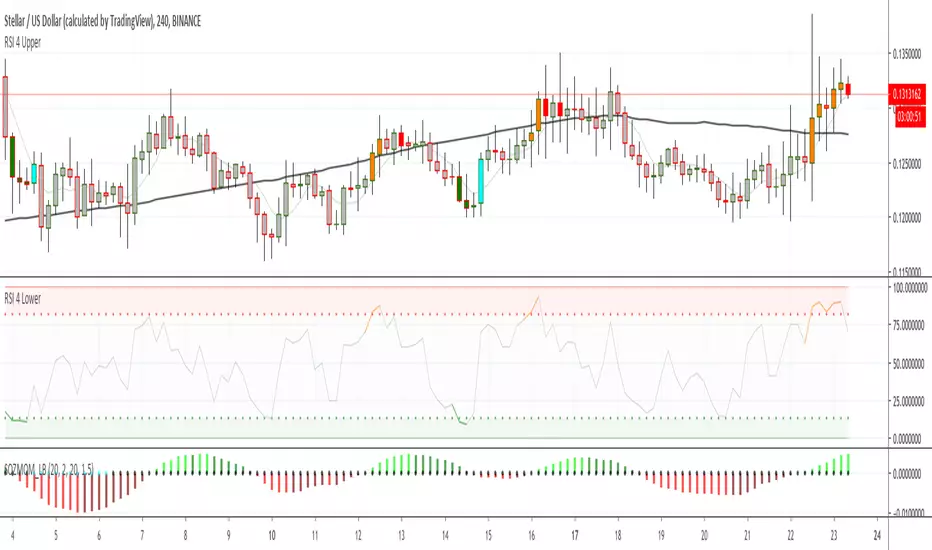
RSI 4 Upper (tweak)RSI 4 Upper (Created by ChrisMoody, tweak by thek4in)Indicateur Pine Script®par thek4in18
RSI B% with high & lowsRSI B% with high and low in the given candle stickIndicateur Pine Script®par violetmoon2
RSI EMA Crossover Bear/Bull IndicatorRSI EMA Crossover Bear/Bull IndicatorIndicateur Pine Script®par nil1228599
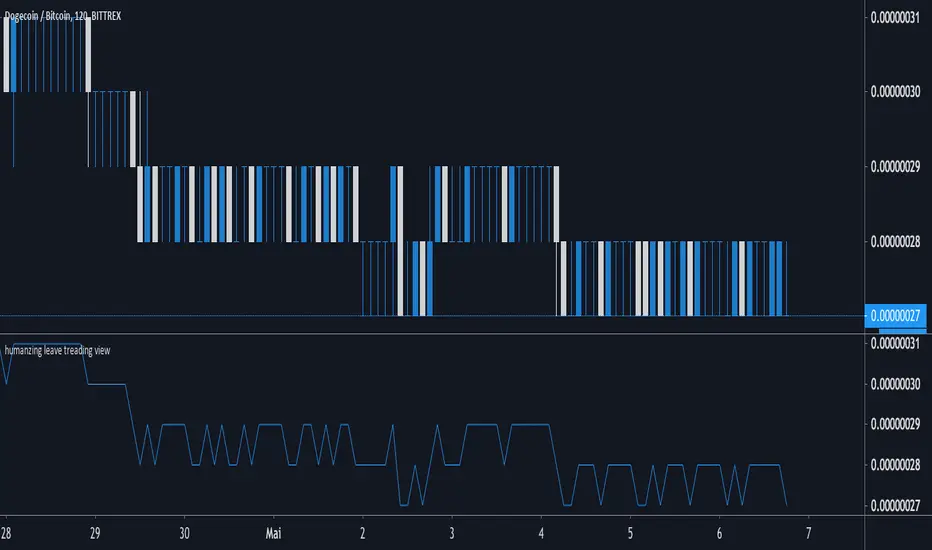
RSI subtractionRSI substraction = RSI1 - RSI2 checkbox on => display RSI1 & RSI2 Indicateur Pine Script®par matsu_bitmex11180
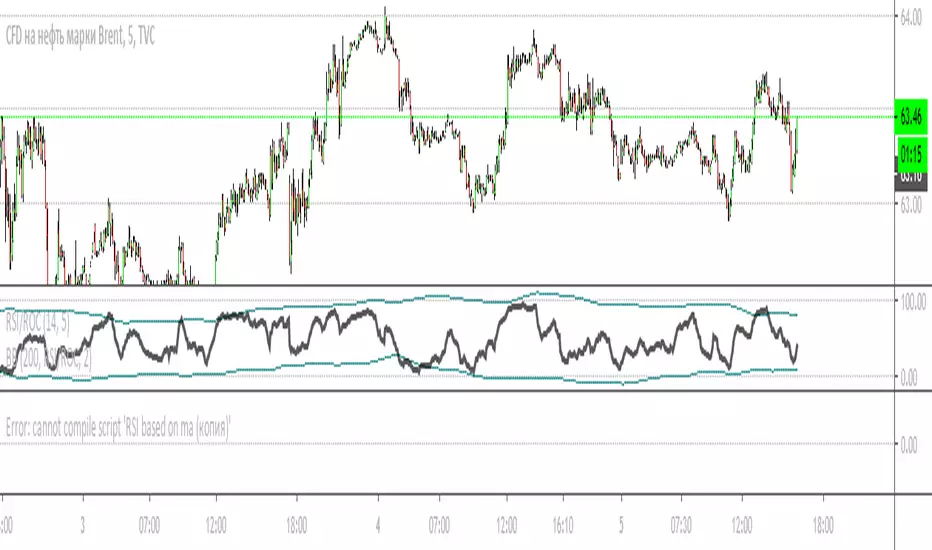
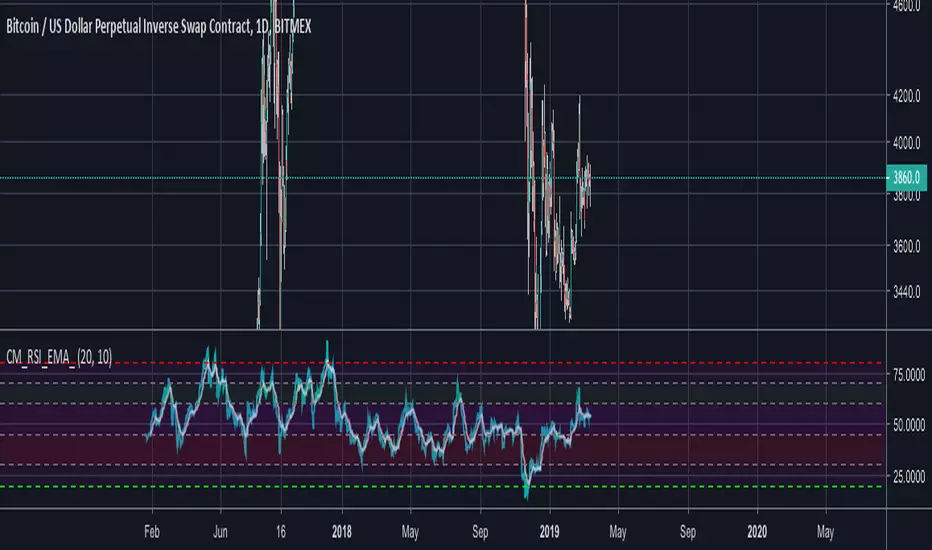
RSI TrabalzaRSi with bullish control (Green), bearish control (Red) and Neutral zoneIndicateur Pine Script®par DariusTrabalza6