Indicateur Pine Script®
Recherche dans les scripts pour "scalp"
Indicateur Pine Script®
Swing Structure + Session Sweeps“Scalper-Friendly Trend & Sweep Detector”
Swing Structure + Session Sweeps with TEMA Cloud
This powerful all-in-one tool is designed for intraday traders, swing traders, and scalpers who want to spot high-probability reversals, trend continuations, and liquidity sweeps with confluence.
🔹 Core Features
Multi-layered TEMA Cloud (9, 20, 34, 50) for clear trend structure
Dynamic Bull/Bear labels when the trend flips
Centerline for TEMA 20 to visualize core trend direction
Session-based liquidity sweep detection (Asia, London, NY)
Volume and absorption dots to catch hidden pressure
Swing high/low detection (external and internal)
Visual VWAP, daily highs/lows, and customizable session zones
Optional alerts for volume spikes, absorption, and reversal sweeps
📈 Use it to:
Confirm directional bias
Anticipate pullbacks and breakouts
Identify volume-backed reversals
Align trades with session strength and swing confluence
⚙️ Built for scalpers, intraday opportunists, and precision chartists alike.
Indicateur Pine Script®

Trend+Volume Confluence IndicatorScalper and swing trading signals: use the 15–30 minute charts for scalps and the 4–8 hour charts for swings. Add the Money Flow Index (MFI) for extra confluence. In an uptrend, if the MFI is at or above the halfway mark and rising, take the long. In a downtrend, if the MFI is at or below the halfway mark and falling, take the short.
Indicateur Pine Script®

Scalper Pro - MA's and Bias - ChartThought I would share this for anybody interested. There is a table in the upper right and you can toggle the moving averages and table on and off as well. Happy Trading!
Indicateur Pine Script®

Scalp PRO Visual momentum through the candlestick pattern. Gradients to show acceleration and deceleration to assist with entry and exits. Different color settings and optimizations. Enjoy!
Indicateur Pine Script®

MOMENTUM FLIPPERScalp tops and bottom of big volatility moves.
Detects when momentum is shifting.
Look for clusters of dim arrows followed by a solid arrow or two.
Best on 2-3 minute chart.
Do not use when choppy.
Indicateur Pine Script®

Scalp Pin + Engulf (Ramesh)How to apply as indicator
In TradingView, open Pine Editor.
Select New → Blank indicator (or clear the editor).
Paste the entire script above.
Click Save, then Add to chart.
You should see:
Green triangles under bars = bullish pin bar at support with trend
Red triangles above bars = bearish pin at resistance with trend
“ENG” labels = engulfing confirmation after pin
From here we can re-add the “fast single-bar reversal” piece once this base version is confirmed working on your chart.
Indicateur Pine Script®

Stratégie Pine Script®
Indicateur Pine Script®

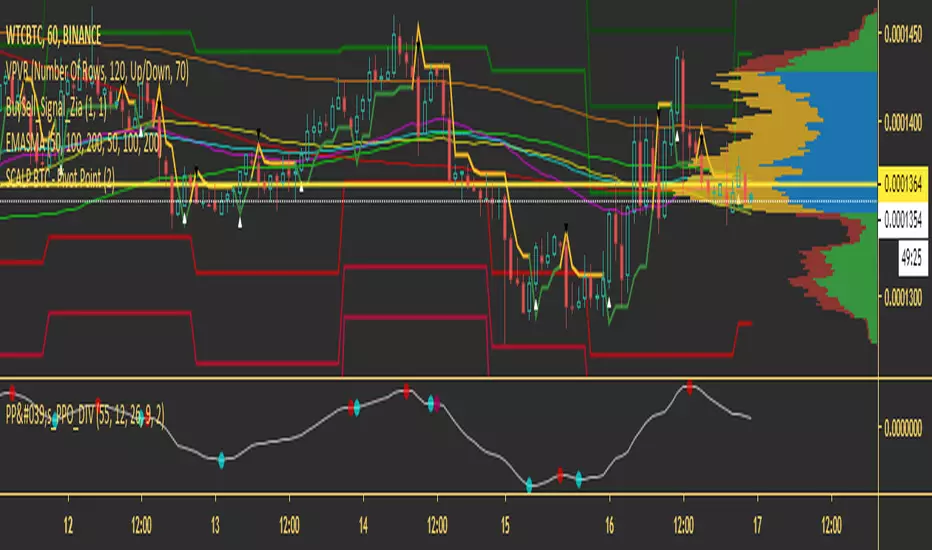
SCALP BTC - PPO DivergenceO indicador Oscilador de Preços (PPO) é uma ferramenta de análise técnica, usada para medir o momento que é muito semelhante ao MACD. O MACD emprega duas Médias Móveis de vários comprimentos (que são indicadores de atraso) para identificar a direção e a duração da tendência. Então, o MACD leva a diferença de valores entre essas duas Médias Móveis (Linha MACD) e uma EMA dessas Médias Móveis (Linha de Sinal) e plota a diferença entre as duas linhas como um histograma que oscila acima e abaixo de uma linha central zero.
O PPO é exatamente o mesmo, no entanto, ele pega os mesmos valores que o MACD e os calcula como uma porcentagem. O propósito disso é que ele torna as comparações de valor muito mais simples e diretas em períodos mais longos de tempo.
Indicateur Pine Script®

Indicateur Pine Script®
Indicateur Pine Script®

Indicateur Pine Script®

SB - VWDEMAScalping @ 1 Minute time frame.
Rules : -
1. Call entry - If Dema and ATR both turns green ( 1 minute TF )
2. Put Entry - If Dema and ATR both turns red ( 1minute TF )
If one is red and other is green wait till both align in same direction.
Vwap - Price above VWAP, call side entry will be rewarded well ( Try to find entry in calls) and if price is below Vwap Put side entry will be rewarded well ( Try to find entry in Puts).
Exit - Follow ATR stop loss line at 1 minute TF ( candle closing basis ).
Can be used on option charts directly.
Best results - Nifty derivatives @ 1 Minute TF, however it can work well with other instruments too.
Make your display setting as per your convenience.
Indicateur Pine Script®

Indicateur Pine Script®

Indicateur Pine Script®

US100 Liquidity Precision StrategyScalping strategy 5-10 point sl / 17 points tp
Automatic BE
Consistent money over time
Stratégie Pine Script®

Scalping all timeframe EMA & RSIEMA 50 and EMA 100 combined with RSI 14
Should also be accompanied by the RSI 14 chart.
With the following conditions:
IF the EMAs are close but not crossing:
* Be prepared to take a Sell position if the first Bearish Candlestick crosses the lowest EMA, and the RSI value is equal to or below 40.
* Be prepared to take a Buy position if the first Bullish Candlestick crosses the highest EMA, and the RSI value is equal to or above 60.
IF the EMAs are overlapping and crossing:
* Be prepared to take a Sell position if the first Bearish Candlestick crosses both EMAs, and the RSI value crosses below 50.
*Be prepared to take a Buy position if the first Bullish Candlestick crosses both EMAs, and the RSI value crosses above 50.
Indicateur Pine Script®

Scalping System by Machine# Custom Trading System Indicator
This Pine Script indicator is designed to identify potential trading setups based on a specific set of rules. It's intended for use on lower timeframes (M1-M5) in the forex market, particularly during the New York-London overlap period.
## Key Features
1. **EMA Condition**: Uses a 20-period Exponential Moving Average (EMA) to determine trend direction.
2. **Candle Analysis**: Identifies strong bars and candle color changes.
3. **Volume Confirmation**: Checks for increasing volume.
4. **Volatility Filter**: Utilizes the Average True Range (ATR) to gauge market volatility.
5. **Time-based Filter**: Highlights the New York-London overlap period.
6. **Visual Aids**: Plots potential entry points, stop losses, and take profit levels.
## Trading Rules
1. **Buy Signal**:
- Price is above the 20 EMA
- Candle color changes from red to green
- Current candle is a strong bar (closing within 75% of its range)
- Volume is higher than the previous bar
- ATR(14) is above 4 pips OR it's during the NY-London overlap
2. **Sell Signal**:
- Price is below the 20 EMA
- Candle color changes from green to red
- Current candle is a strong bar (closing within 75% of its range)
- Volume is higher than the previous bar
- ATR(14) is above 4 pips OR it's during the NY-London overlap
3. **Stop Loss**: Placed near the low of the setup candle for buys, or near the high for sells.
4. **Take Profit**: Aimed at 1R (one times the range of the setup candle).
## Visual Elements
- **20 EMA**: Plotted as a blue line on the chart.
- **Buy Signals**: Green triangles below the candles.
- **Sell Signals**: Red triangles above the candles.
- **Stop Loss Levels**: Small red dots at the calculated stop loss prices.
- **Take Profit Levels**: Small green dots at the calculated take profit prices.
- **Information Table**: Displays current values for ATR, strong bar condition and volume condition.
## Usage Notes
1. This indicator is designed for manual trading, not automated execution.
2. It works best when combined with analysis of major trend lines, support, and resistance levels.
3. Exercise caution with very large setup candles.
4. Consider additional filters or money management rules for enhanced performance.
5. For higher timeframe bias validation, consider incorporating a 100-period break of structure (BOS) analysis.
## Customization
The indicator includes several input parameters that can be adjusted:
- EMA Length
- ATR Length and Threshold
- Volume Multiplier
- Strong Bar Percentage
Users can also toggle the visibility of stop loss and take profit markers.
Remember, while this indicator can identify potential setups, it should be used in conjunction with other forms of analysis and risk management strategies. Always consider the overall market context and your personal risk tolerance when making trading decisions.
Indicateur Pine Script®

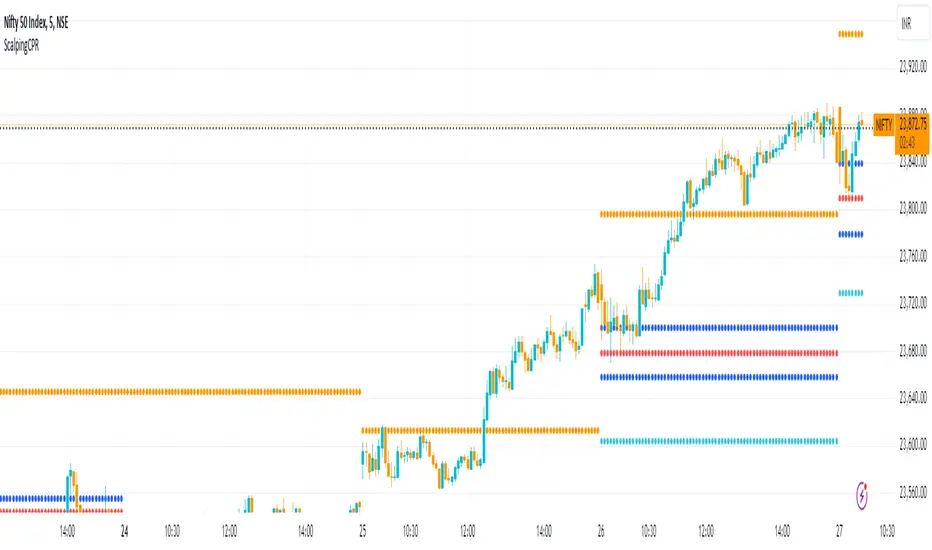
Scalping CPRFetch Previous Day's Data:
Uses request.security to get the previous day's high, low, and close prices.
lookahead=barmerge.lookahead_on ensures the data fetched is fixed for the current session.
Calculate CPR Levels:
Pivot: Average of the previous day's high, low, and close.
Bottom Central Pivot (BC): Average of the previous day's high and low.
Top Central Pivot (TC): Derived from the pivot and BC.
R1 and S1: First resistance and support levels calculated from the pivot and previous day's prices.
Plotting:
Plots the CPR levels (pivot, BC, TC, R1, S1) on the chart with different colors.
Indicateur Pine Script®
Scalping 1minMost trustworthy indicator for 1 minutes trader! This indicator is the same as the Bollinger band but much more reliable with extremely on-point signals! a lower line means buy, upper lines mean sell, the middle line is an extremely powerline so trade on the middle line will be mostly profitable!
Indicateur Pine Script®
Scalping EMA ADX RSI with Buy/Sell AlertsThis is a study indicator that shows the entries in the strategy seen in one of the youtube channel so it does not belong to me. I can't tell who it is because it's against the House Rules to advertise but you can find out if you look for it on youtube. Default values of oscilators and ema adjusted as suggested. He says he got the best results in 5 min timeframe but i tried to make things as modifiable as possible so you can mess around with the settings and create your own strategy for different timeframes if you'd like. Suggested to use with normal candlestick charts. The blue line below indicates the ADX is above the selected threshold set in the settings named "Trend Ready Limit". You can set alerts for Buy, Sell or Buy/Sell signal together.
The entry strategy itself is pretty straight forward.
The rules for entry are as follows, the script will check all of this on auto and will give you buy or sell signal :
Recommended time frame: 5 min
For Long Entry:
- Check if price above the set EMA (Can disable this rule if you'd like in the settings)
- RSI is in Oversold
- ADX is above set "Trend Ready" threshold (Meaning there is a trend going on)
- Price must approve the trend of previous candles. This is bullish for buy entries and bearish for sell entries.
- Enter with stop loss below last swing low with 1:1 or 1.5:1 take profit ratio.
For Short Entry:
- Check if price below the set EMA (Can disable this rule if you'd like in the settings)
- RSI is in Overbought
- ADX is above set "Trend Ready" threshold (Meaning there is a trend going on)
- Price must approve the trend of previous candles. This is bullish for buy entries and bearish for sell entries.
- Enter with stop loss above last swing high with 1:1 or 1.5:1 take profit ratio.
This is my first indicator. Let me know if you want any updates. I am not sure if i can add everything but i'll try nonetheless.
Changed: Signals will check up to 2 candles before if the RSI is below or above the set value to show signal. This is because sometimes the entry signal is right but the response might be a bit late.
Indicateur Pine Script®
