bcon's bemas (5,8,13,21)simple ribbin i use for scalps. the 5 8 13 and 21 ema. like to see them lined up when i see a cross thats my sign to take profit
Recherche dans les scripts pour "scalp"

Equal Highs/Lows Multi-Pivot [Julio]Equal Highs/Lows Multi-Pivot
Description
A sophisticated multi-timeframe pivot analysis tool that detects and highlights equal highs and equal lows across four different pivot lengths simultaneously. This indicator identifies price levels where the market creates identical extremes, a powerful signal of institutional support/resistance and potential reversal or breakout zones.
How It Works
Four Independent Pivot Streams
Pivot 1 (Intraday - 2 bars): Ultra-fast level detection for scalpers
Pivot 2 (Session - 4 bars): Short-term swing levels
Pivot 3 (Daily - 6 bars): Medium-term structural levels
Pivot 4 (Weekly - 9 bars): Long-term institutional levels
Equal High (EQH) Detection
Compares consecutive swing highs and draws a line when two highs are nearly identical within a defined threshold. The indicator uses ATR-based confluence to determine "equality," filtering out noise while catching true market structure.
Equal Low (EQL) Detection
Same logic applied to swing lows, identifying support zones where price repeatedly fails to break below previous lows.
Key Features
Four Simultaneous Timeframes: Analyze intraday, session, daily, and weekly structures all on one chart
ATR-Based Confluence Threshold: Automatically adjusts sensitivity based on current volatility (no fake signals)
Color-Coded Levels: Each pivot length has distinct colors for instant visual identification
Highs: Red, Orange, Yellow, Fuchsia
Lows: Green, Blue, Aqua, Purple
Confirmation Mode: Optional setting to wait for full pivot confirmation before marking levels
Customizable Alert Zones: Toggle individual pivot lengths on/off to reduce clutter
Smart Label Positioning: Labels auto-center between the two equal pivots for clarity
Ideal For
Swing traders tracking support/resistance across multiple timeframes
Scalpers identifying micro-structure for quick entries and exits
Market structure analysts studying institutional price action patterns
Multi-timeframe traders needing confluence from intraday to weekly levels
Anyone trading 1-minute to 4-hour charts
Trading Applications
Identify strong support/resistance zones: Equal levels = confirmed institutional levels
Confirm trend reversals: Multiple equal lows = strong accumulation zone; multiple equal highs = distribution
Plan entries with precision: Enter near equal levels for higher probability setups
Detect liquidity concentration: Where price repeatedly tests the same level
Multi-timeframe confluence: Look for equal levels across multiple pivot lengths for ultra-strong zones
How to Use
Identify the equal levels: Color-coded lines instantly show where price creates matching extremes
Check for confluence: Strong setups occur where multiple pivot lengths align
Wait for price action: Watch for breakouts through equal levels or reversals at these zones
Enter with structure: Use equal levels as entry/exit triggers combined with your trading methodology
Manage with confidence: These levels mark institutional decision points
Customization Options
Adjust pivot lengths to match your preferred timeframe structure
Set ATR threshold sensitivity (lower = stricter equality, higher = more signals)
Toggle confirmation mode for additional filter
Enable/disable individual pivot streams to reduce visual clutter
Customize colors to match your chart theme
Default Settings Optimized For
NASDAQ futures and liquid forex pairs
Intraday and swing trading (1-minute to 4-hour charts)
Smart Money / ICT trading methodologies
Volatility-adjusted confluence detection

Superior-Range Bound Renko - Alerts - 11-29-25 - Signal LynxSuperior-Range Bound Renko – Alerts Edition with Advanced Risk Management Template
Signal Lynx | Free Scripts supporting Automation for the Night-Shift Nation 🌙
1. Overview
This is the Alerts & Indicator Edition of Superior-Range Bound Renko (RBR).
The Strategy version is built for backtesting inside TradingView.
This Alerts version is built for automation: it emits clean, discrete alert events that you can route into webhooks, bots, or relay engines (including your own Signal Lynx-style infrastructure).
Under the hood, this script contains the same core engine as the strategy:
Adaptive Range Bounding based on volatility
Renko Brick Emulation on standard candles
A stack of Laguerre Filters for impulse detection
K-Means-style Adaptive SuperTrend for trend confirmation
The full Signal Lynx Risk Management Engine (state machine, layered exits, AATS, RSIS, etc.)
The difference is in what we output:
Instead of placing historical trades, this version:
Plots the entry and RM signals in a separate pane (overlay = false)
Exposes alertconditions for:
Long Entry
Short Entry
Close Long
Close Short
TP1, TP2, TP3 hits (Staged Take Profit)
This makes it ideal as the signal source for automated execution via TradingView Alerts + Webhooks.
2. Quick Action Guide (TL;DR)
Best Timeframe:
4H and above. This is a swing-trading / position-trading style engine, not a micro-scalper.
Best Assets:
Volatile but structured markets, e.g.:
BTC, ETH, XAUUSD (Gold), GBPJPY, and similar high-volatility majors or indices.
Script Type:
indicator() – Alerts & Visualization Only
No built-in order placement
All “orders” are emitted as alerts for your external bot or manual handling
Strategy Type:
Volatility-Adaptive Trend Following + Impulse Detection
using Renko-like structure and multi-layer Laguerre filters.
Repainting:
Designed to be non-repainting on closed candles.
The underlying Risk Management engine is built around previous-bar data (close , high , low ) for execution-critical logic.
Intrabar values can move while the bar is forming (normal for any advanced signal), but once a bar closes, the alert logic is stable.
Recommended Alert Settings:
Condition: one of the built-in signals (see section 3.B)
Options: “Once Per Bar Close” is strongly recommended for automation
Message: JSON, CSV, or simple tokens – whatever your webhook / relay expects
3. Detailed Report: How the Alerts Edition Works
A. Relationship to the Strategy Version
The Alerts Edition shares the same internal logic as the strategy version:
Same Adaptive Lookback and volatility normalization
Same Range and Close Range construction
Same Renko Brick Emulator and directional memory (renkoDir)
Same Fib structures, Laguerre stack, K-Means SuperTrend, and Baseline signals (B1, B2)
Same Risk Management Engine and layered exits
In the strategy script, these signals are wired into strategy.entry, strategy.exit, and strategy.close.
In the alerts script:
We still compute the final entry/exit signals (Fin, CloseEmAll, TakeProfit1Plot, etc.)
Instead of placing trades, we:
Plot them for visual inspection
Expose them via alertcondition(...) so that TradingView can fire alerts.
This ensures that:
If you use the same settings on the same symbol/timeframe, the Alerts Edition and Strategy Edition agree on where entries and exits occur.
(Subject only to normal intrabar vs. bar-close differences.)
B. Signals & Alert Conditions
The alerts script focuses on discrete, automation-friendly events.
Internally, the main signals are:
Fin – Final entry decision from the RM engine
CloseEmAll – RM-driven “hard close” signal (for full-position exits)
TakeProfit1Plot / 2Plot / 3Plot – One-time event markers when each TP stage is hit
On the chart (in the separate indicator pane), you get:
plot(Fin) – where:
+2 = Long Entry event
-2 = Short Entry event
plot(CloseEmAll) – where:
+1 = “Close Long” event
-1 = “Close Short” event
plot(TP1/TP2/TP3) (if Staged TP is enabled) – integer tags for TP hits:
+1 / +2 / +3 = TP1 / TP2 / TP3 for Longs
-1 / -2 / -3 = TP1 / TP2 / TP3 for Shorts
The corresponding alertconditions are:
Long Entry
alertcondition(Fin == 2, title="Long Entry", message="Long Entry Triggered")
Fire this to open/scale a long position in your bot.
Short Entry
alertcondition(Fin == -2, title="Short Entry", message="Short Entry Triggered")
Fire this to open/scale a short position.
Close Long
alertcondition(CloseEmAll == 1, title="Close Long", message="Close Long Triggered")
Fire this to fully exit a long position.
Close Short
alertcondition(CloseEmAll == -1, title="Close Short", message="Close Short Triggered")
Fire this to fully exit a short position.
TP 1 Hit
alertcondition(TakeProfit1Plot != 0, title="TP 1 Hit", message="TP 1 Level Reached")
First staged take profit hit (either long or short). Your bot can interpret the direction based on position state or message tags.
TP 2 Hit
alertcondition(TakeProfit2Plot != 0, title="TP 2 Hit", message="TP 2 Level Reached")
TP 3 Hit
alertcondition(TakeProfit3Plot != 0, title="TP 3 Hit", message="TP 3 Level Reached")
Together, these give you a complete trade lifecycle:
Open Long / Short
Optionally scale out via TP1/TP2/TP3
Close remaining via Close Long / Close Short
All while the Risk Management Engine enforces the same logic as the strategy version.
C. Using This Script for Automation
This Alerts Edition is designed for:
Webhook-based bots
Execution relays (e.g., your own Lynx-Relay-style engine)
Dedicated external trade managers
Typical setup flow:
Add the script to your chart
Same symbol, timeframe, and settings you use in the Strategy Edition backtests.
Configure Inputs:
Longs / Shorts enabled
Risk Management toggles (SL, TS, Staged TP, AATS, RSIS)
Weekend filter (if you do not want weekend trades)
RBR-specific knobs (Adaptive Lookback, Brick type, ATR vs Standard Brick, etc.)
Create Alerts for Each Event Type You Need:
Long Entry
Short Entry
Close Long
Close Short
TP1 / TP2 / TP3 (optional, if your bot handles partial closes)
For each:
Condition: the corresponding alertcondition
Option: “Once Per Bar Close” is strongly recommended
Message:
You can use structured JSON or a simple token set like:
{"side":"long","event":"entry","symbol":"{{ticker}}","time":"{{timenow}}"}
or a simpler text for manual trading like:
LONG ENTRY | {{ticker}} | {{interval}}
Wire Up Your Bot / Relay:
Point TradingView’s webhook URL to your execution engine
Parse the messages and map them into:
Exchange
Symbol
Side (long/short)
Action (open/close/partial)
Size and risk model (this script does not position-size for you; it only signals when, not how much.)
Because the alerts come from a non-repainting, RM-backed engine that you’ve already validated via the Strategy Edition, you get a much cleaner automation pipeline.
D. Repainting Protection (Alerts Edition)
The same protections as the Strategy Edition apply here:
Execution-critical logic (trailing stop, TP triggers, SL, RM state changes) uses previous bar OHLC:
open , high , low , close
No security() with lookahead or future-bar dependencies.
This means:
Alerts are designed to fire on states that would have been visible at bar close, not on hypothetical “future history.”
Important practical note:
Intrabar: While a bar is forming, internal conditions can oscillate.
Bar Close: With “Once Per Bar Close” alerts, the fired signal corresponds to the final state of the engine for that candle, matching your Strategy Edition expectations.
4. For Developers & Modders
You can treat this Alerts script as an ”RM + Alert Framework” and inject any signal logic you want.
Where to plug in:
Find the section:
// BASELINE & SIGNAL GENERATION
You’ll see how B1 and B2 are built from the RBR stack and then combined:
baseSig = B2
altSig = B1
finalSig = sigSwap ? baseSig : altSig
To use your own logic:
Replace or wrap the code that sets baseSig / altSig with your own conditions:
e.g., RSI, MACD, Heikin Ashi filters, candle patterns, volume filters, etc.
Make sure your final decision is still:
2 → Long / Buy signal
-2 → Short / Sell signal
0 → No trade
finalSig is then passed into the RM engine and eventually becomes Fin, which:
Drives the Long/Short Entry alerts
Interacts with the RM state machine to integrate properly with AATS, SL, TS, TP, etc.
Because this script already exposes alertconditions for key lifecycle events, you don’t need to re-wire alerts each time — just ensure your logic feeds into finalSig correctly.
This lets you use the Signal Lynx Risk Management Engine + Alerts wrapper as a drop-in chassis for your own strategies.
5. About Signal Lynx
Automation for the Night-Shift Nation 🌙
Signal Lynx builds tools and templates that help traders move from:
“I have an indicator” → “I have a structured, automatable strategy with real risk management.”
This Superior-Range Bound Renko – Alerts Edition is the automation-focused companion to the Strategy Edition. It’s designed for:
Traders who backtest with the Strategy version
Then deploy live signals with this Alerts version via webhooks or bots
While relying on the same non-repainting, RM-driven logic
We release this code under the Mozilla Public License 2.0 (MPL-2.0) to support the Pine community with:
Transparent, inspectable logic
A reusable Risk Management template
A reference implementation of advanced adaptive logic + alerts
If you are exploring full-stack automation (TradingView → Webhooks → Exchange / VPS), keep Signal Lynx in your search.
License: Mozilla Public License 2.0 (Open Source).
If you build improvements or helpful variants, please consider sharing them back with the community.

Superior-Range Bound Renko - Strategy - 11-29-25 - SignalLynxSuperior-Range Bound Renko Strategy with Advanced Risk Management Template
Signal Lynx | Free Scripts supporting Automation for the Night-Shift Nation 🌙
1. Overview
Welcome to Superior-Range Bound Renko (RBR) — a volatility-aware, structure-respecting swing-trading system built on top of a full Risk Management (RM) Template from Signal Lynx.
Instead of relying on static lookbacks (like “14-period RSI”) or plain MA crosses, Superior RBR:
Adapts its range definition to market volatility in real time
Emulates Renko Bricks on a standard, time-based chart (no Renko chart type required)
Uses a stack of Laguerre Filters to detect genuine impulse vs. noise
Adds an Adaptive SuperTrend powered by a small k-means-style clustering routine on volatility
Under the hood, this script also includes the full Signal Lynx Risk Management Engine:
A state machine that separates “Signal” from “Execution”
Layered exit tools: Stop Loss, Trailing Stop, Staged Take Profit, Advanced Adaptive Trailing Stop (AATS), and an RSI-style stop (RSIS)
Designed for non-repainting behavior on closed candles by basing execution-critical logic on previous-bar data
We are publishing this as an open-source template so traders and developers can leverage a professional-grade RM engine while integrating their own signal logic if they wish.
2. Quick Action Guide (TL;DR)
Best Timeframe:
4 Hours (H4) and above. This is a high-conviction swing-trading system, not a scalper.
Best Assets:
Volatile instruments that still respect market structure:
Bitcoin, Ethereum, Gold (XAUUSD), high-volatility Forex pairs (e.g., GBPJPY), indices with clean ranges.
Strategy Type:
Volatility-Adaptive Trend Following + Impulse Detection.
It hunts for genuine expansion out of ranges, not tiny mean-reversion nibbles.
Key Feature:
Renko Emulation on time-based candles.
We mathematically model Renko Bricks and overlay them on your standard chart to define:
“Equilibrium” zones (inside the brick structure)
“Breakout / impulse” zones (when price AND the impulse line depart from the bricks)
Repainting:
Designed to be non-repainting on closed candles.
All RM execution logic uses confirmed historical data (no future bars, no security() lookahead). Intrabar flicker during formation is allowed, but once a bar closes the engine’s decisions are stable.
Core Toggles & Filters:
Enable Longs and Shorts independently
Optional Weekend filter (block trades on Saturday/Sunday)
Per-module toggles: Stop Loss, Trailing Stop, Staged Take Profits, AATS, RSIS
3. Detailed Report: How It Works
A. The Strategy Logic: Superior RBR
Superior RBR builds its entry signal from multiple mathematical layers working together.
1) Adaptive Lookback (Volatility Normalization)
Instead of a fixed 100-bar or 200-bar range, the script:
Computes ATR-based volatility over a user-defined period.
Normalizes that volatility relative to its recent min/max.
Maps the normalized value into a dynamic lookback window between a minimum and maximum (e.g., 4 to 100 bars).
High Volatility:
The lookback shrinks, so the system reacts faster to explosive moves.
Low Volatility:
The lookback expands, so the system sees a “bigger picture” and filters out chop.
All the core “Range High/Low” and “Range Close High/Low” boundaries are built on top of this adaptive window.
2) Range Construction & Quick Ranges
The engine constructs several nested ranges:
Outer Range:
rangeHighFinal – dynamic highest high
rangeLowFinal – dynamic lowest low
Inner Close Range:
rangeCloseHighFinal – highest close
rangeCloseLowFinal – lowest close
Quick Ranges:
“Half-length” variants of those, used to detect more responsive changes in structure and volatility.
These ranges define:
The macro box price is trading inside
Shorter-term “pressure zones” where price is coiling before expansion
3) Renko Emulation (The Bricks)
Rather than using the Renko chart type (which discards time), this script emulates Renko behavior on your normal candles:
A “brick size” is defined either:
As a standard percentage move, or
As a volatility-driven (ATR) brick, optionally inhibited by a minimum standard size
The engine tracks a base value and derives:
brickUpper – top of the emulated brick
brickLower – bottom of the emulated brick
When price moves sufficiently beyond those levels, the brick “shifts”, and the directional memory (renkoDir) updates:
renkoDir = +2 when bricks are advancing upward
renkoDir = -2 when bricks are stepping downward
You can think of this as a synthetic Renko tape overlaid on time-based candles:
Inside the brick: equilibrium / consolidation
Breaking away from the brick: momentum / expansion
4) Impulse Tracking with Laguerre Filters
The script uses multiple Laguerre Filters to smooth price and brick-derived data without traditional lag.
Key filters include:
LagF_1 / LagF_W: Based on brick upper/lower baselines
LagF_Q: Based on HLCC4 (high + low + 2×close)/4
LagF_Y / LagF_P: Complex averages combining brick structures and range averages
LagF_V (Primary Impulse Line):
A smooth, high-level impulse line derived from a blend of the above plus the outer ranges
Conceptually:
When the impulse line pushes away from the brick structure and continues in one direction, an impulse move is underway.
When its direction flips and begins to roll over, the impulse is fading, hinting at mean reversion back into the range.
5) Fib-Based Structure & Swaps
The system also layers in Fib levels derived from the adaptive ranges:
Standard levels (12%, 23.6%, 38.2%, 50%, 61%, 76.8%, 88%) from the main range
A secondary “swap” set derived from close-range dynamics (fib12Swap, fib23Swap, etc.)
These Fibs are used to:
Bucket price into structural zones (below 12, between 23–38, etc.)
Detect breakouts when price and Laguerre move beyond key Fib thresholds
Drive zSwap logic (where a secondary Fib set becomes the active structure once certain conditions are met)
6) Adaptive SuperTrend with K-Means-Style Volatility Clustering
Under the hood, the script uses a small k-means-style clustering routine on ATR:
ATR is measured over a fixed period
The range of ATR values is split into Low, Medium, High volatility centroids
Current ATR is assigned to the nearest centroid (cluster)
From that, a SuperTrend variant (STK) is computed with dynamic sensitivity:
In quiet markets, SuperTrend can afford to be tighter
In wild markets, it widens appropriately to avoid constant whipsaw
This SuperTrend-based oscillator (LagF_K and its signals) is then combined with the brick and Laguerre stack to confirm valid trend regimes.
7) Final Baseline Signals (+2 / -2)
The “brain” of Superior RBR lives in the Baseline & Signal Generation block:
Two composite signals are built: B1 and B2:
They combine:
Fib breakouts
Renko direction (renkoDir)
Expansion direction (expansionQuickDir)
Multiple Laguerre alignments (LagF_Q, LagF_W, LagF_Y, LagF_Z, LagF_P, LagF_V)
They also factor in whether Fib structures are expanding or contracting.
A user toggle selects the “Baseline” signal:
finalSig = B2 (default) or B1 (alternate baseline)
finalSig is then filtered through the RM state machine and only when everything aligns, we emit:
+2 = Long / Buy signal
-2 = Short / Sell signal
0 = No new trade
Those +2 / -2 values are what feed the Risk Management Engine.
B. The Risk Management (RM) Engine
This script features the Signal Lynx Risk Management Engine, a proprietary state machine built to separate Signal from Execution.
Instead of firing orders directly on indicator conditions, we:
Convert the raw signal into a clean integer (Fin = +2 / -2 / 0)
Feed it into a Trade State Machine that understands:
Are we flat?
Are we in a long or short?
Are we in a closing sequence?
Should we permit re-entry now or wait?
Logic Injection / Template Concept:
The RM engine expects a simple integer:
+2 → Buy
-2 → Sell
Everything else (0) is “no new trade”
This makes the script a template:
You can remove the Superior RBR block
Drop in your own logic (RSI, MACD, price action, etc.)
As long as you output +2 or -2 into the same signal channel, the RM engine can drive all exits and state transitions.
Aggressive vs Conservative Modes:
The input AgressiveRM (Aggressive RM) governs how we interpret signals:
Conservative Mode (Aggressive RM = false):
Uses a more filtered internal signal (AF) to open trades
Effectively waits for a clean trend flip / confirmation before new entries
Minimizes whipsaw at the cost of fewer trades
Aggressive Mode (Aggressive RM = true):
Reacts directly to the fresh alert (AO) pulses
Allows faster re-entries in the same direction after RM-based exits
Still respects your pyramiding setting; this script ships with pyramiding = 0 by default, so it will not stack multiple positions unless you change that parameter in the strategy() call.
The state machine enforces discipline on top of your signal logic, reducing double-fires and signal spam.
C. Advanced Exit Protocols (Layered Defense)
The exit side is where this template really shines. Instead of a single “take profit or stop loss,” it uses multiple, cooperating layers.
1) Hard Stop Loss
A classic percentage-based Stop Loss (SL) relative to the entry price.
Acts as a final “catastrophic protection” layer for unexpected moves.
2) Standard Trailing Stop
A percentage-based Trailing Stop (TS) that:
Activates only after price has moved a certain percentage in your favor (tsActivation)
Then trails price by a configurable percentage (ts)
This is a straightforward, battle-tested trailing mechanism.
3) Staged Take Profits (Three Levels)
The script supports three staged Take Profit levels (TP1, TP2, TP3):
Each stage has:
Activation percentage (how far price must move in your favor)
Trailing amount for that stage
Position percentage to close
Example setup:
TP1:
Activate at +10%
Trailing 5%
Close 10% of the position
TP2:
Activate at +20%
Trailing 10%
Close another 10%
TP3:
Activate at +30%
Trailing 5%
Close the remaining 80% (“runner”)
You can tailor these quantities for partial scaling out vs. letting a core position ride.
4) Advanced Adaptive Trailing Stop (AATS)
AATS is a sophisticated volatility- and structure-aware stop:
Uses Hirashima Sugita style levels (HSRS) to model “floors” and “ceilings” of price:
Dungeon → Lower floors → Mid → Upper floors → Penthouse
These levels classify where current price sits within a long-term distribution.
Combines HSRS with Bollinger-style envelopes and EMAs to determine:
Is price extended far into the upper structure?
Is it compressed near the lower ranges?
From this, it computes an adaptive factor that controls how tight or loose the trailing level (aATS / bATS) should be:
High Volatility / Penthouse areas:
Stop loosens to avoid getting wicked out by inevitable spikes.
Low Volatility / compressed structure:
Stop tightens to lock in and protect profit.
AATS is designed to be the “smart last line” that responds to context instead of a single fixed percentage.
5) RSI-Style Stop (RSIS)
On top of AATS, the script includes a RSI-like regime filter:
A McGinley Dynamic mean of price plus ATR bands creates a dynamic channel.
Crosses above the top band and below the lower band change a directional state.
When enabled (UseRSIS):
RSIS can confirm or veto AATS closes:
For longs: A shift to bearish RSIS can force exits sooner.
For shorts: A shift to bullish RSIS can do the same.
This extra layer helps avoid over-reactive stops in strong trends while still respecting a regime change when it happens.
D. Repainting Protection
Many strategies look incredible in the Strategy Tester but fail in live trading because they rely on intrabar values or future-knowledge functions.
This template is built with closed-candle realism in mind:
The Risk Management logic explicitly uses previous bar data (open , high , low , close ) for the key decisions on:
Trailing stop updates
TP triggers
SL hits
RM state transitions
No security() lookahead or future-bar access is used.
This means:
Backtest behavior is designed to match what you can actually get with TradingView alerts and live automation.
Signals may “flicker” intrabar while the candle is forming (as with any strategy), but on closed candles, the RM decisions are stable and non-repainting.
4. For Developers & Modders
We strongly encourage you to mod this script.
To plug your own strategy into the RM engine:
Look for the section titled:
// BASELINE & SIGNAL GENERATION
You will see composite logic building B1 and B2, and then selecting:
baseSig = B2
altSig = B1
finalSig = sigSwap ? baseSig : altSig
You can replace the content used to generate baseSig / altSig with your own logic, for example:
RSI crosses
MACD histogram flips
Candle pattern detectors
External condition flags
Requirements are simple:
Your final logic must output:
2 → Buy signal
-2 → Sell signal
0 → No new trade
That output flows into the RM engine via finalSig → AlertOpen → state machine → Fin.
Once you wire your signals into finalSig, the entire Risk Management system (Stops, TPs, AATS, RSIS, re-entry logic, weekend filters, long/short toggles) becomes available for your custom strategy without re-inventing the wheel.
This makes Superior RBR not just a strategy, but a reference architecture for serious Pine dev work.
5. About Signal Lynx
Automation for the Night-Shift Nation 🌙
Signal Lynx focuses on helping traders and developers bridge the gap between indicator logic and real-world automation. The same RM engine you see here powers multiple internal systems and templates, including other public scripts like the Super-AO Strategy with Advanced Risk Management.
We provide this code open source under the Mozilla Public License 2.0 (MPL-2.0) to:
Demonstrate how Adaptive Logic and structured Risk Management can outperform static, one-layer indicators
Give Pine Script users a battle-tested RM backbone they can reuse, remix, and extend
If you are looking to automate your TradingView strategies, route signals to exchanges, or simply want safer, smarter strategy structures, please keep Signal Lynx in your search.
License: Mozilla Public License 2.0 (Open Source).
If you make beneficial modifications, please consider releasing them back to the community so everyone can benefit.

SIDD Table Volume multiframe (Modified)🚀 SIDD Volume Table – The Most Powerful Multi-Timeframe Volume Dashboard
Designed by Siddhartha Mukherjee (SIDD)
Free for the community.
Get an unfair edge with the cleanest, fastest, and most accurate multi-timeframe volume analyzer available on TradingView. This tool reveals where buyers and sellers are truly active across multiple timeframes—helping you confirm trends, avoid traps, and enter with confidence.
🔥 Why Traders Love This Indicator
✅ 1. Multi-Timeframe Volume Domination
Instantly view Buy% / Sell% / Total Volume for:
1m • 5m • 15m • 1H • 4H • 1D • 1W
Choose any combination you want!
✅ 2. Advanced Buy/Sell Volume Logic
Not simple volume…
This tool breaks it into:
Buy Volume% (green dominance)
Sell Volume% (red dominance)
Using candle structure (H-L-C), giving far more accurate pressure detection.
✅ 3. Realtime Candle Countdown
Never guess when a candle will close again.
Get:
Seconds (1m)
MM:SS (5m/15m/1H)
DD:HH:MM:SS (4H, 1D, 1W)
Perfect for scalpers, swing traders, and index traders.
✅ 4. Beautiful & Customizable Dashboard
Choose position anywhere on screen
Auto size or choose Tiny → Huge
Color-coded Bias (Green Buyers, Red Sellers)
Clean layout built for modern charts
Your chart stays clean while your data stays powerful.
💡 What This Helps You Identify
Where buyers are gaining strength
Where sellers are dominating
Multi-timeframe alignment (the key to big moves)
Real reversal pressure
Volume divergence across timeframes
Trend confirmation before breakouts
Perfect for:
NIFTY / BANKNIFTY / Stocks / Crypto / FX / Commodities
🧠 Who Should Use This?
Intraday traders
Swing traders
Options traders
Futures traders
Crypto scalpers
Professional volume analysts
If volume matters to you → this indicator becomes a must-have.
🛠 Built with Precision
Non-repainting
Multi-TF aligned
Fast + lightweight arrays
Uses BTC/ETH feed to stabilize ticks
Zero chart clutter
❤️ Free for Everyone
This tool is released 100% free to help the community trade with clarity and confidence.
Leave a like ⭐, comment 💬, or follow if you want more such institutional-grade tools.
⚠️ Disclaimer
This is for educational/analytical use only.
Not financial advice. Trade at your own risk.

Bifurcation Zone - CAEBifurcation Zone — Cognitive Adversarial Engine (BZ-CAE)
Bifurcation Zone — CAE (BZ-CAE) is a next-generation divergence detection system enhanced by a Cognitive Adversarial Engine that evaluates both sides of every potential trade before presenting signals. Unlike traditional divergence indicators that show every price-oscillator disagreement regardless of context, BZ-CAE applies comprehensive market-state intelligence to identify only the divergences that occur in favorable conditions with genuine probability edges.
The system identifies structural bifurcation points — critical junctures where price and momentum disagree, signaling potential reversals or continuations — then validates these opportunities through five interconnected intelligence layers: Trend Conviction Scoring , Directional Momentum Alignment , Multi-Factor Exhaustion Modeling , Adversarial Validation , and Confidence Scoring . The result is a selective, context-aware signal system that filters noise and highlights high-probability setups.
This is not a "buy the arrow" indicator. It's a decision support framework that teaches you how to read market state, evaluate divergence quality, and make informed trading decisions based on quantified intelligence rather than hope.
What Sets BZ-CAE Apart: Technical Architecture
The Problem With Traditional Divergence Indicators
Most divergence indicators operate on a simple rule: if price makes a higher high and RSI makes a lower high, show a bearish signal. If price makes a lower low and RSI makes a higher low, show a bullish signal. This creates several critical problems:
Context Blindness : They show counter-trend signals in powerful trends that rarely reverse, leading to repeated losses as you fade momentum.
Signal Spam : Every minor price-oscillator disagreement generates an alert, overwhelming you with low-quality setups and creating analysis paralysis.
No Quality Ranking : All signals are treated identically. A marginal divergence in choppy conditions receives the same visual treatment as a high-conviction setup at a major exhaustion point.
Single-Sided Evaluation : They ask "Is this a good long?" without checking if the short case is overwhelmingly stronger, leading you into obvious bad trades.
Static Configuration : You manually choose RSI 14 or Stochastic 14 and hope it works, with no systematic way to validate if that's optimal for your instrument.
BZ-CAE's Solution: Cognitive Adversarial Intelligence
BZ-CAE solves these problems through an integrated five-layer intelligence architecture:
1. Trend Conviction Score (TCS) — 0 to 1 Scale
Most indicators check if ADX is above 25 to determine "trending" conditions. This binary approach misses nuance. TCS is a weighted composite metric:
Formula : 0.35 × normalize(ADX, 10, 35) + 0.35 × structural_strength + 0.30 × htf_alignment
Structural Strength : 10-bar SMA of consecutive directional bars. Captures persistence — are bulls or bears consistently winning?
HTF Alignment : Multi-timeframe EMA stacking (20/50/100/200). When all EMAs align in the same direction, you're in institutional trend territory.
Purpose : Quantifies how "locked in" the trend is. When TCS exceeds your threshold (default 0.80), the system knows to avoid counter-trend trades unless other factors override.
Interpretation :
TCS > 0.85: Very strong trend — counter-trading is extremely high risk
TCS 0.70-0.85: Strong trend — favor continuation, require exhaustion for reversals
TCS 0.50-0.70: Moderate trend — context matters, both directions viable
TCS < 0.50: Weak/choppy — reversals more viable, range-bound conditions
2. Directional Momentum Alignment (DMA) — ATR-Normalized
Formula : (EMA21 - EMA55) / ATR14
This isn't just "price above EMA" — it's a regime-aware momentum gauge. The same $100 price movement reads completely differently in high-volatility crypto versus low-volatility forex. By normalizing with ATR, DMA adapts its interpretation to current market conditions.
Purpose : Quantifies the directional "force" behind current price action. Positive = bullish push, negative = bearish push. Magnitude = strength.
Interpretation :
DMA > 0.7: Strong bullish momentum — bearish divergences risky
DMA 0.3 to 0.7: Moderate bullish bias
DMA -0.3 to 0.3: Balanced/choppy conditions
DMA -0.7 to -0.3: Moderate bearish bias
DMA < -0.7: Strong bearish momentum — bullish divergences risky
3. Multi-Factor Exhaustion Modeling — 0 to 1 Probability
Single-metric exhaustion detection (like "RSI > 80") misses complex market states. BZ-CAE aggregates five independent exhaustion signals:
Volume Spikes : Current volume versus 50-bar average
2.5x average: 0.25 weight
2.0x average: 0.15 weight
1.5x average: 0.10 weight
Divergence Present : The fact that a divergence exists contributes 0.30 weight — structural momentum disagreement is itself an exhaustion signal.
RSI Extremes : Captures oscillator climax zones
RSI > 80 or < 20: 0.25 weight
RSI > 75 or < 25: 0.15 weight
Pin Bar Detection : Identifies rejection candles (2:1 wick-to-body ratio, indicating failed breakout attempts): 0.15 weight
Extended Runs : Consecutive bars above/below EMA20 without pullback
30+ bars: 0.15 weight (market hasn't paused to consolidate)
Total exhaustion score is the sum of all applicable weights, capped at 1.0.
Purpose : Detects when strong trends become vulnerable to reversal. High exhaustion can override trend filters, allowing counter-trend trades at genuine turning points that basic indicators would miss.
Interpretation :
Exhaustion > 0.75: High probability of climax — yellow background shading alerts you visually
Exhaustion 0.50-0.75: Moderate overextension — watch for confirmation
Exhaustion < 0.50: Fresh move — trend can continue, counter-trend trades higher risk
4. Adversarial Validation — Game Theory Applied to Trading
This is BZ-CAE's signature innovation. Before approving any signal, the engine quantifies BOTH sides of the trade simultaneously:
For Bullish Divergences , it calculates:
Bull Case Score (0-1+) :
Distance below EMA20 (pullback quality): up to 0.25
Bullish EMA alignment (close > EMA20 > EMA50): 0.25
Oversold RSI (< 40): 0.25
Volume confirmation (> 1.2x average): 0.25
Bear Case Score (0-1+) :
Price below EMA50 (structural weakness): 0.30
Very oversold RSI (< 30, indicating knife-catching): 0.20
Differential = Bull Case - Bear Case
If differential < -0.10 (default threshold), the bear case is dominating — signal is BLOCKED or ANNOTATED.
For Bearish Divergences , the logic inverts (Bear Case vs Bull Case).
Purpose : Prevents trades where you're fighting obvious strength in the opposite direction. This is institutional-grade risk management — don't just evaluate your trade, evaluate the counter-trade simultaneously.
Why This Matters : You might see a bullish divergence at a local low, but if price is deeply below major support EMAs with strong bearish momentum, you're catching a falling knife. The adversarial check catches this and blocks the signal.
5. Confidence Scoring — 0 to 1 Quality Assessment
Every signal that passes initial filters receives a comprehensive quality score:
Formula :
0.30 × normalize(TCS) // Trend context
+ 0.25 × normalize(|DMA|) // Momentum magnitude
+ 0.20 × pullback_quality // Entry distance from EMA20
+ 0.15 × state_quality // ADX + alignment + structure
+ 0.10 × divergence_strength // Slope separation magnitude
+ adversarial_bonus (0-0.30) // Your side's advantage
Purpose : Ranks setup quality for filtering and position sizing decisions. You can set a minimum confidence threshold (default 0.35) to ensure only quality setups reach your chart.
Interpretation :
Confidence > 0.70: Premium setup — consider increased position size
Confidence 0.50-0.70: Good quality — standard size
Confidence 0.35-0.50: Acceptable — reduced size or skip if conservative
Confidence < 0.35: Marginal — blocked in Filtering mode, annotated in Advisory mode
CAE Operating Modes: Learning vs Enforcement
Off : Disables all CAE logic. Raw divergence pipeline only. Use for baseline comparison.
Advisory : Shows ALL signals regardless of CAE evaluation, but annotates signals that WOULD be blocked with specific warnings (e.g., "Bull: strong downtrend (TCS=0.87)" or "Adversarial bearish"). This is your learning mode — see CAE's decision logic in action without missing educational opportunities.
Filtering : Actively blocks low-quality signals. Only setups that pass all enabled gates (Trend Filter, Adversarial Validation, Confidence Gating) reach your chart. This is your live trading mode — trust the system to enforce discipline.
CAE Filter Gates: Three-Layer Protection
When CAE is enabled, signals must pass through three independent gates (each can be toggled on/off):
Gate 1: Strong Trend Filter
If TCS ≥ tcs_threshold (default 0.80)
And signal is counter-trend (bullish in downtrend or bearish in uptrend)
And exhaustion < exhaustion_required (default 0.50)
Then: BLOCK signal
Logic: Don't fade strong trends unless the move is clearly overextended
Gate 2: Adversarial Validation
Calculate both bull case and bear case scores
If opposing case dominates by more than adv_threshold (default 0.10)
Then: BLOCK signal
Logic: Avoid trades where you're fighting obvious strength in the opposite direction
Gate 3: Confidence Gating
Calculate composite confidence score (0-1)
If confidence < min_confidence (default 0.35)
Then: In Filtering mode, BLOCK signal; in Advisory mode, ANNOTATE with warning
Logic: Only take setups with minimum quality threshold
All three gates work together. A signal must pass ALL enabled gates to fire.
Visual Intelligence System
Bifurcation Zones (Supply/Demand Blocks)
When a divergence signal fires, BZ-CAE draws a semi-transparent box extending 15 bars forward from the signal pivot:
Demand Zones (Bullish) : Theme-colored box (cyan in Cyberpunk, blue in Professional, etc.) labeled "Demand" — marks where smart money likely placed buy orders as price diverged at the low.
Supply Zones (Bearish) : Theme-colored box (magenta in Cyberpunk, orange in Professional) labeled "Supply" — marks where smart money likely placed sell orders as price diverged at the high.
Theory : Divergences represent institutional disagreement with the crowd. The crowd pushed price to an extreme (new high or low), but momentum (oscillator) is waning, indicating smart money is taking the opposite side. These zones mark order placement areas that become future support/resistance.
Use Cases :
Exit targets: Take profit when price returns to opposite-side zone
Re-entry levels: If price returns to your entry zone, consider adding
Stop placement: Place stops just beyond your zone (below demand, above supply)
Auto-Cleanup : System keeps the last 20 zones to prevent chart clutter.
Adversarial Bar Coloring — Real-Time Market Debate Heatmap
Each bar is colored based on the Bull Case vs Bear Case differential:
Strong Bull Advantage (diff > 0.3): Full theme bull color (e.g., cyan)
Moderate Bull Advantage (diff > 0.1): 50% transparency bull
Neutral (diff -0.1 to 0.1): Gray/neutral theme
Moderate Bear Advantage (diff < -0.1): 50% transparency bear
Strong Bear Advantage (diff < -0.3): Full theme bear color (e.g., magenta)
This creates a real-time visual heatmap showing which side is "winning" the market debate. When bars flip from cyan to magenta (or vice versa), you're witnessing a shift in adversarial advantage — a leading indicator of potential momentum changes.
Exhaustion Shading
When exhaustion score exceeds 0.75, the chart background displays a semi-transparent yellow highlight. This immediate visual warning alerts you that the current move is at high risk of reversal, even if trend indicators remain strong.
Visual Themes — Six Aesthetic Options
Cyberpunk : Cyan/Magenta/Yellow — High contrast, neon aesthetic, excellent for dark-themed trading environments
Professional : Blue/Orange/Green — Corporate color palette, suitable for presentations and professional documentation
Ocean : Teal/Red/Cyan — Aquatic palette, calming for extended monitoring sessions
Fire : Orange/Red/Coral — Warm aggressive colors, high energy
Matrix : Green/Red/Lime — Code aesthetic, homage to classic hacker visuals
Monochrome : White/Gray — Minimal distraction, maximum focus on price action
All visual elements (signal markers, zones, bar colors, dashboard) adapt to your selected theme.
Divergence Engine — Core Detection System
What Are Divergences?
Divergences occur when price action and momentum indicators disagree, creating structural tension that often resolves in a change of direction:
Regular Divergence (Reversal Signal) :
Bearish Regular : Price makes higher high, oscillator makes lower high → Potential trend reversal down
Bullish Regular : Price makes lower low, oscillator makes higher low → Potential trend reversal up
Hidden Divergence (Continuation Signal) :
Bearish Hidden : Price makes lower high, oscillator makes higher high → Downtrend continuation
Bullish Hidden : Price makes higher low, oscillator makes lower low → Uptrend continuation
Both types can be enabled/disabled independently in settings.
Pivot Detection Methods
BZ-CAE uses symmetric pivot detection with separate lookback and lookforward periods (default 5/5):
Pivot High : Bar where high > all highs within lookback range AND high > all highs within lookforward range
Pivot Low : Bar where low < all lows within lookback range AND low < all lows within lookforward range
This ensures structural validity — the pivot must be a clear local extreme, not just a minor wiggle.
Divergence Validation Requirements
For a divergence to be confirmed, it must satisfy:
Slope Disagreement : Price slope and oscillator slope must move in opposite directions (for regular divs) or same direction with inverted highs/lows (for hidden divs)
Minimum Slope Change : |osc_slope| > min_slope_change / 100 (default 1.0) — filters weak, marginal divergences
Maximum Lookback Range : Pivots must be within max_lookback bars (default 60) — prevents ancient, irrelevant divergences
ATR-Normalized Strength : Divergence strength = min(|price_slope| × |osc_slope| × 10, 1.0) — quantifies the magnitude of disagreement in volatility context
Regular divergences receive 1.0× weight; hidden divergences receive 0.8× weight (slightly less reliable historically).
Oscillator Options — Five Professional Indicators
RSI (Relative Strength Index) : Classic overbought/oversold momentum indicator. Best for: General purpose divergence detection across all instruments.
Stochastic : Range-bound %K momentum comparing close to high-low range. Best for: Mean reversion strategies and range-bound markets.
CCI (Commodity Channel Index) : Measures deviation from statistical mean, auto-normalized to 0-100 scale. Best for: Cyclical instruments and commodities.
MFI (Money Flow Index) : Volume-weighted RSI incorporating money flow. Best for: Volume-driven markets like stocks and crypto.
Williams %R : Inverse stochastic looking back over period, auto-adjusted to 0-100. Best for: Reversal detection at extremes.
Each oscillator has adjustable length (2-200, default 14) and smoothing (1-20, default 1). You also set overbought (50-100, default 70) and oversold (0-50, default 30) thresholds.
Signal Timing Modes — Understanding Repainting
BZ-CAE offers two timing policies with complete transparency about repainting behavior:
Realtime (1-bar, peak-anchored)
How It Works :
Detects peaks 1 bar ago using pattern: high > high AND high > high
Signal prints on the NEXT bar after peak detection (bar_index)
Visual marker anchors to the actual PEAK bar (bar_index - 1, offset -1)
Signal locks in when bar CONFIRMS (closes)
Repainting Behavior :
On the FORMING bar (before close), the peak condition may change as new prices arrive
Once bar CLOSES (barstate.isconfirmed), signal is locked permanently
This is preview/early warning behavior by design
Best For :
Active monitoring and immediate alerts
Learning the system (seeing signals develop in real-time)
Responsive entry if you're watching the chart live
Confirmed (lookforward)
How It Works :
Uses Pine Script's built-in ta.pivothigh() and ta.pivotlow() functions
Requires full pivot validation period (lookback + lookforward bars)
Signal prints pivot_lookforward bars after the actual peak (default 5-bar delay)
Visual marker anchors to the actual peak bar (offset -pivot_lookforward)
No Repainting Behavior
Best For :
Backtesting and historical analysis
Conservative entries requiring full confirmation
Automated trading systems
Swing trading with larger timeframes
Tradeoff :
Delayed entry by pivot_lookforward bars (typically 5 bars)
On a 5-minute chart, this is a 25-minute delay
On a 4-hour chart, this is a 20-hour delay
Recommendation : Use Confirmed for backtesting to verify system performance honestly. Use Realtime for live monitoring only if you're actively watching the chart and understand pre-confirmation repainting behavior.
Signal Spacing System — Anti-Spam Architecture
Even after CAE filtering, raw divergences can cluster. The spacing system enforces separation:
Three Independent Filters
1. Min Bars Between ANY Signals (default 12):
Prevents rapid-fire clustering across both directions
If last signal (bull or bear) was within N bars, block new signal
Ensures breathing room between all setups
2. Min Bars Between SAME-SIDE Signals (default 24, optional enforcement):
Prevents bull-bull or bear-bear spam
Separate tracking for bullish and bearish signal timelines
Toggle enforcement on/off
3. Min ATR Distance From Last Signal (default 0, optional):
Requires price to move N × ATR from last signal location
Ensures meaningful price movement between setups
0 = disabled, 0.5-2.0 = typical range for enabled
All three filters work independently. A signal must pass ALL enabled filters to proceed.
Practical Guidance :
Scalping (1-5m) : Any 6-10, Same-side 12-20, ATR 0-0.5
Day Trading (15m-1H) : Any 12, Same-side 24, ATR 0-1.0
Swing Trading (4H-D) : Any 20-30, Same-side 40-60, ATR 1.0-2.0
Dashboard — Real-Time Control Center
The dashboard (toggleable, four corner positions, three sizes) provides comprehensive system intelligence:
Oscillator Section
Current oscillator type and value
State: OVERBOUGHT / OVERSOLD / NEUTRAL (color-coded)
Length parameter
Cognitive Engine Section
TCS (Trend Conviction Score) :
Current value with emoji state indicator
🔥 = Strong trend (>0.75)
📊 = Moderate trend (0.50-0.75)
〰️ = Weak/choppy (<0.50)
Color: Red if above threshold (trend filter active), yellow if moderate, green if weak
DMA (Directional Momentum Alignment) :
Current value with emoji direction indicator
🐂 = Bullish momentum (>0.5)
⚖️ = Balanced (-0.5 to 0.5)
🐻 = Bearish momentum (<-0.5)
Color: Green if bullish, red if bearish
Exhaustion :
Current value with emoji warning indicator
⚠️ = High exhaustion (>0.75)
🟡 = Moderate (0.50-0.75)
✓ = Low (<0.50)
Color: Red if high, yellow if moderate, green if low
Pullback :
Quality of current distance from EMA20
Values >0.6 are ideal entry zones (not too close, not too far)
Bull Case / Bear Case (if Adversarial enabled):
Current scores for both sides of the market debate
Differential with emoji indicator:
📈 = Bull advantage (>0.2)
➡️ = Balanced (-0.2 to 0.2)
📉 = Bear advantage (<-0.2)
Last Signal Metrics Section (New Feature)
When a signal fires, this section captures and displays:
Signal type (BULL or BEAR)
Bars elapsed since signal
Confidence % at time of signal
TCS value at signal time
DMA value at signal time
Purpose : Provides a historical reference for learning. You can see what the market state looked like when the last signal fired, helping you correlate outcomes with conditions.
Statistics Section
Total Signals : Lifetime count across session
Blocked Signals : Count and percentage (filter effectiveness metric)
Bull Signals : Total bullish divergences
Bear Signals : Total bearish divergences
Purpose : System health monitoring. If blocked % is very high (>60%), filters may be too strict. If very low (<10%), filters may be too loose.
Advisory Annotations
When CAE Mode = Advisory, this section displays warnings for signals that would be blocked in Filtering mode:
Examples:
"Bull spacing: wait 8 bars"
"Bear: strong uptrend (TCS=0.87)"
"Adversarial bearish"
"Low confidence 32%"
Multiple warnings can stack, separated by " | ". This teaches you CAE's decision logic transparently.
How to Use BZ-CAE — Complete Workflow
Phase 1: Initial Setup (First Session)
Apply BZ-CAE to your chart
Select your preferred Visual Theme (Cyberpunk recommended for visibility)
Set Signal Timing to "Confirmed (lookforward)" for learning
Choose your Oscillator Type (RSI recommended for general use, length 14)
Set Overbought/Oversold to 70/30 (standard)
Enable both Regular Divergence and Hidden Divergence
Set Pivot Lookback/Lookforward to 5/5 (balanced structure)
Enable CAE Intelligence
Set CAE Mode to "Advisory" (learning mode)
Enable all three CAE filters: Strong Trend Filter , Adversarial Validation , Confidence Gating
Enable Show Dashboard , position Top Right, size Normal
Enable Draw Bifurcation Zones and Adversarial Bar Coloring
Phase 2: Learning Period (Weeks 1-2)
Goal : Understand how CAE evaluates market state and filters signals.
Activities :
Watch the dashboard during signals :
Note TCS values when counter-trend signals fail — this teaches you the trend strength threshold for your instrument
Observe exhaustion patterns at actual turning points — learn when overextension truly matters
Study adversarial differential at signal times — see when opposing cases dominate
Review blocked signals (orange X-crosses):
In Advisory mode, you see everything — signals that would pass AND signals that would be blocked
Check the advisory annotations to understand why CAE would block
Track outcomes: Were the blocks correct? Did those signals fail?
Use Last Signal Metrics :
After each signal, check the dashboard capture of confidence, TCS, and DMA
Journal these values alongside trade outcomes
Identify patterns: Do confidence >0.70 signals work better? Does your instrument respect TCS >0.85?
Understand your instrument's "personality" :
Trending instruments (indices, major forex) may need TCS threshold 0.85-0.90
Choppy instruments (low-cap stocks, exotic pairs) may work best with TCS 0.70-0.75
High-volatility instruments (crypto) may need wider spacing
Low-volatility instruments may need tighter spacing
Phase 3: Calibration (Weeks 3-4)
Goal : Optimize settings for your specific instrument, timeframe, and style.
Calibration Checklist :
Min Confidence Threshold :
Review confidence distribution in your signal journal
Identify the confidence level below which signals consistently fail
Set min_confidence slightly above that level
Day trading : 0.35-0.45
Swing trading : 0.40-0.55
Scalping : 0.30-0.40
TCS Threshold :
Find the TCS level where counter-trend signals consistently get stopped out
Set tcs_threshold at or slightly below that level
Trending instruments : 0.85-0.90
Mixed instruments : 0.80-0.85
Choppy instruments : 0.75-0.80
Exhaustion Override Level :
Identify exhaustion readings that marked genuine reversals
Set exhaustion_required just below the average
Typical range : 0.45-0.55
Adversarial Threshold :
Default 0.10 works for most instruments
If you find CAE is too conservative (blocking good trades), raise to 0.15-0.20
If signals are still getting caught in opposing momentum, lower to 0.07-0.09
Spacing Parameters :
Count bars between quality signals in your journal
Set min bars ANY to ~60% of that average
Set min bars SAME-SIDE to ~120% of that average
Scalping : Any 6-10, Same 12-20
Day trading : Any 12, Same 24
Swing : Any 20-30, Same 40-60
Oscillator Selection :
Try different oscillators for 1-2 weeks each
Track win rate and average winner/loser by oscillator type
RSI : Best for general use, clear OB/OS
Stochastic : Best for range-bound, mean reversion
MFI : Best for volume-driven markets
CCI : Best for cyclical instruments
Williams %R : Best for reversal detection
Phase 4: Live Deployment
Goal : Disciplined execution with proven, calibrated system.
Settings Changes :
Switch CAE Mode from Advisory to Filtering
System now actively blocks low-quality signals
Only setups passing all gates reach your chart
Keep Signal Timing on Confirmed for conservative entries
OR switch to Realtime if you're actively monitoring and want faster entries (accept pre-confirmation repaint risk)
Use your calibrated thresholds from Phase 3
Enable high-confidence alerts: "⭐ High Confidence Bullish/Bearish" (>0.70)
Trading Discipline Rules :
Respect Blocked Signals :
If CAE blocks a trade you wanted to take, TRUST THE SYSTEM
Don't manually override — if you consistently disagree, return to Phase 2/3 calibration
The block exists because market state failed intelligence checks
Confidence-Based Position Sizing :
Confidence >0.70: Standard or increased size (e.g., 1.5-2.0% risk)
Confidence 0.50-0.70: Standard size (e.g., 1.0% risk)
Confidence 0.35-0.50: Reduced size (e.g., 0.5% risk) or skip if conservative
TCS-Based Management :
High TCS + counter-trend signal: Use tight stops, quick exits (you're fading momentum)
Low TCS + reversal signal: Use wider stops, trail aggressively (genuine reversal potential)
Exhaustion Awareness :
Exhaustion >0.75 (yellow shading): Market is overextended, reversal risk is elevated — consider early exit or tighter trailing stops even on winning trades
Exhaustion <0.30: Continuation bias — hold for larger move, wide trailing stops
Adversarial Context :
Strong differential against you (e.g., bullish signal with bear diff <-0.2): Use very tight stops, consider skipping
Strong differential with you (e.g., bullish signal with bull diff >0.2): Trail aggressively, this is your tailwind
Practical Settings by Timeframe & Style
Scalping (1-5 Minute Charts)
Objective : High frequency, tight stops, quick reversals in fast-moving markets.
Oscillator :
Type: RSI or Stochastic (fast response to quick moves)
Length: 9-11 (more responsive than standard 14)
Smoothing: 1 (no lag)
OB/OS: 65/35 (looser thresholds ensure frequent crossings in fast conditions)
Divergence :
Pivot Lookback/Lookforward: 3/3 (tight structure, catch small swings)
Max Lookback: 40-50 bars (recent structure only)
Min Slope Change: 0.8-1.0 (don't be overly strict)
CAE :
Mode: Advisory first (learn), then Filtering
Min Confidence: 0.30-0.35 (lower bar for speed, accept more signals)
TCS Threshold: 0.70-0.75 (allow more counter-trend opportunities)
Exhaustion Required: 0.45-0.50 (moderate override)
Strong Trend Filter: ON (still respect major intraday trends)
Adversarial: ON (critical for scalping protection — catches bad entries quickly)
Spacing :
Min Bars ANY: 6-10 (fast pace, many setups)
Min Bars SAME-SIDE: 12-20 (prevent clustering)
Min ATR Distance: 0 or 0.5 (loose)
Timing : Realtime (speed over precision, but understand repaint risk)
Visuals :
Signal Size: Tiny (chart clarity in busy conditions)
Show Zones: Optional (can clutter on low timeframes)
Bar Coloring: ON (helps read momentum shifts quickly)
Dashboard: Small size (corner reference, not main focus)
Key Consideration : Scalping generates noise. Even with CAE, expect lower win rate (45-55%) but aim for favorable R:R (2:1 or better). Size conservatively.
Day Trading (15-Minute to 1-Hour Charts)
Objective : Balance quality and frequency. Standard divergence trading approach.
Oscillator :
Type: RSI or MFI (proven reliability, volume confirmation with MFI)
Length: 14 (industry standard, well-studied)
Smoothing: 1-2
OB/OS: 70/30 (classic levels)
Divergence :
Pivot Lookback/Lookforward: 5/5 (balanced structure)
Max Lookback: 60 bars
Min Slope Change: 1.0 (standard strictness)
CAE :
Mode: Filtering (enforce discipline from the start after brief Advisory learning)
Min Confidence: 0.35-0.45 (quality filter without being too restrictive)
TCS Threshold: 0.80-0.85 (respect strong trends)
Exhaustion Required: 0.50 (balanced override threshold)
Strong Trend Filter: ON
Adversarial: ON
Confidence Gating: ON (all three filters active)
Spacing :
Min Bars ANY: 12 (breathing room between all setups)
Min Bars SAME-SIDE: 24 (prevent bull/bear clusters)
Min ATR Distance: 0-1.0 (optional refinement, typically 0.5-1.0)
Timing : Confirmed (1-bar delay for reliability, no repainting)
Visuals :
Signal Size: Tiny or Small
Show Zones: ON (useful reference for exits/re-entries)
Bar Coloring: ON (context awareness)
Dashboard: Normal size (full visibility)
Key Consideration : This is the "sweet spot" timeframe for BZ-CAE. Market structure is clear, CAE has sufficient data, and signal frequency is manageable. Expect 55-65% win rate with proper execution.
Swing Trading (4-Hour to Daily Charts)
Objective : Quality over quantity. High conviction only. Larger stops and targets.
Oscillator :
Type: RSI or CCI (robust on higher timeframes, smooth longer waves)
Length: 14-21 (capture larger momentum swings)
Smoothing: 1-3
OB/OS: 70/30 or 75/25 (strict extremes)
Divergence :
Pivot Lookback/Lookforward: 5/5 or 7/7 (structural purity, major swings only)
Max Lookback: 80-100 bars (broader historical context)
Min Slope Change: 1.2-1.5 (require strong, undeniable divergence)
CAE :
Mode: Filtering (strict enforcement, premium setups only)
Min Confidence: 0.40-0.55 (high bar for entry)
TCS Threshold: 0.85-0.95 (very strong trend protection — don't fade established HTF trends)
Exhaustion Required: 0.50-0.60 (higher bar for override — only extreme exhaustion justifies counter-trend)
Strong Trend Filter: ON (critical on HTF)
Adversarial: ON (avoid obvious bad trades)
Confidence Gating: ON (quality gate essential)
Spacing :
Min Bars ANY: 20-30 (substantial separation)
Min Bars SAME-SIDE: 40-60 (significant breathing room)
Min ATR Distance: 1.0-2.0 (require meaningful price movement)
Timing : Confirmed (purity over speed, zero repaint for swing accuracy)
Visuals :
Signal Size: Small or Normal (clear markers on zoomed-out view)
Show Zones: ON (important HTF levels)
Bar Coloring: ON (long-term trend awareness)
Dashboard: Normal or Large (comprehensive analysis)
Key Consideration : Swing signals are rare but powerful. Expect 2-5 signals per month per instrument. Win rate should be 60-70%+ due to stringent filtering. Position size can be larger given confidence.
Dashboard Interpretation Reference
TCS (Trend Conviction Score) States
0.00-0.50: Weak/Choppy
Emoji: 〰️
Color: Green/cyan
Meaning: No established trend. Range-bound or consolidating. Both reversal and continuation signals viable.
Action: Reversals (regular divs) are safer. Use wider profit targets (market has room to move). Consider mean reversion strategies.
0.50-0.75: Moderate Trend
Emoji: 📊
Color: Yellow/neutral
Meaning: Developing trend but not locked in. Context matters significantly.
Action: Check DMA and exhaustion. If DMA confirms trend and exhaustion is low, favor continuation (hidden divs). If exhaustion is high, reversals are viable.
0.75-0.85: Strong Trend
Emoji: 🔥
Color: Orange/warning
Meaning: Well-established trend with persistence. Counter-trend is high risk.
Action: Require exhaustion >0.50 for counter-trend entries. Favor continuation signals. Use tight stops on counter-trend attempts.
0.85-1.00: Very Strong Trend
Emoji: 🔥🔥
Color: Red/danger (if counter-trading)
Meaning: Locked-in institutional trend. Extremely high risk to fade.
Action: Avoid counter-trend unless exhaustion >0.75 (yellow shading). Focus exclusively on continuation opportunities. Momentum is king here.
DMA (Directional Momentum Alignment) Zones
-2.0 to -1.0: Strong Bearish Momentum
Emoji: 🐻🐻
Color: Dark red
Meaning: Powerful downside force. Sellers are in control.
Action: Bullish divergences are counter-momentum (high risk). Bearish divergences are with-momentum (lower risk). Size down on longs.
-0.5 to 0.5: Neutral/Balanced
Emoji: ⚖️
Color: Gray/neutral
Meaning: No strong directional bias. Choppy or consolidating.
Action: Both directions have similar probability. Focus on confidence score and adversarial differential for edge.
1.0 to 2.0: Strong Bullish Momentum
Emoji: 🐂🐂
Color: Bright green/cyan
Meaning: Powerful upside force. Buyers are in control.
Action: Bearish divergences are counter-momentum (high risk). Bullish divergences are with-momentum (lower risk). Size down on shorts.
Exhaustion States
0.00-0.50: Fresh Move
Emoji: ✓
Color: Green
Meaning: Trend is healthy, not overextended. Room to run.
Action: Counter-trend trades are premature. Favor continuation. Hold winners for larger moves. Avoid early exits.
0.50-0.75: Mature Move
Emoji: 🟡
Color: Yellow
Meaning: Move is aging. Watch for signs of climax.
Action: Tighten trailing stops on winning trades. Be ready for reversals. Don't add to positions aggressively.
0.75-0.85: High Exhaustion
Emoji: ⚠️
Color: Orange
Background: Yellow shading appears
Meaning: Move is overextended. Reversal risk elevated significantly.
Action: Counter-trend reversals are higher probability. Consider early exits on with-trend positions. Size up on reversal divergences (if CAE allows).
0.85-1.00: Critical Exhaustion
Emoji: ⚠️⚠️
Color: Red
Background: Yellow shading intensifies
Meaning: Climax conditions. Reversal imminent or underway.
Action: Aggressive reversal trades justified. Exit all with-trend positions. This is where major turns occur.
Confidence Score Tiers
0.00-0.30: Low Quality
Color: Red
Status: Blocked in Filtering mode
Action: Skip entirely. Setup lacks fundamental quality across multiple factors.
0.30-0.50: Moderate Quality
Color: Yellow/orange
Status: Marginal — passes in Filtering only if >min_confidence
Action: Reduced position size (0.5-0.75% risk). Tight stops. Conservative profit targets. Skip if you're selective.
0.50-0.70: High Quality
Color: Green/cyan
Status: Good setup across most quality factors
Action: Standard position size (1.0-1.5% risk). Normal stops and targets. This is your bread-and-butter trade.
0.70-1.00: Premium Quality
Color: Bright green/gold
Status: Exceptional setup — all factors aligned
Visual: Double confidence ring appears
Action: Consider increased position size (1.5-2.0% risk, maximum). Wider stops. Larger targets. High probability of success. These are rare — capitalize when they appear.
Adversarial Differential Interpretation
Bull Differential > 0.3 :
Visual: Strong cyan/green bar colors
Meaning: Bull case strongly dominates. Buyers have clear advantage.
Action: Bullish divergences favored (with-advantage). Bearish divergences face headwind (reduce size or skip). Momentum is bullish.
Bull Differential 0.1 to 0.3 :
Visual: Moderate cyan/green transparency
Meaning: Moderate bull advantage. Buyers have edge but not overwhelming.
Action: Both directions viable. Slight bias toward longs.
Differential -0.1 to 0.1 :
Visual: Gray/neutral bars
Meaning: Balanced debate. No clear advantage either side.
Action: Rely on other factors (confidence, TCS, exhaustion) for direction. Adversarial is neutral.
Bear Differential -0.3 to -0.1 :
Visual: Moderate red/magenta transparency
Meaning: Moderate bear advantage. Sellers have edge but not overwhelming.
Action: Both directions viable. Slight bias toward shorts.
Bear Differential < -0.3 :
Visual: Strong red/magenta bar colors
Meaning: Bear case strongly dominates. Sellers have clear advantage.
Action: Bearish divergences favored (with-advantage). Bullish divergences face headwind (reduce size or skip). Momentum is bearish.
Last Signal Metrics — Post-Trade Analysis
After a signal fires, dashboard captures:
Type : BULL or BEAR
Bars Ago : How long since signal (updates every bar)
Confidence : What was the quality score at signal time
TCS : What was trend conviction at signal time
DMA : What was momentum alignment at signal time
Use Case : Post-trade journaling and learning.
Example: "BULL signal 12 bars ago. Confidence: 68%, TCS: 0.42, DMA: -0.85"
Analysis : This was a bullish reversal (regular div) with good confidence, weak trend (TCS), but strong bearish momentum (DMA). The bet was that momentum would reverse — a counter-momentum play requiring exhaustion confirmation. Check if exhaustion was high at that time to justify the entry.
Track patterns:
Do your best trades have confidence >0.65?
Do low-TCS signals (<0.50) work better for you?
Are you more successful with-momentum (DMA aligned with signal) or counter-momentum?
Troubleshooting Guide
Problem: No Signals Appearing
Symptoms : Chart loads, dashboard shows metrics, but no divergence signals fire.
Diagnosis Checklist :
Check dashboard oscillator value : Is it crossing OB/OS levels (70/30)? If oscillator stays in 40-60 range constantly, it can't reach extremes needed for divergence detection.
Are pivots forming? : Look for local swing highs/lows on your chart. If price is in tight consolidation, pivots may not meet lookback/lookforward requirements.
Is spacing too tight? : Check "Last Signal" metrics — how many bars since last signal? If <12 and your min_bars_ANY is 12, spacing filter is blocking.
Is CAE blocking everything? : Check dashboard Statistics section — what's the blocked signal count? High blocks indicate overly strict filters.
Solutions :
Loosen OB/OS Temporarily :
Try 65/35 to verify divergence detection works
If signals appear, the issue was threshold strictness
Gradually tighten back to 67/33, then 70/30 as appropriate
Lower Min Confidence :
Try 0.25-0.30 (diagnostic level)
If signals appear, filter was too strict
Raise gradually to find sweet spot (0.35-0.45 typical)
Disable Strong Trend Filter Temporarily :
Turn off in CAE settings
If signals appear, TCS threshold was blocking everything
Re-enable and lower TCS_threshold to 0.70-0.75
Reduce Min Slope Change :
Try 0.7-0.8 (from default 1.0)
Allows weaker divergences through
Helpful on low-volatility instruments
Widen Spacing :
Set min_bars_ANY to 6-8
Set min_bars_SAME_SIDE to 12-16
Reduces time between allowed signals
Check Timing Mode :
If using Confirmed, remember there's a pivot_lookforward delay (5+ bars)
Switch to Realtime temporarily to verify system is working
Realtime has no delay but repaints
Verify Oscillator Settings :
Length 14 is standard but might not fit all instruments
Try length 9-11 for faster response
Try length 18-21 for slower, smoother response
Problem: Too Many Signals (Signal Spam)
Symptoms : Dashboard shows 50+ signals in Statistics, confidence scores mostly <0.40, signals clustering close together.
Solutions :
Raise Min Confidence :
Try 0.40-0.50 (quality filter)
Blocks bottom-tier setups
Targets top 50-60% of divergences only
Tighten OB/OS :
Use 70/30 or 75/25
Requires more extreme oscillator readings
Reduces false divergences in mid-range
Increase Min Slope Change :
Try 1.2-1.5 (from default 1.0)
Requires stronger, more obvious divergences
Filters marginal slope disagreements
Raise TCS Threshold :
Try 0.85-0.90 (from default 0.80)
Stricter trend filter blocks more counter-trend attempts
Favors only strongest trend alignment
Enable ALL CAE Gates :
Turn on Trend Filter + Adversarial + Confidence
Triple-layer protection
Blocks aggressively — expect 20-40% reduction in signals
Widen Spacing :
min_bars_ANY: 15-20 (from 12)
min_bars_SAME_SIDE: 30-40 (from 24)
Creates substantial breathing room
Switch to Confirmed Timing :
Removes realtime preview noise
Ensures full pivot validation
5-bar delay filters many false starts
Problem: Signals in Strong Trends Get Stopped Out
Symptoms : You take a bullish divergence in a downtrend (or bearish in uptrend), and it immediately fails. Dashboard showed high TCS at the time.
Analysis : This is INTENDED behavior — CAE is protecting you from low-probability counter-trend trades.
Understanding :
Check Last Signal Metrics in dashboard — what was TCS when signal fired?
If TCS was >0.85 and signal was counter-trend, CAE correctly identified it as high risk
Strong trends rarely reverse cleanly without major exhaustion
Your losses here are the system working as designed (blocking bad odds)
If You Want to Override (Not Recommended) :
Lower TCS_threshold to 0.70-0.75 (allows more counter-trend)
Lower exhaustion_required to 0.40 (easier override)
Disable Strong Trend Filter entirely (very risky)
Better Approach :
TRUST THE FILTER — it's preventing costly mistakes
Wait for exhaustion >0.75 (yellow shading) before counter-trending strong TCS
Focus on continuation signals (hidden divs) in high-TCS environments
Use Advisory mode to see what CAE is blocking and learn from outcomes
Problem: Adversarial Blocking Seems Wrong
Symptoms : You see a divergence that "looks good" visually, but CAE blocks with "Adversarial bearish/bullish" warning.
Diagnosis :
Check dashboard Bull Case and Bear Case scores at that moment
Look at Differential value
Check adversarial bar colors — was there strong coloring against your intended direction?
Understanding :
Adversarial catches "obvious" opposing momentum that's easy to miss
Example: Bullish divergence at a local low, BUT price is deeply below EMA50, bearish momentum is strong, and RSI shows knife-catching conditions
Bull Case might be 0.20 while Bear Case is 0.55
Differential = -0.35, far beyond threshold
Block is CORRECT — you'd be fighting overwhelming opposing flow
If You Disagree Consistently
Review blocked signals on chart — scroll back and check outcomes
Did those blocked signals actually work, or did they fail as adversarial predicted?
Raise adv_threshold to 0.15-0.20 (more permissive, allows closer battles)
Disable Adversarial Validation temporarily (diagnostic) to isolate its effect
Use Advisory mode to learn adversarial patterns over 50-100 signals
Remember : Adversarial is conservative BY DESIGN. It prevents "obvious" bad trades where you're fighting strong strength the other way.
Problem: Dashboard Not Showing or Incomplete
Solutions :
Toggle "Show Dashboard" to ON in settings
Try different dashboard sizes (Small/Normal/Large)
Try different positions (Top Left/Right, Bottom Left/Right) — might be off-screen
Some sections require CAE Enable = ON (Cognitive Engine section won't appear if CAE is disabled)
Statistics section requires at least 1 lifetime signal to populate
Check that visual theme is set (dashboard colors adapt to theme)
Problem: Performance Lag, Chart Freezing
Symptoms : Chart loading is slow, indicator calculations cause delays, pinch-to-zoom lags.
Diagnosis : Visual features are computationally expensive, especially adversarial bar coloring (recalculates every bar).
Solutions (In Order of Impact) :
Disable Adversarial Bar Coloring (MOST EXPENSIVE):
Turn OFF "Adversarial Bar Coloring" in settings
This is the single biggest performance drain
Immediate improvement
Reduce Vertical Lines :
Lower "Keep last N vertical lines" to 20-30
Or set to 0 to disable entirely
Moderate improvement
Disable Bifurcation Zones :
Turn OFF "Draw Bifurcation Zones"
Reduces box drawing calculations
Moderate improvement
Set Dashboard Size to Small :
Smaller dashboard = fewer cells = less rendering
Minor improvement
Use Shorter Max Lookback :
Reduce max_lookback to 40-50 (from 60+)
Fewer bars to scan for divergences
Minor improvement
Disable Exhaustion Shading :
Turn OFF "Show Market State"
Removes background coloring calculations
Minor improvement
Extreme Performance Mode :
Disable ALL visual enhancements
Keep only triangle markers
Dashboard Small or OFF
Use Minimal theme if available
Problem: Realtime Signals Repainting
Symptoms : You see a signal appear, but on next bar it disappears or moves.
Explanation :
Realtime mode detects peaks 1 bar ago: high > high AND high > high
On the FORMING bar (before close), this condition can change as new prices arrive
Example: At 10:05, high (10:04 bar) was 100, current high is 99 → peak detected
At 10:05:30, new high of 101 arrives → peak condition breaks → signal disappears
At 10:06 (bar close), final high is 101 → no peak at 10:04 anymore → signal gone permanently
This is expected behavior for realtime responsiveness. You get preview/early warning, but it's not locked until bar confirms.
Solutions :
Use Confirmed Timing :
Switch to "Confirmed (lookforward)" mode
ZERO repainting — pivot must be fully validated
5-bar delay (pivot_lookforward)
What you see in history is exactly what would have appeared live
Accept Realtime Repaint as Tradeoff :
Keep Realtime mode for speed and alerts
Understand that pre-confirmation signals may vanish
Only trade signals that CONFIRM at bar close (check barstate.isconfirmed)
Use for live monitoring, NOT for backtesting
Trade Only After Confirmation :
In Realtime mode, wait 1 full bar after signal appears before entering
If signal survives that bar close, it's locked
This adds 1-bar delay but removes repaint risk
Recommendation : Use Confirmed for backtesting and conservative trading. Use Realtime only for active monitoring with full understanding of preview behavior.
Risk Management Integration
BZ-CAE is a signal generation system, not a complete trading strategy. You must integrate proper risk management:
Position Sizing by Confidence
Confidence 0.70-1.00 (Premium) :
Risk: 1.5-2.0% of account (MAXIMUM)
Reasoning: High-quality setup across all factors
Still cap at 2% — even premium setups can fail
Confidence 0.50-0.70 (High Quality) :
Risk: 1.0-1.5% of account
Reasoning: Standard good setup
Your bread-and-butter risk level
Confidence 0.35-0.50 (Moderate Quality) :
Risk: 0.5-1.0% of account
Reasoning: Marginal setup, passes minimum threshold
Reduce size or skip if you're selective
Confidence <0.35 (Low Quality) :
Risk: 0% (blocked in Filtering mode)
Reasoning: Insufficient quality factors
System protects you by not showing these
Stop Placement Strategies
For Reversal Signals (Regular Divergences) :
Place stop beyond the divergence pivot plus buffer
Bullish : Stop below the divergence low - 1.0-1.5 × ATR
Bearish : Stop above the divergence high + 1.0-1.5 × ATR
Reasoning: If price breaks the pivot, divergence structure is invalidated
For Continuation Signals (Hidden Divergences) :
Place stop beyond recent swing in opposite direction
Bullish continuation : Stop below recent swing low (not the divergence pivot itself)
Bearish continuation : Stop above recent swing high
Reasoning: You're trading with trend, allow more breathing room
ATR-Based Stops :
1.5-2.0 × ATR is standard
Scale by timeframe:
Scalping (1-5m): 1.0-1.5 × ATR (tight)
Day trading (15m-1H): 1.5-2.0 × ATR (balanced)
Swing (4H-D): 2.0-3.0 × ATR (wide)
Never Use Fixed Dollar/Pip Stops :
Markets have different volatility
50-pip stop on EUR/USD ≠ 50-pip stop on GBP/JPY
Always normalize by ATR or pivot structure
Profit Targets and Scaling
Primary Target :
2-3 × ATR from entry (minimum 2:1 reward-risk)
Example : Entry at 100, ATR = 2, stop at 97 (1.5 × ATR) → target at 106 (3 × ATR) = 2:1 R:R
Scaling Out Strategy :
Take 50% off at 1.5 × ATR (secure partial profit)
Move stop to breakeven
Trail remaining 50% with 1.0 × ATR trailing stop
Let winners run if trend persists
Targets by Confidence :
High Confidence (>0.70) : Aggressive targets (3-4 × ATR), trail wider (1.5 × ATR)
Standard Confidence (0.50-0.70) : Normal targets (2-3 × ATR), standard trail (1.0 × ATR)
Low Confidence (0.35-0.50) : Conservative targets (1.5-2 × ATR), tight trail (0.75 × ATR)
Use Bifurcation Zones :
If opposite-side zone is visible on chart (from previous signal), use it as target
Example : Bullish signal at 100, prior supply zone at 110 → use 110 as target
Zones mark institutional resistance/support
Exhaustion-Based Exits :
If you're in a trade and exhaustion >0.75 develops (yellow shading), consider early exit
Market is overextended — reversal risk is high
Take profit even if target not reached
Trade Management by TCS
High TCS + Counter-Trend Trade (Risky) :
Use very tight stops (1.0-1.5 × ATR)
Conservative targets (1.5-2 × ATR)
Quick exit if trade doesn't work immediately
You're fading momentum — respect it
Low TCS + Reversal Trade (Safer) :
Use wider stops (2.0-2.5 × ATR)
Aggressive targets (3-4 × ATR)
Trail with patience
Genuine reversal potential in weak trend
High TCS + Continuation Trade (Safest) :
Standard stops (1.5-2.0 × ATR)
Very aggressive targets (4-5 × ATR)
Trail wide (1.5-2.0 × ATR)
You're with institutional momentum — let it run
Educational Value — Learning Machine Intelligence
BZ-CAE is designed as a learning platform, not just a tool:
Advisory Mode as Teacher
Most indicators are binary: signal or no signal. You don't learn WHY certain setups are better.
BZ-CAE's Advisory mode shows you EVERY potential divergence, then annotates the ones that would be blocked in Filtering mode with specific reasons:
"Bull: strong downtrend (TCS=0.87)" teaches you that TCS >0.85 makes counter-trend very risky
"Adversarial bearish" teaches you that the opposing case was dominating
"Low confidence 32%" teaches you that the setup lacked quality across multiple factors
"Bull spacing: wait 8 bars" teaches you that signals need breathing room
After 50-100 signals in Advisory mode, you internalize the CAE's decision logic. You start seeing these factors yourself BEFORE the indicator does.
Dashboard Transparency
Most "intelligent" indicators are black boxes — you don't know how they make decisions.
BZ-CAE shows you ALL metrics in real-time:
TCS tells you trend strength
DMA tells you momentum alignment
Exhaustion tells you overextension
Adversarial shows both sides of the debate
Confidence shows composite quality
You learn to interpret market state holistically, a skill applicable to ANY trading system beyond this indicator.
Divergence Quality Education
Not all divergences are equal. BZ-CAE teaches you which conditions produce high-probability setups:
Quality divergence : Regular bullish div at a low, TCS <0.50 (weak trend), exhaustion >0.75 (overextended), positive adversarial differential, confidence >0.70
Low-quality divergence : Regular bearish div at a high, TCS >0.85 (strong uptrend), exhaustion <0.30 (not overextended), negative adversarial differential, confidence <0.40
After using the system, you can evaluate divergences manually with similar intelligence.
Risk Management Discipline
Confidence-based position sizing teaches you to adjust risk based on setup quality, not emotions:
Beginners often size all trades identically
Or worse, size UP on marginal setups to "make up" for losses
BZ-CAE forces systematic sizing: premium setups get larger size, marginal setups get smaller size
This creates a probabilistic approach where your edge compounds over time.
What This Indicator Is NOT
Complete transparency about limitations and positioning:
Not a Prediction System
BZ-CAE does not predict future prices. It identifies structural divergences (price-momentum disagreements) and assesses current market state (trend, exhaustion, adversarial conditions). It tells you WHEN conditions favor a potential reversal or continuation, not WHAT WILL HAPPEN.
Markets are probabilistic. Even premium-confidence setups fail ~30-40% of the time. The system improves your probability distribution over many trades — it doesn't eliminate risk.
Not Fully Automated
This is a decision support tool, not a trading robot. You must:
Execute trades manually based on signals
Manage positions (stops, targets, trailing)
Apply discretionary judgment (news events, liquidity, context)
Integrate with your broader strategy and risk rules
The confidence scores guide position sizing, but YOU determine final risk allocation based on your account size, risk tolerance, and portfolio context.
Not Beginner-Friendly
BZ-CAE requires understanding of:
Divergence trading concepts (regular vs hidden, reversal vs continuation)
Market state interpretation (trend vs range, momentum, exhaustion)
Basic technical analysis (pivots, support/resistance, EMAs)
Risk management fundamentals (position sizing, stops, R:R)
This is designed for intermediate to advanced traders willing to invest time learning the system. If you want "buy the arrow" simplicity, this isn't the tool.
Not a Holy Grail
There is no perfect indicator. BZ-CAE filters noise and improves signal quality significantly, but:
Losing trades are inevitable (even at 70% win rate, 30% still fail)
Market conditions change rapidly (yesterday's strong trend becomes today's chop)
Black swan events occur (fundamentals override technicals)
Execution matters (slippage, fees, emotional discipline)
The system provides an EDGE, not a guarantee. Your job is to execute that edge consistently with proper risk management over hundreds of trades.
Not Financial Advice
BZ-CAE is an educational and analytical tool. All trading decisions are your responsibility. Past performance (backtested or live) does not guarantee future results. Only risk capital you can afford to lose. Consult a licensed financial advisor for investment advice specific to your situation.
Ideal Market Conditions
Best Performance Characteristics
Liquid Instruments :
Major forex pairs (EUR/USD, GBP/USD, USD/JPY)
Large-cap stocks and index ETFs (SPY, QQQ, AAPL, MSFT)
High-volume crypto (BTC, ETH)
Major commodities (Gold, Oil, Natural Gas)
Reasoning: Clean price structure, clear pivots, meaningful oscillator behavior
Trending with Consolidations :
Markets that trend for 20-40 bars, then consolidate 10-20 bars, repeat
Creates divergences at consolidation boundaries (reversals) and within trends (continuations)
Both regular and hidden divs find opportunities
5-Minute to Daily Timeframes :
Below 5m: too much noise, false pivots, CAE metrics unstable
Above daily: too few signals, edge diminishes (fundamentals dominate)
Sweet spot: 15m to 4H for most traders
Consistent Volume and Participation :
Regular trading sessions (not holidays or thin markets)
Predictable volatility patterns
Avoid instruments with sudden gaps or circuit breakers
Challenging Conditions
Extremely Low Liquidity :
Penny stocks, exotic forex pairs, low-volume crypto
Erratic pivots, unreliable oscillator readings
CAE metrics can't assess market state properly
Very Low Timeframes (1-Minute or Below) :
Dominated by market microstructure noise
Divergences are everywhere but meaningless
CAE filtering helps but still unreliable
Extended Sideways Consolidation :
100+ bars of tight range with no clear pivots
Oscillator hugs midpoint (45-55 range)
No divergences to detect
Fundamentally-Driven Gap Markets :
Earnings releases, economic data, geopolitical events
Price gaps over stops and targets
Technical structure breaks down
Recommendation: Disable trading around known events
Calculation Methodology — Technical Depth
For users who want to understand the math:
Oscillator Computation
Each oscillator type calculates differently, but all normalize to 0-100:
RSI : ta.rsi(close, length) — Standard Relative Strength Index
Stochastic : ta.stoch(high, low, close, length) — %K calculation
CCI : (ta.cci(hlc3, length) + 100) / 2 — Normalized from -100/+100 to 0-100
MFI : ta.mfi(hlc3, length) — Volume-weighted RSI equivalent
Williams %R : ta.wpr(length) + 100 — Inverted stochastic adjusted to 0-100
Smoothing: If smoothing > 1, apply ta.sma(oscillator, smoothing)
Divergence Detection Algorithm
Identify Pivots :
Price high pivot: ta.pivothigh(high, lookback, lookforward)
Price low pivot: ta.pivotlow(low, lookback, lookforward)
Oscillator high pivot: ta.pivothigh(osc, lookback, lookforward)
Oscillator low pivot: ta.pivotlow(osc, lookback, lookforward)
Store Recent Pivots :
Maintain arrays of last 10 pivots with bar indices
When new pivot confirmed, unshift to array, pop oldest if >10
Scan for Slope Disagreements :
Loop through last 5 pivots
For each pair (current pivot, historical pivot):
Check if within max_lookback bars
Calculate slopes: (current - historical) / bars_between
Regular bearish: price_slope > 0, osc_slope < 0, |osc_slope| > min_threshold
Regular bullish: price_slope < 0, osc_slope > 0, |osc_slope| > min_threshold
Hidden bearish: price_slope < 0, osc_slope > 0, osc_slope > min_threshold
Hidden bullish: price_slope > 0, osc_slope < 0, |osc_slope| > min_threshold
Important Disclaimers and Terms
Performance Disclosure
Past performance, whether backtested or live-traded, does not guarantee future results. Markets change. What works today may not work tomorrow. Hypothetical or simulated performance results have inherent limitations and do not represent actual trading.
Risk of Loss
Trading involves substantial risk of loss. Only trade with risk capital you can afford to lose entirely. The high degree of leverage often available in trading can work against you as well as for you. Leveraged trading may result in losses exceeding your initial deposit.
Not Financial Advice
BZ-CAE is an educational and analytical tool for technical analysis. It is not financial advice, investment advice, or a recommendation to buy or sell any security or instrument. All trading decisions are your sole responsibility. Consult a licensed financial advisor for advice specific to your circumstances.
Technical Indicator Limitations
BZ-CAE is a technical analysis tool based on price and volume data. It does not account for:
Fundamental analysis (earnings, economic data, financial health)
Market sentiment and positioning
Geopolitical events and news
Liquidity conditions and market microstructure changes
Regulatory changes or exchange rules
Integrate with broader analysis and strategy. Do not rely solely on technical indicators for trading decisions.
Repainting Acknowledgment
As disclosed throughout this documentation:
Realtime mode may repaint on forming bars before confirmation (by design for preview functionality)
Confirmed mode has zero repainting (fully validated pivots only)
Choose timing mode appropriate for your use case. Understand the tradeoffs.
Testing Recommendation
ALWAYS test on demo/paper accounts before committing real capital. Validate the indicator's behavior on your specific instruments and timeframes. Learn the system thoroughly in Advisory mode before using Filtering mode.
Learning Resources :
In-indicator tooltips (hover over setting names for detailed explanations)
This comprehensive publishing statement (save for reference)
User guide in script comments (top of code)
Final Word — Philosophy of BZ-CAE
BZ-CAE is not designed to replace your judgment — it's designed to enhance it.
The indicator identifies structural inflection points (bifurcations) where price and momentum disagree. The Cognitive Engine evaluates market state to determine if this disagreement is meaningful or noise. The Adversarial model debates both sides of the trade to catch obvious bad setups. The Confidence system ranks quality so you can choose your risk appetite.
But YOU still execute. YOU still manage risk. YOU still learn from outcomes.
This is intelligence amplification, not intelligence replacement.
Use Advisory mode to learn how expert traders evaluate market state. Use Filtering mode to enforce discipline when emotions run high. Use the dashboard to develop a systematic approach to reading markets. Use confidence scores to size positions probabilistically.
The system provides an edge. Your job is to execute that edge with discipline, patience, and proper risk management over hundreds of trades.
Markets are probabilistic. No system wins every trade. But a systematic edge + disciplined execution + proper risk management compounds over time. That's the path to consistent profitability. BZ-CAE gives you the edge. The discipline and risk management are on you.
Taking you to school. — Dskyz, Trade with insight. Trade with anticipation.

3 Band Volume matched Candles3 Band Volume matched Candles– is a clean, high-signal volume-based candle colouring system designed to highlight the extremes of market participation. Instead of using complex multi-band gradients, this simplified version focuses on what truly matters to scalpers and intraday traders:
🔵 Very Weak Volume (Exhaustion)
Shows when the market is running out of participation. These candles often appear near tops, stalled moves, fake breakouts, and areas where liquidity is drying up. Perfect for spotting potential reversals or rug-pull conditions.
⚪ Normal Volume (Baseline Flow)
Represents regular market activity. These neutral candles keep the chart clean and make the extremes stand out instantly.
🟥 Neon Hot-Red (High-Impact Volume)
Highlights moments of significant volume — intervention, aggression, absorption, stop hunts, or strong rejection wicks. These candles are critical for identifying real moves vs. fake ones, spotting wickbacks, and confirming momentum shifts.
Why This Tool Works
By focusing only on the very low and very high ends of market volume, the indicator cuts through noise and exposes the true behaviour behind each candle. Traders can instantly see:
When a move is losing strength
When a trend is topping or stalling
When big volume enters the market
When a wickback is driven by strong rejection
Whether a breakout is real or weak
When reversals are highly probable
This makes it ideal for scalpers, and anyone who trades fast-moving instruments
Customisation
Fully customisable weak/normal and normal/strong thresholds
User-defined colours for each band
Brightness control
Borders-only mode
Adjustable fill opacity
Optional corner legend for clarity

ZFX Prime Trend Matrix PRO – Zumiko FX📌 ZFX Prime Trend Matrix PRO – Zumiko FX
ZFX Prime Trend Matrix PRO is a multi-timeframe trend dashboard designed by Zumiko FX to give traders an instant, complete market overview.
It analyzes six key timeframes simultaneously and displays trend direction, band positioning, momentum, volatility and alignment — all in one clean, horizontal table.
This matrix is made to simplify decision-making and help traders instantly identify when multiple timeframes agree on a market direction.
🔹 What the Matrix Shows
The dashboard updates in real time and displays:
1. Trend Direction
UP / DOWN / Neutral for each timeframe (M1, M5, M15, H1, H4, D1).
2. Bands Position (Prime Bands)
Shows whether price is:
Above Fast Band
Below Fast Band
Above Slow Band
Below Slow Band
Inside range
Perfect for spotting breakouts and trend continuation zones.
3. RSI (Momentum Strength)
Color-coded RSI readings help detect overbought/oversold and neutral momentum.
4. Stochastic (Timing Tool)
Reads market timing with Stoch K/D movements.
Highlights when a trend aligns with momentum.
5. ATR Bias
Instant view of volatility pressure:
LONG
SHORT
Neutral
Great for filtering entries.
6. HTF Alignment
Shows whether each timeframe is aligned with the next higher timeframe.
A powerful trend continuation filter used by advanced traders.
7. Trading Signal Zone
Final synthesised signal:
BUY ZONE → Strong bullish alignment
SELL ZONE → Strong bearish alignment
NO TRADE → Conditions not optimal
This allows traders to quickly identify “green light” moments across the trend structure.
🔹 Why This Matrix Is Powerful
✔ Shows 6 timeframes at once
✔ Helps confirm entries from other indicators
✔ Reveals hidden contradictions in trend
✔ Perfect for scalpers and day traders who need fast confirmation
✔ Works with any strategy as a high-level filter
✔ Clean, minimalistic, professional UI
🔹 Who Is It For?
Scalpers
Day traders
Swing traders
Traders using trend-following strategies
Traders who want a clean, high-level overview
🔹 About Zumiko FX
Developed by Zumiko FX, known for precision-based systems and advanced multi-timeframe tools for serious traders.

EMA MTF Trend Dashboard (Cross & Bias Modes)EMA MTF Trend Dashboard (Cross & Bias Modes)
A clean, multi-timeframe trend-alignment tool designed to support disciplined entries and higher-probability trades.
________________________________________
🔍 What This Dashboard Does
The EMA MTF Trend Dashboard provides a clear, structured view of trend direction across seven key timeframes:
1m • 5m • 15m • 30m • 1H • 4H • Daily
It highlights your execution timeframe, displays EMA-based trend direction per timeframe, and produces a plain-English directional bias using either Single EMA mode or Dual EMA Cross mode.
This makes it useful for scalpers, intraday traders, swing traders, and anyone who wants clarity before executing a trade.
________________________________________
🧠 How to Read the Dashboard
1. Execution Timeframe (Blue Row)
The blue row is your execution timeframe — the timeframe used to calculate the final bias.
• In Chart mode, it automatically matches your current chart timeframe.
• In Locked mode, it remains fixed, even if you switch to other chart timeframes.
This ensures consistency and removes any ambiguity before entering a trade.
________________________________________
2. EMA Mode (Use Any Length You Like)
You’re free to choose any EMA lengths — the dashboard adapts to your strategy.
• Smaller EMAs (5–20):
React quickly and highlight short-term momentum changes or early trend shifts.
• Larger EMAs (50–200+):
Move more slowly and provide a smoother read of overall trend structure, filtering out low-timeframe noise.
This flexibility lets you tune the dashboard to your preferred approach — whether you want fast tactical signals or slower, more stable directional structure.
________________________________________
3. Cross & Bias Modes
The dashboard supports two core engines:
✔ Single EMA Mode (Price vs EMA + ATR Neutral Buffer)
A trend-following model that avoids false signals when price is close to the EMA.
✔ Dual EMA Cross Mode (Fast vs Slow EMA)
A crossover-based trend engine ideal for traders who prefer structure shifts based on EMA alignment.
You can switch modes instantly from the settings.
________________________________________
4. Bias (Plain-English Trend Assessment)
The bias row at the bottom shows the overall directional bias for the blue timeframe, calculated using weighted multi-timeframe logic:
• Strong Bull
• Bullish
• Neutral
• Bearish
• Strong Bear
This provides instant clarity on whether market conditions support (or conflict with) your trade idea.
________________________________________
5. Trend Table (Heatmap View)
Each timeframe shows:
• ▲ Bullish
• ▼ Bearish
• – Neutral
Colour coded for clarity:
• Green = bullish
• Red = bearish
• Grey = neutral
• Blue = execution timeframe highlight
This creates a clean, at-a-glance trend heatmap.
________________________________________
⚙️ Customisation Options
• Fully adjustable EMA lengths
• Single EMA mode (with ATR neutral zone)
• Dual EMA Cross mode (fast/slow)
• Selectable text colour (dark/light theme friendly)
• Execution timeframe mode: Chart or Locked
• Compact and visually clear table layout
________________________________________
✔ Why This Tool Helps
This dashboard gives traders a structured, rule-aligned view of trend direction by:
• Keeping you aligned with broader multi-timeframe structure
• Reducing counter-trend mistakes
• Clarifying trend shifts and momentum changes
• Making decision-making faster and more consistent
• Supporting any systematic or rule-based trading plan
It is a decision-support tool, not a buy/sell signal — making it useful for all trading styles.
________________________________________
📌 Notes for Users
• Non-repainting (uses confirmed closes)
• Works universally: Forex, crypto, indices, commodities
• Suitable for scalpers, day-traders, swing traders
________________________________________
💬 Feedback & Future Enhancements
If you’d like to see additional timeframes, alternative trend engines, an ultra-compact mode, or alert integrations, feel free to request upgrades.

Moving Averages DTMoving Averages Combo: SMA 30-50-100-200 + EMA 5-8-21 (Golden & Death Cross Ready)
This clean and lightweight indicator plots the most used simple and exponential moving averages in one single script — perfect for swing traders, position traders, and scalpers.
— Simple Moving Averages (Daily timeframe focus):
• SMA 30 (Red) — Early trend detection
• SMA 50 (Blue) — Classic medium-term trend
• SMA 100 (Green) — Institutional reference
• SMA 200 (Orange) — The legendary Golden/Death Cross line
— Fast Exponential Moving Averages (Perfect for pullbacks & entries):
• EMA 5 (Purple) — Ultra-fast reaction
• EMA 8 (Yellow) — Fibonacci-based favorite
• EMA 21 (Black) — 21-day cycle + Fibonacci
Why this combination works so well:
• EMA 8 + EMA 21 = Powerful short-term trend filter (used by thousands of crypto & forex traders)
• SMA 50/200 = Classic Golden & Death Cross signals
• SMA 30/100 = Extra confirmation layers used by banks and funds
Features:
✓ All MAs on a single indicator (no chart clutter)
✓ Clean colors with perfect contrast on light/dark themes
✓ Ready for alerts: set alert on EMA 8 crossing EMA 21 or SMA 50 crossing SMA 200
✓ Works on all markets & timeframes (stocks, forex, crypto, futures)
How to use:
• Bullish signal: Price above SMA 200 + EMA 8 > EMA 21 + SMA 50 > SMA 200
• Bearish signal: Price below SMA 200 + EMA 8 < EMA 21
• Pullback entries: Wait for price to touch EMA 21 in uptrend
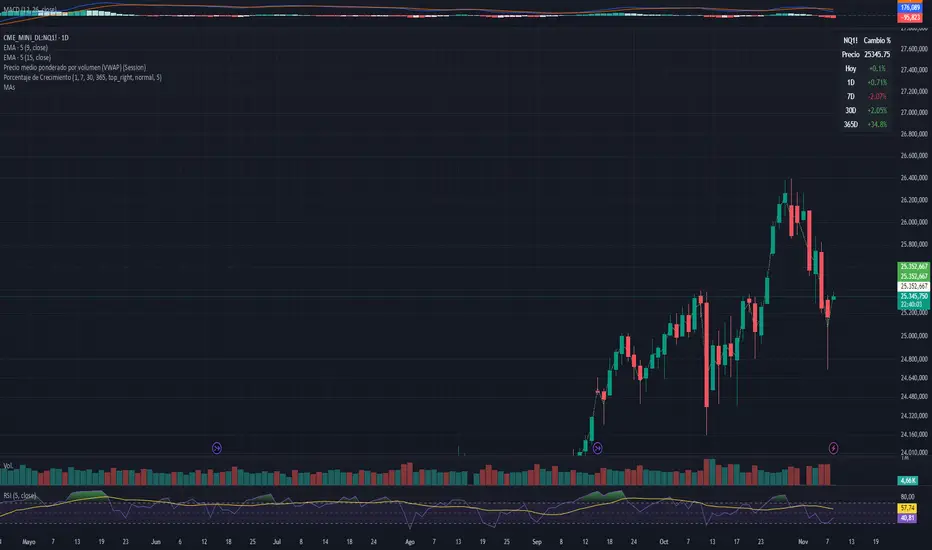
Volume Exponential Moving Averages (EMA)
Description:
This script is a simple script that plots a desired exponential moving average of buy and sell volume as a line chart with a tunable smoothing factor. There is a highlight on the plot area of either green or red to denote if the EMA of buy volume or sell volume is of a higher value. This indicator uses basic math of exponential averages and calculates volume using the formulas: "buy volume" = the product of total volume and the "closing price" minus the "low price" divided by "high price" minus the "low price" for a specific candle. Conversely, "sell volume" = the product of "total volume" and the "high price" minus the "close price" divided by "high price" minus the "low price" for a specific candle.
Utility:
This indicator is an effective way to gauge the acceleration/ deceleration of buyers and sellers in the market and can be used in combination with market structure and important levels to understand if buyers or sellers are taking over at any given time.
How to use this indicator:
There are two settings for this indicator:
1. The Length of the EMA: The length of the EMA can be adjusted based on your preference for a running number of candles' data. If you are interested to know short term changes in volume (e.g. over the past few candles at a major level) you can adjust this setting lower (~3-9 length). Conversely, if you are interested in volume trends over a greater number of candles you can increase this to your liking.
Personal preference : Because I am a short term daytrader/ scalper, I keep this setting at 6 length to see immediate changes in the acceleration or deceleration of buyers/ sellers.
2. The Smoothing Factor: The smoothing factor can be adjusted to further tune the size of trend you are interested in with 1 = No smoothing of the EMA line. Smoothing of the EMA line increases as the value for smoothing increases, resulting in a less volatile, more smooth EMA line. However, the more smooth the line, the less sensitive the EMA will be to immediate changes in volume pace. The less smoothing factor is applied, the more volatile data will be, resulting in quicker observation of shorter term trends. Again the same rules apply as the EMA length as these are similar in function: If you are interested to know short term changes in volume (e.g. over the past few candles at a major level) you can adjust this setting lower (~2-6). Conversely, if you are interested in volume trends over a greater number of candles you can increase this to your liking.
Personal preference : Because I am a short term daytrader/ scalper, I keep this setting at 2-4 smoothing factor to see immediate changes in the acceleration or deceleration of buyers/ sellers.
You should, of course, play with these settings to your exact preferences based on your trading style.
Tips for using this indicator:
General Use:
When the buy volume EMA is moving up, buyers are increasing the pace of buying and when the buy volume EMA is moving down, buyers are decreasing the pace of buying. Conversely, when the sell volume EMA is moving up, sellers are increasing the pace of selling and when the sell volume EMA is moving down, sellers are decreasing the pace of selling. The overall movement of the stock is relative to the combination of these rates. e.g. If both buyers and sellers are increasing at the same rate (EMAs slopes are roughly equal) there will be not a large change in price. If the slope of the buy volume EMA is greater than the slope of sell volume EMA, the price should move up. Conversely, if the slope of the sell volume EMA is greater than the slope of buy volume EMA, the price should move down.
Predicting pullbacks, reversals, and continuations:
This indicator allows you to see if buyers or sellers are increasing their pace, even if the stock price is in consolidation. This allows you to predict if out of the consolidation buyers or sellers are likely to win based on the momentum of the volume in consolidation. e.g. If price is in consolidation after an uptrend and the buy volume EMA starts to decrease, this could be a sign that buyers are running out of steam at this price level. Another example, If at a major support the buy volume EMA begins to trend up then buyers are accelerating the pace of buying at this level.
EMA crosses: There is something to be said about the point at which the buy volume EMA and sell volume EMA cross. This signifies that at this moment there is a shift in which the acceleration of one party outpaces that of the other and can result in increased speed of the movement of the stock price.
Considerations
Because volume changes constantly, this indicator is best to identify short term changes in volume that could impact price movements. It is not guaranteed to continue just because buyers or sellers have had a change in pace. Therefore it is advised to use this indicator in combination with significant price levels such as pivot points, or price levels from volume profile tools to identify the price zones where significant volume changes are likely to impact price movements. It is also advised to continue to monitor the changes in pace in buyers and sellers using this volume EMA indicator to determine if a change in pace is short lived or if it will continue for a longer duration.
Examples of use:
Bullish Reversal:
Bearish Continuation:
Bearish EMA Crossover: (Settings: Length 6, Smoothing factor 3)
Bullish EMA Crossover: (Settings: Length 6, Smoothing factor 4)
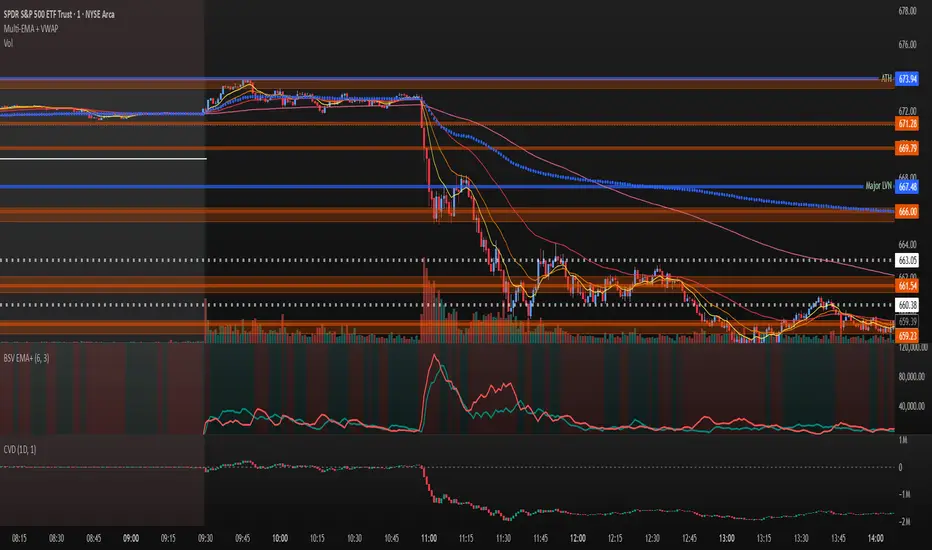
Keltner Channel Enhanced [DCAUT]█ Keltner Channel Enhanced
📊 ORIGINALITY & INNOVATION
The Keltner Channel Enhanced represents an important advancement over standard Keltner Channel implementations by introducing dual flexibility in moving average selection for both the middle band and ATR calculation. While traditional Keltner Channels typically use EMA for the middle band and RMA (Wilder's smoothing) for ATR, this enhanced version provides access to 25+ moving average algorithms for both components, enabling traders to fine-tune the indicator's behavior to match specific market characteristics and trading approaches.
Key Advancements:
Dual MA Algorithm Flexibility: Independent selection of moving average types for middle band (25+ options) and ATR smoothing (25+ options), allowing optimization of both trend identification and volatility measurement separately
Enhanced Trend Sensitivity: Ability to use faster algorithms (HMA, T3) for middle band while maintaining stable volatility measurement with traditional ATR smoothing, or vice versa for different trading strategies
Adaptive Volatility Measurement: Choice of ATR smoothing algorithm affects channel responsiveness to volatility changes, from highly reactive (SMA, EMA) to smoothly adaptive (RMA, TEMA)
Comprehensive Alert System: Five distinct alert conditions covering breakouts, trend changes, and volatility expansion, enabling automated monitoring without constant chart observation
Multi-Timeframe Compatibility: Works effectively across all timeframes from intraday scalping to long-term position trading, with independent optimization of trend and volatility components
This implementation addresses key limitations of standard Keltner Channels: fixed EMA/RMA combination may not suit all market conditions or trading styles. By decoupling the trend component from volatility measurement and allowing independent algorithm selection, traders can create highly customized configurations for specific instruments and market phases.
📐 MATHEMATICAL FOUNDATION
Keltner Channel Enhanced uses a three-component calculation system that combines a flexible moving average middle band with ATR-based (Average True Range) upper and lower channels, creating volatility-adjusted trend-following bands.
Core Calculation Process:
1. Middle Band (Basis) Calculation:
The basis line is calculated using the selected moving average algorithm applied to the price source over the specified period:
basis = ma(source, length, maType)
Supported algorithms include EMA (standard choice, trend-biased), SMA (balanced and symmetric), HMA (reduced lag), WMA, VWMA, TEMA, T3, KAMA, and 17+ others.
2. Average True Range (ATR) Calculation:
ATR measures market volatility by calculating the average of true ranges over the specified period:
trueRange = max(high - low, abs(high - close ), abs(low - close ))
atrValue = ma(trueRange, atrLength, atrMaType)
ATR smoothing algorithm significantly affects channel behavior, with options including RMA (standard, very smooth), SMA (moderate smoothness), EMA (fast adaptation), TEMA (smooth yet responsive), and others.
3. Channel Calculation:
Upper and lower channels are positioned at specified multiples of ATR from the basis:
upperChannel = basis + (multiplier × atrValue)
lowerChannel = basis - (multiplier × atrValue)
Standard multiplier is 2.0, providing channels that dynamically adjust width based on market volatility.
Keltner Channel vs. Bollinger Bands - Key Differences:
While both indicators create volatility-based channels, they use fundamentally different volatility measures:
Keltner Channel (ATR-based):
Uses Average True Range to measure actual price movement volatility
Incorporates gaps and limit moves through true range calculation
More stable in trending markets, less prone to extreme compression
Better reflects intraday volatility and trading range
Typically fewer band touches, making touches more significant
More suitable for trend-following strategies
Bollinger Bands (Standard Deviation-based):
Uses statistical standard deviation to measure price dispersion
Based on closing prices only, doesn't account for intraday range
Can compress significantly during consolidation (squeeze patterns)
More touches in ranging markets
Better suited for mean-reversion strategies
Provides statistical probability framework (95% within 2 standard deviations)
Algorithm Combination Effects:
The interaction between middle band MA type and ATR MA type creates different indicator characteristics:
Trend-Focused Configuration (Fast MA + Slow ATR): Middle band uses HMA/EMA/T3, ATR uses RMA/TEMA, quick trend changes with stable channel width, suitable for trend-following
Volatility-Focused Configuration (Slow MA + Fast ATR): Middle band uses SMA/WMA, ATR uses EMA/SMA, stable trend with dynamic channel width, suitable for volatility trading
Balanced Configuration (Standard EMA/RMA): Classic Keltner Channel behavior, time-tested combination, suitable for general-purpose trend following
Adaptive Configuration (KAMA + KAMA): Self-adjusting indicator responding to efficiency ratio, suitable for markets with varying trend strength and volatility regimes
📊 COMPREHENSIVE SIGNAL ANALYSIS
Keltner Channel Enhanced provides multiple signal categories optimized for trend-following and breakout strategies.
Channel Position Signals:
Upper Channel Interaction:
Price Touching Upper Channel: Strong bullish momentum, price moving more than typical volatility range suggests, potential continuation signal in established uptrends
Price Breaking Above Upper Channel: Exceptional strength, price exceeding normal volatility expectations, consider adding to long positions or tightening trailing stops
Price Riding Upper Channel: Sustained strong uptrend, characteristic of powerful bull moves, stay with trend and avoid premature profit-taking
Price Rejection at Upper Channel: Momentum exhaustion signal, consider profit-taking on longs or waiting for pullback to middle band for reentry
Lower Channel Interaction:
Price Touching Lower Channel: Strong bearish momentum, price moving more than typical volatility range suggests, potential continuation signal in established downtrends
Price Breaking Below Lower Channel: Exceptional weakness, price exceeding normal volatility expectations, consider adding to short positions or protecting against further downside
Price Riding Lower Channel: Sustained strong downtrend, characteristic of powerful bear moves, stay with trend and avoid premature covering
Price Rejection at Lower Channel: Momentum exhaustion signal, consider covering shorts or waiting for bounce to middle band for reentry
Middle Band (Basis) Signals:
Trend Direction Confirmation:
Price Above Basis: Bullish trend bias, middle band acts as dynamic support in uptrends, consider long positions or holding existing longs
Price Below Basis: Bearish trend bias, middle band acts as dynamic resistance in downtrends, consider short positions or avoiding longs
Price Crossing Above Basis: Potential trend change from bearish to bullish, early signal to establish long positions
Price Crossing Below Basis: Potential trend change from bullish to bearish, early signal to establish short positions or exit longs
Pullback Trading Strategy:
Uptrend Pullback: Price pulls back from upper channel to middle band, finds support, and resumes upward, ideal long entry point
Downtrend Bounce: Price bounces from lower channel to middle band, meets resistance, and resumes downward, ideal short entry point
Basis Test: Strong trends often show price respecting the middle band as support/resistance on pullbacks
Failed Test: Price breaking through middle band against trend direction signals potential reversal
Volatility-Based Signals:
Narrow Channels (Low Volatility):
Consolidation Phase: Channels contract during periods of reduced volatility and directionless price action
Breakout Preparation: Narrow channels often precede significant directional moves as volatility cycles
Trading Approach: Reduce position sizes, wait for breakout confirmation, avoid range-bound strategies within channels
Breakout Direction: Monitor for price breaking decisively outside channel range with expanding width
Wide Channels (High Volatility):
Trending Phase: Channels expand during strong directional moves and increased volatility
Momentum Confirmation: Wide channels confirm genuine trend with substantial volatility backing
Trading Approach: Trend-following strategies excel, wider stops necessary, mean-reversion strategies risky
Exhaustion Signs: Extreme channel width (historical highs) may signal approaching consolidation or reversal
Advanced Pattern Recognition:
Channel Walking Pattern:
Upper Channel Walk: Price consistently touches or exceeds upper channel while staying above basis, very strong uptrend signal, hold longs aggressively
Lower Channel Walk: Price consistently touches or exceeds lower channel while staying below basis, very strong downtrend signal, hold shorts aggressively
Basis Support/Resistance: During channel walks, price typically uses middle band as support/resistance on minor pullbacks
Pattern Break: Price crossing basis during channel walk signals potential trend exhaustion
Squeeze and Release Pattern:
Squeeze Phase: Channels narrow significantly, price consolidates near middle band, volatility contracts
Direction Clues: Watch for price positioning relative to basis during squeeze (above = bullish bias, below = bearish bias)
Release Trigger: Price breaking outside narrow channel range with expanding width confirms breakout
Follow-Through: Measure squeeze height and project from breakout point for initial profit targets
Channel Expansion Pattern:
Breakout Confirmation: Rapid channel widening confirms volatility increase and genuine trend establishment
Entry Timing: Enter positions early in expansion phase before trend becomes overextended
Risk Management: Use channel width to size stops appropriately, wider channels require wider stops
Basis Bounce Pattern:
Clean Bounce: Price touches middle band and immediately reverses, confirms trend strength and entry opportunity
Multiple Bounces: Repeated basis bounces indicate strong, sustainable trend
Bounce Failure: Price penetrating basis signals weakening trend and potential reversal
Divergence Analysis:
Price/Channel Divergence: Price makes new high/low while staying within channel (not reaching outer band), suggests momentum weakening
Width/Price Divergence: Price breaks to new extremes but channel width contracts, suggests move lacks conviction
Reversal Signal: Divergences often precede trend reversals or significant consolidation periods
Multi-Timeframe Analysis:
Keltner Channels work particularly well in multi-timeframe trend-following approaches:
Three-Timeframe Alignment:
Higher Timeframe (Weekly/Daily): Identify major trend direction, note price position relative to basis and channels
Intermediate Timeframe (Daily/4H): Identify pullback opportunities within higher timeframe trend
Lower Timeframe (4H/1H): Time precise entries when price touches middle band or lower channel (in uptrends) with rejection
Optimal Entry Conditions:
Best Long Entries: Higher timeframe in uptrend (price above basis), intermediate timeframe pulls back to basis, lower timeframe shows rejection at middle band or lower channel
Best Short Entries: Higher timeframe in downtrend (price below basis), intermediate timeframe bounces to basis, lower timeframe shows rejection at middle band or upper channel
Risk Management: Use higher timeframe channel width to set position sizing, stops below/above higher timeframe channels
🎯 STRATEGIC APPLICATIONS
Keltner Channel Enhanced excels in trend-following and breakout strategies across different market conditions.
Trend Following Strategy:
Setup Requirements:
Identify established trend with price consistently on one side of basis line
Wait for pullback to middle band (basis) or brief penetration through it
Confirm trend resumption with price rejection at basis and move back toward outer channel
Enter in trend direction with stop beyond basis line
Entry Rules:
Uptrend Entry:
Price pulls back from upper channel to middle band, shows support at basis (bullish candlestick, momentum divergence)
Enter long on rejection/bounce from basis with stop 1-2 ATR below basis
Aggressive: Enter on first touch; Conservative: Wait for confirmation candle
Downtrend Entry:
Price bounces from lower channel to middle band, shows resistance at basis (bearish candlestick, momentum divergence)
Enter short on rejection/reversal from basis with stop 1-2 ATR above basis
Aggressive: Enter on first touch; Conservative: Wait for confirmation candle
Trend Management:
Trailing Stop: Use basis line as dynamic trailing stop, exit if price closes beyond basis against position
Profit Taking: Take partial profits at opposite channel, move stops to basis
Position Additions: Add to winners on subsequent basis bounces if trend intact
Breakout Strategy:
Setup Requirements:
Identify consolidation period with contracting channel width
Monitor price action near middle band with reduced volatility
Wait for decisive breakout beyond channel range with expanding width
Enter in breakout direction after confirmation
Breakout Confirmation:
Price breaks clearly outside channel (upper for longs, lower for shorts), channel width begins expanding from contracted state
Volume increases significantly on breakout (if using volume analysis)
Price sustains outside channel for multiple bars without immediate reversal
Entry Approaches:
Aggressive: Enter on initial break with stop at opposite channel or basis, use smaller position size
Conservative: Wait for pullback to broken channel level, enter on rejection and resumption, tighter stop
Volatility-Based Position Sizing:
Adjust position sizing based on channel width (ATR-based volatility):
Wide Channels (High ATR): Reduce position size as stops must be wider, calculate position size using ATR-based risk calculation: Risk / (Stop Distance in ATR × ATR Value)
Narrow Channels (Low ATR): Increase position size as stops can be tighter, be cautious of impending volatility expansion
ATR-Based Risk Management: Use ATR-based risk calculations, position size = 0.01 × Capital / (2 × ATR), use multiples of ATR (1-2 ATR) for adaptive stops
Algorithm Selection Guidelines:
Different market conditions benefit from different algorithm combinations:
Strong Trending Markets: Middle band use EMA or HMA, ATR use RMA, capture trends quickly while maintaining stable channel width
Choppy/Ranging Markets: Middle band use SMA or WMA, ATR use SMA or WMA, avoid false trend signals while identifying genuine reversals
Volatile Markets: Middle band and ATR both use KAMA or FRAMA, self-adjusting to changing market conditions reduces manual optimization
Breakout Trading: Middle band use SMA, ATR use EMA or SMA, stable trend with dynamic channels highlights volatility expansion early
Scalping/Day Trading: Middle band use HMA or T3, ATR use EMA or TEMA, both components respond quickly
Position Trading: Middle band use EMA/TEMA/T3, ATR use RMA or TEMA, filter out noise for long-term trend-following
📋 DETAILED PARAMETER CONFIGURATION
Understanding and optimizing parameters is essential for adapting Keltner Channel Enhanced to specific trading approaches.
Source Parameter:
Close (Most Common): Uses closing price, reflects daily settlement, best for end-of-day analysis and position trading, standard choice
HL2 (Median Price): Smooths out closing bias, better represents full daily range in volatile markets, good for swing trading
HLC3 (Typical Price): Gives more weight to close while including full range, popular for intraday applications, slightly more responsive than HL2
OHLC4 (Average Price): Most comprehensive price representation, smoothest option, good for gap-prone markets or highly volatile instruments
Length Parameter:
Controls the lookback period for middle band (basis) calculation:
Short Periods (10-15): Very responsive to price changes, suitable for day trading and scalping, higher false signal rate
Standard Period (20 - Default): Represents approximately one month of trading, good balance between responsiveness and stability, suitable for swing and position trading
Medium Periods (30-50): Smoother trend identification, fewer false signals, better for position trading and longer holding periods
Long Periods (50+): Very smooth, identifies major trends only, minimal false signals but significant lag, suitable for long-term investment
Optimization by Timeframe: 1-15 minute charts use 10-20 period, 30-60 minute charts use 20-30 period, 4-hour to daily charts use 20-40 period, weekly charts use 20-30 weeks.
ATR Length Parameter:
Controls the lookback period for Average True Range calculation, affecting channel width:
Short ATR Periods (5-10): Very responsive to recent volatility changes, standard is 10 (Keltner's original specification), may be too reactive in whipsaw conditions
Standard ATR Period (10 - Default): Chester Keltner's original specification, good balance between responsiveness and stability, most widely used
Medium ATR Periods (14-20): Smoother channel width, ATR 14 aligns with Wilder's original ATR specification, good for position trading
Long ATR Periods (20+): Very smooth channel width, suitable for long-term trend-following
Length vs. ATR Length Relationship: Equal values (20/20) provide balanced responsiveness, longer ATR (20/14) gives more stable channel width, shorter ATR (20/10) is standard configuration, much shorter ATR (20/5) creates very dynamic channels.
Multiplier Parameter:
Controls channel width by setting ATR multiples:
Lower Values (1.0-1.5): Tighter channels with frequent price touches, more trading signals, higher false signal rate, better for range-bound and mean-reversion strategies
Standard Value (2.0 - Default): Chester Keltner's recommended setting, good balance between signal frequency and reliability, suitable for both trending and ranging strategies
Higher Values (2.5-3.0): Wider channels with less frequent touches, fewer but potentially higher-quality signals, better for strong trending markets
Market-Specific Optimization: High volatility markets (crypto, small-caps) use 2.5-3.0 multiplier, medium volatility markets (major forex, large-caps) use 2.0 multiplier, low volatility markets (bonds, utilities) use 1.5-2.0 multiplier.
MA Type Parameter (Middle Band):
Critical selection that determines trend identification characteristics:
EMA (Exponential Moving Average - Default): Standard Keltner Channel choice, Chester Keltner's original specification, emphasizes recent prices, faster response to trend changes, suitable for all timeframes
SMA (Simple Moving Average): Equal weighting of all data points, no directional bias, slower than EMA, better for ranging markets and mean-reversion
HMA (Hull Moving Average): Minimal lag with smooth output, excellent for fast trend identification, best for day trading and scalping
TEMA (Triple Exponential Moving Average): Advanced smoothing with reduced lag, responsive to trends while filtering noise, suitable for volatile markets
T3 (Tillson T3): Very smooth with minimal lag, excellent for established trend identification, suitable for position trading
KAMA (Kaufman Adaptive Moving Average): Automatically adjusts speed based on market efficiency, slow in ranging markets, fast in trends, suitable for markets with varying conditions
ATR MA Type Parameter:
Determines how Average True Range is smoothed, affecting channel width stability:
RMA (Wilder's Smoothing - Default): J. Welles Wilder's original ATR smoothing method, very smooth, slow to adapt to volatility changes, provides stable channel width
SMA (Simple Moving Average): Equal weighting, moderate smoothness, faster response to volatility changes than RMA, more dynamic channel width
EMA (Exponential Moving Average): Emphasizes recent volatility, quick adaptation to new volatility regimes, very responsive channel width changes
TEMA (Triple Exponential Moving Average): Smooth yet responsive, good balance for varying volatility, suitable for most trading styles
Parameter Combination Strategies:
Conservative Trend-Following: Length 30/ATR Length 20/Multiplier 2.5, MA Type EMA or TEMA/ATR MA Type RMA, smooth trend with stable wide channels, suitable for position trading
Standard Balanced Approach: Length 20/ATR Length 10/Multiplier 2.0, MA Type EMA/ATR MA Type RMA, classic Keltner Channel configuration, suitable for general purpose swing trading
Aggressive Day Trading: Length 10-15/ATR Length 5-7/Multiplier 1.5-2.0, MA Type HMA or EMA/ATR MA Type EMA or SMA, fast trend with dynamic channels, suitable for scalping and day trading
Breakout Specialist: Length 20-30/ATR Length 5-10/Multiplier 2.0, MA Type SMA or WMA/ATR MA Type EMA or SMA, stable trend with responsive channel width
Adaptive All-Conditions: Length 20/ATR Length 10/Multiplier 2.0, MA Type KAMA or FRAMA/ATR MA Type KAMA or TEMA, self-adjusting to market conditions
Offset Parameter:
Controls horizontal positioning of channels on chart. Positive values shift channels to the right (future) for visual projection, negative values shift left (past) for historical analysis, zero (default) aligns with current price bars for real-time signal analysis. Offset affects only visual display, not alert conditions or actual calculations.
📈 PERFORMANCE ANALYSIS & COMPETITIVE ADVANTAGES
Keltner Channel Enhanced provides improvements over standard implementations while maintaining proven effectiveness.
Response Characteristics:
Standard EMA/RMA Configuration: Moderate trend lag (approximately 0.4 × length periods), smooth and stable channel width from RMA smoothing, good balance for most market conditions
Fast HMA/EMA Configuration: Approximately 60% reduction in trend lag compared to EMA, responsive channel width from EMA ATR smoothing, suitable for quick trend changes and breakouts
Adaptive KAMA/KAMA Configuration: Variable lag based on market efficiency, automatic adjustment to trending vs. ranging conditions, self-optimizing behavior reduces manual intervention
Comparison with Traditional Keltner Channels:
Enhanced Version Advantages:
Dual Algorithm Flexibility: Independent MA selection for trend and volatility vs. fixed EMA/RMA, separate tuning of trend responsiveness and channel stability
Market Adaptation: Choose configurations optimized for specific instruments and conditions, customize for scalping, swing, or position trading preferences
Comprehensive Alerts: Enhanced alert system including channel expansion detection
Traditional Version Advantages:
Simplicity: Fewer parameters, easier to understand and implement
Standardization: Fixed EMA/RMA combination ensures consistency across users
Research Base: Decades of backtesting and research on standard configuration
When to Use Enhanced Version: Trading multiple instruments with different characteristics, switching between trending and ranging markets, employing different strategies, algorithm-based trading systems requiring customization, seeking optimization for specific trading style and timeframe.
When to Use Standard Version: Beginning traders learning Keltner Channel concepts, following published research or trading systems, preferring simplicity and standardization, wanting to avoid optimization and curve-fitting risks.
Performance Across Market Conditions:
Strong Trending Markets: EMA or HMA basis with RMA or TEMA ATR smoothing provides quicker trend identification, pullbacks to basis offer excellent entry opportunities
Choppy/Ranging Markets: SMA or WMA basis with RMA ATR smoothing and lower multipliers, channel bounce strategies work well, avoid false breakouts
Volatile Markets: KAMA or FRAMA with EMA or TEMA, adaptive algorithms excel by automatic adjustment, wider multipliers (2.5-3.0) accommodate large price swings
Low Volatility/Consolidation: Channels narrow significantly indicating consolidation, algorithm choice less impactful, focus on detecting channel width contraction for breakout preparation
Keltner Channel vs. Bollinger Bands - Usage Comparison:
Favor Keltner Channels When: Trend-following is primary strategy, trading volatile instruments with gaps, want ATR-based volatility measurement, prefer fewer higher-quality channel touches, seeking stable channel width during trends.
Favor Bollinger Bands When: Mean-reversion is primary strategy, trading instruments with limited gaps, want statistical framework based on standard deviation, need squeeze patterns for breakout identification, prefer more frequent trading opportunities.
Use Both Together: Bollinger Band squeeze + Keltner Channel breakout is powerful combination, price outside Bollinger Bands but inside Keltner Channels indicates moderate signal, price outside both indicates very strong signal, Bollinger Bands for entries and Keltner Channels for trend confirmation.
Limitations and Considerations:
General Limitations:
Lagging Indicator: All moving averages lag price, even with reduced-lag algorithms
Trend-Dependent: Works best in trending markets, less effective in choppy conditions
No Direction Prediction: Indicates volatility and deviation, not future direction, requires confirmation
Enhanced Version Specific Considerations:
Optimization Risk: More parameters increase risk of curve-fitting historical data
Complexity: Additional choices may overwhelm beginning traders
Backtesting Challenges: Different algorithms produce different historical results
Mitigation Strategies:
Use Confirmation: Combine with momentum indicators (RSI, MACD), volume, or price action
Test Parameter Robustness: Ensure parameters work across range of values, not just optimized ones
Multi-Timeframe Analysis: Confirm signals across different timeframes
Proper Risk Management: Use appropriate position sizing and stops
Start Simple: Begin with standard EMA/RMA before exploring alternatives
Optimal Usage Recommendations:
For Maximum Effectiveness:
Start with standard EMA/RMA configuration to understand classic behavior
Experiment with alternatives on demo account or paper trading
Match algorithm combination to market condition and trading style
Use channel width analysis to identify market phases
Combine with complementary indicators for confirmation
Implement strict risk management using ATR-based position sizing
Focus on high-quality setups rather than trading every signal
Respect the trend: trade with basis direction for higher probability
Complementary Indicators:
RSI or Stochastic: Confirm momentum at channel extremes
MACD: Confirm trend direction and momentum shifts
Volume: Validate breakouts and trend strength
ADX: Measure trend strength, avoid Keltner signals in weak trends
Support/Resistance: Combine with traditional levels for high-probability setups
Bollinger Bands: Use together for enhanced breakout and volatility analysis
USAGE NOTES
This indicator is designed for technical analysis and educational purposes. Keltner Channel Enhanced has limitations and should not be used as the sole basis for trading decisions. While the flexible moving average selection for both trend and volatility components provides valuable adaptability across different market conditions, algorithm performance varies with market conditions, and past characteristics do not guarantee future results.
Key considerations:
Always use multiple forms of analysis and confirmation before entering trades
Backtest any parameter combination thoroughly before live trading
Be aware that optimization can lead to curve-fitting if not done carefully
Start with standard EMA/RMA settings and adjust only when specific conditions warrant
Understand that no moving average algorithm can eliminate lag entirely
Consider market regime (trending, ranging, volatile) when selecting parameters
Use ATR-based position sizing and risk management on every trade
Keltner Channels work best in trending markets, less effective in choppy conditions
Respect the trend direction indicated by price position relative to basis line
The enhanced flexibility of dual algorithm selection provides powerful tools for adaptation but requires responsible use, thorough understanding of how different algorithms behave under various market conditions, and disciplined risk management.

ORB 15m + MAs (v4.1)Session ORB Live Pro — Pre-Market Boxes & MA Suite (v4.1)
What it is
A precision Opening Range Breakout (ORB) tool that anchors every session to one specific 15-minute candle—then projects that same high/low onto lower timeframes so your 1m/5m levels always match the source 15m bar. Perfect for scalpers who want session structure without drift.
What it draws
Asia, Pre-London, London, Pre-New York, New York session boxes.
On 15m: only the high/low of the first 15-minute bar of each window (optionally persists for extra bars).
On 5m: mirrors the same 15m range, visible up to 10 bars.
On 1m: mirrors the same 15m range, visible up to 15 bars.
Levels update live while the 15m candle is forming, then lock.
Fully editable windows (easy UX)
Change session times with TradingView’s native input.session fields using the familiar format HHMM-HHMM:1234567. You can tweak each window independently:
Asia
Pre-London
London
Pre-New York
New York
Multi-TF logic (no guesswork)
Designed to show only on 1m, 5m, 15m (by default).
15m = ground truth. Lower timeframes never “recalculate a different range”—they mirror the 15m bar for that session, exactly.
Alerts
Optional breakout alerts when price closes above/below the session range.
Clean visuals
Per-session color controls (box + lines). Boxes extend only for the configured number of bars per timeframe, keeping charts uncluttered.
Built-in MA suite
SMA 50 and RMA 200.
Three extra MAs (SMA/EMA/RMA/WMA/HMA) with selectable color, width, and style (line, stepline, circles).
Why traders like it
Consistency: Lower-TF ranges always match the 15m source bar.
Speed: You see structure immediately—no waiting for N bars.
Control: Edit session times directly; tune how long boxes stay on chart per TF.
Clarity: Minimal, purposeful plotting with alerts when it matters.
Quick start
Set your session times via the five input.session fields.
Choose how long boxes persist on 1m/5m/15m.
Enable alerts if you want instant breakout notifications.
(Optional) Configure the MA suite for trend/bias context.
Best for
Intraday traders and scalpers who rely on repeatable session behavior and demand exact cross-TF alignment of ORB levels.

Table Logic ExtractorTable Logic Extractor v2.0
Advanced multi-timeframe analysis with intelligent trade recommendations!
Overview:
This sophisticated indicator provides comprehensive market analysis through multiple technical indicators and timeframes. It combines EMA analysis, RSI momentum, MACD signals, Bollinger Bands, volume analysis, divergence detection, and intelligent trade recommendations with support/resistance distance calculations and trading style detection.
Key Features:
✅ Multi-Indicator Analysis - EMA, RSI, MACD, Bollinger Bands, Volume, ATR
✅ Multi-Timeframe Analysis - M1, M5, M15, M30 trend comparison
✅ Divergence Detection - Bullish and bearish divergence with strength calculation
✅ Support/Resistance Analysis - Distance calculations with Fibonacci levels
✅ Trading Style Detection - Trend, Range, Breakout, Scalping identification
✅ Intelligent Trade Signals - Style-based trade recommendations with confidence levels
✅ Risk Management - Stop Loss and Take Profit calculations
✅ Comprehensive Table - Real-time analysis with 14 different metrics
How It Works:
The indicator uses advanced analysis:
• Multi-Timeframe - M1, M5, M15, M30 trend analysis
• Style Detection - Automatic trading style identification
• S/R Analysis - Fibonacci-based support/resistance levels
• Weighted Scoring - EMA (2.0), RSI (1.5), MACD (1.5), BB (1.0), Volume (1.0)
• Intelligent Signals - Style-based trade recommendations
Trading Style Detection:
• TREND TRADING - Strong trend + aligned timeframes (Green)
• RANGE TRADING - Low volatility + sideways movement (Yellow)
• BREAKOUT TRADING - High volume + near levels (Orange)
• SCALPING - High volatility + quick moves (Red)
Information Table (14 Metrics):
Real-time display showing:
• ATR volatility with signal (HIGH/MED/LOW/NORMAL VOL)
• Divergence status with strength percentage
• S/R Distance with Fibonacci levels
• Stop Loss (2.0:1 ratio) and Take Profit 1 (1.5:1 ratio)
• Multi-Timeframe analysis (M1, M5, M15, M30)
• Scalping signals with confidence levels
• Current trend with strength percentage
• Intelligent trade recommendations
Trade Recommendations:
• TREND BUY/SELL - All timeframes aligned (High confidence)
• SHORT-TERM BUY/SELL - M5 signal only (Medium confidence)
• SCALPING BUY/SELL - M5 vs higher timeframes (Low confidence)
• WAIT - No clear signal (No confidence)
Support/Resistance Analysis:
• Fibonacci Levels: 23.6%, 38.2%, 50% retracements
• Distance Categories: Very Near (Red), Near (Orange), Medium (Yellow), Far (Green)
• ATR-based distance measurement
• Real-time proximity alerts
Scalping Detection:
Specialized signals based on:
• High volatility (ATR ratio > 1.5)
• Quick price moves (fast momentum)
• Volume confirmation (high volume spikes)
• RSI extremes (oversold/overbought)
Settings:
• EMA - Fast (9), Slow (21), Trend (50)
• RSI - Length (14), Overbought (70), Oversold (30)
• MACD - Fast (12), Slow (26), Signal (9)
• Bollinger Bands - Length (20), Multiplier (2.0)
• ATR - Length (14) for volatility measurement
• Volume Threshold - 1.5x average volume
• Divergence - Lookback (3), Threshold (0.5)
Best Practices:
🎯 Adapt strategy to detected trading style
📊 Use multi-timeframe analysis for confirmation
⚡ Monitor S/R distances for entry timing
🛡️ Always use calculated Stop Loss levels
🔍 Watch for divergence signals
📈 Follow intelligent trade recommendations
Pro Tips:
• Table provides all essential information in one place
• Trading style detection helps adapt your strategy
• S/R distance shows proximity to key levels
• Confidence levels indicate signal reliability
• Multi-timeframe alignment increases success rate
• Scalping signals work best in high volatility
Alerts:
• Trend Change Alert - "Trend changed across timeframes"
• Divergence Alert - "Divergence detected"
• Scalping Alert - "Scalping opportunity"
• Trade Signal Alert - "Trade recommendation available"
Version 2.0 Improvements:
• Advanced multi-timeframe analysis (M1, M5, M15, M30)
• Intelligent trading style detection
• Comprehensive support/resistance analysis
• Professional trade recommendations with confidence levels
• Scalping detection with specialized signals
• Risk management with calculated SL/TP levels
• 14-metric comprehensive information table
Created with ❤️ for the trading community
This indicator is free to use for both commercial and non-commercial purposes.

EMA Cross Suite (8/20/50/200) GOLDEN/DEATH by Carlos Chavez📜 Short Description (max 160 characters)
“Advanced EMA crossover system with FAST, MID, GOLDEN, and DEATH signals. Includes alerts, optimized visuals, and full customization.”
📄 Full Description (Paste in the box)
📌 Overview
The Embilletados • EMA Cross Suite is a professional trading indicator designed for intraday traders, scalpers, and swing traders.
It provides clear crossover signals using 4 EMAs combined with optimized visualization and built-in alerts to help you catch opportunities faster.
✨ Key Features:
🔹 4 configurable EMAs → 8, 20, 50, and 200.
🔹 Instant visual signals with colored labels:
FAST CROSS (8/20) → Quick momentum shifts.
MID CROSS (20/50) → Trend confirmation signals.
GOLDEN CROSS (50/200) → Strong bullish trend signals.
DEATH CROSS (50/200) → Strong bearish trend signals.
🔹 Built-in alerts → Get notified instantly for all crossover events.
🔹 Optimized visualization → Clean and easy-to-read interface.
🔹 Highly customizable → Enable/disable signals, labels, colors, and alerts according to your strategy.
📊 Recommended Timeframes:
10-minute charts → Best for intraday setups.
1-hour charts → Ideal for swing trading and trend confirmation.
🚀 How to Use:
Add the indicator to your chart.
Set up alerts for the desired crossovers: FAST, MID, GOLDEN, or DEATH.
Trade confidently using clear visual confirmations and real-time notifications.
🌟 Perfect for:
✅ Intraday traders
✅ Scalpers
✅ Swing traders
✅ Trend-following strategies
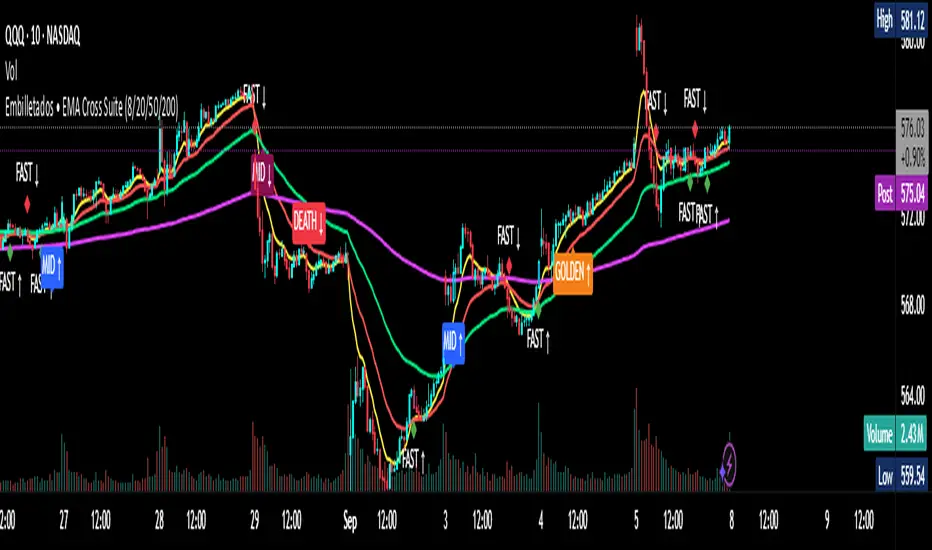
Camarilla Levels Pro Camarilla Levels Pro – Precision Intraday & Swing Trading Tool
Unlock the full potential of Camarilla Pivot Levels for identifying high-probability reversal zones, breakout triggers, and intraday bias shifts.
This indicator automatically calculates L1–L5 levels based on the Camarilla formula, updating daily for precise market adaptation. Whether you’re trading futures, forex, stocks, or crypto, you’ll instantly see:
Reversal Zones – Where price historically reacts and traps traders.
Breakout Zones – L4/L5 for bullish breakouts, L3/L2 for bearish reversals.
Bias Shifts – Quickly gauge if the market is leaning long or short.
Custom Alerts – Get notified when price touches or breaks your chosen level.
Features:
Auto-adjusting Camarilla levels for any symbol & timeframe
Color-coded zones for instant visual recognition
Optional mid-levels for scalpers
Fully customizable styling to match your chart setup
Ideal for:
Day traders wanting precision entry/exit zones
Swing traders watching key daily pivot breaks
Scalpers looking for high-probability reaction points
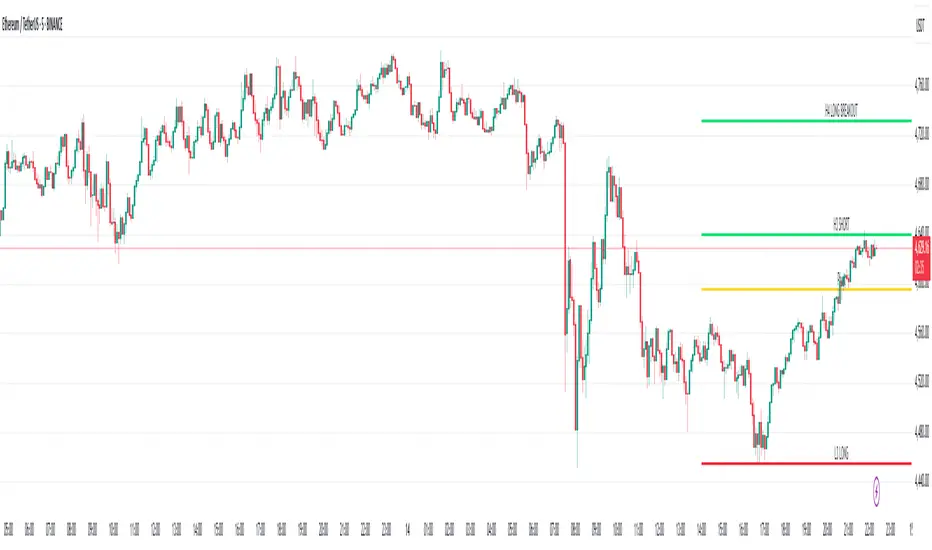
ai quant oculusAI QUANT OCULUS
Version 1.0 | Pine Script v6
Purpose & Innovation
AI QUANT OCULUS integrates four distinct technical concepts—exponential trend filtering, adaptive smoothing, momentum oscillation, and Gaussian smoothing—into a single, cohesive system that delivers clear, objective buy and sell signals along with automatically plotted stop-loss and three profit-target levels. This mash-up goes beyond a simple EMA crossover or standalone TRIX oscillator by requiring confluence across trend, adaptive moving averages, momentum direction, and smoothed price action, reducing false triggers and focusing on high‐probability turning points.
How It Works & Why Its Components Matter
Trend Filter: EMA vs. Adaptive MA
EMA (20) measures the prevailing trend with fixed sensitivity.
Adaptive MA (also EMA-based, length 10) approximates a faster-responding moving average, standing in for a KAMA-style filter.
Bullish bias requires AMA > EMA; bearish bias requires AMA < EMA. This ensures signals align with both the underlying trend and a more nimble view of recent price action.
Momentum Confirmation: TRIX
Calculates a triple-smoothed EMA of price over TRIX Length (15), then converts it to a percentage rate-of-change oscillator.
Positive TRIX reinforces bullish entries; negative TRIX reinforces bearish entries. Using TRIX helps filter whipsaws by focusing on sustained momentum shifts.
Gaussian Price Smoother
Applies two back-to-back 5-period EMAs to the price (“gaussian” smoothing) to remove short-term noise.
Price above the smoothed line confirms strength for longs; below confirms weakness for shorts. This layer avoids entries on erratic spikes.
Confluence Signals
Buy Signal (isBull) fires only when:
AMA > EMA (trend alignment)
TRIX > 0 (momentum support)
Close > Gaussian (price strength)
Sell Signal (isBear) fires under the inverse conditions.
Requiring all three conditions simultaneously sharply reduces false triggers common to single-indicator systems.
Automatic Risk & Reward Plotting
On each new buy or sell signal (edge detection via not isBull or not isBear ), the script:
Stores entryPrice at the signal bar’s close.
Draws a stop-loss line at entry minus ATR(14) × Stop Multiplier (1.5) by default.
Plots three profit-target lines at entry plus ATR × Target Multiplier (1×, 1.5×, and 2×).
All previous labels and lines are deleted on each new signal, keeping the chart uncluttered and focusing only on the current trade.
Inputs & Customization
Input Description Default
EMA Length Period for the main trend EMA 20
Adaptive MA Length Period for the faster adaptive EM A substitute 10
TRIX Length Period for the triple-smoothed momentum oscillator 15
Dominant Cycle Length (Reserved) 40
Stop Multiplier ATR multiple for stop-loss distance 1.5
Target Multiplier ATR multiple for first profit target 1.5
Show Buy/Sell Signals Toggle on-chart labels for entry signals On
How to Use
Apply to Chart: Best on 15 m–1 h timeframes for swing entries or 5 m for agile scalps.
Wait for Full Confluence:
Look for the AMA to cross above/below the EMA and verify TRIX and Gaussian conditions on the same bar.
A bright “LONG” or “SHORT” label marks your entry.
Manage the Trade:
Place your stop where the red or green SL line appears.
Scale or exit at the three yellow TP1/TP2/TP3 lines, automatically drawn by volatility.
Repeat Cleanly: Each new signal clears prior annotations, ensuring you only track the active setup.
Why This Script Stands Out
Multi-Layer Confluence: Trend, momentum, and noise-reduction must all align, addressing the weaknesses of single-indicator strategies.
Automated Trade Management: No manual plotting—stop and target lines appear seamlessly with each signal.
Transparent & Customizable: All logic is open, adjustable, and clearly documented, allowing traders to tweak lengths and multipliers to suit different instruments.
Disclaimer
No indicator guarantees profit. Always backtest AI QUANT OCULUS extensively, combine its signals with your own analysis and risk controls, and practice sound money management before trading live.

Liquidity Zone IndicatorLiquidity Zone Indicator
This PineScript indicator for TradingView identifies liquidity zones in the market where significant trading activity occurs, based on volume spikes and price levels. It highlights areas where large orders may be filled, useful for day traders and scalpers.
Features:
Detects bullish and bearish liquidity zones using a lookback period (default: 50 bars) and volume threshold (default: 1.5x average volume).
Displays zones as shaded boxes or diamond markers above/below bars, customizable by color.
Option to extend zones until price breaks through, with dynamic transparency for better visualization.
Includes an alert for when a liquidity zone is hit.
Settings:
Liquidity Lookback: Number of bars to analyze for high/low price levels.
Volume Threshold: Multiplier for detecting volume spikes.
Display as Zone: Toggle between zone boxes or markers.
Extend Zone: Keep zones active until price crosses them.
Zone Color: Customize the color of zones or markers.
Ideal for traders looking to spot potential reversal or breakout areas driven by liquidity.

TRAPPER Volume Trigger + SMAs + Buy/Sell SplitThe TRAPPER TRIGGER is a precision-based volume spike indicator designed for intraday traders, scalpers, and swing traders who rely on key volume activity to anticipate sharp market movements. It operates on volume delta logic, detecting disproportionate buying or selling activity that signifies potential market reversals or breakouts.
How It Works:
Volume Spike Logic (Delta-Based)
The script calculates a dynamic volume threshold using a moving average of historical volume data.
It identifies a delta spike by comparing current volume against this threshold—when volume exceeds it significantly, it suggests abnormal activity.
If the candle closes higher than it opens (bullish), the script registers it as a Buy Spike ⚖️.
If the candle closes lower than it opens (bearish), it marks a Sell Spike 🏁.
These are not based on the candle’s body size but the volume differential (delta) between buy/sell pressure inferred from candle direction.
Trigger Labels
Only the most recent buy/sell spike is labeled for clarity, avoiding clutter.
Labels are color-coded to match the candle body (e.g., bright green for bullish, magenta for bearish).
Label style: ⚖️ for Buy Spikes, 🏁 for Sell Spikes.
SMA Suite (Fully Customizable):
Six SMAs: 5 (yellow), 10 (blue), 20 (green), 50 (orange), 100 (red), 200 (white).
Each can be toggled and customized in the script settings for visibility and styling.
Key Benefits
Clean, minimalistic charting — focuses only on high-probability events.
Provides delta-driven insights without requiring access to full L2 order book data.
Works across any timeframe — logic recalculates and resets zones per timeframe switch.
Designed for sniper-style entries—ideal for traders who prefer minimal noise and maximum signal clarity.
Easily extendable with SR zones, AVWAP, liquidity levels, or alerts if desired in future updates.
Who It’s For
Scalpers and intraday traders looking for clean triggers.
Swing traders wanting confirmation of institutional moves.
Volume profile enthusiasts who need a trigger alert system.
Developers who want a base volume framework to build more advanced tools on.
Disclaimer
This script is provided as-is and is intended for educational and informational purposes only. It does not constitute financial advice, investment recommendations, or a solicitation to buy or sell any security or asset.
All trading involves risk. Users should perform their own due diligence and consult with a qualified financial advisor before making any trading decisions. The author of this script assumes no liability for any losses or damages arising from the use or reliance on this tool.
By using this script, you acknowledge and agree that you are solely responsible for your own trading decisions and outcomes.
AsturRiskPanelIndicator Summary
ATR Engine
Length & Smoothing: Choose how many bars to use (default 14) and the smoothing method (RMA/SMA/EMA/WMA).
Median ATR: Computes a rolling median of ATR over a user-defined look-back (default 14) to derive a “scalp” target.
Scalp Target
Automatically set at ½ × median ATR, snapped to the nearest tick.
Optional rounding to whole points for simplicity.
Stop Calculation
ATR Multiplier: Scales current ATR by a user input (default 1.5) to produce your stop distance in points (and ticks when appropriate).
Distortion Handling: Switches between point-only and point + tick displays based on contract specifications.
Risk & Sizing
Risk % of account per trade (default 2 %).
Calculates dollar risk per contract and optimal contract count.
Displays all metrics (scalp, stop, risk/contract, max contracts, max risk, account size) in a customizable on-chart table.
ATR-Based Stop Placement Guidelines
Trade Context ATR Multiplier Notes
Tight Range Entry 1.0 × ATR High-conviction, precise entries. Expect more shake-outs.
Standard Trend Entry 1.5 × ATR Balanced for H2/L2, MTR, DT/DB entries.
Breakouts/Microchannels 2.0 × ATR Wide stops through chop—Brooks-style breathing room.
How to Use
Select ATR Settings
Pick an ATR length (e.g. 14) and smoothing (RMA for stability).
Adjust the median length if you want a faster/slower scalp line.
Align Multiplier with Your Setup
For tight-range entries, set ATR Multiplier ≈ 1.0.
For standard trend trades, leave at 1.5.
For breakout/pullback setups, increase to 2.0 or more.
Customize Risk Parameters
Enter your account size and desired risk % per trade (e.g. 2 %).
The table auto-calculates how many contracts you can take.
Read the On-Chart Table
Scalp shows your intraday target.
Stop gives Brooks-style stop distance in points (and ticks).
Risk/Contract is the dollar risk per contract.
Max Contracts tells you maximum position size.
Max Risk confirms total dollar exposure.
Visual Confirmation
Place your entry, then eyeball the scalp and stop levels against chart structure (e.g. swing highs/lows).
Adjust the ATR multiplier if market context shifts (e.g. volatility spikes).
By blending this sizing panel with contextual ATR multipliers, you’ll consistently give your trades the right amount of “breathing room” while keeping risk in check.

Higher Timeframe TrendMap [BigBeluga]🔵HTF TrendMap
A powerful visual overlay that brings higher timeframe market structure directly onto your intraday chart.
This tool maps directional bias, trend strength, and dynamic range boundaries from a user-selected HTF (like Daily or 4H), offering a real-time confluence layer for scalpers, day traders, and swing traders.
By plotting the evolving average (HL2), it acts as a volatility-weighted trend anchor, allowing you to align lower timeframe entries with higher timeframe intent.
Technical Overview:
At the close of each higher timeframe (HTF) candle, the indicator stores the high, low, and calculates the HL2 midpoint. These values are then referenced on the lower timeframe chart to plot trend direction and price boundaries.
🔵 KEY FEATURES
Maps the selected higher timeframe (HTF) (e.g., Daily) onto your current chart.
At the close of each HTF candle , it starts to calculate and store the highest, lowest, and average (HL2) price levels .
The average (HL2) value is treated as the HTF trend baseline —plotted in orange for uptrend , blue for downtrend .
Visual curve thickens and fades to show progress through the HTF period (stronger color = fresher data).
Horizontal dashed lines show HTF high and low levels that persist until the next period closes.
On every HTF close, two price labels are printed for the high and low levels.
Vertical separators visually mark the start of each HTF candle for easy structural recognition.
A real-time dashboard shows selected HTF, current trend direction (🢁/🢃), and updates dynamically.
🔵 HOW TO USE
Use the HTF average line as a bias filter —only long when the trend is up (orange), short when down (blue).
HTF high/low labels help identify key breakout or rejection zones .
Combine with intraday systems or reversal tools for multi-timeframe confluence setups .
Ideal for scalpers and swing traders who rely on HTF momentum shifts .
🔵 CONCLUSION
HTF TrendMap provides a clean, data-rich layer of higher timeframe context to any chart. With adaptive trend coloring, volatility mapping, and real-time data labeling, it enables traders to stay in sync with macro structure while executing on the micro.

Aviad SMC Flow🔹 Aviad SMC Flow – Smart Structure & Zones Indicator
A professional SMC-based indicator for identifying:
✅ BoS – Break of Structure
✅ CHoCH – Change of Character
✅ MSS – Market Structure Shift
✅ Automated Support & Resistance Zones
✅ Liquidity Grab and Reversal Points
✅ Market Structure with historical display
Optimized for 1H and lower timeframes.
Designed for real Smart Money Concepts (SMC) trading.
Perfect for intraday traders, swing traders, and scalpers.
RSI+ Crypto Smart Strategy by Ignotus ### **RSI+ Crypto Smart Strategy by Ignotus**
**Description:**
The **RSI+ Crypto Smart Strategy by Ignotus** is an advanced and visually enhanced version of the classic **Relative Strength Index (RSI)**, developed by the **Crypto Smart** community. This indicator is designed to provide traders with a clear and actionable view of market momentum, overbought/oversold conditions, and potential reversal points. With its sleek design, customizable settings, and intuitive visual signals, this tool is perfect for traders who want to align their strategies with the principles of the **Crypto Smart** methodology.
Whether you're a beginner or an experienced trader, this indicator simplifies technical analysis while offering powerful insights into market behavior. It combines traditional RSI calculations with advanced visual enhancements and natural language interpretations, making it easier than ever to interpret market conditions at a glance.
---
### **Key Features:**
1. **Enhanced RSI Visualization:**
- The RSI line dynamically changes color based on its position relative to the 50-level midpoint:
- **Green** for bullish momentum (RSI > 50).
- **Red** for bearish momentum (RSI < 50).
- Overbought (default: 70) and oversold (default: 30) levels are clearly marked with customizable colors and shaded clouds for better visibility.
2. **Customizable Settings:**
- Adjust the RSI period, overbought/oversold thresholds, and background transparency to match your trading style.
- Fine-tune pivot lookback ranges and other parameters to adapt the indicator to different timeframes and assets.
3. **Interactive Information Table:**
- A compact, easy-to-read table provides real-time data on the current RSI value, its direction (▲, ▼, →), and a natural language interpretation of market conditions.
- Choose from three text sizes (small, medium, large) to optimize readability.
4. **Natural Language Interpretations:**
- The indicator includes a detailed explanation of the RSI's current state in plain English:
- Momentum trends (bullish, bearish, or neutral).
- Overbought/oversold warnings with potential reversal alerts.
- Clear guidance on whether the market is trending or ranging.
5. **Visual Buy/Sell Signals:**
- Triangles (▲ for buy, ▼ for sell) highlight potential entry and exit points based on RSI crossovers and divergence patterns.
- Configurable alerts notify you in real-time when key signals are triggered.
6. **Improved Aesthetics:**
- Clean, modern design with customizable colors for lines, clouds, and backgrounds.
- Dynamic shading and transparency options enhance chart clarity without cluttering the workspace.
---
### **How to Use This Indicator:**
- **Overbought/Oversold Zones:** Use the RSI's overbought (above 70) and oversold (below 30) zones to identify potential reversal points. Look for confirmation from price action or other indicators before entering trades.
- **Momentum Analysis:** Monitor the RSI's position relative to the 50-level midpoint to gauge bullish or bearish momentum.
- **Trend Identification:** Combine the RSI's readings with price trends to confirm the strength and direction of the market.
- **Entry/Exit Signals:** Use the visual signals (triangles) to spot potential entry and exit points. These signals are particularly useful for swing traders and scalpers.
---
### **Why Choose RSI+ Crypto Smart Strategy?**
This indicator is more than just an RSI—it's a complete tool designed to streamline your trading process. By focusing on clarity, customization, and actionable insights, the **RSI+ Crypto Smart Strategy** empowers traders to make informed decisions quickly and confidently. Whether you're trading cryptocurrencies, stocks, or forex, this indicator adapts seamlessly to your needs.
---
### **Developed by Crypto Smart:**
The **RSI+ Crypto Smart Strategy by Ignotus** is part of the **Crypto Smart** ecosystem, a community-driven initiative aimed at providing innovative tools and strategies for traders worldwide. Our mission is to simplify technical analysis while maintaining the depth and precision required for successful trading.
If you find this indicator helpful, please leave a review and share it with fellow traders! Your feedback helps us continue developing cutting-edge tools for the trading community.
---
### **Disclaimer:**
This indicator is a technical analysis tool and should not be considered financial advice. Trading involves risk, and past performance is not indicative of future results. Always conduct your own research and consult with a financial advisor before making trading decisions. Use of this indicator is at your own risk.
