Recherche dans les scripts pour "scalping"

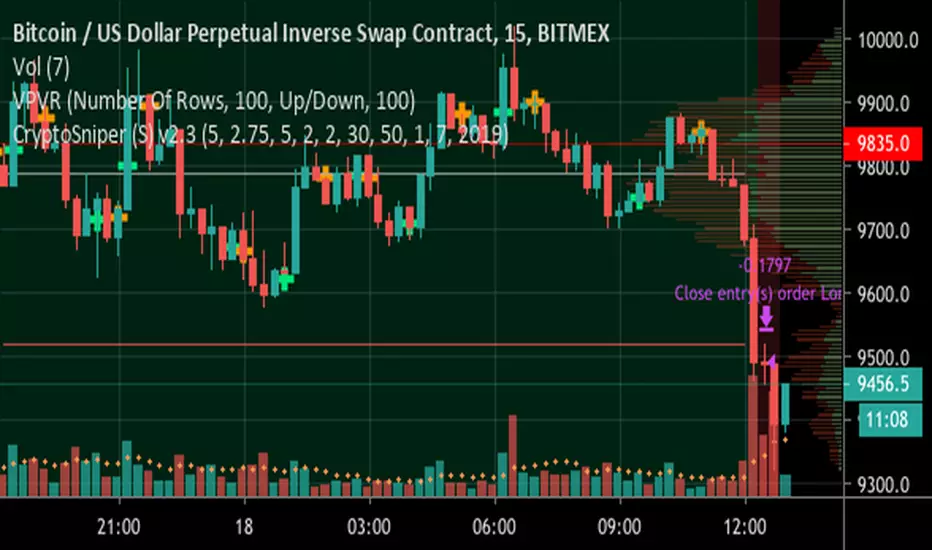
ck - CryptoSniper (Strategy) v2.1This strategy is radically different to the v1 script previously released.
It has ***NO REPAINTING*** - as such the algorithm had to change to remove it’s reliance on HMAs from future timeframes to establish trend, this is now accomplished with EMAs.
It is completely written in Pinescript v4.
It has integrated Stoploss and you can plot this & with the recommended Entry on the chart.
WARNING - This strategy has to be “tuned” to the instrument you are trading, for example, Bitcoin. The default settings work well for BTC/USD, XBT/USD on 15m chart timeframe but not for ETH/USD - it is possible the default settings will work with other crypto’s but I haven’t had time to test - if you find good settings PLEASE share them!
How to use:
1) Load up your favourite chart/instrument and select your favourite timeframe
2) Adjust the “signal” EMA and “baseline” EMA settings until you get the majority of uptrending moves highlighted with a green background and the majority of downtrending moves with a red background. The signal has to be faster (that is a lower number) than the baseline.
3) Adjust the “Sensitivity” - this will plot more green & orange Trigger points on the chart.
The strategy waits until in a trend, for example, a Long (green background) then waits for first green cross before opening a deal. It will Trigger a sell if the background turns red (downtrend) and a orange cross is printed.
4) Fine tuning:
A) Increase your profits by changing the Stoploss value - getting this right protects you from bad trades but also resets the indicator to provide another alert faster
B) You can increase the delay positions are opened or closed with the “Bar(s) offset to open position” and “Bar(s) offset to close position” settings. When you adjust these, 0 will buy/sell immediately when a Trigger cross is printed, 2 will wait until 2 bars/candles AFTER the Trigger cross prints to strat/close a position.
TIP: When adjusting indicator settings, load your chart and timeframe first.
Add the indicator/strategy (if you haven’t already).
Click the Strategy Tester tab at the bottom of the chart window so it is visible.
Open the strategy/indicator settings so you can see this wind AND the Strategy Tester display
Change a setting and click into a different setting input box, this will update the test results WITHOUT closing the settings window! This will save you a lot of time!
Write down any OK settings you find, you can come back later to fine tune them!
Please provide any feedback & let’s share the best settings for different crypto’s!

cryptodonmodeA scalping strategy based on a moving average channel. Only long positions when above the channel and only short positions when below. Works best on the really low timeframes like 3 minute.

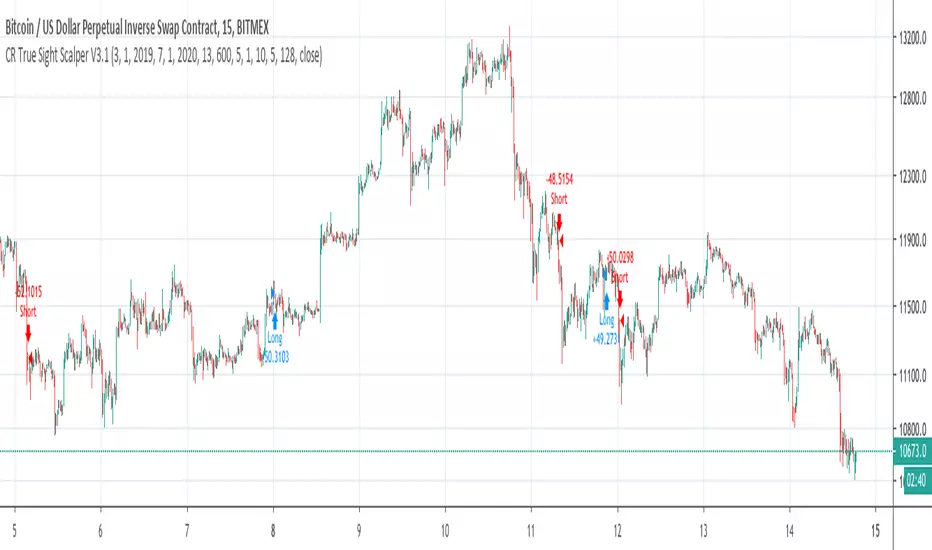
CR True Sight Scalper V3.1True Sight Scalper V3.1 is an incompatible update to V3.0, with much smaller losses.
$100,000 Initial capital.
From 2019-04-04 to 2019-07-14
CR True Sight Scalper V3.0At last, my True Sight Scalper V3.0 is here!
$100,000 Initial capital.
From 3/1/2019 to 7/3/2019.
For 2 weeks of free trial just DM me.


APEX - Swing Aura StrategyA backtester of my new strat, it's a hybrid swing/scalp strat that really looks for quick low profits. Will keep it hidden as it's a bit of a work in progress right now. Working on it to perform well enough with the Apex Trading bot, ran it for a day now and it ended the day on a 1.78% portfolio profit, so I'm really pleased with that.
As for details it's based on Keltner Channels, Bolingers Bands and a Ichimoku cloud. To spice it up there's even a Wave trend in there as well!
All the settings for the bits and parts are changeable so feel free to mess around with them, but will keep my sell triggers fixed for now, so no editing of those from within the script unfortunately.
Enjoy!

diamond_test_toolThis is a small test tool. The orders are close to random. The alg i used is nothing special.

Improved MACD by TumanStrategy for scalping in 5M and 15M timeframes..
Realized SL and trailing stops.
Each order 1% of the deposit

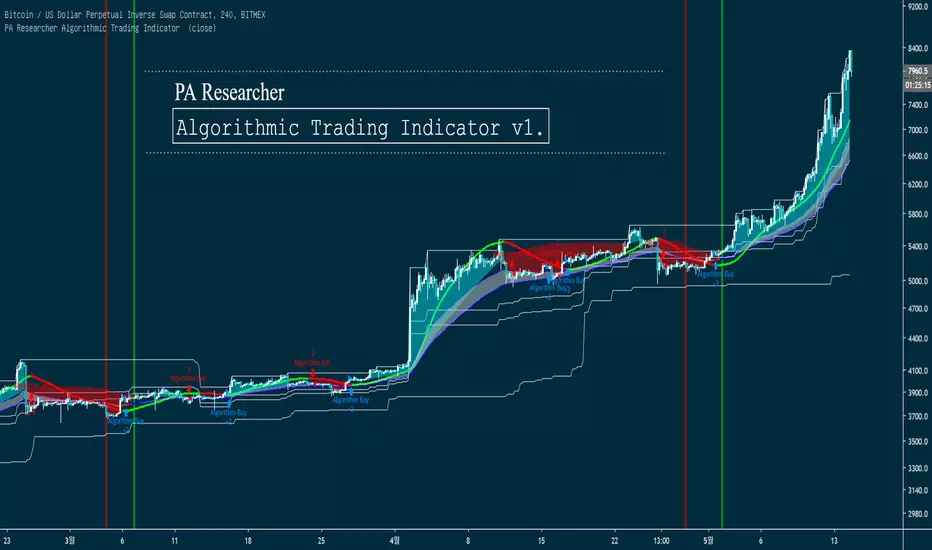
PA Researcher Algorithmic Trading Indicator PA Researcher Algorithmic Trading Indicator v1.
This Indicator is Algorithmic Trading Indicator.
Provide Best Buy/Sell Time & Good to check Long/Short term Trend For Swing/Scalping
Easy Trend Analysis for Beginner
Ability to Turn ON/OFF each Indicators
Ability to Change Colors
#This is not a Auto-Bot, This indicator Provide the Best Enter Time
-----------------------------------------------------------------------------------------------------------
PA Researcher Algorithmic Trading Indicator v1. 입니다.
자동화된 추세 분석을 통해 단/중/장기적인 추세 분석을 나타내주며,
알고리즘 값에 충족할 시 매수/매도 시그널이 나타납니다.
추세분석을 매우 쉽게 나타내며, 원웨이를 잡기에 매우 좋은 진입 시그널이 발생됩니다.
무엇보다, 추세변곡을 엄청나게 잘 잡아냅니다.
그 어떤것보다 시각적인 요소를 중요시 했기 때문에, 사용법을 잘 모르시는 분들도 쉽게 사용하실 수 있습니다.
Ex_)
Hit ratio example
적중률은 이 사진 한장으로 설명됩니다.
NEILUJ SCALPERIndicateur de scalping pour définir une tendance et tenter d'obtenir de meilleures entrées.
Bien sur le backtest a voir en utilisation réelle....
Test en cours avec la version alerte et deux bots sur Bitmex ETH ET XBT.

SMA Futures Scalper - Long / Short / Trailing StopSMA Futures Scalper - Long / Short / Trailing Stop
It generates long/short signals and apply trailing stop of 3pts and offset of 1pt. Also with 3 contracts per open/closing trades.
How does it look? Let me know in the comments

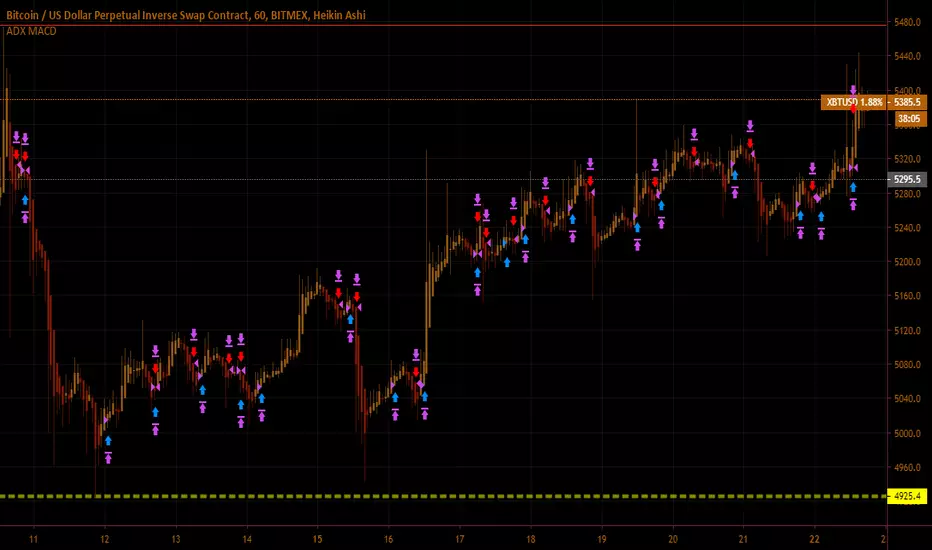
E-Z's Slither Maker Strategy v0.01This is a strategy I built based on custom MACD and ADX/DMI settings.
Works best for scalping the one hour.
If you run into any issues let me know.
If this script makes you money and feel thankful for all my hard work, you can donate to the addresses below <3
BTC: 3CS6VqDrCf7XRn46bqcXMUZQecbQJ7TKfs
BCC/BCH: bitcoincash:qqrca9z7w2gl2wevjvry6uv7quhcn7kaycx43r34tf
DOGE: AC9tZB6NMoWpvMZmmtop5yXsv7GhHYAxWd
LTC: 34HajDFE3aDWgs1etG3851CLvqNV9pg5Te

[astropark - Premium] 5m Bitmex ScalperThis strategy is private for bitmex scalping on 5m - 15m.
News soon.
Thanks
-- astropark --

MA cross strategyThis strategy uses simple moving average cross for entry signals, but it can be customized with 3 cases:
1- exit at take profit and stop loss;
2- exit when distance between close and moving average is above a user defined minimum;
3- use Renko candles to calculate the moving average without changing the graph candles.
The third case is the one with better results, but for non-pro users can be used only with daily time frame.
Look at profit factor and percent of winning trades.
You can test also on your favorite pair, but most important is setting correct brick size.
At request, I could share also a screener with alarms for finding which symbol statisfy entry rules.
Please use comment section for any feedback.
********************************** IMPORTANT*******************************
I have developed an expert advisor for metatrader4 (MT4): results of expert advisor form 2015-01-01 to today are very good with low drawdown and good profit.
********************************************************************************

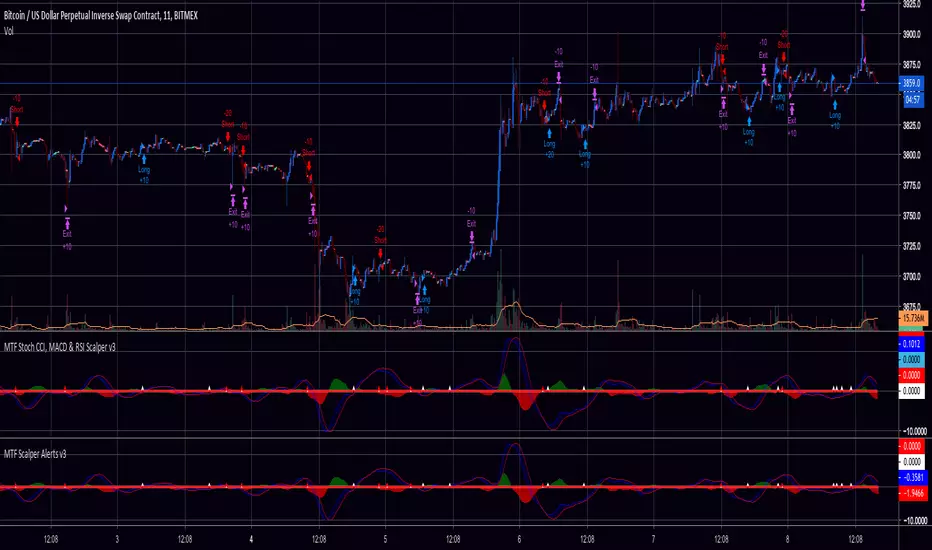
MTF Scalper for XBTUSDI've combined Stochastic CCI, MACD-DEMA and RSI on multiple timeframes to create this scalper for Bitmex XBTUSD
For personal use and friends only.
Fisher Transform Multi-Timeframe (Backtest)This is the Backtest Strategy for mortdiggiddy's "Fisher Transform Multi-Timeframe"
For more details check his study:

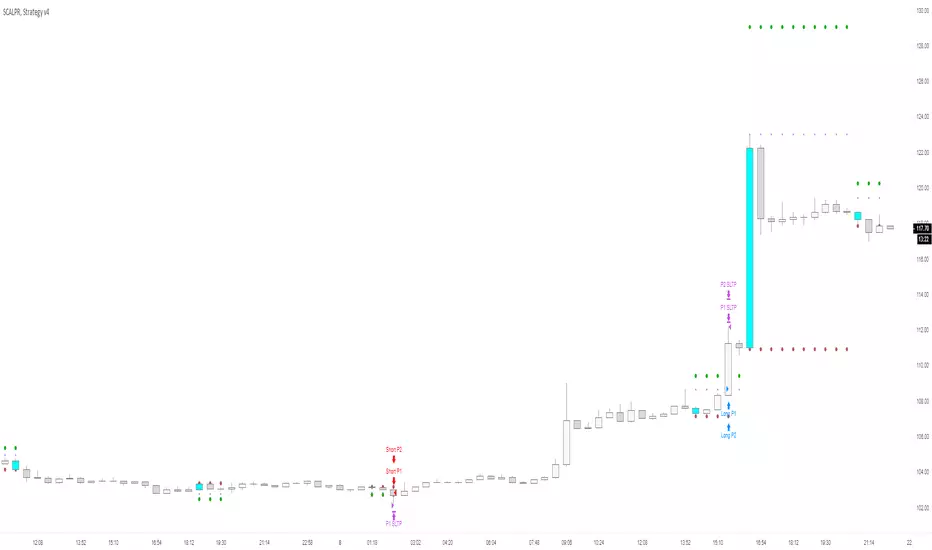
SCALPR, Strategy v41. Strategy for scalping based on the existing trend
2. Plots setup, entry, stoploss, and take profit zones
3. Customizable options to determine the "trend"
- Custom EMA/SMA crossovers
- Above/below key MAs
- Filter to also factor in data from the Ichimoku Cloud
4. Multiple Take Profit options
- In proportion to risk (.5R, 1R, etc.)
- Trailing stoploss x number of candles back
- Trailing stoploss using an EMA value of your choice
5. DOES NOT REPAINT
6. INVITE ONLY
Adaptive Zero Lag EMA v2This is my most successful strategy to date! Please enjoy and join the Open Source movement by sharing your code and ideas online!
OPERATING PRINCIPLE
The strategy is based on Ehlers idea that any indicator can be turned into a signal-producing trade system through smoothing and other filtering processes.
In fact, I'm using his Zero Lag EMA (ZLEMA) as a baseline indicator as well as some code snippets he has made public (1). God bless open source!
Next, I've provided the option to use an Instantaneous Frequency Measurement (IFM) method, which will adaptively choose the best period for the ZLEMA (2)
I've written other studies that use the differential calculus approximations for IFM, so it was only natural to include them in this strategy.
The primary two are Cosine IFM (3) and In-phase Quadrature IFM (4). You can also find an indicator with both plotted and the ability to average them together, as one IFM prefers long periods and the other short. (5)
BEFORE WE BEGIN
1. This strategy only runs on "normal" FX pairs (EURUSD, GBPJPY, AUDUSD ...) and will fail on Metals or Commodities.
Cryptos are largely untested.
2. Please run it on these time frames: M15 to D.
Anything outside this range will likely fail.
HOW TO USE AND SUCCEED
1. If the Default settings don't produce good results right off the bat, then lower gain limit to 1 or 2 and threshold to 0.01.
2. Test each setting under adaptive method . If you want to leave it Off , then I'd recommend using some kind of IFM (see my links below) to
discover the most efficient period to use.
3. Once you have the best adaptive method chosen, begin incrementing gain limit until you find a nice balance between profit factor (PF) and drawdown.
4. Now, begin incrementing threshold . The goal is to have PF above 2 and a drawdown as low as possible.
5. Finally, change the source ! Typically, close is the best option, but I have run into cases where high
yielded the highest returns and win rate.
6. Sit back, relax, and tweak the risk until you're happy with the return and drawdown amounts.
ADVANCED
You may need to adjust take profit (TP) points and stop loss (SL) points to create the best entry possible. Don't be greedy! You'll likely have poor
results if the TP is set to 300 and SL is 50.
If you are trading a pair that has a long Dominant Cycle Period , then you may increase Max Period to allow the IFM
to accept longer periods. Any period above the Max Period will be rejected. This may increase lag time!
Cheers and good luck trading!
-DasanC
PS - This code doesn't repaint or have future-leak, which was present in Pinescript v2.
PPS - Believe me! These returns are typical! Sometimes you must push aside the "if it's too good to be true..." mindset that society has ingrained in you.
Do you really believe the most successful pass up opportunities before investigating them? ;)
(1) Ehlers & Ric Zero Lag EMA
(2) Measuring Cycles by Ehlers
(3) Cosine IFM
(4) Inphase Quadrature IFM
(5) Averaging IFM

Powerfull strategy MACD+RSI+STOCH ATR stop best on Crude OilMy strategy uses a combination of three indicators MACD Stochastic RSI .
The Idea is to buy when ( MACD > Signal and RSI > 50 and Stochastic > 50) occures at the same time the BUY STop we place on previous day HIGH
and sell (short) when the opposite condition occurs we place SELL STOP on previous day LOW
We exit on Take profit or Stop loss which is calculated by ATR (10) or on the opposite signal "Volatility breakout"
This strategy works well on stocks, commodities and cryptos especially during market breaking up after consolidation
The best results are on Daily charts , so its NOT a scalping strategy. But it can work also on 1H charts.
The strategy does not have any stops and profit targets, so we can take all the market can give us at the moment.
The exit point only when MACD goes under Signal
Its Preformance is significantly better with "buy stop on High.1 and sell stop on Low.1" idea and exit on "volatility price breakout"
So, use it, trade it.
If it will help you to imprive your trading results, please donate me
BTC: 12kd1F8buWisUBdq27BBwRkUvzW7Ey3og

Trend Hunter [forex and binary]This is an amazing script for scalp trading.
It is basically self-explanatory. Just search, add to chart and start using as per the arrows.
Feel free to comment and ask anything
You can also use the binary options methods
DO NOT
dont enable forex together with direction. Only one of them should be turned on
Best Practice
enable one option at a time on the list
forex
binary
direction
