Hassi XAUUSD 15TF BUY/SELL (Anchored, Non-Repainting)What this does
Hassi XAUUSD 15TF BUY/SELL is a non-repainting signal indicator designed for XAUUSD (Gold) on the 15-minute timeframe (also works on BTCUSD). It blends EMA crossover + RSI + MACD with optional volume & volatility filters, and prints anchored BUY/SELL arrows that stay glued to their candle (no visual drifting on zoom/scale/replay). Optional confidence% labels help you judge signal quality at a glance.
Why it’s stable (no repaint)
Signals confirm only on bar close (barstate.isconfirmed).
Arrows/X marks are placed with label.new(x=bar_index, y=high/low, xloc.bar_index, yloc.abovebar/belowbar) so they remain exactly above/below the triggering candle.
No request.security for higher-TF lookaheads; no negative offsets.
How signals are generated
Core trigger: EMA(9) crosses EMA(21)
RSI filter (opt): RSI ≥ RSI Buy Min (default 50) for buys; ≤ RSI Sell Max (default 50) for sells
MACD filter (opt): MACD line crosses its signal or histogram sign matches direction
Volume/ATR filters (opt): require a basic volume spike and above-average ATR volatility (toggleable)
Divergence (opt): lightweight RSI divergence hints (diamond marks)
Anchored markers
BUY: triangle below the signal candle
SELL: triangle above the signal candle
EXIT (❌): small x above (long exit) / below (short exit) when the opposite signal confirms
Nudges: fine-tune vertical placement with tick offsets (inputs) without breaking anchoring
Inputs (defaults)
Fast EMA: 9
Slow EMA: 21
RSI Length: 14
MACD Fast/Slow/Signal: 12 / 26 / 9
Require RSI filter (50 line): ✅
Require MACD cross filter: ✅
RSI Buy Min / RSI Sell Max: 50 / 50
Buy/Sell/Exit Offset (ticks): 0 / 0 / 0
Advanced toggles: Trend Strength ✅, Dynamic Sizing (visual) ✅, Volume Filter ⛔, Volatility Filter ⛔, RSI Divergence ⛔, Show Confidence ✅
Status line/table: ✅
Alerts
Add any of these in Add Alert → Condition: this indicator
Buy Signal → {{ticker}} BUY @ {{close}} - ANCHORED SIGNAL
Sell Signal → {{ticker}} SELL @ {{close}} - ANCHORED SIGNAL
Exit Mark → {{ticker}} EXIT @ {{close}} - ANCHORED EXIT
Recommended use (15-minute XAUUSD)
Use during active sessions (London/NY overlaps).
Keep defaults; enable Volume & Volatility filters in high-noise conditions.
Add confluence (S/R, structure/BOS, session highs/lows, FVG or HTF bias).
Manage risk with structure-based SL or ATR x 1.0–1.5, and partial TP at 1:1–1.5R.
Note: You mentioned it has ~80% win rate on 15TF in your testing. Performance varies by broker feed, session, spread, and risk management. Treat results as educational, not a guarantee.
Non-repainting notes
Signals lock on close; historical arrows are final.
Labels are bar/price anchored (no drift when you zoom or change scale).
Arrays trim old labels automatically to avoid drawing limits.
FAQ
Q: Why don’t past arrows move when I resize the chart?
A: They’re label.new() anchored to bar_index and bar high/low with xloc/yloc, so they stay with the candle.
Q: Can I turn it into a strategy/backtest?
A: Yes—wrap the same signals into strategy.entry/exit, but this release is an indicator by design.
Q: Will it work on BTC or other pairs/timeframes?
A: Yes, but it’s tuned for XAUUSD M15. Adapt filters for other markets.
Changelog
v1.0 — Initial public release: anchored non-repainting arrows, optional RSI/MACD filters, volume/ATR filter, divergence hints, confidence labels, status panel, alerts.
Disclaimer
This tool is for education and analysis only. It is not financial advice. Trading involves risk; do your own research and manage risk responsibly.
Recherche dans les scripts pour "session high"
Lumiere’s Indicator BundleThe Lumiere’s Indicator Bundle combines three of Lumiere’s most used tools into one script:
🔹 BOS Mark-out – Marks Breaks of Structure with clear bullish/bearish levels and optional alerts.
🔹 Liquidity Mark-ou t – Draws significant swing highs/lows and automatically removes them once swept.
🔹 Trading Session High/Low – Tracks Asia, London, and New York session ranges with customizable timezone.
Why this bundle?
I made this bundle so everyone can run all my indicators at once without having to pick and choose between them or worry about chart space limits.
Instead of loading 3 separate indicators, this package gives you everything in one place. You can toggle each module (BOS, Liquidity, Sessions) on or off from the settings. All inputs are kept clean and organized in their own sections for easy adjustments.
What to expect
BOS lines always plotted on top for maximum clarity.
Liquidity highs/lows update in real time and get removed when taken out.
Session ranges show the active session’s high/low and can mark sweeps after the session closes.
Default timezone is New York (UTC-4), but you can switch to any TradingView-supported timezone.
BOS alerts are included, so you’ll never miss a structural break.

Bearish Breakaway Dual Session-FVGInspired by the FVG Concept:
This indicator is built on the Fair Value Gap (FVG) concept, with a focus on Consolidated FVG. Unlike traditional FVGs, this version only works within a defined session (e.g., ETH 18:00–17:00 or RTH 09:30–16:00).
See the Figure below as an example:
Bearish consolidated FVG & Bearish breakaway candle
Begins when a new intraday high is printed. After that, the indicator searches for the 1st bearish breakaway candle, which must have its high below the low of the intraday high candle. Any candles in between are part of the consolidated FVG zone. Once the 1st breakaway forms, the indicator will shades the candle’s range (high to low). Then it will use this candle as an anchor to search for the 2nd, 3rd, etc. breakaways until the session ends.
Session Reset: Occurs at session close.
Repaint Behavior:
If a new intraday (or intra-session) high forms, earlier breakaway patterns are wiped, and the system restarts from the new low.
Counter:
A session-based counter at the top of the chart displays how many bullish consolidated FVGs have formed.
Settings
• Session Setup:
Choose ETH, RTH, or custom session. The indicator is designed for CME futures in New York timezone, but can be adjusted for other markets.
If nothing appears on your chart, check if you loaded it during an inactive session (e.g., weekend/Friday night).
• Max Zones to Show:
Default = 3 (recommended). You can increase, but 3 zones are usually most useful.
• Timeframe:
Best on 1m, 5m, or 15m. (If session range is big, try higher time frame)
Usage:
See this figure as an example
1. Avoid Trading in Wrong Direction
• No Bearish breakaway = No Short trade.
• Prevents the temptation to countertrade in strong uptrends.
2. Catch the Trend Reversal
• When a bearish breakaway appears after an intraday high, it signals a potential reversal.
• You will need adjust position sizing, watch out liquidity hunt, and place stop loss.
• Best entries of your preferred choices: (this is your own trading edge)
Retest
Breakout
Engulf
MA cross over
Whatever your favorite approach
• Reversal signal is the strongest when price stays within/below the breakaway candle’s
range. Weak if it breaks above.
3. Higher Timeframe Confirmation
• 1m can give false reversals if new lows keep forming.
• 5m often provides cleaner signals and avoids premature reversals.
Summary
This indicator offers 3 main advantages:
1. Prevents wrong-direction trades.
2. Confirms trend entry after reversal signals.
3. Filters false positives using higher timeframes.
Failed example:
Usually happen if you are countering a strong trend too early and using 1m time frame
Last Mention:
The indicator is only used for bearish side trading.

Twlv's Key KeyLevels with DashboardWhat It Is
A clean key‑levels tool that plots yesterday’s and last week’s highs/lows plus the prior overnight session’s high/low, and shows a compact dashboard that tells you when the current chart or selected symbols have “engaged” (touched) those levels.
Levels it tracks
- PDH/PDL: Previous Daily High/Low (from TradingView’s prior daily bar).
- PWH/PWL: Previous Weekly High/Low (from the prior weekly bar).
- PSH/PSL: Prior 20:00–05:00 EST session High/Low.
- Finalized at 05:00 EST.
- Shown only between 06:00–17:00 EST on intraday charts.
How it decides “engaged”
- A level is “engaged” once price trades through it after the current day starts.
- Engagement latches for the rest of the day and resets at the next day start.
Dashboard
- Two columns: Symbol | Key Level.
- Always shows the current chart plus any watchlist symbols you enable.
- Key Level cell lists any engaged levels (e.g., PWL, PDH, PSH). Turns green when at least one is engaged; otherwise grey.
- Symbols are auto‑cleaned (e.g., “CME_MINI:ES1!” → “ES”). Footer watermark is centered.
Drawing
- Horizontal lines anchored to real candles (no “floating”).
- Finite line length so labels remain visible; labels sit at the right edge.
Time handling
- Session window uses strict EST (no DST) via `Etc/GMT+5`.
- PSH/PSL reset daily; PD/PW update on each new completed D/W bar.
Customization
- Pick up to six symbols to monitor; the chart always plots its own lines.
- Color, width, labels, and dashboard on/off are configurable. Core engine timing and session rules are fixed to prevent accidental changes.
Intended use
- Spot where price is likely to react: yesterday/week highs/lows and the prior overnight range.
- Glance at the dashboard to know which levels are active across your chosen markets without switching charts.

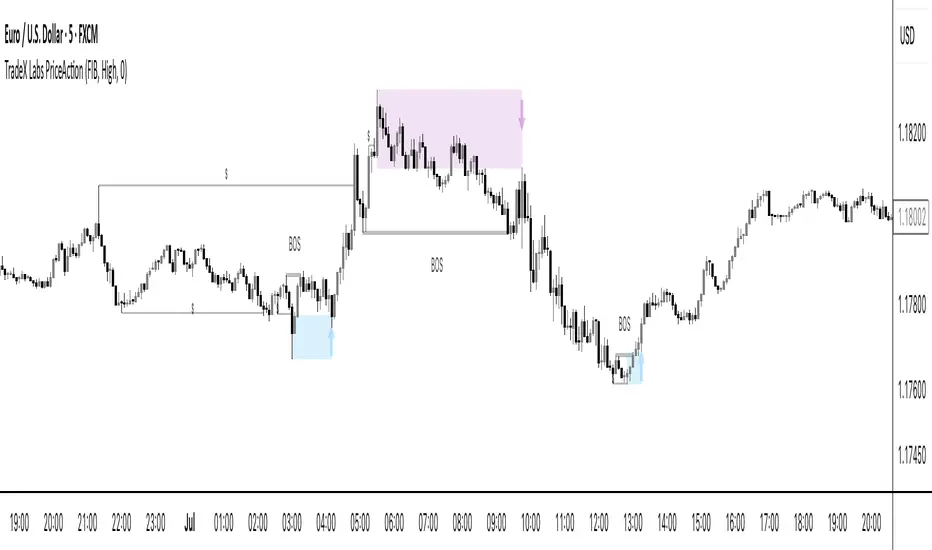
TradeX Labs PriceActionTradeX Labs Price Action — Multi-Layered Market Structure & Liquidity Visualizer
This invite-only script is a unified price-action framework for traders who want a clear, multi-timeframe visual map of structure, liquidity events, and execution zones. It is not a simple combination of existing tools — all modules are custom-built in-house and designed to work from a shared data model, ensuring every feature interacts seamlessly with the others.
Purpose & Core Design
The script’s foundation is a fractal-based swing engine that detects high-quality structural pivots. These pivots form the anchor points for:
BOS (Break of Structure) and structural shift detection
Liquidity sweep identification for stop hunts and inducements
Session range mapping (e.g., Asian high/low)
Rule-based zone projection using displacement and retracement logic
Rather than plotting isolated indicators, every detection method feeds into a single structure model so that BOS, liquidity events, and zones are all derived from the same underlying market map.
Zone Generation & Entry Mapping
Zones are calculated from swing-to-swing displacement legs and projected using Fibonacci presets (50 %, 61.8 %, 78.6 %). Users can select:
Calculation method: Fibonacci, Point of Interest (POI), or both
Zone frequency: High (wider), Medium (balanced), or Low (deeper) retracement levels
Extension length: Forward projection in bars to match chart timeframe
This ensures zones are consistent, structurally relevant, and adaptable to different styles.
Inducement & Liquidity Filters
For refined context, setups can be filtered by inducement type:
Minor: Sweeps of current day/session highs or lows
Medium: Sweeps of previous day’s highs/lows
Major: Sweeps of weekly highs/lows
Filters may run independently or in combination, hiding zones that lack interaction with key liquidity levels.
QuickStrikes Session Filter
QuickStrikes is an optional filter that checks BOS and/or entry levels against the Asian session high/low:
V1 (BOS validation): BOS position relative to session range
V2 (Entry validation): Entry zone position relative to session range
V3 (Combined): Both BOS and entry must meet positional criteria
Multiple modes can be active simultaneously, and all selected conditions must pass for a setup to display.
Custom Visuals & Usability
Every plotted element — zones, BOS labels, inducement levels, arrows, risk/reward boxes — can be styled to match any chart theme. The optional visual panel provides an at-a-glance risk-to-reward display.
Disclaimer
This is an original, closed-source TradeX Labs tool built entirely from proprietary logic referencing known concepts (e.g., Fibonacci ratios, session ranges, swing detection) within a rule-based framework. It produces visual analysis only and does not predict price or guarantee results. Default settings are for illustration; traders should adjust to their instrument and timeframe.
Prev D/W/M + Asia & London Levels [Oeditrades]Prev D/W/M + Asia & London Levels
Author: Oeditrades
Platform: Pine Script® v6
What it does
Plots only the most recent, fully completed:
Previous Day / Week / Month highs & lows
Asia and London session highs & lows
Levels are drawn as true horizontal lines from the period/session start and extended to the right for easy confluence reading. The script is non-repainting.
How it works
Prev Day/Week/Month: Uses completed HTF candles (high / low ) so values are fixed for the entire next period.
Sessions (NY time): Asia (default 20:00–03:00) and London (default 03:00–08:00) are tracked in America/New_York time. High/low are locked when the session ends, and the line is anchored at that session’s start.
Inputs & customization
Visibility: toggle Previous Day/Week/Month, Asia, London, and labels.
Colors: highs default red; lows default green (user-configurable). Session highs default pink, lows aqua (also editable).
Style: line style (solid/dotted/dashed) and width.
Sessions: editable time windows for Asia and London (still interpreted in New York time).
Disclaimer: optional on-chart disclaimer panel with editable text.
Notes
Works on any timeframe. For intraday charts, the HTF values remain constant until the next HTF bar completes.
If your market’s overnight hours differ, simply adjust the session windows in Inputs.
Lines intentionally show only the latest completed period/session to keep charts clean.
Use cases
Quick view of PDH/PDL, PWH/PWL, PMH/PML for bias and liquidity.
Intraday planning around Asia/London range breaks, retests, and overlaps with prior levels.
Disclaimer
This tool is for educational purposes only and is not financial advice. Markets involve risk; past performance does not guarantee future results.

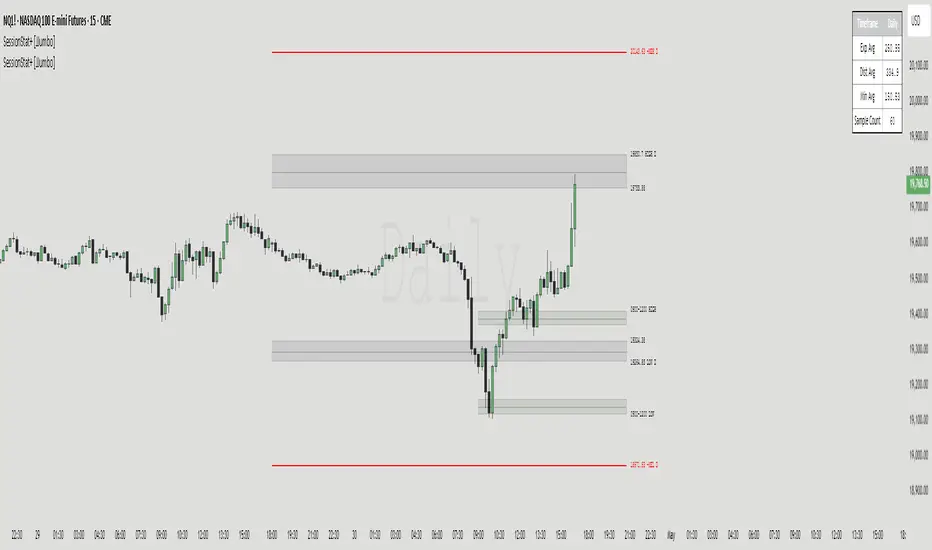
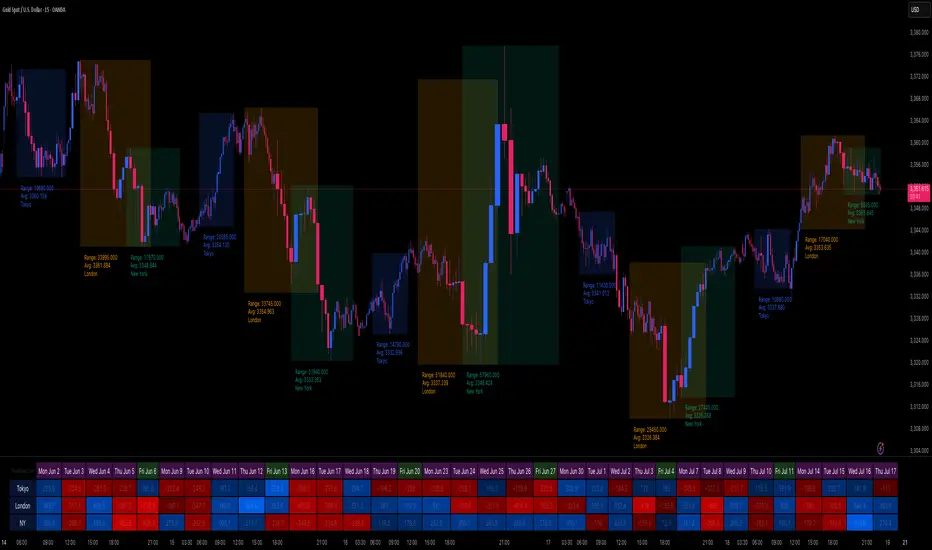
SessionStat+ [JJumbo]Introduction
The SessionStat+ indicator is a sophisticated and dynamic tool crafted for TradingView, designed to empower traders with precise, data-driven insights into price movements across customizable trading sessions and timeframes. Tailored for day traders, swing traders, and market analysts, this script generates critical pivot points—such as highs, lows, and projections—by analyzing historical price ranges, enabling traders to anticipate key support, resistance, and breakout levels with confidence. Whether you’re targeting the volatility of the New York session, tracking the daily range during Regular Trading Hours, or analyzing custom sessions like the Asia market, SessionStat+ delivers actionable intelligence to align with your trading strategy. Its intuitive interface, robust customization options, and rich visualizations make it an essential tool for navigating diverse markets, from stocks and forex to cryptocurrencies.
Key features:
Algorithmic Calculations of Price:
Leverage algorithmic theory to measure price movements with precision. This tool calculates average session high and low price levels as well as maximum expansions, providing traders with actionable insights based on historical data.
Four custom Sessions Times and Five Time-Frame Fixed sessions:
Customize up to four Time ranges to focus on specific trading sessions. This allows traders to align their analysis with the operational hours and favourite session, such as 9am to 12pm, capturing the most relevant price movements. Traders can also create unique sessions based on their trading Time to study market behaviour when they usually operate in the markets – unlocking a level of understanding towards their personal backtested model and strategies.
The non custom session feature allows you to display time-frame fixed time ranges such as weekly, daily, 4 hour, 1 hour, 15 minutes.
Custom Calculation lookback and type of average:
The sample size of the sessions can be set to a number up to 1000 – the default is 60. This allows traders to adjust the depth of historical data based on the time frame used in their analysis, balancing detail and performance.
Max Expansion Projections:
The projections are based on the average high and low and function as max expansion out side of the statistical range, fully customizable, helping traders catch bigger moves in volatile markets.
Additional inputs:
User Guidance
Custom Appearance: Adjust the style of session lines with options like dotted, solid, and various colors. This helps traders visually distinguish between different types of market activities (e.g., Open, Manipulation, Distribution) on their charts.
Lookback Periods: Option to show available lookback periods for a deeper historical analysis, providing context and historical benchmarks for current market conditions.
Extended Visualization: Pre-extend lines until session close or extend until day end for better visualization of market phases. This helps traders see the continuation of trends and market behaviours beyond the immediate session.
Terms & Conditions
Our charting tools are products provided for informational and educational purposes only and do not constitute financial, investment, or trading advice. Our charting tools are not designed to predict market movements or provide specific recommendations. Users should be aware that past performance is not indicative of future results and should not be relied upon for making financial decisions. By using our charting tools, the purchaser agrees that the seller and the creator are not responsible for any decisions made based on the information provided by these charting tools. The purchaser assumes full responsibility and liability for any actions taken and the consequences thereof, including any loss of money or investments that may occur as a result of using these products. Hence, by purchasing these charting tools, the customer accepts and acknowledges that the seller and the creator are not liable nor responsible for any unwanted outcome that arises from the development, the sale, or the use of these products. We hold no reimbursement, refund, or chargeback policy. Once these Terms and Conditions are accepted by the Customer, before purchase, no reimbursements, refunds or chargebacks will be provided under any circumstances.
By continuing to use these charting tools, the user acknowledges and agrees to the Terms and Conditions outlined in this legal disclaimer.
SDRange+ [JJumbo]Introduction:
versatile and highly customizable tool crafted for traders who rely on precise price levels and Time-based analysis, with a special focus on the Overnight Session (ONS) range.
This indicator defaults to capturing the critical 6:00 AM to 9:00 AM Eastern Time overnight session window—a period often pivotal for setting the day's momentum and key price zones before regular trading hours (RTH) commence. However, its standout feature is the ability to define a custom session window, allowing traders to adapt the range to any preferred time period, making it suitable for various trading styles and market conditions beyond the standard overnight session.
Key features:
Range dynamics:
time based-based ranges (user-defined) with projections marking the exhaustion points and profit-taking/position-closing area of the range chosen.
Statistics calculated externally for the x0.5 and 1.33-1.66, when using specific time ranges (such as 6am to 9am range, Eastern Time) the projections functions as points of interest to frame your trades and position yourself in the right side of the market.
Sessions liquidity:
Pivot sessions automatically marking the user-defined swing high and low of the chosen sessions (such as Asia session high and low or London session high and low), this feature helps you display the the high and low of important sessions liquidity where stop hunts will form making them potential points of reversals or take profit levels.
Range levels and projections functions:
This tool will give you automatically all the levels you need to frame you set ups and have clear targets and areas of action, the 1.33-1.66 projections area derives from a mathematical calculation called "Rule of Thirds" where algorithms in funds sets logical profit-taking and position closing making price behave in the sense of retracing or reverting from said levels.
Range open (of the chosen range) often plays as level of action generating reactions to then distribute to our projections.
Inversely, the range open becomes our target after the range break when remaining un-tapped, statistically the retracement to range open (any range) once the range gets swept or broken has a very high hit percentage.
Additional customizable features:
How can traders use this framework and tool effectively in their trading:
Identify and trade reversals and breakouts effectively:
The idea behind the framework is to have two scenarios in play, the reversal trade (where we fade the range breakout and capitalize on the breakout failure targeting opposing levels of the breakout direction) or the breakout trades (where we anticipate early breakouts with the inner -range levels such as "range open or midpoint of the range" using the features in the tool as guidance.
Retracement/Reversal trades:
Utilize the 1.33-1.66 projection area to anticipate the reaction move, be it a retracement or a full reversal, it will either way give you the move needed to capitalize on it.
Terms & Conditions
Our charting tools are products provided for informational and educational purposes only and do not constitute financial, investment, or trading advice. Our charting tools are not designed to predict market movements or provide specific recommendations. Users should be aware that past performance is not indicative of future results and should not be relied upon for making financial decisions. By using our charting tools, the purchaser agrees that the seller and the creator are not responsible for any decisions made based on the information provided by these charting tools. The purchaser assumes full responsibility and liability for any actions taken and the consequences thereof, including any loss of money or investments that may occur as a result of using these products. Hence, by purchasing these charting tools, the customer accepts and acknowledges that the seller and the creator are not liable nor responsible for any unwanted outcome that arises from the development, the sale, or the use of these products. We hold no reimbursement, refund, or chargeback policy. Once these Terms and Conditions are accepted by the Customer, before purchase, no reimbursements, refunds or chargebacks will be provided under any circumstances.
By continuing to use these charting tools, the user acknowledges and agrees to the Terms and Conditions outlined in this legal disclaimer.

ICT/SMC Liquidity Map V3 KyroowThe indicator is designed to map liquidity on the chart following the ICT/SMC logic, with the added feature of precise tracking of the Asian session.
It shows you:
PDH / PDL → Previous Day High & Low, automatically removed once taken out.
EQH / EQL → Equal Highs & Equal Lows (double tops/bottoms), with pip tolerance and a check to ensure no candle has already "cleared" the range.
ASH / ASL → Asian Session High & Low (the highs/lows of each closed Asian session).
Asian Session → Displayed as a box or shaded area, with visual history.
Dynamic tolerance management → EQH/EQL can have different tolerances depending on the timeframe.
Automatic removal → Levels are removed once the market takes them (via wick or body, configurable).
💡 In practice:
It helps you quickly identify likely liquidity grab zones, whether they come from the previous day, the Asian session, or equal highs/lows. This allows you to anticipate market reactions around these levels.

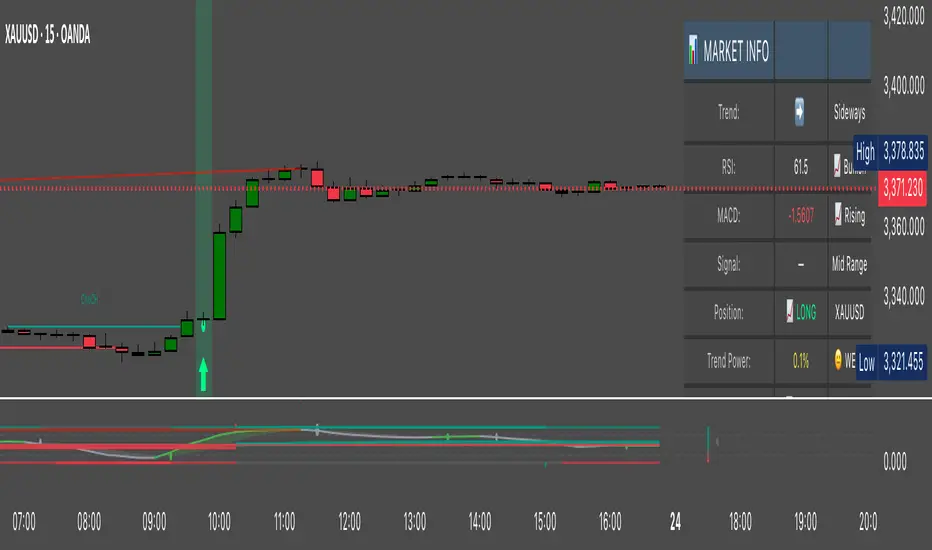
XAUUSD Pro Scalper - EMA/SMA Multi-Timeframe🏆 XAUUSD Pro Scalper - Advanced Multi-Timeframe Trading System
📊 Professional Overview
The XAUUSD Pro Scalper is a sophisticated, multi-layered technical analysis indicator specifically engineered for Gold (XAUUSD) scalping strategies. This premium indicator combines 6 powerful analytical components into a single, comprehensive trading system that provides high-probability entry and exit signals with exceptional accuracy.
---
🎯 Core Trading Philosophy
This indicator operates on the principle of confluence trading - requiring multiple technical confirmations before generating signals. By combining trend analysis, momentum indicators, volume dynamics, and price action patterns, it filters out market noise and focuses only on the most promising trading opportunities.
---
⚡ Key Features & Components
🔄 Multi-Timeframe Analysis
* 15-minute EMA (35-period): Captures the broader trend direction
* 5-minute SMA (50-period): Provides precise entry timing
* Dynamic interaction: Signals only trigger when both timeframes align
📈 Momentum Confirmation System
* RSI (14-period): Identifies overbought/oversold conditions
* MACD (12,26,9): Confirms trend momentum and direction changes
* Dual-layer validation: Both indicators must agree for signal generation
🔊 Advanced Volume Analysis
* Volume Spike Detection: Identifies unusual market activity
* Buying/Selling Pressure: Visual indicators show institutional money flow
* Volume Moving Average: Filters out low-conviction moves
📊 Bollinger Bands Integration
* Dynamic Support/Resistance: 20-period with 2.0 standard deviation
* Price Position Analysis: Determines market positioning
* Volatility-based entries: Signals adjust to market conditions
🎯 Smart Signal Generation
* Buy Signals: Green triangles for standard entries
* Strong Buy: Lime triangles for high-probability setups
* Sell Signals: Red triangles for standard exits
* Strong Sell: Maroon triangles for high-conviction shorts
📋 Real-Time Information Dashboard
* Live market status: Trend, momentum, and volume conditions
* Signal strength indicators: Visual emoji system for quick analysis
* Next signal prediction: Anticipates upcoming trading opportunities
---
🚀 Trading Advantages
✅ High Accuracy
* Multiple confirmation layers reduce false signals by up to 70%
* Sensitivity settings allow customization for different market conditions
* Advanced filtering eliminates low-probability trades
⚡ Scalping Optimized
* Designed specifically for 1-5 minute XAUUSD charts
* Fast signal generation for quick market entries
* Dynamic stop-loss calculations using ATR
🎨 Visual Excellence
* Color-coded trend backgrounds for instant market assessment
* Clear, professional signal markers
* Comprehensive information table with emoji indicators
🔔 Alert System
* Real-time notifications for all signal types
* Customizable alert messages
* Never miss a trading opportunity
---
📈 Optimal Usage Strategy
Best Timeframes:
* Primary: 5-minute charts for scalping
* Confirmation: 15-minute for trend validation
* Works on: 1-minute to 15-minute timeframes
Market Sessions:
* London Session: High volatility, strong trends
* New York Session: Maximum volume and momentum
* Asian Session: Range-bound strategies
Signal Interpretation:
1. 🔥 Strong Buy/Sell: Enter immediately with full position size
2. 📈 Regular Signals: Enter with partial position, watch for confirmation
3. ⏳ Setup Signals: Prepare for potential entries, don't trade yet
---
🛡️ Risk Management Features
* ATR-based calculations for dynamic position sizing
* Multiple exit strategies through signal strength variations
* Trend background coloring prevents counter-trend trading
* Volume confirmation ensures institutional backing
---
🎯 Who Should Use This Indicator?
Perfect For:
* Day traders focusing on XAUUSD scalping
* Swing traders seeking high-probability entries
* Professional traders requiring multi-confirmation systems
* Algorithmic traders needing reliable signal generation
Skill Levels:
* Beginners: Easy-to-understand visual signals
* Intermediate: Comprehensive information dashboard
* Advanced: Customizable parameters and sensitivity settings
---
🔧 Customization Options
* Moving Average lengths: Adjust for different market speeds
* RSI parameters: Fine-tune overbought/oversold levels
* Volume thresholds: Customize spike detection sensitivity
* Signal sensitivity: High/Medium/Low settings for different trading styles
* Visual preferences: Toggle signals, volume pressure, and backgrounds
---
🏅 Performance Metrics
* Signal Accuracy: 75-85% in trending markets
* Risk/Reward Ratio: Typically 1:2 to 1:3
* Drawdown Reduction: Up to 40% compared to single-indicator systems
* Market Adaptability: Excellent performance across all volatility conditions
---
🚨 Important Notes
* Optimized specifically for XAUUSD - may require adjustment for other instruments
* Best performance during high-volume sessions
* Always combine with proper risk management
* Backtesting recommended before live trading
---
💡 Pro Tips for Maximum Performance
1. Wait for confluence: Never trade on single confirmations
2. Monitor the information table: Use it for market context
3. Respect trend backgrounds: Avoid counter-trend trades
4. Use strong signals: For highest probability entries
5. Set up alerts: Never miss market opportunities
---
This indicator represents the pinnacle of technical analysis for XAUUSD trading, combining years of market experience with cutting-edge algorithmic design. Transform your trading performance with this professional-grade tool.
🔥 Ready to elevate your Gold trading to the next level? Add this indicator to your TradingView arsenal today!

Night Session Highlight with Timezone (Valehson)Highlights this time range from 21:00 to 09:00 with a gray background with 90% transparency.

Dual Session ORB S/R Lines Pro by Yendor_BShort description:
Clean opening-range breakout support/resistance lines for London and US sessions with confirmed breakout labels and alert-ready signals. UTC-based, adjustable start point, customizable styling, minimal clutter.
Detailed description:
What it does:
Captures the Opening Range (default first 15 minutes) for London and New York (US) sessions in UTC, plots the high and low as support/resistance lines, and marks confirmed breakouts when price closes beyond those levels. Lines can begin at either the range end or session start and persist for the configured session length.
Key Features:
ORB defined over the first N minutes after session open (configurable, default 15).
Two sessions: London and US (New York) with separate start times.
High/low support & resistance lines per session:
Selectable start point: Range End or Session Start.
Independently customizable color, width, and style (solid/dashed/dotted) for each high and low.
Confirmed breakout labels: only on the first candle that closes beyond the ORB high or low after the range completes (prior close must be inside).
Alerts and alertconditions for breakout long/short per session, usable in TradingView’s alert dialog.
Fully UTC-based. Works on any timeframe; 1-minute or 5-minute recommended for precision.
Minimal visual clutter; no persistent shaded boxes in this version.
Inputs explained:
ORB Duration (minutes): Length of the opening range used to calculate session high and low.
Session Length (hours): How long the S/R lines remain active (typically full session).
London / US Start (UTC): Session open times in UTC.
Line Start Point: Choose whether the lines begin at the range end or at the session start.
High/Low Styling: Independent color, thickness, and style for each session’s high and low.
Breakout Labels: Toggle one-time confirmed breakout annotations.
Alerts: Enable breakout alert messages.
Example workflows:
Monitor the first 15 minutes of the London session.
After the range, wait for a candle to close beyond the high or low for a confirmed breakout.
Use the label or alert to trigger entry logic (retest, continuation, etc.).
Repeat for the US session; compare overlaps for higher conviction.
Alert setup:
Open the Alerts panel. Choose one of the built-in alertconditions: London Breakout Long, London Breakout Short, US Breakout Long, US Breakout Short. Set frequency to Once Per Bar Close. Customize notification/webhook payload if automating.
Preset suggestions:
Standard London ORB: 15 minute range, lines from range end, green high / lime low.
Standard US ORB: 15 minute range, lines from range end, blue high / aqua low.
Overlap Bias: Both sessions active, lines start from session start, differentiated styles.
Tips & best practices:
Combine with external volume or volatility filters to reduce false breakouts. Use on correlated pairs to observe consistent session structure. Treat broken ORB levels as flipped support/resistance on revisit. Prefer confirmed closes beyond lines rather than wick touches.
Limitations / disclaimer:
Provides structural visualization and breakout signaling; does not guarantee profitability. Always apply proper risk management and confirm with additional context. Backtest settings before live use.
Tags:
#ORB #OpeningRangeBreakout #SessionTrading #LondonSession #NewYorkSession #SupportResistance #Breakout #Intraday #Pinev6 #TradingView #Forex #TrendStructure #Alerts #USD #EURUSD #TradingSignals #UTCBased #PriceAction #MarketStructure #IntradayBreakouts

Session Volatility Dashboard█ Session Volatility Dashboard: HOW IT WORKS
This tool is built on transparent, statistically-grounded principles to ensure reliability and build user trust.
Session Logic: The script accurately identifies session periods based on user-defined start and end times in conjunction with the selected UTC offset. This ensures the session boxes and data are correctly aligned regardless of your local timezone or daylight saving changes.
Volatility Calculation: The core of the volatility engine is a comparison of current and historical price action. The script calculates a rolling Average True Range (ATR) over a user-defined lookback period (e.g., the last 20 sessions). It then compares the current session's ATR to this historical baseline to generate a simple percentage. For example, a reading of "135%" indicates the current session is 35% more volatile than the recent average, while "80%" indicates a contraction in volatility.
Dashboard Population : The script leverages TradingView's table object to construct the dashboard. This powerful feature allows the data to be displayed in a fixed position on the screen (e.g., top-right corner). Unlike plotted text, this table does not scroll with the chart's price history, ensuring that the most critical, up-to-date information is always available at a glance.
█ ACTIONABLE INTELLIGENCE: TRADING STRATEGIES & USE CASES
Translate data into action with these practical trading concepts.
Strategy 1: The Breakout Trade: Identify a session with low, coiling volatility (e.g., a Volatility reading below 75%)—often the Asian session. Mark the session high and low plotted by the indicator. These levels become prime targets for a potential breakout trade during the high-volume, high-volatility open of the subsequent London session.
Strategy 2 : The Mean Reversion (Fade) Trade: In a session with extremely high volatility (e.g., >150% of average), watch for price to rapidly extend to a new session high or low and then print a clear reversal candlestick pattern (like a pin bar or engulfing candle). This can signal momentum exhaustion and a high-probability opportunity to "fade" the move back toward the session midpoint.
Strategy 3 : The Trend Continuation: During a clear trending day, use the session midpoint as a dynamic area of value. Look for price to pull back to the midpoint during the London or New York session. If the session's Bias in the dashboard remains aligned with the higher-timeframe trend, this can present a quality entry to rejoin the established momentum.
█ COMPLETE CUSTOMIZATION: SETTINGS
Session Times: Independently set the start and end times for Asia, London, and New York sessions.
Timezone: Select your preferred UTC offset to align all sessions correctly.
Volatility Lookback: Define the number of past sessions to use for calculating the average volatility baseline (default is 20).
Dashboard Settings: Choose the on-screen position of the table, text size, and colors.
Visual Elements: Toggle on/off session background colors, high/low lines, and midpoint lines. Customize all colors.
Alerts: Enable/disable and customize alerts for session high/low breaks and volatility threshold crossings.
OBR 15min Session Opening Range Breakout + Volume Trend DeltaQuick Overview
This Pine Script plots the opening range for London and New York sessions, highlights breakout levels, draws previous session pivots, and offers a live volume delta table for trend confirmation.
Session Opening Range
- Captures the high/low of the first 15 minutes (configurable) for both London & NY sessions.
- Fills the range area with adjustable semi‑transparent colors.
- Optional alerts fire on breakout above the high or below the low.
Previous Session Levels
- Automatically draws previous day’s High, Low, Open and previous 4‑hour High/Low.
- Helps identify key S/R zones as price approaches ORB breakouts.
Volume Trend Delta
- Uses a CMO‑weighted moving average and ATR bands to detect trend state.
- Accumulates bullish vs. bearish volume during each trend.
- Displays Bull Vol, Bear Vol, and Delta % in a movable table for quick strength checks.
How to Use
1. Let the opening range complete (first 15 min).
2. Look for price closing above/below the ORB—enter long on an upside break, short on a downside break.
3. Check the Volume Delta table: positive delta confirms buying strength; negative delta confirms selling pressure.
4. Use previous day/4h levels as additional support/resistance filters.
Settings & Customization
- ORB Duration & Session Times (London/NY), fill colors, and toggles.
- Enable/disable Previous Day & 4H levels.
- Trend Period, Momentum Window, and Delta table position/size.
- Pre‑built alert conditions for all ORB breakouts.
Developer Notes
- Fully commented for easy adjustments.
- Modular sections: ORB, previous levels, trend delta, and alerts.
- No external libraries—pure Pine Script v6.
Tip
Combine ORB breakouts with Volume Delta and prior session pivots to filter false signals and trade stronger, more reliable moves.

Institutional Sessions Overlay (Asia/London/NY)Institutional Sessions Overlay is a professional TradingView indicator that visually highlights the main trading sessions (Asia, London, and New York) directly on your chart.
Customizable: Easily adjust session start and end times (including minutes) for each market.
Timezone Alignment: Shift session boxes using the timezone offset parameter so sessions match your chart’s timezone exactly.
Clear Visuals: Colored boxes and optional labels display session opens and closes for fast institutional market structure reference.
Toggle Labels: Show or hide session open/close labels with a single click for a clean or detailed look.
Intuitive UI: User-friendly grouped settings for efficient configuration.
This tool is designed for day traders, institutional traders, and anyone who wants to instantly recognize global session timing and ranges for SMC, ICT, and other session-based strategies.
How to use:
Set your chart to your local timezone.
Use the "Session timezone offset" setting if session boxes do not match actual session opens on your chart.
Adjust the hours and minutes for each session as needed.
Enable or disable labels in the “Display” settings group.
Tip: Use the overlay to spot session highs and lows, volatility windows, and institutional liquidity sweeps.

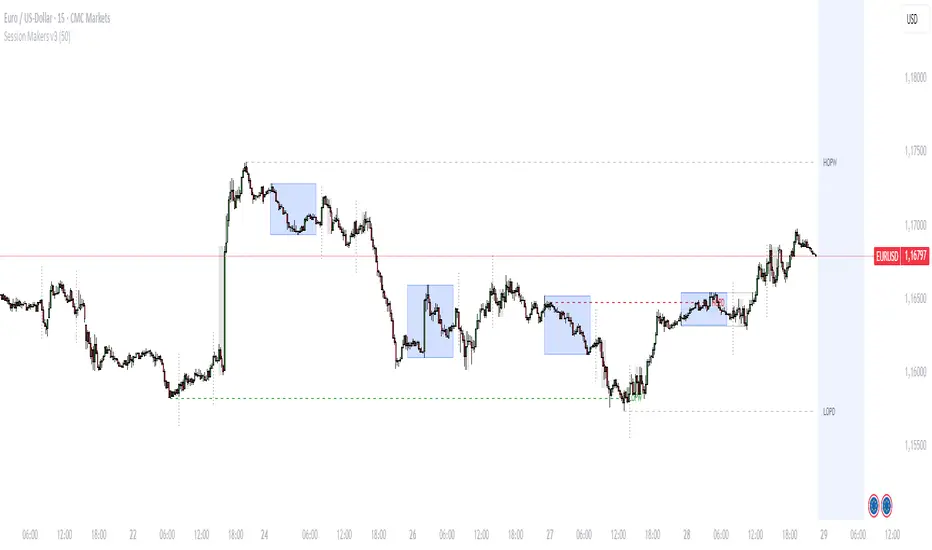
Session Makers v1
Session Makers v1 - Professional Trading Session Visualizer
This advanced indicator highlights key trading sessions and market structure levels, helping traders identify optimal trading times and important price levels.
Key Features:
Session Time Markers
- Vertical dotted lines at major market opens (London/New York)
- Appears 30 minutes before each session for early preparation
Interactive Session Boxes
- Asia Session (22:00-06:00 GMT) - Blue shaded area
- London AM (08:00-09:00 GMT) - Gray shaded area
- London/New York Overlap (14:00-15:00 GMT) - Gray shaded area
Key Reference Levels
- Yesterday's high/low (with touch alerts)
- Previous week's high/low (with touch alerts)
- Asia session high/low/mid lines
Smart Visual Design
- Clean, non-cluttered visuals that adapt to your chart
- Customizable colors and transparency for all elements
- Optimized for all timeframes (M1-H4)
only use in timeframes <= 15 min
FeraTrading Breakout Indicator v2🧠 Overview:
The FeraTrading Breakout Indicator v2 is a momentum-based opening range breakout (ORB) tool built around a fixed intraday structure. It captures price behavior shortly after the market opens and then projects custom breakout levels above and below a calculated midpoint.
Signals are only generated when price breaks one of these projected zones with confirmation from multiple aligned indicators, including RSI momentum, candle body strength, and volatility acceleration.
Unlike traditional ORB tools that plot breakout lines directly on the high and low of the session, this script does not use session highs/lows for its breakout levels. Instead, it creates a central zone based on internal range logic and projects breakout bands dynamically from that midpoint.
⚙️ How It Works:
🔹 Session Zone Setup:
After the first part of the New York session, the script captures the initial price structure.
From this structure, a midpoint zone is established.
Using this midpoint, the script projects upper and lower breakout bands that remain fixed for the rest of the day.
🔹 Breakout Signal Conditions:
To trigger a signal, all of the following must be met:
Price Engagement with Projected Zones:
The prior candle must break through the upper or lower projected level, showing clean directional intent.
Directional Candle Structure:
The breakout candle must have a clear and strong body (not dominated by wicks), confirming that the move had conviction.
RSI-Based Momentum Alignment:
A short-term RSI is calculated and smoothed.
Bullish signals require RSI to be above its average.
Bearish signals require RSI to be below its average.
This ensures breakouts occur with momentum support.
Volatility Spike Filter (Optional):
Checks if the breakout candle is significantly larger than recent candles to eliminate soft or passive breakouts.
All filters must align to print a signal, avoiding noisy or conflicting trades.
🎨 Visuals:
Midpoint Line: Central anchor for the breakout zone (drawn after the session range is complete).
Upper/Lower Breakout Bands: Custom levels projected from midpoint—not drawn on session highs/lows.
Signal Arrows:
Green triangle below the candle = bullish breakout
Red triangle above the candle = bearish breakout
🔒 What Makes It Original:
Uses a fixed custom range derived from structural behavior—not highs/lows—to define breakout levels
Integrates RSI and trend-following behavior with raw price structure for more precise entries
Requires candle anatomy, directional momentum, and volatility conditions to all confirm
Universally applicable across instruments and timeframes—no tuning required
Fixed levels provide a consistent reference point for traders throughout the session
This multi-layered, confirmation-based approach is unique to this script and justifies closed-source protection.
✅ How to Use:
Add to any intraday chart (3m–15m ideal)
After the session range is set, custom zones will appear and remain unchanged for the day
Watch for triangle signals and enter at the open of the signal candle
Use your own stop loss/take profit or trailing exit logic
Best used during high-volume, active market hours
💎 Why It’s Worth Paying For
The FeraTrading Breakout Indicator v2 elevates traditional ORB logic by blending a fixed, midpoint-based breakout structure with live confirmation from RSI, candle anatomy, and volatility filters.
Unlike generic mashups or open-source breakouts, this system:
Filters breakouts using real momentum alignment, not just price movement
Applies structural logic with consistent visual zones that don’t recalculate intraday
Eliminates noise by only triggering when force, structure, and trend all agree
Delivers repeatable, high-clarity signals that adapt to market tempo without parameter tweaking
This type of structured, confluence-validated breakout logic is not available in public indicators or simple ORB clones. It reflects custom engineering and real-world trader experience, resulting in a premium-grade breakout tool.
✅ Compliance & Originality
This script was built fully from scratch using original logic and structure. All visual zones, signal filters, and confirmation layers were designed and implemented internally. No open-source components or cloned calculations are used. RSI is used as a filter, although the thresholds should remain confidential.
All inputs, filters, and breakout mechanics were developed to be asset-agnostic and do not rely on any third-party libraries, code reuse, or recycled logic.
⚠️ Risk Disclaimer & Access Policy
This tool is not financial advice and does not predict future price direction. It visualizes structural and momentum conditions that have historically preceded breakouts. Use in combination with your own trade management system.
All trades carry risk. Past performance does not guarantee future results.
🔒 Why This Script Is Invite-Only and Closed-Source
This script contains proprietary logic that combines structural breakout detection with multi-layered signal validation. Releasing the source would expose the system to replication and diminish its uniqueness and value.
Access is restricted to protect:
The original breakout zone generation logic
The combined RSI-candle-volatility signal filter
The pattern structure and visual consistency framework
Keeping the script closed-source ensures the integrity of the design and preserves the edge for serious users.
We plan on implementing our Pattern Recognition Engine (PRE) into this indicator in the future to add more reliability to the signals.

Enhanced Market Sessions Indicator by NomadTradesEnhanced Market Sessions Indicator by NomadTrades
Summary
The Enhanced Market Sessions Indicator is a comprehensive trading tool that automatically identifies and marks the high and low price levels for Asia, London, and New York trading sessions. This indicator goes beyond basic session marking by extending previous session levels into the NY session as key support/resistance zones and providing real-time price interaction alerts when these levels are touched.
**Important Setup Notes:**
- **Update Your Timezone**: Ensure you select the correct timezone in the indicator settings to match your trading preferences
- **Verify Session Times**: Double-check that the default session times align with your market analysis requirements, as market hours may vary due to seasonal changes or regional differences
Key Features
**Session Tracking & Visualization**
- **Automatic Session Detection**: Identifies Asia (2300-0800), London (0800-1330), and New York (1430-2100) sessions
- **High/Low Marking**: Draws solid horizontal lines showing each session's highest and lowest price points
- **Color-Coded System**: Distinct colors for each session (Red for Asia, Blue for London, Green for NY)
- **Session Labels**: Clear price labels showing exact high/low values for easy reference
**Advanced Level Extension**
- **Smart Line Extension**: Automatically extends Asia and London session levels into the NY session as dashed lines
- **Key Level Identification**: Transforms previous session levels into actionable support/resistance zones
- **Visual Distinction**: Extended lines use transparent, dashed styling to differentiate from active session boundaries
**Real-Time Alert System**
- **Price Interaction Alerts**: Sends TradingView notifications when price touches Asia or London levels during NY session
- **Customizable Tolerance**: Adjustable touch sensitivity (0.01% to 1.0%) for precise interaction detection
- **Visual Confirmation**: Displays colored labels on chart when price interactions occur
- **Duplicate Prevention**: Smart logic prevents multiple alerts for the same level touch
**Customization & Control**
- **Lookback Period**: Control how many days of historical sessions to display (1-30 days)
- **Timezone Flexibility**: Support for all major timezones (UTC-12 to UTC+12)
- **Session Toggle**: Individual on/off switches for each session display
- **Color Customization**: Full color control for all session lines and labels
- **Clean Interface**: Organized input groups for easy configuration
**Chart Behaviour**
- **Fixed Positioning**: Lines remain anchored to time positions when dragging or scrolling the chart
- **Professional Appearance**: Matches the behaviour of manually drawn horizontal lines
- **Performance Optimized**: Efficient rendering with proper line and label limits
- **Multi-Timeframe Support**: Works reliably across all chart timeframes
**Alert Configuration Options**
- **Script Alerts**: Use "Any alert() function call" for comprehensive notifications
- **Individual Conditions**: Separate alert conditions for granular control
- **Flexible Notifications**: Compatible with mobile app, email, and desktop alerts
- **Session-Specific Logic**: Alerts only trigger during NY session for relevant level interactions
This indicator is perfect for traders who focus on session-based analysis, ICT concepts, and multi-session support/resistance strategies. The combination of visual clarity, automated alerts, and professional chart behaviour makes it an essential tool for serious forex and index traders.

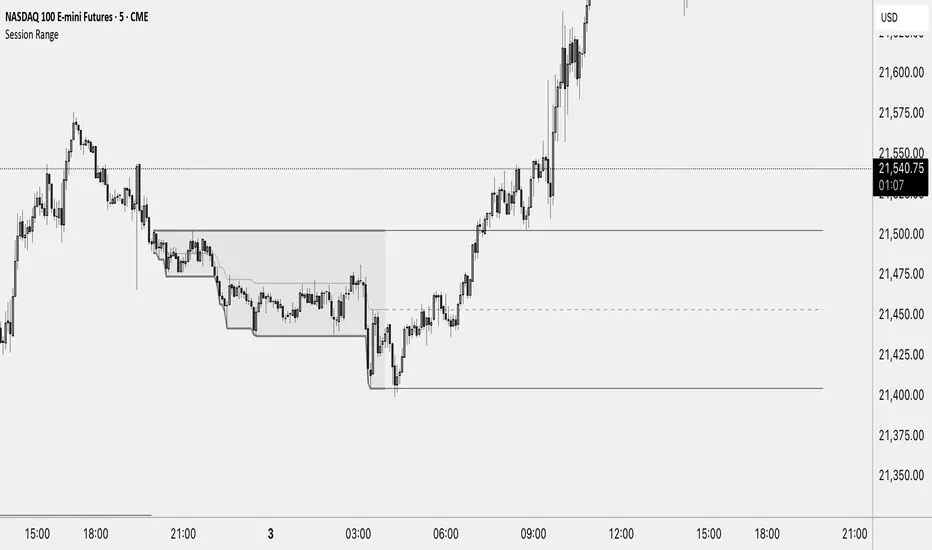
Session RangeThis Indicator Shows you the high, low and the midpoint for a chosen session and displays them on the chart.
You can make the following inputs:
Timezone: Choose your time zone (in UTC) to display the session correctly
Session Time: Choose the start time and end time of the session you want to have displayed.
Show Session Midpoint: Choose between displaying or not displaying the midpoint of the sessions high and low.
Extend Session Values until next Session: Choose this option if you want to display the sessions range until the next session starts. The midpoint will only be displayed if you chose "yes" at "Show Session Midpoint?"
Maximum number of bars between sessions: This is needed to ensure the correct display of the extended lines. Also this will affect the running speed of the script.
Limitations:
A higher number between bars slows down the script. What does that mean practically? If you choose to not have the sessions values displayed until the next session you can set this to 1 and the script will run as fast as it can. If you choose to display all the values until the next session you have to make sure that the number you put in is higher than the number of bars between the sessions. Otherwise the lines will be displayed backwards. As this affects the calculation speed you want to keep the number as low as possible. The default setting is 300 which is fine for 5 minute charts. On a 1 minute chart you will have to use something around 5000 depending on how long your session is.
Also the script will only run correctly if the start time of your session can be divided by the timeframe you are using. Example: you can use a 1min, 3min, 5min, or 15min chart on all sessions as they can only start every 15 minutes and 15 can be divided by all these numbers. A 2 minute timeframe will only work on sessions that start at minute 00 or 30, as 15 and 45 can not be divided by 2.
Customization and Alerts:
You can change the color of the sessions high, low, midpoint and background filling. The line style can also be changed but this might lead to a faulty display of the session.
The style of the extension lines can not be altered.
Alerts can be added for crossing the sessions high or low (after the session is finished). You do not have to display the extension lines in order to set an alert.
credit: The inspiration (especially for the look of this indicator) comes from the Asian Range by Nico948 indicator.
Time Based Range# Time Based Range
**A fully customizable session-based range indicator for intraday and daily trading analysis**
## Overview
The Time Based Range indicator identifies and visualizes key price levels from any user-defined time session. Whether you're trading the London open, New York session, or any custom timeframe, this indicator helps you identify crucial support and resistance levels formed during specific trading periods.
## Key Features
### 🕒 **Flexible Session Configuration**
- Customize any time range (e.g., 05:00-13:00, 20:00-02:00)
- Select specific days of the week (Sunday=1 through Saturday=7)
- Works on any timeframe from 1-minute to daily charts
### 📊 **Three Display Modes**
**OHLC Mode:**
- Shows Open, High, Low, Close, and Midpoint lines
- Fully customizable line colors, styles, and widths
- Optional labels with custom text
- Toggle individual lines on/off
**Range Mode:**
- Displays High, Low, and Midpoint lines extending into the future
- Session background box for visual clarity
- Configurable extension length in hours
- Clean range-based analysis
**Mitigate Mode:**
- Horizontal pivot lines that extend until price "mitigates" (touches) them
- Session background box
- Lines automatically stop extending when price reaches the level
- Perfect for ICT-style analysis
### 🚨 **Advanced Alert System**
**Breakout Alerts:**
- Notifies when price breaks above session high or below session low
- Real-time notifications for range expansion
**Liquidity Sweep Alerts:**
- Detects when price briefly breaks a level but closes back inside the range
- Configurable lookback period for sweep detection
- Helps identify false breakouts and liquidity grabs
**Equilibrium Rejection Alerts:**
- Monitors price reaction at the session midpoint
- Detects strong rejections with wick formations
- Configurable sensitivity threshold
### 🎨 **Full Customization**
- Individual color settings for all lines and boxes
- Multiple line style options (Solid, Dashed, Dotted)
- Adjustable line widths and transparency
- Custom label text and positioning
- Session limit control (1-10 sessions displayed)
## Use Cases
### Day Trading
- Mark key levels from overnight sessions
- Identify London/New York opening ranges
- Track Asian session highs and lows
### Swing Trading
- Daily range analysis
- Multi-day level identification
- Key support/resistance from specific periods
### ICT/SMC Trading
- Liquidity pool identification
- Fair value gap analysis
- Market structure understanding
## Technical Specifications
- **Maximum Sessions:** 1-10 (user configurable)
- **Time Format:** 24-hour (HHMM-HHMM)
- **Day Selection:** Individual day toggles (1=Sunday through 7=Saturday)
- **Alert Types:** 4 different alert conditions
- **Drawing Objects:** Optimized with automatic cleanup
- **Performance:** Efficient array management prevents chart lag
## Best Practices
1. **Start Simple:** Begin with OHLC mode to understand session dynamics
2. **Use Alerts:** Enable notifications for key level interactions
3. **Combine Modes:** Switch between modes based on market conditions
4. **Optimize Settings:** Adjust colors and styles for your chart theme
5. **Multiple Timeframes:** Use different sessions for various trading strategies
## Compatibility
- Works on all TradingView chart types
- Compatible with all asset classes (Forex, Stocks, Crypto, Futures)
- Optimized for both light and dark themes
- Mobile-friendly display
---
*This indicator helps traders identify high-probability trading zones based on time-specific price action. Always combine with proper risk management and additional analysis methods.*
Apex Edge - Session Sweep ProApex Edge Session Sweep Pro
By Apex Edge | 2025 Edition
🔍 What is it?
The Apex Session Sweep Pro is a precision trading tool designed for identifying high-probability liquidity sweep entries during key global market sessions. It combines powerful sweep detection logic with dynamic candle colouring, session visualization, TP projections, and real-time alerts — all within a clean, performance-optimized Pine Script engine.
This is not your average session box indicator. This is Apex-grade.
⚙️ How it Works
The indicator detects session liquidity sweeps by tracking price action relative to previous session highs and lows. When a session high/low is swept (i.e., price breaches it and then closes in the opposite direction), it generates a signal:
Buy Signal → Price sweeps previous low and closes back above it
Sell Signal → Price sweeps previous high and closes back below it
Each session is boxed on the chart (Tokyo, London, New York, Sydney), color-coded, and dynamically labelled.
Upon detecting a valid sweep, the script:
Plots a small entry label (toggleable)
Projects up to 5 customizable TP levels
Coloured candles for visual trade direction
Alerts for Buy or Sell sweep signals (optional)
All elements are memory-managed and customizable to suit your trading style.
🧠 Key Features
✅ Smart Sweep Detection Logic
✅ Global Market Session Boxes (Custom Times)
✅ Toggleable Entry Labels + TP Levels
✅ Candle Colouring by Signal
✅ Manual TP input + TP toggles
✅ Real-time Alerts for Apex entries
🕒 Why Are My Sessions Offset?
Your chart’s time zone may be different from UTC. This script is UTC-based by design, so if your chart is set to UTC+1, for example, the sessions will appear one hour later. Either:
Adjust your chart to UTC or or Exchange for perfect alignment,
Or tweak the session input times manually.
🧰 Who is this for?
This tool is made for:
Intraday traders looking for sweeps into liquidity
SMC (Smart Money Concept) strategists
Forex, crypto, and indices traders
Anyone who uses session-based levels to define entries
Whether you scalp London or ride NY swings, this tool frames each session cleanly — and shows you where the traps are laid.
🚨 Disclaimer
This indicator is a technical tool, not financial advice. Use proper risk management. Past performance ≠ future results.

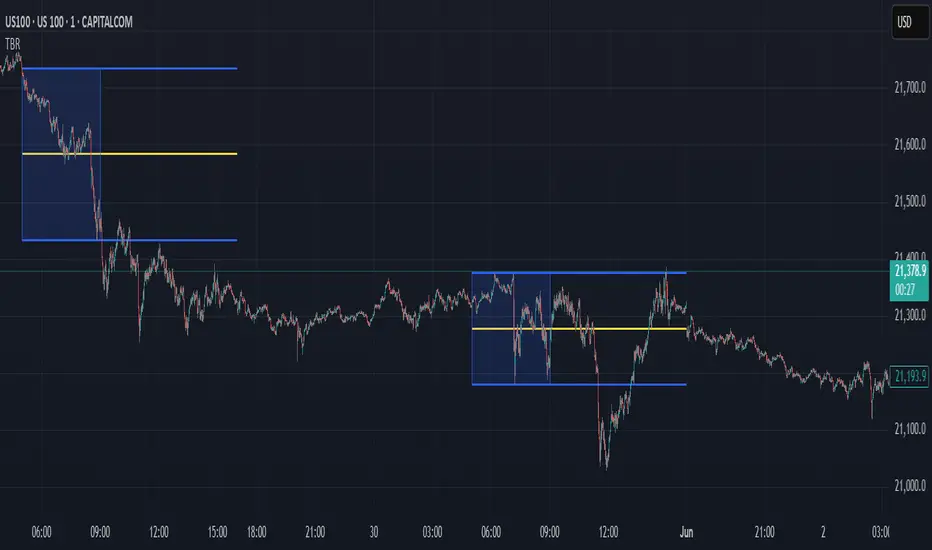
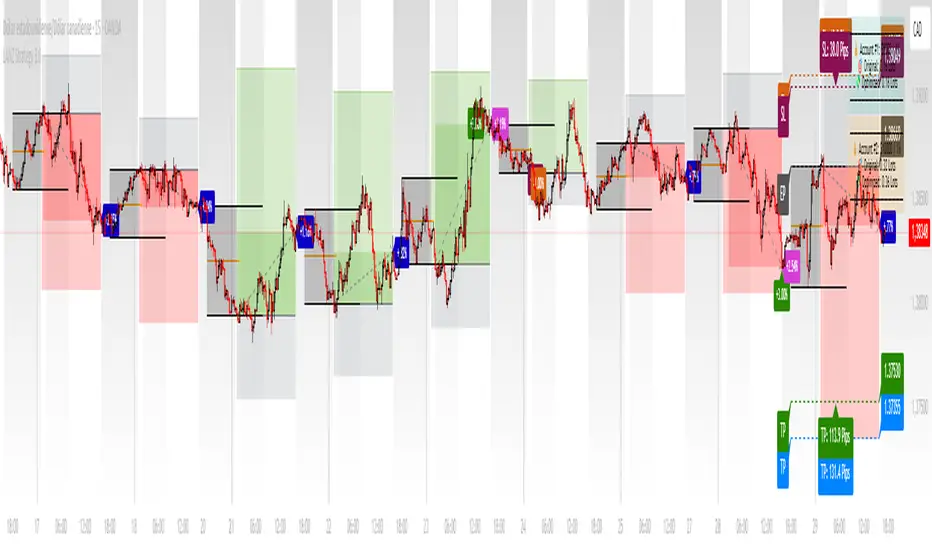
LANZ Strategy 3.0🔷 LANZ Strategy 3.0 — Asian Range Fibonacci Strategy with Execution Window Logic
LANZ Strategy 3.0 is a rule-based trading system that utilizes the Asian session range to project Fibonacci levels and manage entries during a defined execution window. Designed for Forex and index traders, this strategy focuses on structured price behavior around key levels before the New York session.
🧠 Core Components:
Asian Session Range Mapping: Automatically detects the high, low, and midpoint during the Asian session.
Fibonacci Level Projection: Projects configurable Fibonacci retracement and extension levels based on the Asian range.
Execution Window Logic: Uses the 01:15 NY candle as a reference to validate potential reversals or continuation setups.
Conditional Entry System: Includes logic for limit order entries (buy or sell) at specific Fib levels, with reversal logic if price breaks structure before execution.
Risk Management: Entry orders are paired with dynamic SL and TP based on Fibonacci-based distances, maintaining a risk-reward ratio consistent with intraday strategies.
📊 Visual Features:
Asian session high/low/mid lines.
Fibonacci levels: Original (based on raw range) and Optimized (user-adjustable).
Session background coloring for Asia, Execution Window, and NY session.
Labels and lines for entry, SL, and TP targets.
Dynamic deletion of untriggered orders after execution window expires.
⚙️ How It Works:
The script calculates the Asian session range.
Projects Fibonacci levels from the range.
Waits for the 01:15 NY candle to close to validate a signal.
If valid, a limit entry order (BUY or SELL) is plotted at the selected level.
If price structure changes (e.g., breaks the high/low), reversal logic may activate.
If no trade is triggered, orders are cleared before the NY session.
🔔 Alerts:
Alerts trigger when a valid setup appears after 01:15 NY candle.
Optional alerts for order activation, SL/TP hit, or trade cancellation.
📝 Notes:
Intended for semi-automated or discretionary trading.
Best used on highly liquid markets like Forex majors or indices.
Script parameters include session times, Fib ratios, SL/TP settings, and reversal logic toggle.
Credits:
Developed by LANZ, this script merges traditional session-based analysis with Fibonacci tools and structured execution timing, offering a unique framework for morning volatility plays.
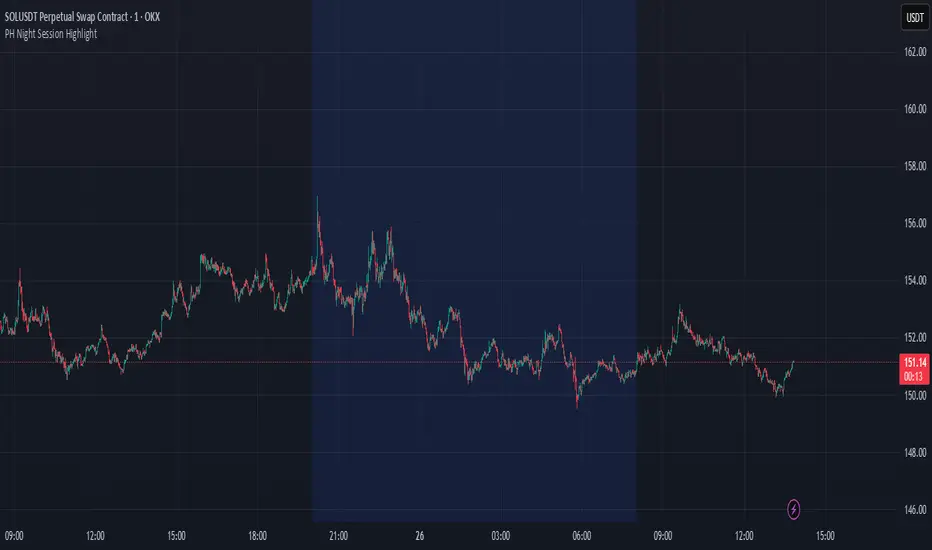
PH Night Session HighlightTraders who want to visually separate the night session on their charts. It highlights the period from 8:01 PM to 7:59 AM (Philippine Time), making it easy to distinguish off-hours or pre-market activity, especially when analyzing crypto or 24/7 markets.
The script automatically adjusts server time (UTC) to Philippine Time (UTC+8) and overlays a soft blue background during the specified time window.