Session Dominator — Asia • London • New York Precision ZonesRule the global market sessions.
Session Dominator is a precision-engineered indicator built for traders who want total clarity across Asia, London, and New York sessions.
It automatically plots:
🔷 Dynamic Session Boxes — visually map institutional killzones in real time
⚙️ Session Mean Line — track equilibrium and liquidity shifts
📊 EMA-50 Confluence — align directional bias and intraday trend
🎯 BSL / SSL Levels — reveal active liquidity sweeps and reversals
💡 Bias Engine — evaluates structure and locks the session bias automatically
Toggle between Asia / London / New York / Overlap / Custom modes to dominate any timezone.
Designed with minimalist visuals, high precision, and ICT-based logic — this tool helps you anticipate where liquidity will be taken before it happens.
✳️ For XAUUSD traders, scalpers, and ICT-style analysts seeking sniper-level clarity.
Recherche dans les scripts pour "session"

Session Range Breakouts With Targets [AlgoAlpha]⛓️💥Session Range Breakouts With Targets 🚀
Introducing the "Session Range Breakouts With Targets" indicator by AlgoAlpha, a powerful tool for traders to capitalize on session-based range breakouts and identify precise target zones using ATR-based calculations! Whether you trade the Asian, American, European, or Oceanic sessions, this script highlights key breakout levels and targets that adapt to market volatility, ensuring you're always prepared for those crucial price movements. 🕒📊
Session-based Trading : The indicator highlights session-specific ranges, offering clear breakouts for Asian, American, European, Oceanic, and even custom sessions 🌍.
Adaptive Volatility Zones : Uses ATR to determine dynamic zone widths, filtering out fakeouts and adjusting to market conditions ⚡.
Precise Take-Profit Targets : Set multiple levels of take-profits based on ATR multipliers, ensuring you can manage both aggressive and conservative trades 🎯.
Customizable Appearance : Tailor the look with customizable colors for session highlights and breakout zones to fit your chart style 🎨.
Alerts on Key Events : Built-in alert conditions for breakouts and take-profit hits, so you never miss a trading opportunity 🔔.
🚀 Quick Guide to Using the Indicator
🛠 Add the Indicator : Add the indicator to favorites by pressing the star icon. Choose your session (Asia, America, Europe, Oceana, or Custom) and adjust the ATR length, zone width multiplier, and target multipliers to suit your strategy.
📊 Analyze Breakouts : Watch for the indicator to plot upper and lower range boxes based on session highs and lows. Price breaking through these boxes will signal a potential entry.
📈 Monitor Targets : Track bullish and bearish targets as price moves, with up to three take-profit levels based on ATR multipliers.
🔔 Set Alerts : Enable alerts for session breakouts or when price hits your designated take-profit targets.
🔍 How It Works
This script operates by identifying session-specific ranges based on highs and lows from the beginning of the selected session (Asia, America, Europe, or others). After a user-defined wait period (default: 120 bars), it calculates the highest and lowest points and creates upper and lower zones using the Average True Range (ATR) to adapt to market volatility. If the price breaks above or below these zones, it is identified as a breakout, and the script dynamically calculates up to three take-profit targets for both bullish and bearish scenarios using an ATR multiplier. The indicator also includes alerts for breakouts and take-profit hits, providing real-time trading signals.

Session/Day VWAP & Std Dev Bands/VWAP and Standard Deviation Bands for intra-day & Day sessions
/Intra-day sessions be default are set to crypto
- Asia session
- London Session
- New York Session
- Close Session
Day broken up into sessions as a 24 hour period consists of different market participants and therefore different behaviour.

Session Volume Profile [KTY] Session Volume Profile
Hi, I'm Kim Thank You 👋
KTY = Kim Thank You (김땡큐)
Analyzes volume by price level for selected periods (Daily/Weekly/Monthly/Quarterly/Yearly) and displays the volume profile.
━━━━━━━━━━━━━━━━━━━━━━━━━━━━━━━
📊 FEATURES
- Volume Profile Analysis
- Breaks down volume by price zones
- Separates bullish (green) and bearish (red) volume
- POC (Point of Control)
- Red line showing highest volume price level
- Key support/resistance zone
- HVN (High Volume Node)
- Top 20% volume zones displayed darker
- Areas where price may consolidate
- Session Box
- Displays price range for each session
- Session label shows period type
━━━━━━━━━━━━━━━━━━━━━━━━━━━━━━━
✅ HOW TO USE
- Watch for strong S/R reactions near POC
- High volume zones → possible consolidation
- Low volume zones → rapid price movement likely
- Confluence with other levels increases reliability
━━━━━━━━━━━━━━━━━━━━━━━━━━━━━━━
💡 TIPS
- Choose session type based on your trading timeframe
- Lower timeframes work better with shorter sessions
- Higher timeframes work better with longer sessions
- Combine with other S/R tools for confirmation
━━━━━━━━━━━━━━━━━━━━━━━━━━━━━━━
⚠️ DISCLAIMER
This indicator is for educational purposes only.
Not financial advice. Always do your own research.

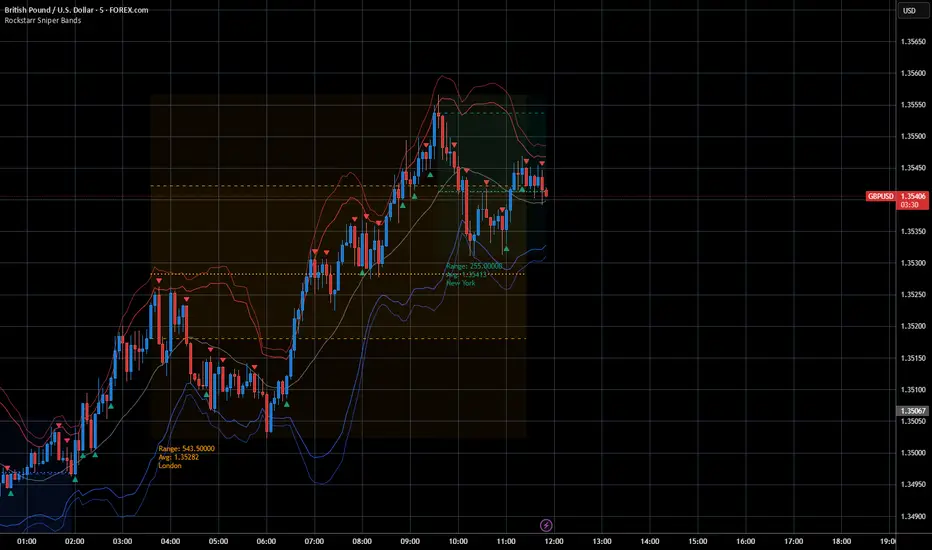
Session Sniper Bands — Pro Overlay (Bollinger, Sessions, Engulf)The Session Sniper Bands — Pro Overlay combines three powerful tools into one clean, professional script designed to help traders spot high-probability setups across any market.
📌 What’s included:
Dual Bollinger Bands → track volatility squeezes, expansions, and mean reversion zones.
Customizable Trading Sessions (Tokyo / London / New York) → shaded regions with editable names, open/close lines, range, and average price markers.
Engulfing Candlestick Signals → automatic bullish and bearish engulfing arrows for precision entry timing.
✨ Features:
Session names and times are fully customizable (rename “Tokyo” to “Asia Open,” etc.).
Clear OB/OS volatility cues via Bollinger stack.
Lightweight visuals that won’t clutter your chart.
Works across Forex, Crypto, Indices, and Binary Options.
⚡ Why use it?
This overlay is built for traders who want to snipe entries with session context. Spot when volatility contracts, align with session flows, and confirm with engulfing momentum candles — all in one view.
⚠️ Disclaimer: This script is for educational purposes only and is not financial advice. Always test on demo before trading live.
Sessions & Key LevelsAn indicator made to show:
- Session Open & Close Breaks
- Session Ranges/Outline (Lower transparency % in settings to show)
Session times are editable in settings.
- Session High's & Low's
- H1 High's & Low's
These are aligned with the Session Open & Close times. (Takes the H/L between the input times)
Lines will fade once price touches & will be deleted once the current session ends.
User can edit H1 pivot strength in settings.
- Session Activity Dashboard
Used to show which sessions are currently active. (Toggled off by default)
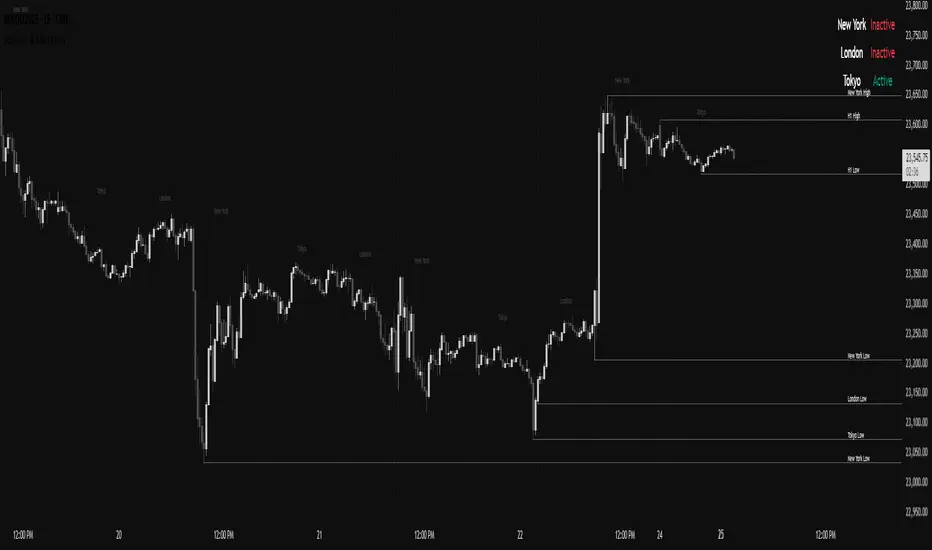
Session High/Low Sweeps ICT — Asian/London/NY (Big Sal Trades)Description:
This tool automatically tracks session or timeframe highs and lows, plots them on your chart, and removes them instantly when price sweeps or touches them — so you never deal with stale levels again.
⸻
Core Features
• Dynamic High/Low Plotting – Color-coded lines for multiple sessions or timeframes.
• Touch-to-Delete – Levels are deleted automatically when price touches or breaks them.
• Lookback Pruning – Remove old levels after a set number of bars/days.
• Multi-Timeframe Support – Works on intraday and higher timeframes.
• Custom Sensitivity – Choose tick buffer, wick vs close confirmation, and session types.
• No Repainting – Updates in real time, keeps your chart accurate.
⸻
Settings Instructions
Session Selection
• Toggle Asia, London, NY or other sessions you want to track.
Delete on Touch Settings
• Confirm Type:
• Wick – Delete as soon as price wick touches/breaks the level.
• Close – Delete only if candle closes beyond the level.
• Confirm Ticks:
• 0 – Instant deletion on touch.
• 1–2+ – Require price to exceed by this many ticks before deletion.
Lookback Settings
• Max Days/Bars: Remove levels older than this period.
Line Style Settings
• Customize color, style, and width for each session/timeframe to keep charts organized.
⸻
Tip:
Use a small tick confirmation for fast-moving markets like NASDAQ, and larger confirmation for slower assets. Combine with liquidity zones, order blocks, or SMC concepts for powerful trade confluence.
Session Candles NY #ffsjr"The candle bodies tell the story, wicks do the damage" by ICT
Based on ICT words, I created the sessions indicator, to facilitate the visualization of each session in candle format, with the most important points being the confluence of session openings and closings.
Usually I use to create support and resistances lines using candle sessions bodies and to draw sessions liquidities.
Use on 15 minutes chart and hide default TradingView candles.
Enjoy
Session Averages: Open, High, LowThis indicator allows for the user to specify an intraday time based range and calculate the average open price, average high price, and average low price for that session. The indicator plots the 5 most recent sessions on the chart, which allows for the user to identify fair value, Power of 3 movements, trends, and consolidations.
If bullish the user can identify when price is below the average open or low price of a range, and if bearish can identify when price is above the open or high of a range.

Session Ranges by CeleSimple indicator that shows the various daily sessions and includes a pip counter for every different session.

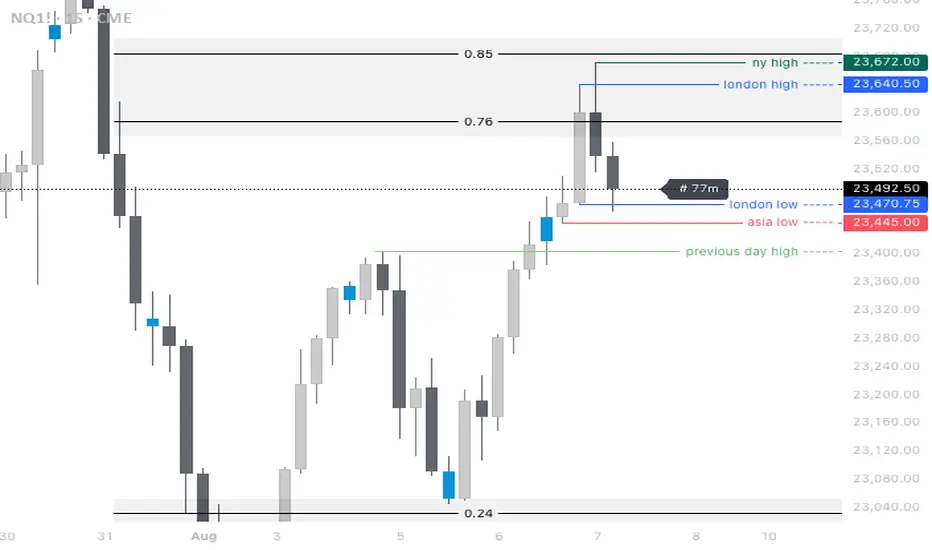
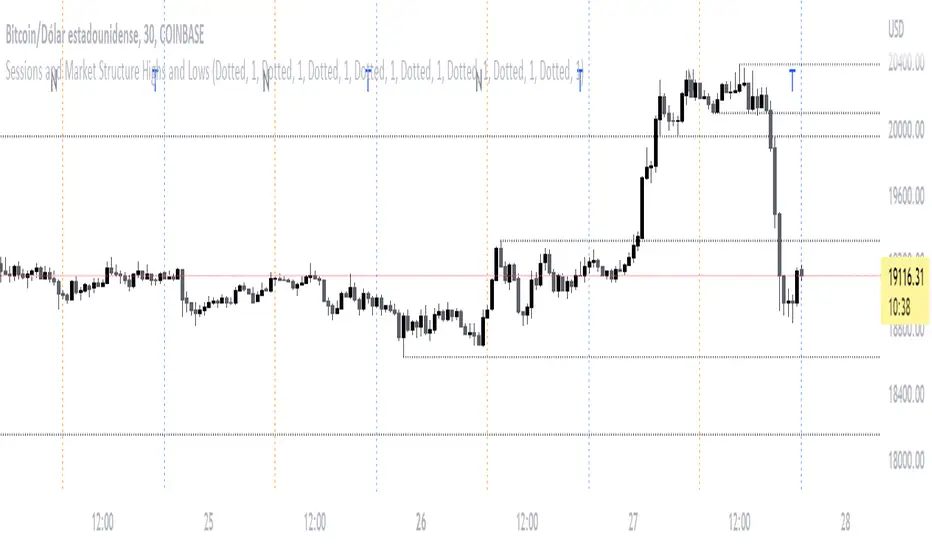
Sessions and Market Structure Highs and LowsThis Indicator has the purpose that traders can see the opening of the different sessions on the chart in a clean and visually pleasing way .
By a dding the script to your chart , vertical lines will automatically appear at the specific opening hours of each session
What schedules are used by the Script?
The New York session starts at 07:30 GMT and its line will be represented by the color Orange
Then for the London session the start is plotted at 03:30 GMT with the Gray line
And finally the Asia/Tokyo session at 19:00 GMT with its Blue color line
Keep in mind that the style of the line can be modified from the indicator settings , by the way in case you do not want to see the main letter of each session on the chart, you can also deactivate it from the settings
Also, in a very entertaining way, you will be able to see the Highs and Lows of the corresponding temporalities.
Sessions RangesAn indicator that displays each trading session. Each box represents a single session (Asian, London and NY) and their respective overlaps.

Session Range Boxes(MTF)📦 Indicator Name
Session Range Boxes (MTF)
Multi-Timeframe Directional Session Range Visualization
📘 Description
Session Range Boxes (MTF) is a multi-timeframe market structure tool that visually highlights price range behavior across different time sessions using clean, directional range boxes.
Each box represents the High–Low range of a completed or live session, automatically colored based on directional bias:
🟢 Bullish → Session Close > Session Open
🔴 Bearish → Session Close < Session Open
⚪ Neutral → Session Close = Session Open
This allows traders to instantly identify trend strength, balance zones, volatility expansion, and key support/resistance areas across multiple timeframes — all on a single chart.
🔍 What This Indicator Shows
For every enabled timeframe, the indicator:
Draws a range box from session open to session close
Continuously updates live session High & Low
Locks the final color once the session completes
Keeps historical boxes for structure and context
Supported timeframes:
Quarterly
Half-Yearly
Yearly
Monthly
Weekly
Daily
Hourly
30-Minute
15-Minute
5-Minute
⚙️ Default Behavior
By default, the indicator enables:
Weekly
Daily
Hourly
This default setup is intentionally chosen to suit most traders and provides:
Higher-timeframe structure (Weekly)
Swing context (Daily)
Intraday execution levels (Hourly)
🧠 How to Use It Effectively
📈 Higher-Timeframe Analysis (Swing / Positional Trading)
Recommended combinations:
Weekly + Daily
Monthly + Weekly
Use cases:
Identify dominant market bias
Spot compression vs expansion
Define higher-timeframe support & resistance zones
⚡ Intraday Trading (Day Trading)
Recommended combinations:
Daily + Hourly
Hourly + 30-Minute
Use cases:
Track intraday range development
Identify directional day types
Trade breakouts, rejections, or mean-reversion within session ranges
🚀 Scalping & Precision Entries
Recommended combinations:
Hourly + 15-Minute
30-Minute + 5-Minute
Use cases:
Fine-tune entries within larger session ranges
Align lower-timeframe trades with higher-timeframe bias
Spot micro range expansion and contraction
🎨 Customization Options
Bullish / Bearish / Neutral colors
Box fill transparency
Border transparency & color
Maximum historical boxes per timeframe
This allows you to keep charts clean, lightweight, and performance-friendly.
💡 Best Practices
Avoid enabling too many timeframes at once — clarity beats clutter
Use higher-timeframe boxes for bias, lower-timeframe boxes for entries
Combine with:
Market structure
Volume
VWAP
Liquidity concepts
Price action confirmation
Session Range Boxes (MTF) is a clean, powerful visual tool designed to help traders:
Understand session-based price behavior
Align trades across timeframes
Improve structure awareness without clutter
Whether you are a scalper, day trader, or swing trader, this indicator adapts seamlessly to your workflow.

Sessions CET Asia, London, New YorkThis indicator displays the Asia, London, and New York trading sessions in CET time.
Each session is shown with a background highlight and optional labels, making it easy to visualize global market activity and session overlaps.
Useful for intraday traders, breakout strategies, liquidity analysis, and volume-based setups.
Features:
Correct session times adjusted to CET
Visual background zones for Asia, London, New York
Clean layout, minimal visual noise
Supports any timeframe
Helps identify volatility peaks, session opens, and market structure shifts

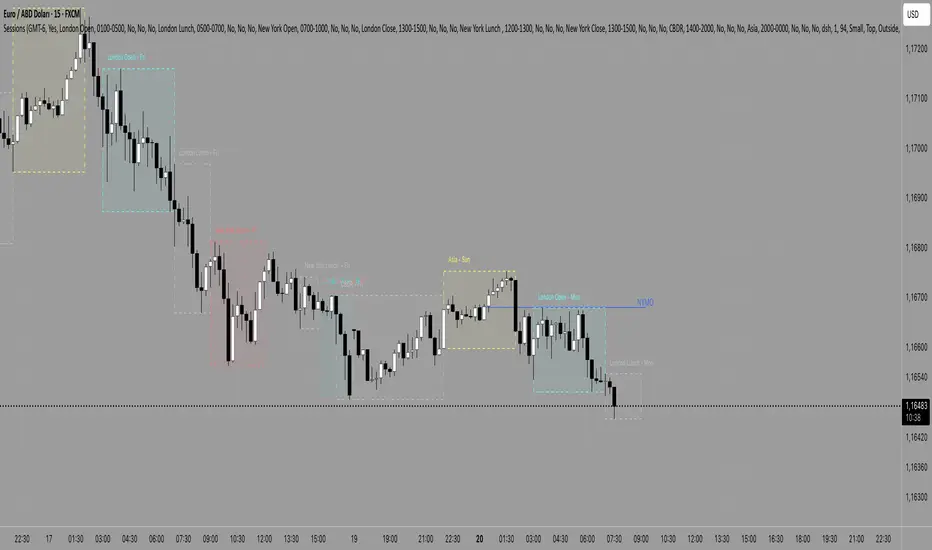
Sessions Indicator(clean))🔰 True Day Open + Asian / London / NY Session Levels
Intraday Market Structure & Session Liquidity Indicator
This indicator automatically plots the True Day Opening Price, Asian Session High & Low, London Session High & Low, and New York Session Open — helping you understand daily directional bias, session liquidity zones, and potential reversal levels.
📌 What It Does
✔ Plots True Day Open (not broker-based — captures real market direction)
✔ Marks Asia Session High & Low – accumulation zone
✔ Marks London Session High & Low – expansion zone
✔ Shows New York Session Open – reversal / continuation zone
✔ Works on any chart: Forex, Indices, Crypto, Commodities
✔ Ideal for ICT / SMC / Day Trading / Scalping
✔ Fully customizable colors & display options
🧠 Why It’s Useful
The market often moves in this sequence:
➡ Asia → consolidation
➡ London → expansion / breakout
➡ New York → reversal OR continuation
This indicator helps you see this structure clearly, allowing traders to:
Avoid fake breakouts
Understand the daily bias earlier
Trade liquidity grabs & session-to-session transitions
Time entries with precision
📌 Best Timeframes
M5 / M15 / M30 → Scalping & intraday setups
H1 / H4 → Market structure view
Daily → Session zone backtesting
⚙ Inputs & Customization
Enable/Disable each session
Change session time manually
Color settings
Line styles: solid / dashed / background zones
🧠 Suggested Trading Concepts
Works great with:
Smart Money Concepts (SMC)
ICT Models
Liquidity Sweep Strategy
Session Breakout Trading
Mean Reversion Trading
📈 How to Use
Wait for Asian Range
Trade break of Asian High/Low during London
At NY Open, check for reversal or continuation
Use True Day Open for directional bias
Look for liquidity sweeps near session levels
📢 Coming Soon (Next Update)
🔔 Session Break Alerts
📊 Liquidity Sweep Labels

Sessions with timeframe filter🕒 Smart Timeframe Filtering
This session indicator includes an automatic filter that disables all session boxes when the chart timeframe is greater than the user-defined input. This helps keep higher-timeframe charts clean and focused by hiding intraday sessions when they’re no longer relevant — especially helpful for multi-timeframe traders.
🔍 Features:
📦 Draws up to 3 customizable session boxes with dynamic high/low tracking.
⏱️ Auto-disables on higher timeframes (Smart Timeframe Filter).
🌍 Fully customizable session times, box colors, and time zone (GMT-based).
⚡ Optimized for performance using lightweight, non-overlapping box logic.
👨🍳 UI is organized like a chef’s kitchen: clean, intuitive, and easy to navigate. Settings are grouped and filtered to avoid clutter.
✅ Best Use:
This indicator is most useful for intraday traders on 1m–15m charts.
It’s designed to keep your workspace clean on 30m+ charts or whatever threshold you define.

Session ColorWith this indicator you can see :
The active zone in the market.
The dead zone in the market.
The purpose of this indicator is to trade the active zone.

Session By BullancePrime Multi-Session VisualizerThe Session BullancePrime indicator allows you to visualize the major trading sessions (Asia, London, New York) directly on your chart. It provides:
✅ Customizable session times in AM/PM or 24-hour format
✅ Enable/disable each session independently
✅ Background highlighting for each session
✅ Open line, high/low tracking, vertical line, and midline for precise session analysis
✅ Midline centered on the session range, updating in real-time
✅ Fully customizable colors, line styles, and widths
Use it to identify key trading ranges, session overlaps, and potential breakout zones across global markets. Ideal for day traders, swing traders, and anyone looking to analyze session-based price action.

Session Levels + PDH/PDL (Adjustable, v6 fixed) 📊 Session Levels + PDH/PDL (Adjustable)
This indicator plots key intraday reference levels based on major market sessions and the previous day’s range. It is designed for traders who rely on session highs/lows, liquidity levels, and market structure rather than indicators like EMAs or oscillators.
🔹 What it shows
Asia Session High & Low
UK (London) Session High & Low
New York Session High & Low
Previous Day High (PDH) & Previous Day Low (PDL)
Each level is drawn as a horizontal line and can optionally include a label for quick identification.
⚙️ Fully adjustable
Session times for Asia, UK, and New York are fully editable
Custom colors for each session and PDH/PDL
Show / hide toggles for each session individually
Adjustable line width and right-side extension
Optional session background shading with adjustable transparency
Optional labels for all levels
🕒 Timezone handling
Uses a user-defined timezone (default: Europe/Dublin)
Works on any intraday timeframe
Session logic is replay-safe and does not repaint past levels
🎯 How traders typically use it
Identify liquidity pools at session highs/lows
Use PDH/PDL as targets, reactions, or bias levels
Combine with price action, market structure, ORBs, or ICT-style models
Mark London and NY expansions after Asia range is set
✅ Designed for
Futures traders (ES, NQ, YM, Gold)
Forex and indices
Intraday & session-based strategies
Traders who want clean charts with meaningful levels only

Session Candle Hunter 🎯🎯 Session Candle Hunter — Precision Session Mapping for Smart Traders
Session Candle Hunter 🎯 is a powerful tool designed to help traders identify and track the most important session candle of the trading day—commonly used for liquidity grabs, range mapping, volatility zones, and breakout anticipation.
Whether you trade NY session, London session, or custom time windows, this indicator automatically detects the candle at your chosen New York Time, extracts its high and low, and visually projects these levels into the current session.
🔍 What This Indicator Does
1️⃣ Detects the Key Session Candle
You select:
Hour of the candle (NY Time)
Candle timeframe (1H, 4H, 15m, etc.)
The script automatically:
Identifies the candle when it forms
Stores its High/Low
Prepares levels for visual projection
🎨 2️⃣ Highlights the Candle Zone
Optionally displays a colored zone (box) between the candle’s high and low:
Helps visualize the liquidity pocket
Useful for session traps, expansion moves, and fair value interpretation
You can choose:
Zone color
Whether to show it or not
Whether it should update only for the latest candle
📈 3️⃣ Draws High/Low Lines With Extensions
High and Low of the detected candle can be plotted as:
Standard lines
Or infinitely extended to the right
Great for identifying:
Breakouts
Retests
Range boundaries
Session expansion models
Optional labels display exact price levels.
🕐 4️⃣ Delayed Display Logic
The indicator only shows levels after a user-defined NY time.
For example:
Show lines only after 8:30 NY — perfect for traders who want pre-session levels hidden until relevant.
🔄 5️⃣ “Show Only Last” Mode
A clean, uncluttered mode that removes all historical drawings and only displays:
The latest zone
The latest high/low lines
Latest labels
Perfect for minimal-chart traders.
⚠️ 6️⃣ Alert System
Receive alerts the moment the targeted session candle forms:
“New Candle Detected”
🧾 7️⃣ Info Panel (Top-Left Corner)
Displays:
Target session hour
Display start time
Candle timeframe
Stored High/Low
Indicator name
Always visible and automatically updates.
⭐ Why Traders Love This Tool
✔ Helps visualize major liquidity zones
✔ Works on all markets & timeframes
✔ Perfect for ICT-style session concepts
✔ Helps anticipate session expansion
✔ Automates manual level drawing
✔ Clean visuals with optional minimal mode

Session Liquidity Levels – Indicator for Smart Day Traders🧭 Session Liquidity Levels – Indicator for Smart Day Traders
Identify Key Market Liquidity Zones with Precision
The Session Liquidity Levels indicator automatically plots the most important market levels every day — giving you a clear view of where liquidity is building and where potential reversals or breakouts can occur.
This tool is designed for traders who rely on session structure and clean market levels rather than noise or lagging indicators.
⚙️ Features
✅ Asia Session High & Low – See the overnight range where liquidity starts building.
✅ London Session High & Low – Track the major volatility window and identify sweeps or fakeouts.
✅ Previous Day High & Low – Key reference points for continuation or reversal plays.
✅ Custom Colors & Styling – Personalize line colors and styles to fit your chart theme.
✅ Lightweight & Fast – Built in Pine Script v5 for smooth performance on all assets.
📊 How It Helps
Quickly visualize session highs/lows to plan liquidity grabs or breakout entries.
Mark daily structure without manually drawing lines.
Combine with your existing strategy to refine entry and exit timing.
Works on Forex, Indices, and Metals across all intraday timeframes.
⚡ Best For
Day traders who use session-based strategies (like Asia → London → New York transitions).
Traders studying liquidity sweeps, breakouts, or market structure shifts.
Anyone who wants a clean, automatic way to see session boundaries and key highs/lows.
🕌 Ethical Note
This indicator is 100% original, independently coded, and inspired by common trading concepts such as session ranges and daily structure.
It is not affiliated with or copied from any other paid indicators.
💰 Access
Available as an Invite-Only Script on TradingView.
Once purchased, you’ll receive access within 24 hours.
📩 Support
If you have any issues or want custom modifications (extra sessions, alerts, etc.), contact me directly — I’ll help you set it up.
Trade smarter. Stay disciplined. Let your levels guide you.

Session VWAP & ATR H/L ZonesThis script is a comprehensive tool for day traders, designed to visualize key price levels and zones based on volume and volatility within a specific trading session.
Traders would use your script to identify potential areas of support and resistance, gauge the session's trend, and spot opportunities for mean reversion or breakout trades.
Core Concepts Explained
Your script plots three main types of information on the chart, each serving a different purpose for a trader.
1. Session VWAP (Volume-Weighted Average Price) 📈
What it is: The yellow line is the VWAP, which is the average price of an asset for the current trading session, weighted by the volume traded at each price level. It essentially shows the "fair" price for the day according to the market's activity.
How it's used:
Trend Gauge: If the price is consistently trading above the VWAP, it's generally considered a bullish intraday trend. If it's below, the trend is bearish.
Dynamic Support/Resistance: During a trend, traders often look for the price to pull back to the VWAP to find an entry point (e.g., buying a dip to the VWAP in an uptrend).
VWAP Bands: The optional gray, red, and green bands are standard deviations from the VWAP. They measure how far the price has strayed from its "fair value."
2. ATR High/Low Zones (Support & Resistance) 🎯
What they are: These are the shaded green and red areas at the top and bottom of the session's price range.
The red zone (resistance) is calculated by taking the session's current high and subtracting a value based on the Average True Range (ATR), which is a measure of recent volatility.
The green zone (support) is calculated by taking the session's current low and adding the ATR-based value.
How they're used: These are not just lines; they are zones of interest.
Profit-Taking Areas: A trader who is long might consider taking profits when the price enters the red resistance zone.
Reversal Signals: When the price enters one of these zones and shows signs of stalling (e.g., with specific candlestick patterns), it could signal a potential reversal.
3. Previous Session High & Low 📊
What they are: The script plots the high and low from the previous trading session as straight horizontal lines (teal and fuchsia by default).
How they're used: These are extremely significant static levels that many traders watch.
Price Magnets: Price is often drawn to these levels.
Key Inflection Points: A decisive break above the previous day's high can signal strong bullish momentum. Conversely, a failure to break it can indicate weakness. These levels frequently act as strong support or resistance.
