Market Sessions and OverlapsMarket Sessions and Overlaps Indicator
This script, titled " Market Sessions and Overlaps ," provides a detailed visualization of major global trading sessions—Asia, Europe, and New York—along with the periods where these sessions overlap. It is designed to assist traders in understanding session timings and overlaps in their local time zone. Key features include:
Session Visualization: Highlights the Asia, Europe, and New York trading sessions directly on the chart with customizable colors and transparency for better clarity.
Overlap Identification: Marks the overlapping periods between Asia-Europe and Europe-New York sessions, where market activity often intensifies, with distinct candle colors.
Time Zone Support: The script allows users to select their local time zone, ensuring all session times are displayed accurately, no matter the user’s location.
Alerts for Key Events: Includes optional alerts to notify users of session openings, closings, and the start or end of overlap periods.
This indicator serves as a visual tool for tracking session-specific activity and liquidity. It is configurable to match individual preferences, enabling better alignment with trading strategies.
Disclaimer: This script is for informational purposes only and does not provide financial advice. Please consult a licensed financial advisor for personalized trading guidance.
Recherche dans les scripts pour "sessions"
Day Trading Booster by DGTTiming when day trading can be everything
In Stock markets typically more volatility (or price activity) occurs at market opening and closings
When it comes to Forex (foreign exchange market), the world’s most traded market, unlike other financial markets, there is no centralized marketplace, currencies trade over the counter in whatever market is open at that time, where time becomes of more importance and key to get better trading opportunities. There are four major forex trading sessions, which are Sydney , Tokyo , London and New York sessions
Forex market is traded 24 hours a day, 5 days a week across by banks, institutions and individual traders worldwide, but that doesn’t mean it’s always active the entire day. It may be very difficult time trying to make money when the market doesn’t move at all. The busiest times with highest trading volume occurs during the overlap of the London and New York trading sessions, because U.S. dollar (USD) and the Euro (EUR) are the two most popular currencies traded. Typically most of the trading activity for a specific currency pair will occur when the trading sessions of the individual currencies overlap. For example, Australian Dollar (AUD) and Japanese Yen (JPY) will experience a higher trading volume when both Sydney and Tokyo sessions are open
There is one influence that impacts Forex matkets and should not be forgotten : the release of the significant news and reports. When a major announcement is made regarding economic data, currency can lose or gain value within a matter of seconds
Cryptocurrency markets on the other hand remain open 24/7, even during public holidays
Until 2021, the Asian impact was so significant in Cryptocurrency markets but recent reasearch reports shows that those patterns have changed and the correlation with the U.S. trading hours is becoming a clear evolving trend.
Unlike any other market Crypto doesn’t rest on weekends, there’s a drop-off in participation and yet algorithmic trading bots and market makers (or liquidity providers) can create a high volume of activity. Never trust the weekend’ is a good thing to remind yourself
One more factor that needs to be taken into accout is Blockchain transaction fees, which are responsive to network congestion and can change dramatically from one hour to the next
In general, Cryptocurrency markets are highly volatile, which means that the price of a coin can change dramatically over a short time period in either direction
The Bottom Line
The more traders trading, the higher the trading volume, and the more active the market. The more active the market, the higher the liquidity (availability of counterparties at any given time to exit or enter a trade), hence the tighter the spreads (the difference between ask and bid price) and the less slippage (the difference between the expected fill price and the actual fill price) - in a nutshell, yield to many good trading opportunities and better order execution (a process of filling the requested buy or sell order)
The best time to trade is when the market is the most active and therefore has the largest trading volume, trading all day long will not only deplete a trader's reserves quickly, but it can burn out even the most persistent trader. Knowing when the markets are more active will give traders peace of mind, that opportunities are not slipping away when they take their eyes off the markets or need to get a few hours of sleep
What does the Day Trading Booster do?
Day Trading Booster is designed ;
- to assist in determining market peak times, the times where better trading opportunities may arise
- to assist in determining the probable trading opportunities
- to help traders create their own strategies. An example strategy of when to trade or not is presented below
For Forex markets specifically includes
- Opening channel of Asian session, Europien session or both
- Opening price, opening range (5m or 15m) and day (session) range of the major trading center sessions, including Frankfurt
- A tabular view of the major forex markets oppening/closing hours, with a countdown timer
- A graphical presentation of typically traded volume and various forext markets oppening/clossing events (not only the major markets but many other around the world)
For All type of markets Day Trading Booster plots
- Day (Session) Open, 5m, 15m or 1h Opening Range
- Day (Session) Referance Levels, based on Average True Range (ATR) or Previous Day (Session) Range (PH - PL)
- Week and Month Open
Day Trading Booster also includes some of the day trader's preffered indicaotrs, such as ;
- VWAP - A custom interpretaion of VWAP is presented here with Auto, Interactive and Manual anchoring options.
- Pivot High/Low detection - Another custom interpretation of Pivot Points High Low indicator.
- A Moving Average with option to choose among SMA, EMA, WMA and HMA
An example strategy - Channel Bearkout Strategy
When day trading a trader usually monitors/analyzes lower timeframe charts and from time to time may loose insight of what really happens on the market from higher time porspective. Do not to forget to look at the larger time frame (than the one chosen to trade with) which gives the bigger picture of market price movements and thus helps to clearly define the trend
Disclaimer : Trading success is all about following your trading strategy and the indicators should fit within your trading strategy, and not to be traded upon solely
The script is for informational and educational purposes only. Use of the script does not constitutes professional and/or financial advice. You alone the sole responsibility of evaluating the script output and risks associated with the use of the script. In exchange for using the script, you agree not to hold dgtrd TradingView user liable for any possible claim for damages arising from any decision you make based on use of the script

IU Time SessionsDISCRIPTION
IU Time Sessions is a multi–market session indicator designed to visually highlight major global trading sessions directly on your chart.
It helps traders easily identify when Tokyo, London, New York, and Sydney sessions are active based on their selected time zone.
The indicator automatically adjusts session timings according to the chosen time zone, making it extremely useful for traders across different countries.
Each session is displayed with a customizable background color, allowing you to instantly recognize market behavior, volatility changes, and session overlaps.
In addition, session start alerts can be enabled so traders never miss the opening of important market hours.
USER INPUTS :
• Select Your Time Zone
Allows users to choose their local or preferred market time zone for accurate session calculation.
• Background Color Transparency
Adjust the transparency level of session background colors for better chart visibility.
• Enable / Disable Individual Sessions
Users can turn ON or OFF:
* Tokyo Session
* London Session
* New York Session
* Sydney Session
• Session Time Settings
Each session has customizable start and end times.
• Session Colors
Each trading session has its own selectable background color.
• Session Alerts
Optional alerts for:
* Tokyo session start
* London session start
* New York session start
* Sydney session start
WHY IT IS UNIQUE:
• Fully time-zone adaptive (works globally)
• Supports all major forex and crypto trading sessions
• Clean background visualization without clutter
• Custom session timing flexibility
• Individual session enable/disable control
• Session start alerts without repainting
• Works on all timeframes
• Lightweight and optimized Pine Script v6 code
Unlike basic session indicators, this tool focuses on clarity, flexibility, and accurate time-zone conversion — making it suitable for both beginners and professional traders.
HOW USER CAN BENIFIT FROM IT :
• Easily identify high-liquidity market hours
• Understand session-based price behavior
• Spot session overlaps for increased volatility
• Improve timing for entries and exits
• Avoid low-volume trading periods
• Use alerts to stay disciplined and prepared
• Suitable for forex, crypto, indices, and commodities
This indicator helps traders align their strategies with institutional trading hours and make better-timed trading decisions.

MP SESSIONS, DST, OTTHere’s a clear description you can use for this script (for yourself or as a TradingView “Indicator Description”):
---
### MP SESSIONS, DST, OTT – What this indicator does
This script is a **multi-session market timing tool** that:
1. **Draws full trading sessions on the chart** (Asia, Sydney, Tokyo, Shanghai, Europe, London, New York, NYSE)
2. **Automatically adjusts for Daylight Saving Time (DST)** for Sydney, London, and New York
3. **Shows a live info table** with session times, DST status, and whether each session is currently open or closed
4. **Adds optional custom “OTT” vertical lines** at user-defined intraday times (for your own models, killzones, or time blocks)
---
### Main Features (high level)
#### 1. Market mode & time zone handling
* **Market Mode**:
* `Forex`
* `Stock`
* `User Custom` (you type your own session ranges)
* `TFlab suggestion` (predefined “optimized” session times)
* **Time Zone Mode**:
* `UTC`
* `Session Local Time` (local exchange time: Sydney, Tokyo, London, New York etc.)
* `Your Time Zone` (converts to the user-selected TZ, e.g. `UTC-4:00`)
* Handles separate time zones for:
* Asia, Sydney, Tokyo, Shanghai, Europe, London, New York, NYSE
* Has logic to **recalculate session start/end depending on DST** and the chosen mode.
---
#### 2. Daylight Saving Time (DST) engine
The function `DST_Detector`:
* Calculates when DST **starts and ends** for:
* `Australia/Sydney`
* `Europe/London`
* `America/New_York`
* Detects the correct Sunday (2nd, 4th, etc.) for start/end using day-of-week and week counts.
* Returns `'Active'` or `'Inactive'` for each region.
* These values are then used to **shift the sessions** (e.g. New York 13:00–21:00 vs 12:00–20:00 in UTC).
The script can also **draw vertical lines** on the chart when DST starts/ends and label them:
* “Sydney DST Started / Ended”
* “London DST Started / Ended”
* “New York DST Started / Ended”
---
#### 3. Session timing & sessions on the chart
The function `Market_TimeZone_Calculator`:
* Based on **Market Mode** + **Time Zone Mode** + **DST state**, it returns:
* Time ranges for: Sydney, Tokyo, Shanghai, Asia (combined), Europe, London, New York, NYSE
* These ranges are in `"HHMM-HHMM"` format.
Then the script:
* Converts these to `time()` conditions using the proper time zone
* Creates boolean series like `On_sesAsia`, `On_sesEurope`, `On_sesNewYork`, etc., which are **1 when the session is open and 0 when closed**.
---
#### 4. Session high/low boxes & labels
The function `LowHighSessionDetector`:
* Tracks **high and low of each session** while it’s active.
* When a new session starts:
* Resets and starts recording the session high/low.
* While session is active:
* Updates `High` with the max of current bar high and previous session high.
* Updates `Low` with the min of current bar low and previous session low.
* When the session is "on":
* Draws a **box** from session low to high (`box.new`) and extends it to the right as long as the session continues.
* Places a **label with session name** (Asia, London, New York, etc.) near the high:
* Style depends on the session (down/right/left).
You have visibility toggles per session:
* `Asia Session`, `Sydney Session`, `Tokyo Session`, `Shanghai Session`, `Europe Session`, `London Session`, `New York Session`, `NYSE` (for TFlab mode).
So you visually see:
* A shaded box for each session
* The full H/L range for that session
* A text label with the session name.
---
#### 5. Info table
The indicator builds a **table in a corner of the chart** showing:
* Header:
* “FOREX Session”, “Stock Market Trading Hours”, “User Custom Session”, or “TFlab suggestion” depending on mode.
* Columns:
1. Session name (Asia, Sydney, Tokyo, Shanghai, Europe, London, New York, NYSE)
2. DST status for that region (“Active 🌞 / Inactive 🍂 / Not Observed”)
3. Session **start time**
4. Session **end time**
5. Current **status** (“Open / Closed”, with green/red background)
The function `SplitFunction`:
* Parses the `"HHMM-HHMM"` strings for each session.
* Converts them into:
* Either raw times (if viewing in UTC/session local)
* Or converted times in **Your Time Zone** using `timestamp` and `hour/ minute` with `YourTZ`.
* Returns formatted `Start` and `End` strings like `9:30`, `13:00`, etc.
So the table is effectively a **live session schedule** that:
* Auto-adjusts to DST
* Can show times in your own time zone
* Shows which session is open right now.
---
#### 6. OTT vertical lines (custom intraday markers)
At the bottom, there is an **OTT section** which lets you draw up to **three sets of vertical lines** at specific times:
* Each OTT block has:
* Enable toggle (`Enable OTT 1/2/3`)
* Start hour & minute
* End hour & minute
* Color
* Global OTT settings:
* Line style: `Solid / Dashed / Dotted`
* Line width
* Toggle: “Show OTT Labels?”
Logic:
* `is_ott_time()` checks if current bar’s `hour` and `minute` match the OTT input time.
* `draw_ott()`:
* When the bar time matches, draws a **vertical line** through the candle from low to high (`extend.both`).
* Optionally adds a label above the bar, like `"OTT1 Start"`, `"OTT1 End"`, etc.
Use cases:
* Marking **open/close of your trading session**
* Defining **killzones**, news times, or custom model windows
* Visual anchors for your intraday routine (NY open, 10 AM candle, etc.)
---
### TL;DR
This indicator is a **session toolkit + DST engine + time markers**:
* **Visually paints the main global sessions** with boxes and labels.
* **Handles DST automatically** for Sydney, London, New York.
* **Shows a live table** with session times, DST status, and open/closed status in your time zone.
* **Adds up to three configurable vertical time markers (OTT)** for custom session windows or key times.
If you want, I can also write a **short version** (2–3 sentences) for the TradingView “Description” field.

Trading Sessions Low and HighVisualize and analyze different trading sessions (Tokyo, London, New York) on your charts.
Key Features:
Colored Session Zones: Displays colored rectangles to visually identify each active trading session
Smart High/Low Lines:
Draws horizontal lines at the highest and lowest points of each session
These lines automatically extend forward in time until a candle crosses them
Helps identify support/resistance levels created during each session
Detailed Session Information:
Range (difference between highest and lowest points)
Average price of the session
Open and close lines
Full Customization:
Choose the number of historical sessions to display (e.g., last 10, 20 sessions)
Line style and width for high/low lines
Enable/disable each element independently
Trading Benefits:
Identify liquidity zones created during each session
Spot key levels that continue to influence price after a session closes
Analyze volatility and price behavior across different sessions
Detect breakouts of important levels established during previous sessions

WorldCup Dashboard + Institutional Sessions© 2025 NewMeta™ — Educational use only.
# Full, Premium Description
## WorldCup Dashboard + Institutional Sessions
**A trade-ready, intraday framework that combines market structure, real flow, and institutional timing.**
This toolkit fuses **Institutional Sessions** with a **price–volume decision engine** so you can see *who is active*, *where value sits*, and *whether the drive is real*. You get: **CVD/Delta**, volume-weighted **Momentum**, **Aggression** spikes, **FVG (MTF)** with nearest side, **Daily Volume Profile (VAH/POC/VAL)**, **ATR regime**, a **24h position gauge**, classic **candle patterns**, IBH/IBL + **first-hour “true close”** lines, and a **10-vote confluence scoreboard**—all in one view.
---
## What’s inside (and how to trade it)
### 🌍 Institutional Sessions (Sydney • Tokyo • London • New York)
* Session boxes + a highlighted **first hour**.
* Plots the **true close** (first-hour close) as a running line with a label.
**Use:** Many desks anchor risk to this print. Above = bullish bias; below = bearish. **IBH/IBL** breaks during London/NY carry the most signal.
### 📊 CVD / Delta (Flow)
* Net buyer vs seller pressure with smooth trend state.
**Use:** **Rising CVD + acceptance above mid/POC** confirms continuation. Bearish price + rising CVD = caution (possible absorption).
### ⚡ Volume-Weighted Momentum
* Momentum adjusted by participation quality (volume).
**Use:** Momentum>MA and >0 → trend drive is “real”; <0 and falling → distribution risk.
### 🔥 Aggression Detector
* ROC × normalized volume × wick factor to flag **forceful** candles.
**Use:** On spikes, avoid fading blindly—wait for pullbacks into **aligned FVG** or for aggression to cool.
### 🟦🟪 Fair Value Gaps (with MTF)
* Detects up to 3 recent FVGs and marks the **nearest** side to price.
**Use:** Trend pullbacks into **bullish FVG** for longs; bounces into **bearish FVG** for shorts. Optional threshold to filter weak gaps.
### 🧭 24h Gauge (positioning)
* Shows current price across the 24h low⇢high with a mid reference.
**Use:** Above mid and pushing upper third = momentum continuation setups; below mid = sell the rips bias.
### 🧱 Daily Volume Profile (manual per day)
* **VAH / POC / VAL** derived from discretized rows.
**Use:** **POC below** supports longs; **POC above** caps rallies. Fade VAH/VAL in ranges; treat them as break/hold levels in trends.
### 📈 ATR Regime
* **ATR vs ATR-avg** with direction and regime flag (**HIGH / NORMAL / LOW**).
**Use:** HIGH ⇒ give trades room & favor trend following. LOW ⇒ fade edges, scale targets.
### 🕯️ Candle Patterns (contextual, not standalone)
* Engulfings, Morning/Evening Star, 3 Soldiers/Crows, Harami, Hammer/Shooting Star, Double Top/Bottom.
**Use:** Only with session + flow + momentum alignment.
### 🤝 Price–Volume Classification
* Labels each bar as **continuation**, **exhaustion**, **distribution**, or **healthy pullback**.
**Use:** Align continuation reads with trend; treat “Price↑ + Vol↓” as a caution flag.
### 🧪 Confluence Scoreboard & B/S Meter
* Ten elements vote: 🔵 bull, ⚪ neutral, 🟣 bear.
**Use:** Execution filter—take setups when the board’s skew matches your trade direction.
---
## Playbooks (actionable)
**Trend Pullback (Long)**
1. London/NY active, Momentum↑, CVD↑, price above 24h mid & POC.
2. Pullback into **nearest bullish FVG**.
3. Invalidate under FVG low or **true-close** line.
4. Targets: IBH → VAH → 24h high.
**Range Fade (Short)**
1. Asia/quiet regime, **Price↑ + Vol↓** into **VAH**, ATR low.
2. Nearest FVG bearish or scoreboard skew bearish.
3. Invalidate above VAH/IBH.
4. Targets: POC → VAL.
**News/Impulse**
Aggression spike? Don’t chase. Let it pull back into the aligned FVG; require CVD/Momentum agreement before entry.
---
## Alerts (included)
* **Bull/Bear Confluence ≥ 7/10**
* **Intraday Target Achieved** / **Daily Target Achieved**
* **Session True-Close Retests** (Sydney/Tokyo/London/NY)
*(Keep alerts “Once per bar” unless you specifically want intrabar triggers.)*
---
## Setup Tips
* **UTC**: Choose the reference that matches how you track sessions (default UTC+2).
* **Volume threshold**: 2.0× is a strong baseline; raise for noisy alts, lower for majors.
* **CVD smoothing**: 14–24 for scalps; 24–34 for slower markets.
* **ATR lengths**: Keep defaults unless your asset has a persistent regime shift.
---
## Why this framework?
Because **timing (sessions)**, **truth (flow)**, and **location (value/FVG)** together beat any single signal. You get *who is trading*, *how strong the push is*, and *where risk lives*—on one screen—so execution is faster and cleaner.
---
**Disclaimer**: Educational use only. Not financial advice. Markets are risky—backtest and size responsibly.

Trading Sessions with TableTrading Sessions with Table is a dynamic TradingView indicator that displays the status of major global trading sessions directly on your chart. The script features a customizable table listing key sessions—Sydney, Tokyo, London, and New York—along with their open and close times and current status ("Open" or "Closed").
Key features include:
Custom Time Inputs: Easily set your session times by entering HH:MM formatted strings.
Dynamic Timestamps: The script calculates session timestamps for the current day and automatically adjusts for sessions that span midnight.
Visual Cues: Active sessions are highlighted with distinct background colors for quick reference.
Alert Conditions: Built-in alerts notify you when each session starts and ends, so you can stay informed of market shifts.
Ideal for traders managing multi-market strategies, this tool offers a clear, at-a-glance overview of session activity and helps streamline your trading decisions across different time zones.

Trading Sessions Highs/Lows | InvrsROBINHOODTrading Sessions Highs/Lows | InvrsROBINHOOD
🚀 A powerful indicator for tracking key trading sessions and the highs and lows of each session!
📌 Description
The Trading Sessions Highs/Lows indicator visually marks the most critical trading sessions—Asia, London, and New York—using small colored dots at the bottom of the candle. It also tracks and plots the highs and lows of each session, along with the Daily Open and Weekly Open levels.
This tool is designed to help traders identify session-based liquidity zones, price reactions, and potential trade setups with minimal chart clutter.
Key Features:
✅ Session markers (Asia, London, NY AM, NY Lunch, NY PM) plotted as small dots
✅ Plots session highs and lows for market structure insights
✅ Daily Open line for intraday reference
✅ Weekly Open line for higher timeframe bias
✅ Alerts for session high/low breaks to capture momentum shifts
✅ User-defined UTC offset for global traders
✅ Customizable session colors for personal preference
📖 How to Use the Indicator
1️⃣ Understanding the Sessions
Asia Session (Yellow Dot) → Marks liquidity buildup & pre-London moves
London Session (Blue Dot) → Strong volatility, breakout opportunities
New York AM Session (Green Dot) → Major trends & institutional participation
New York Lunch (Red Dot) → Low volume, ranging market
New York PM Session (Dark Green Dot) → End-of-day movements & reversals
2️⃣ Session Highs & Lows for Market Structure
Session Highs can act as resistance or breakout points.
Session Lows can act as support or stop-hunt zones.
Break of a session high/low with volume may indicate continuation or reversal.
3️⃣ Using the Daily & Weekly Open
The Daily Open (Black Line) helps gauge the intraday trend.
Above Daily Open → Bearish Bias
Below Daily Open → Bullish Bias
The Weekly Open (Red Line) sets the higher timeframe directional bias.
4️⃣ Alerts for Breakouts
The indicator will trigger alerts when price breaks session highs or lows.
Useful for setting stop-losses, breakout trades, and risk management.
💡 Why This Indicator is Important for Beginners
1️⃣ Avoids Overtrading:
Many beginners trade in low-volume periods (NY Lunch, Asia session) and get stuck in choppy price action.
This indicator highlights when volatility is high so traders focus on better opportunities.
2️⃣ Session-Based Liquidity Traps:
Market makers often run stops at session highs/lows before reversing.
Watching session breaks prevents traders from falling into liquidity grabs.
3️⃣ Reduces Emotional Trading:
If price is above the Daily Open, a beginner shouldn’t look for shorts.
If price is below a key session low, it may signal a fake breakout.
4️⃣ Aligns with Institutional Trading:
Smart money traders use session highs/lows to set stop hunts & reversals.
Beginners can use this indicator to spot these zones before entering trades.
🛡️ How to Mitigate Risk with This Indicator
✅ Wait for Confirmations – Don’t trade blindly at session highs/lows. Look for wicks, rejections, or break/retests.
✅ Use Stop-Loss Above/Below Session Levels – If you’re going long, set SL below a session low. If short, set SL above a session high.
✅ Watch Volume & News Events – Breakouts without strong volume or news may be fake moves.
✅ Combine with Other Strategies – Use price action, trendlines, or EMAs with this indicator for higher probability trades.
✅ Use the Weekly Open for Trend Bias – If price stays below the Weekly Open, avoid bullish setups unless key support holds.
🎯 Who is This Indicator For?
📌 Beginners who need clear session-based trading levels.
📌 Day traders & scalpers looking to refine their intraday setups.
📌 Smart money traders using liquidity concepts.
📌 Swing traders tracking higher timeframe momentum shifts.
🚀 Final Thoughts
This indicator is an essential tool for traders who want to understand market structure, liquidity, and volatility cycles. Whether you’re trading forex, stocks, or crypto, it helps you stay on the right side of the market and avoid unnecessary risks.
🔹 Set it up, customize your colors, define your UTC offset, and start trading smarter today! 🏆📈

FT SessionsFT Sessions
Overview
The FT Sessions is a highly customizable and powerful indicator designed for intraday traders who focus on session-based analysis. This script visually highlights global market sessions—Asia, Frankfurt, London, and New York (AM & PM)—on the chart, making it easier to track session ranges and analyze intraday price movements.
Key Features
Customizable Session Times and Colors:
Define your own session times and assign unique colors for better visibility.
Session Range Visualization:
Displays high and low ranges for each session.
Optional transparent range areas with outlines for clarity.
Configurable session range labels for enhanced readability.
Flexible Timezone Settings:
Choose a UTC offset or sync with the exchange's timezone.
User-Friendly Customization:
Compact settings for easier adjustments.
Enable or disable specific sessions to focus on relevant market activity.
How This Script Differs from LuxAlgo
This script draws inspiration from LuxAlgo's session tracking concept but has been developed with significant modifications and unique features:
Built from Scratch in Pine Script v5:
Fully optimized for Pine Script’s latest version, improving performance and functionality.
Expanded Session Range Features:
Five unique sessions (Asia, Frankfurt, London, New York AM, New York PM) with customizable ranges, colors, and labels.
Real-time updating of session ranges for improved intraday analysis.
4H Timeframe Optimization:
Automatically notifies users if applied to an unsupported timeframe, ensuring session accuracy.
Highly Configurable Input Options:
Advanced timezone handling and compact session management settings.
Unique Coding Structure:
Designed to maximize efficiency and minimize resource usage on TradingView.
While LuxAlgo focuses on session concepts, this script brings a fresh, customizable approach specifically tailored for intraday traders seeking precision in tracking session activity.
How It Works
The indicator tracks price movements within each session.
Highlights the high and low range of each session directly on the chart.
Updates session ranges in real-time to reflect evolving market conditions.
Practical Applications
Intraday Trading: Plan trades based on major market session ranges.
Breakout Strategies: Use session high and low levels to identify potential breakouts.
Session-Specific Patterns: Spot consolidations and reversals within session activity.
Important Notes
Optimized for the 4H timeframe. If applied to another timeframe, a notification will appear.
Best used in combination with other tools (e.g., volume or trend indicators) for a complete trading strategy.
Credits
This script draws inspiration from LuxAlgo's open-source session-tracking methodology. However, it introduces substantial improvements and unique features that set it apart. Full credit is given to LuxAlgo for their original open-source concept.
Disclaimer
This script is for informational and educational purposes only. Always test on a demo account before applying to live markets.

ICT KillZones + Pivot Points [TradingFinder] Support/Resistance 🟣 Introduction
Pivot Points are critical levels on a price chart where trading activity is notably high. These points are derived from the prior day's price data and serve as key reference markers for traders' decision-making processes.
Types of Pivot Points :
Floor
Woodie
Camarilla
Fibonacci
🔵 Floor Pivot Points
Widely utilized in technical analysis, floor pivot points are essential in identifying support and resistance levels. The central pivot point (PP) acts as the primary level, suggesting the trend's likely direction.
The additional resistance levels (R1, R2, R3) and support levels (S1, S2, S3) offer further insight into potential trend reversals or continuations.
🔵 Camarilla Pivot Points
Featuring eight distinct levels, Camarilla pivot points closely correspond with support and resistance, making them highly effective for setting stop-loss orders and profit targets.
🔵 Woodie Pivot Points
Similar to floor pivot points, Woodie pivot points differ by placing greater emphasis on the closing price, often resulting in different pivot levels compared to the floor method.
🔵 Fibonacci Pivot Points
Fibonacci pivot points combine the standard floor pivot points with Fibonacci retracement levels applied to the previous trading period's range. Common retracement levels used are 38.2%, 61.8%, and 100%.
🟣 Sessions
Financial markets are divided into specific time segments, known as sessions, each with unique characteristics and activity levels. These sessions are active at different times throughout the day.
The primary sessions in financial markets include :
Asian Session
European Session
New York Session
The timing of these major sessions in UTC is as follows :
Asian Session: 23:00 to 06:00
European Session: 07:00 to 14:25
New York Session: 14:30 to 22:55
🟣 Kill Zones
Kill zones are periods within a session marked by heightened trading activity. During these times, trading volume surges and price movements become more pronounced.
The timing of the major kill zones in UTC is :
Asian Kill Zone: 23:00 to 03:55
European Kill Zone: 07:00 to 09:55
New York Kill Zone: 14:30 to 16:55
Combining kill zones and pivot points in financial market analysis provides several advantages :
Enhanced Market Sentiment Analysis : Aligns key price levels with high-activity periods for a clearer market sentiment.
Improved Timing for Trade Entries and Exits : Helps better time trades based on when price movements are most likely.
Higher Probability of Successful Trades : Increases the accuracy of predicting market movements and placing profitable trades.
Strategic Stop-Loss and Profit Target Placement : Allows for precise risk management by strategically setting stop-loss and profit targets.
Versatility Across Different Time Frames : Effective in both short and long time frames, suitable for various trading strategies.
Enhanced Trend Identification and Confirmation : Confirms trends using both pivot levels and high-activity periods, ensuring stronger trend validation.
In essence, this integrated approach enhances decision-making, optimizes trading performance, and improves risk management.
🟣 How to Use
🔵 Two Approaches to Trading Pivot Points
There are two main strategies for trading pivot points: utilizing "pivot point breakouts" and "price reversals."
🔵 Pivot Point Breakout
When the price breaks through pivot lines, it signals a shift in market sentiment to the trader. In the case of an upward breakout, where the price crosses these pivot lines, a trader might enter a long position, placing their stop-loss just below the pivot point (P).
Conversely, if the price breaks downward, a short position can be initiated below the pivot point. When using the pivot point breakout strategy, the first and second support levels can serve as profit targets in an upward trend. In a downward trend, these roles are filled by the first and second resistance levels.
🔵 Price Reversal
An alternative method involves waiting for the price to reverse at the support and resistance levels. To implement this strategy, traders should take positions opposite to the prevailing trend as the price rebounds from the pivot point.
While this tool is commonly used in higher time frames, it tends to produce better results in shorter time frames, such as 1-hour, 30-minute, and 15-minute intervals.
Three Strategies for Trading the Kill Zone
There are three principal strategies for trading within the kill zone :
Kill Zone Hunt
Breakout and Pullback to Kill Zone
Trading in the Trend of the Kill Zone
🔵 Kill Zone Hunt
This strategy involves waiting until the kill zone concludes and its high and low lines are established. If the price reaches one of these lines within the same session and is strongly rejected, a trade can be executed.
🔵 Breakout and Pullback to Kill Zone
In this approach, once the kill zone ends and its high and low lines stabilize, a trade can be made if the price breaks one of these lines decisively within the same session and then pulls back to that level.
🔵 Trading in the Trend of the Kill Zone
Kill zones are characterized by high trading volumes and strong trends. Therefore, trades can be placed in the direction of the prevailing trend. For instance, if an upward trend dominates this area, a buy trade can be entered when the price reaches a demand order block.

PA Helper - SessionsPA Helper – Sessions is a session visualization and timing utility designed to give precise intraday context directly on your chart. It allows you to define up to four custom trading sessions with full control over time ranges, colors, fills, and timezone handling, making it suitable for any market or trading style.
The indicator draws clear session start and end markers and can optionally highlight the full session range on the chart. A key capability is that it does not limit itself to historical data only: it can project and display future session boundaries ahead of the current price, allowing you to see upcoming session starts and ends before they happen. This is especially useful for planning trades, managing exposure, and preparing for session-based volatility.
Candles outside active session hours can be visually muted or hidden using a separate color, helping you focus only on relevant trading periods. The script also supports real-time session detection, ensuring accuracy both in replay mode and live markets.
In addition, PA Helper – Sessions includes configurable alerts that can notify you a chosen number of minutes before a session starts or before it ends. These notifications work across all enabled sessions and are designed to trigger reliably without duplicate alerts, making them practical for active intraday traders.
Overall, this tool acts as a clean, precise session framework that combines past, present, and future session awareness, helping you align price action analysis with time-based market behavior.

FX SessionsForex Sessions Indicator
FX Sessions Indicator
This indicator is designed for high-precision Forex trading, focusing on the core liquidity windows of the global currency markets.
-Core Purpose: Tracks and visualizes the three major global trading sessions—Asia, London, and New York.
-Visual Style: Uses a clean, non-intrusive dotted-line box to define the high and low range of each session.
-Key Metric: Automatically calculates and displays the total Pip Range for each session, allowing for a quick assessment of volatility.
C-ustomization: Features a streamlined settings menu where you can toggle sessions on/off, adjust names, and modify time zones (defaulting to GMT-5).
-Lookback Logic: Optimized to maintain chart clarity by cleaning up historical data based on a user-defined lookback period.

MP SESSIONS, DST, OTTMP SESSIONS, DST, OTT – What this indicator does
This script is a multi-session market timing tool that:
Draws full trading sessions on the chart (Asia, Sydney, Tokyo, Shanghai, Europe, London, New York, NYSE)
Automatically adjusts for Daylight Saving Time (DST) for Sydney, London, and New York
Shows a live info table with session times, DST status, and whether each session is currently open or closed
Adds optional custom “OTT” vertical lines at user-defined intraday times (for your own models, killzones, or time blocks)
Main Features (high level)
1. Market mode & time zone handling
Market Mode:
Forex
Stock
User Custom (you type your own session ranges)
TFlab suggestion (predefined “optimized” session times)
Time Zone Mode:
UTC
Session Local Time (local exchange time: Sydney, Tokyo, London, New York etc.)
Your Time Zone (converts to the user-selected TZ, e.g. UTC-4:00)
Handles separate time zones for:
Asia, Sydney, Tokyo, Shanghai, Europe, London, New York, NYSE
Has logic to recalculate session start/end depending on DST and the chosen mode.
2. Daylight Saving Time (DST) engine
The function DST_Detector:
Calculates when DST starts and ends for:
Australia/Sydney
Europe/London
America/New_York
Detects the correct Sunday (2nd, 4th, etc.) for start/end using day-of-week and week counts.
Returns 'Active' or 'Inactive' for each region.
These values are then used to shift the sessions (e.g. New York 13:00–21:00 vs 12:00–20:00 in UTC).
The script can also draw vertical lines on the chart when DST starts/ends and label them:
“Sydney DST Started / Ended”
“London DST Started / Ended”
“New York DST Started / Ended”
3. Session timing & sessions on the chart
The function Market_TimeZone_Calculator:
Based on Market Mode + Time Zone Mode + DST state, it returns:
Time ranges for: Sydney, Tokyo, Shanghai, Asia (combined), Europe, London, New York, NYSE
These ranges are in "HHMM-HHMM" format.
Then the script:
Converts these to time() conditions using the proper time zone
Creates boolean series like On_sesAsia, On_sesEurope, On_sesNewYork, etc., which are 1 when the session is open and 0 when closed.
4. Session high/low boxes & labels
The function LowHighSessionDetector:
Tracks high and low of each session while it’s active.
When a new session starts:
Resets and starts recording the session high/low.
While session is active:
Updates High with the max of current bar high and previous session high.
Updates Low with the min of current bar low and previous session low.
When the session is "on":
Draws a box from session low to high (box.new) and extends it to the right as long as the session continues.
Places a label with session name (Asia, London, New York, etc.) near the high:
Style depends on the session (down/right/left).
You have visibility toggles per session:
Asia Session, Sydney Session, Tokyo Session, Shanghai Session, Europe Session, London Session, New York Session, NYSE (for TFlab mode).
So you visually see:
A shaded box for each session
The full H/L range for that session
A text label with the session name.
5. Info table
The indicator builds a table in a corner of the chart showing:
Header:
“FOREX Session”, “Stock Market Trading Hours”, “User Custom Session”, or “TFlab suggestion” depending on mode.
Columns:
Session name (Asia, Sydney, Tokyo, Shanghai, Europe, London, New York, NYSE)
DST status for that region (“Active 🌞 / Inactive 🍂 / Not Observed”)
Session start time
Session end time
Current status (“Open / Closed”, with green/red background)
The function SplitFunction:
Parses the "HHMM-HHMM" strings for each session.
Converts them into:
Either raw times (if viewing in UTC/session local)
Or converted times in Your Time Zone using timestamp and hour/ minute with YourTZ.
Returns formatted Start and End strings like 9:30, 13:00, etc.
So the table is effectively a live session schedule that:
Auto-adjusts to DST
Can show times in your own time zone
Shows which session is open right now.
6. OTT vertical lines (custom intraday markers)
At the bottom, there is an OTT section which lets you draw up to three sets of vertical lines at specific times:
Each OTT block has:
Enable toggle (Enable OTT 1/2/3)
Start hour & minute
End hour & minute
Color
Global OTT settings:
Line style: Solid / Dashed / Dotted
Line width
Toggle: “Show OTT Labels?”
Logic:
is_ott_time() checks if current bar’s hour and minute match the OTT input time.
draw_ott():
When the bar time matches, draws a vertical line through the candle from low to high (extend.both).
Optionally adds a label above the bar, like "OTT1 Start", "OTT1 End", etc.
Use cases:
Marking open/close of your trading session
Defining killzones, news times, or custom model windows
Visual anchors for your intraday routine (NY open, 10 AM candle, etc.)

6-9 session & levels6-9 Session & Levels - Customizable Range Analysis Indicator
Description:
This indicator provides comprehensive session-based range analysis designed for intraday traders. It calculates and displays key levels based on a customizable session period (default 6:00-9:00 AM ET).
Core Features:
Session Tracking
Monitors user-defined session times with timezone support
Displays session open, high, and low levels
Highlights session range with optional box visualization
Shows previous day RTH (Regular Trading Hours: 9:30 AM - 4:00 PM) levels
Range Levels
25%, 50%, and 75% range levels within the session
Range deviations at 0.5x, 1.0x, and 2.0x multiples
Fibonacci extension levels (customizable, default 1.33x and 1.66x)
Optional fill zones between Fibonacci levels
Time Zone Highlighting
Marks the 9:40-9:50 AM period as a potential reversal zone
Vertical lines with shading to identify key time windows
Statistical Analysis
Calculates mean and median extension levels based on historical sessions
Displays statistics table showing current range, average range, range difference, and z-score
Customizable sample size (1-100 sessions) for statistical calculations
Option to anchor extensions from either session open or high/low points
Input Settings Explained:
Session Settings
Levels Session Time: Define your session window in HHMM-HHMM format (default: 0600-0900)
Time Zone: Choose from UTC, America/New_York, America/Chicago, America/Los_Angeles, Europe/London, or Asia/Tokyo
Anchor Settings
Show Session Anchor: Toggle the session anchor line (marks session open price at 6:00 AM)
Anchor Style/Color/Width: Customize appearance (Solid/Dashed/Dotted, color, 1-4 width)
Show Anchor Label: Display price label for the anchor
Session Open Line: Similar options for the session open reference line
Range Box Settings
Show Range Box: Display a shaded rectangle highlighting the session high-to-low range
Range Box Color: Set the box background color and transparency
Range Levels (25%/50%/75%)
Show Range Levels: Toggle all three intermediate levels on/off
Individual Level Styling: Each level (25%, 50%, 75%) has its own color, style, and width settings
Show Range Level Labels: Display price labels for each level
Range Deviations
Show Range Deviations: Toggle deviation levels on/off
0.5x/1.0x/2.0x Settings: Each deviation multiplier can be customized with its own color, line style (Solid/Dashed/Dotted), and width
Show Range Deviation Labels: Display labels showing the deviation price levels
Previous Day RTH Levels
Show Previous RTH Levels: Display yesterday's regular trading hours high and low
RTH High/Low Styling: Separate color, style, and width settings for each level
Show Previous RTH Labels: Toggle price labels for RTH levels
Time Zones
Show 9:40-9:50 AM Zone: Highlight this specific time period with vertical lines and shading
Zone Color: Set the background fill color for the time zone
Zone Label Color/Text: Customize the label appearance and text
Fibonacci Extension Settings
Show Fibonacci Extensions: Toggle Fib levels on/off
Fib Extension Color/Style/Width: Customize line appearance
Show Fib Extension Labels: Display price labels
Fib Ext Level 1/2: Set custom multipliers (default 1.33 and 1.66, range 0-5 in 0.1 increments)
Show Fibonacci Fills: Display shaded zones between Fib levels
Fib Fill Color: Customize the fill color and transparency
Session High/Low Settings
Show Session High/Low Lines: Display the actual session extremes
Style/Color/Width: Customize line appearance
Show Labels: Toggle price labels for high/low levels
Extension Stats Settings
Show Statistical Levels on Chart: Display mean and median extension levels based on historical data
Extension Anchor Point: Choose whether to anchor from "Open" or "High/Low" of the session
Number of Sessions for Statistics: Set sample size (1-100, default 60) for calculating averages
Mean/Median High Extension: Separate styling for each statistical level (color, style, width)
Mean/Median Low Extension: Separate styling for downside statistical levels
Tables
Show Statistics Table: Display a summary table with current range, average range, difference, z-score, and sample size
Table Position: Choose from 9 positions (Bottom/Middle/Top + Center/Left/Right)
Table Text Size: Select from Auto, Tiny, Small, Normal, Large, or Huge
Display Settings
Projection Offset: Number of bars to extend lines forward (default 24)
Label Size: Choose from Tiny, Small, Normal, or Large
Price Decimal Precision: Set decimal places for price labels (0-6)
How It Works:
The indicator tracks the specified session period and calculates the session's open, high, low, and range. At the end of the session (9:00 AM by default), it projects all configured levels forward for the trading day. The statistical features analyze the last N sessions (you choose the number) to calculate typical extension behavior from either the session open or the session high/low points.
The z-score calculation helps identify whether the current session's range is normal, expanded, or contracted compared to recent history, allowing traders to adjust expectations for the rest of the day.
Use Case:
This indicator helps traders identify key support and resistance levels based on early session price action, understand current range context relative to historical averages, and spot potential reversal zones during specific time periods.
Note: This indicator is for informational purposes only and does not constitute investment advice. Always perform your own analysis before making trading decisions.

ICT Sessions Ranges [SwissAlgo]ICT Session Ranges - ICT Liquidity Zones & Market Structure
OVERVIEW
This indicator identifies and visualizes key intraday trading sessions and liquidity zones based on Inner Circle Trader (ICT) methodology (AM, NY Lunch Raid, PM Session, London Raid). It tracks 'higher high' and 'lower low' price levels during specific time periods that may represent areas where market participants have placed orders (liquidity).
PURPOSE
The indicator helps traders observe:
Session-based price ranges during different market hours
Opening range gaps between market close and next day's open
Potential areas where liquidity may be concentrated and trigger price action
SESSIONS TRACKED
1. London Session (02:00-05:00 ET): Tracks price range during early London trading hours
2. AM Session (09:30-12:00 ET): Tracks price range during the morning New York session
3. NY Lunch Session (12:00-13:30 ET): Tracks price range during typical low-volume lunch period
4. PM Session (13:30-16:00 ET): Tracks price range during the afternoon New York session
CALCULATIONS
Session High/Low: The highest high and lowest low recorded during each active session period
Opening Range Gap: Calculated as the difference between the previous day's 16:00 close and the current day's 09:30 open
Gap Mitigation: A gap is considered mitigated when the price reaches 50% of the gap range
All times are based on America/New_York timezone (ET)
BACKGROUND INDICATORS
NY Trading Hours (09:30-16:00 ET): Optional gray background overlay
Asian Session (20:00-23:59 ET): Optional purple background overlay
VISUAL ELEMENTS
Horizontal lines mark session highs and lows
Subtle background boxes highlight each session range
Labels identify each session type
Orange shaded boxes indicate unmitigated opening range gaps
Dotted line at 50% gap level shows mitigation threshold
FEATURES
Toggle visibility for each session independently
Customizable colors for each session type
Automatic removal of mitigated gaps
All drawing objects use transparent backgrounds for chart clarity
ICT CONCEPTS
This tool relates to concepts discussed by Inner Circle Trader regarding liquidity pools, session-based analysis, and gap theory. The indicator assumes that session highs and lows may represent areas where liquidity is concentrated, and that opening range gaps may attract price until mitigated.
USAGE NOTES
Best used on intraday timeframes (1-15 minute charts)
All sessions are calculated based on actual price movement during specified time periods
Historical session data is preserved as new sessions develop
Gap detection only triggers at 09:30 ET market open
DISCLAIMER
This indicator is for educational and informational purposes only. It displays historical price levels and time-based calculations. Past performance of price levels is not indicative of future results. The identification of "liquidity zones" is a theoretical concept and does not guarantee that orders exist at these levels or that prices will react to them. Trading involves substantial risk of loss. Users should conduct their own analysis and risk assessment before making any trading decisions.
TIME ZONE
Set your timezone to: America/New_York (UTC-5)

FX Sessions by m_cptForex Intraday Sessions Indicator, config time in UTC-4. Support 4 main sessions, smooth end-to-start candles mode, without gaps if your sessions has config like:
1) 19:00 - 03:00
2) 02:00 - 03:00
3) 03:00 -11:00
No excluded last candles issue on all TFs.
Working on LTF up to 1h TF since its intraday sessions indicator.

IDKFAIDKFA - Advanced Order Blocks & Volume Profile with Market Structure Analysis
Why IDKFA?
Named after the legendary DOOM cheat code that gives players "all weapons and full ammo," IDKFA provides traders with a comprehensive arsenal of market analysis tools. Just as the cheat code arms players with everything needed for combat, this indicator equips traders with essential market structure tools: Order Blocks, Volume Profile, LVN/HVN areas, Fibonacci retracements, and intelligent buy/sell signals - all in one unified system.
Core Features
Order Blocks Detection
Automatically identifies institutional order blocks using pivot high/low analysis
Extends blocks dynamically until price interaction occurs
Bullish blocks (demand zones) and bearish blocks (supply zones)
Customizable opacity and extend functionality
Advanced Volume Profile
Real-time volume profile calculation for multiple session types
Point of Control (POC), Value Area High (VAH), and Value Area Low (VAL)
Mode 1: Side-by-side bull/bear volume display
Mode 2: Overlapped volume display with percentage analysis
Shows buying vs selling pressure at each price level
LVN/HVN Area Detection
Low Volume Nodes (LVN): Areas below VAL where price moves quickly
High Volume Nodes (HVN): Areas above VAH with strong resistance
NPOC (Naked Point of Control): Single print areas within Value Area
Volume-based gradient coloring shows relative activity levels
Smart Fibonacci Retracements
Auto-detects trend direction for proper fibonacci orientation
Dynamic color coding: Red levels in uptrends, Gold in downtrends
Special 88.6% level turns lime green in downtrends
Key levels: 23.6%, 38.2%, 50%, 61.8%, 65%, 78.6%, 88.6%
Intelligent Signal System
Works best on higher timeframes
Identifies high-probability reversal setups at key levels
Buy signals: Large bearish rejection followed by bullish reclaim
Sell signals: Large bullish rejection followed by bearish breakdown
Signals only trigger near significant support/resistance areas
Signal Analysis & Usage Guidelines
Buy Signal Mechanics
The buy signal triggers when:
Previous candle shows significant bearish movement (minimum ATR multiplier)
Current candle reclaims a configurable percentage of the previous candle's range
Price is near a key support level (order blocks, fibonacci, volume levels)
Sell Signal Mechanics
The sell signal triggers when:
Previous candle shows significant bullish movement (minimum ATR multiplier)
Current candle rejects below a configurable percentage of the previous candle's range
Price is near a key resistance level (order blocks, fibonacci, volume levels)
When to TAKE Signals
High Probability Buy Signals:
Signal appears AT or BELOW the VAL (Value Area Low)
Signal occurs at bullish order block confluence
Price is in LVN area below VAL (momentum acceleration zone)
Signal aligns with fibonacci 61.8% or 78.6% support
Multiple session POC levels provide support confluence
Previous session's VAL acting as current support
High Probability Sell Signals:
Signal appears AT or ABOVE the VAH (Value Area High)
Signal occurs at bearish order block confluence
Price is in HVN area above VAH (heavy resistance zone)
Signal aligns with fibonacci 61.8% or 78.6% resistance
Multiple session POC levels provide resistance confluence
Previous session's VAH acting as current resistance
When to AVOID Signals
Avoid Buy Signals When:
Signal appears ABOVE the VAH (buying into resistance)
Price is in HVN red zones (high volume resistance areas)
No clear support structure below current price
Volume profile shows heavy selling pressure (high bear percentages)
Signal occurs during low-volume periods between major sessions
Multiple bearish order blocks exist below current price
Avoid Sell Signals When:
Signal appears BELOW the VAL (selling into support)
Price is in LVN green zones (momentum could continue)
No clear resistance structure above current price
Volume profile shows heavy buying pressure (high bull percentages)
Signal occurs during Asian session ranges without clear direction
Multiple bullish order blocks exist above current price
Volume Profile Context for Signals
Understanding Bull/Bear Percentages:
70%+ Bull dominance at a level = Strong support expected
70%+ Bear dominance at a level = Strong resistance expected
50/50 Split = Neutral zone, less predictable
Use percentages to gauge conviction behind moves
POC (Point of Control) Interactions:
Signals above POC in uptrend = Higher probability
Signals below POC in downtrend = Higher probability
Signals against POC bias require extra confirmation
POC often acts as magnetic level for price return
Trading Strategies
Strategy 1: VAL/VAH Bounce Strategy
Wait for price to approach VAL (support) or VAH (resistance)
Look for signal confirmation at these critical levels
Enter with tight stops beyond the Value Area
Target opposite boundary or next session's levels
Strategy 2: Order Block + Volume Confluence
Identify order block alignment with VAL/VAH
Wait for signal within the confluence zone
Enter on signal with stop beyond order block
Use LVN areas as acceleration zones for targets
Strategy 3: LVN/HVN Strategy
LVN (Green) Areas: "Go Zones" - expect quick price movement through low volume
HVN (Red) Areas: "Stop Zones" - expect resistance and potential reversals
NPOC Areas: "Fill Zones" - price often returns to fill single print gaps
Strategy 4: Multi-Session Analysis
Use Daily/Weekly for major structure context
Use 4H for intermediate levels
Use 1H for precise entry timing
Ensure all timeframes align before taking signals
Strategy 5: Fibonacci + Volume Profile
Buy signals at 61.8% or 78.6% fibonacci near VAL
Sell signals at 61.8% or 78.6% fibonacci near VAH
Use 88.6% level as final support/resistance before major moves
50% level often aligns with POC for confluence
Signal Quality Assessment
Grade A Signals (Highest Probability):
Signal at VAL/VAH with order block confluence
Fibonacci level alignment (61.8%, 78.6%)
Volume profile shows 70%+ dominance in signal direction
Multiple timeframe structure alignment
Signal occurs during high-volume sessions (London/NY)
Grade B Signals (Moderate Probability):
Signal near POC with some confluence
Fibonacci 50% or 38.2% alignment
Mixed volume profile readings (50-70% dominance)
Some timeframe alignment present
Signal during overlap sessions
Grade C Signals (Lower Probability):
Signal with minimal confluence
Weak fibonacci alignment or none
Volume profile neutral or against signal
Conflicting timeframe signals
Signal during low-volume periods
Risk Management Guidelines
Position Sizing Based on Signal Quality:
Grade A: Standard position size
Grade B: Reduced position size (50-75%)
Grade C: Minimal position size (25%) or skip entirely
Stop Loss Placement:
Beyond order block boundaries
Outside Value Area (VAL/VAH)
Below/above fibonacci confluence levels
Account for session volatility ranges
Profit Targets:
First target: Opposite VAL/VAH boundary
Second target: Next session's key levels
Final target: Major order blocks or fibonacci extensions
Credits & Attribution
Original components derived from:
Market Sessions & Volume Profile by © Leviathan (Mozilla Public License 2.0)
Volume Profile elements inspired by @LonesomeTheBlue's volume profile script
Pivot Order Blocks by TradingWolf / © MensaTrader (Mozilla Public License 2.0)
Auto Fibonacci Retracement code (public domain)
Significant enhancements and modifications include:
Advanced LVN/HVN detection and visualization
Bull/Bear percentage analysis for Mode 2/3
Comprehensive alert system with market context
Integrated buy/sell signals at key levels
Performance optimizations and extended session support
Enhanced Mode 2/3 with percentage pressure analysis
Important Disclaimers
This indicator is a technical analysis tool designed for educational purposes. It does not provide financial advice, investment recommendations, or trading signals that guarantee profits. All trading involves substantial risk of loss, and past performance does not guarantee future results. Users should conduct their own research, understand the risks involved, and consider consulting with qualified financial advisors before making trading decisions. The signals and analysis provided are based on historical price patterns and volume data, which may not predict future market movements accurately.
Best Practices
Never trade signals blindly - always consider volume profile context
Wait for confluence between multiple tools before entering
Respect the Value Area - avoid buying above VAH or selling below VAL
Use session context - Asian ranges vs London/NY breakouts
Practice proper risk management - position size based on signal quality
Understand the bigger picture - use multiple timeframes for context
Remember: Like the IDKFA cheat code, having all the tools doesn't guarantee success. The key is learning to use them together effectively and understanding when NOT to take a signal is often more important than knowing when to take one.

London/NY Sessions + SMC Levels📜 Indicator Description: London/NY Sessions + SMC Levels
Overview: This indicator highlights the key trading sessions — London, New York, NY Lunch, and Asian Range — providing structured visual guides based on Smart Money Concepts (SMC) and ICT principles.
It dynamically plots:
Session Backgrounds and Boxes for London, NY, Lunch, and Asian sessions
Reference Levels for the High, Low, and Close from today, previous day, or weekly data
Midnight Open line for ICT-style power of three setups
Real-time alerts for session starts, session closes, and important price level crossings
Features:
🕰️ Session Visualization:
Toggle London, NY, Lunch, and Asian session ranges individually, with customizable colors and transparent backgrounds.
🔔 Built-in Alerts:
Alerts for:
Price crossing the previous day's high/low
Price crossing the Midnight Open
Start and end of major sessions (London, NY, Lunch, Asian)
🟩 Reference Levels:
Plot selectable session reference levels:
Today’s intraday High/Low/Close
Previous Day’s High/Low/Close
This Week’s or Previous Week’s levels for broader context.
🌙 Midnight Open:
Track the Midnight New York Open as a reference point for daily bias shifts.
🎯 Customizable Settings:
Choose your session time zones (UTC, New York, London, etc.)
Customize all border colors, background colors, and session hours.
Use Cases:
Identify killzones and optimal trade entry windows for Smart Money Concepts (SMC) and ICT strategies.
Monitor liquidity pool sweeps and session transitions.
Confirm or refine your intraday or swing trading setups by referencing session highs/lows.
Recommended For:
ICT traders
Smart Money Concepts (SMC) practitioners
Forex, indices, crypto, and futures traders focusing on session-based volatility patterns
Anyone wanting a clean, professional session mapping tool
📈
Designed to help you trade with session precision and Smart Money accuracy.
Integrates seamlessly into any ICT, Wyckoff, or Liquidity-based trading approach.

matrixx Global Sessions + Good/Premium Spread ZonesSimple (enough) Script that allows you to visualize the major trading sessions, with some QoL stuff, Includes a "Monday Open" bar for reference when zooming out.
By default no one 'session' is turned on; instead, we have;
Good Zone - where spread tends to close up enough for (me) to trade in the 1-minute timezones
Premium Zone - where the tightest spreads tend to happen and I (you?) can get more aggressive with Stop Losses, and moment-to-moment trade accuracy.
The Monday Open - for reference.
You are able to go into the settings and turn these on and off at will, making any combination of 'zones' you prefer, and can colour code them, as well.
Points of Difference;
You can turn on and off any group or set of sessions for an overview;
Additionally, this is coded so that if there is a "Daylight Saving" or other localized timezone shift, it should be reflected correcty, as timezones are calculated based on each sessions' data, not arbitrarily with +/- as most of the other scripts that do similar to this one.
Monday Open
you can toggle sessions, or instead toggle the 'off hour' zones, at will

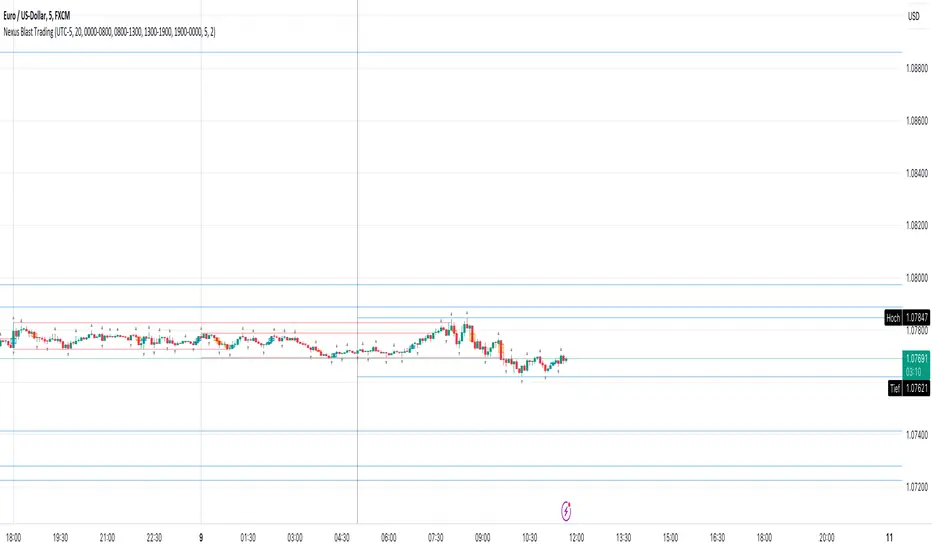
Nexus Blast Trading Strategy [Kaspricci]Nexus Blast Trading Strategy - Kaspricci
This indicator shows the different sessions during the day (London session, New York AM session, New York PM session and Asian session) by adding vertical lines and draws horizontal lines for the high and low during each session. Furthermore those lines turn red once the price has taken this high or low. Blue lines indicate liquidity not yet taken.
On top the indicator draws boxes of different color to indicate bullish and bearish Fair Value Gaps (FVG).
Happy to receive your feedback. Please leave a comment for bugs as well as ideas for improvement.
General Settings
Time Zone - used for marking sessions and end of day.
Sessions
Sessions - start and end time for each session based on set time zone
Number of Days back - for how many days in the past the startegy will draw strategy highs and lows. Theres is a maximum of 50 days defined.
FVG Settings
Threshold in Ticks - you can hide very small FVGs by increasing this threshold
FVG Colors - colors used for the bearish and bullish FVG box
This script is for educational purposes only! It is not meant to be a financial advice.
PS: The former strategy script was removed by TV, as it would violate several rules according to them.
Advanced Forex SessionsEssential for ALL Forex Day Traders!
Don't waste your time trading Forex Sessions with little to no volume or volatility!
The Advanced Forex Sessions tool will search through all 4 sessions, tally up the total volume and ticks moved, and show you which session has the most movement.
It will show you the two best sessions on chart and optionally color the background too.
Configure the position & size of the Infographic table as well as custom Forex Session times and colors.

MRG Session High/LowMRG Session High/Low - Indicator Description
📊 Overview
This Pine Script indicator automatically displays key levels from Asian and London trading sessions on your TradingView chart. It plots the high and low points of each completed session, allowing you to quickly identify important support and resistance zones for your trades.
🎯 Key Features
Detected Sessions (New York Timezone)
Asian Session: 18:00 - 03:00 (6pm - 3am)
London Session: 03:00 - 09:00 (3am - 9.30am)
Plotted Levels
Session High: The highest point reached during the session
Session Low: The lowest point reached during the session
Start Lines: Vertical dashed lines marking the beginning of each session (optional)
⚙️ Customizable Settings
Display Options
✅ Show/hide Asian Session
✅ Show/hide London Session
✅ Show/hide session start lines
Style Options
🎨 Asian Color: Orange by default
🎨 London Color: Blue by default
🎨 Start lines color: Red by default
📏 Line thickness: Adjustable from 1 to 5
🔍 How It Works
Automatic Detection: The indicator automatically detects when a new session begins
Level Calculation: During each session, it continuously records highs and lows
Line Plotting: At the end of each session, it draws two horizontal lines:
One line at the session high level
One line at the session low level
Extension: Lines extend to the right for easy future identification
📈 Strategic Usage
For Breakout Trading
Trade breakouts of Asian and London session highs/lows
Breakouts from these levels often signal the beginning of significant moves
For Support and Resistance
Use these levels as key support and resistance zones
Prices often come back to test these levels during the New York session
For Multi-Timeframe Analysis
Identify consolidation during Asian/London sessions
Anticipate volatility at New York open
💡 Advantages
✨ Clear and automatic visualization of session levels
⏱️ Time-saving: no need to manually draw levels
🎯 Precise levels based on actual highs/lows of each session
🔄 Automatically updates daily
📱 Compatible with all timeframes (recommended: M5, M15, H1)
🎓 Ideal For
Forex traders (especially XAUUSD, EUR/USD, GBP/USD)
Scalpers and day traders
Session breakout strategies
Trading around New York open
Liquidity zone analysis
📌 Important Note
The indicator uses New York timezone (America/New_York) to ensure session time accuracy, regardless of your local timezone.

Session VWAPs [cryptalent]This indicator provides a more granular and timely analysis of market structure compared to traditional daily Volume Weighted Average Price (VWAP). It splits the 24-hour trading day into four distinct, customizable sessions (T1, T2, T3, T4), calculating an independent Session VWAP and Standard Deviation Bands for each segment.
🌟 Key Features and Functionality
1. Segmented VWAP Calculation
Purpose: To track the true Volume Weighted Average Price (Fair Value) specific to the participants and trading activities within different global market sessions (e.g., Asian, European, US sessions).
Design: By default, the 24 hours (based on UTC time) are divided into T1 (00:00-06:00), T2 (06:00-12:00), T3 (12:00-20:00), and T4 (20:00-00:00).
Mechanism: The VWAP calculation resets at the start of each designated session, offering a clearer, segment-specific view of market consensus and volume absorption.
2. Standard Deviation Bands
Calculation: Each Session VWAP line is accompanied by upper and lower standard deviation bands.
Control: The width of these bands is controlled by the user input "Band Multiplier" (default is 1.0, representing one standard deviation).
Application: These bands measure the Volume-Weighted Volatility and define the expected "normal" trading range for the current session.
- Price within the bands suggests consolidation or a normal auction process.
- Price breaking out of the bands indicates strong directional momentum or an extreme/overbought/oversold condition for that specific session.
3. High Customization (User Inputs)
Session Timing: All four session start and end times (in UTC) are customizable, allowing traders to align the indicator with specific market hours or individual trading strategies.
Price Source: The source price used for the VWAP calculation is selectable (default is close).
💡 Trading Applications
1. Fair Value Identification: The VWAP line serves as the "Fair Value" or "Volume-Weighted Consensus Cost" for the active session.
Price above VWAP: Buyers are in control during that session.
Price below VWAP: Sellers are in control during that session.
2. Dynamic Support & Resistance: Both the VWAP and the Standard Deviation Bands often act as reliable dynamic support and resistance levels.
3. Volatility Assessment: The width of the bands reflects the volume-weighted volatility of the current session. Narrow bands suggest range-bound trading; wide bands imply strong directional activity.
4. Trend Strength: Sustained price action outside of the standard deviation bands is a key measure of the strength and commitment behind a current trend.
