Dynamic Liquidity Levels [CDC Trading LABN] (ENGLISH)Script Description :
Take your market structure and liquidity analysis to the next level with Dynamic Liquidity Levels, a professional-grade tool designed to visualize the key levels that truly move the price. This indicator doesn't just plot static lines; it offers a dynamic framework that reacts to price action in real-time, keeping your chart clean and focused on what matters.
Designed for scalpers and swing traders alike, this indicator is your map for navigating market liquidity.
Key Features
• Smart Dynamic Lines: The standout feature of this indicator. Lines automatically stop extending once price has "invalidated" them. You decide whether the break occurs on a simple wick touch (to capture liquidity grabs) or a full candle close beyond the level (for a stronger confirmation).
• Comprehensive Liquidity Levels: Automatically draws the most important liquidity pools that professional traders watch every day:
• HTF Levels: Previous Day, Week, and Month Highs & Lows (PDH/L, PWH/L, PMH/L).
• Session Levels: Asian, London, and New York Session Highs & Lows (ASH/L, LSH/L, NYH/L).
• Full Label Control: Forget about overlapping labels. Adjust the position of each label individually (Left, Right, Center, Upper, Lower) for perfect visual clarity in any market condition.
• Instant, Configurable Alerts: Never miss an opportunity. Set up alerts that trigger the moment a level of your choice is broken, helping you execute your trades with precision.
• Clean & Professional Visualization: Fully customizable. Adjust colors, line width, and decide whether to display exact prices in the labels for an analysis setup tailored to your style.
Who is This Indicator For?
This tool is essential for a wide range of trading methodologies:
• Smart Money Concepts (SMC) & ICT Traders: Perfect for identifying liquidity pools and draw on liquidity levels. Use it to frame your order blocks and points of interest.
• Candle Range Theory (CRT) Traders: This indicator automates the core of your analysis. It identifies and projects the key candle ranges from higher timeframes (Daily, Weekly, Monthly) and trading sessions. Use these levels to anticipate price expansion and identify liquidity targets above and below established ranges, without manual markup every day.
• Price Action Traders: Clearly and automatically visualize the most relevant support and resistance levels based on high-timeframe market structure.
• Day Traders & Scalpers: Make quick decisions based on previous day's levels and session highs/lows, which act as magnets for intraday price.
• Swing Traders: Use the weekly and monthly levels to get a macro view of the structure and plan longer-term trades.
How to Use
1. Add the indicator to your chart.
2. Explore the settings panel to enable the levels and alerts that fit your trading plan.
3. Adjust the label positions for maximum clarity.
4. To receive alerts, right-click on the chart, create a new alert, select the indicator from the dropdown, and choose the "Any alert() function call" option.
We hope this tool greatly helps you improve your market analysis.
Happy trading!
CDC Trading LABN
Recherche dans les scripts pour "sessions"

Dynamic Liquidity Levels [CDC Trading LABN] (ESPAÑOL)Script Description :
Take your market structure and liquidity analysis to the next level with Dynamic Liquidity Levels , a professional-grade tool designed to visualize the key levels that truly move the price. This indicator doesn't just plot static lines; it offers a dynamic framework that reacts to price action in real-time, keeping your chart clean and focused on what matters.
Designed for scalpers and swing traders alike, this indicator is your map for navigating market liquidity.
Key Features
• Smart Dynamic Lines: The standout feature of this indicator. Lines automatically stop extending once price has "invalidated" them. You decide whether the break occurs on a simple wick touch (to capture liquidity grabs) or a full candle close beyond the level (for a stronger confirmation).
• Comprehensive Liquidity Levels: Automatically draws the most important liquidity pools that professional traders watch every day:
• HTF Levels: Previous Day, Week, and Month Highs & Lows (PDH/L, PWH/L, PMH/L).
• Session Levels: Asian, London, and New York Session Highs & Lows (ASH/L, LSH/L, NYH/L).
• Full Label Control: Forget about overlapping labels. Adjust the position of each label individually (Left, Right, Center, Upper, Lower) for perfect visual clarity in any market condition.
• Instant, Configurable Alerts: Never miss an opportunity. Set up alerts that trigger the moment a level of your choice is broken, helping you execute your trades with precision.
• Clean & Professional Visualization: Fully customizable. Adjust colors, line width, and decide whether to display exact prices in the labels for an analysis setup tailored to your style.
Who is This Indicator For?
This tool is essential for a wide range of trading methodologies:
• Smart Money Concepts (SMC) & ICT Traders: Perfect for identifying liquidity pools and draw on liquidity levels. Use it to frame your order blocks and points of interest.
• Candle Range Theory (CRT) Traders: This indicator automates the core of your analysis. It identifies and projects the key candle ranges from higher timeframes (Daily, Weekly, Monthly) and trading sessions. Use these levels to anticipate price expansion and identify liquidity targets above and below established ranges, without manual markup every day.
• Price Action Traders: Clearly and automatically visualize the most relevant support and resistance levels based on high-timeframe market structure.
• Day Traders & Scalpers: Make quick decisions based on previous day's levels and session highs/lows, which act as magnets for intraday price.
• Swing Traders: Use the weekly and monthly levels to get a macro view of the structure and plan longer-term trades.
How to Use
1. Add the indicator to your chart.
2. Explore the settings panel to enable the levels and alerts that fit your trading plan.
3. Adjust the label positions for maximum clarity.
4. To receive alerts, right-click on the chart, create a new alert, select the indicator from the dropdown, and choose the "Any alert() function call" option.
We hope this tool greatly helps you improve your market analysis.
Happy trading!
CDC Trading LABN

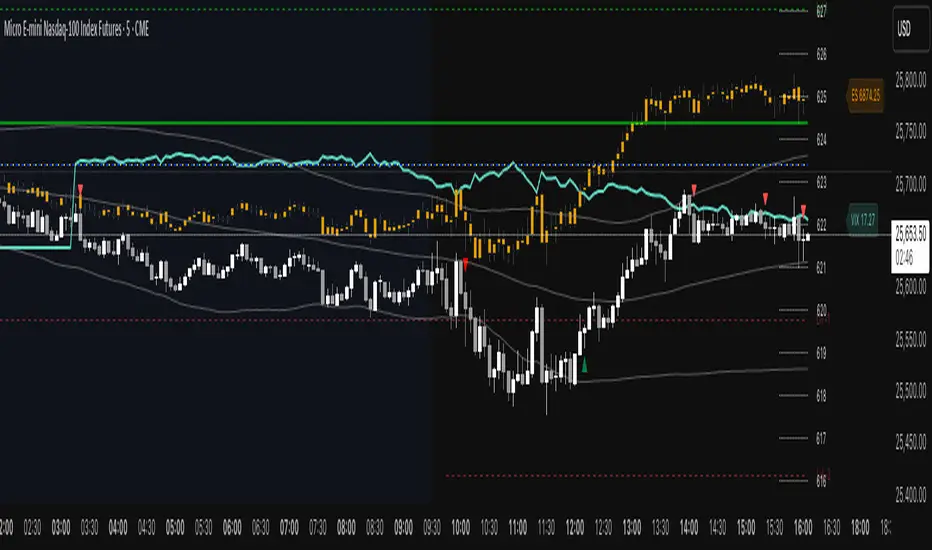
ES VIX on MNQ🧭 ES + VIX Overlay on MNQ
This indicator overlays the ES (S&P 500 futures) and VIX (Volatility Index) directly on the MNQ (Micro Nasdaq Futures) chart, allowing traders to visualize in real time the correlation, divergence, and volatility influence between the three instruments.
⸻
⚙️ How It Works
• The VIX is dynamically rescaled to the MNQ’s daily open, so its moves appear on the same price scale.
• The ES line is projected based on its percentage move relative to the session open (18:00 NY).
• Both are plotted in sync with MNQ to expose relative strength and divergence zones that often precede strong directional moves.
⸻
🧩 Inputs
• VIX Symbol: choose between VIX, CBOE:VIX, TVC:VIX
• Invert VIX Correlation: flips the VIX line for inverse-correlation setups
• VIX Step: controls how sensitively the VIX moves on the MNQ scale
• ES Symbol: defines the ES contract (e.g. ES1!)
• Show Signals: toggles on/off buy & sell markers
• Step (points): minimum distance between MNQ and VIX for a valid signal
• Block Signals: disables signals between 16:15 – 03:15 (illiquid hours)
⸻
💡 Signal Logic
The system tracks crossings between MNQ and the projected VIX line:
• Buy signal → when MNQ crosses above the VIX and expands upward by ≥ X points.
• Sell signal → when MNQ crosses below the VIX and expands downward by ≥ X points.
A time filter avoids noise during low-volume sessions.
⸻
📊 Visual Guide
• Cyan line = VIX on MNQ scale
• Orange line = ES on MNQ scale
• Labels on the right = current VIX / ES values
• BUY/SELL markers = potential volatility-based reversals
⸻
🚀 Practical Use
Perfect for traders who monitor:
• VIX–price divergence
• ES vs MNQ momentum confirmation
• Early volatility expansions before trend moves
⸻
💬 Core Idea:
“Volatility leads — price confirms.”
Trend Meter [MMT]The Trend Meter is a dynamic Pine Script indicator designed to provide traders with a clear, multi-dimensional view of market trends and momentum across different timeframes and metrics. By integrating Exponential Moving Averages (EMAs), Volume-Weighted Average Price (VWAP), higher timeframe (HTF) analysis, and Regular Trading Hours (RTH) breakouts, this indicator offers a comprehensive tool for identifying bullish, bearish, or neutral market conditions. Its customizable visual display and label system make it ideal for traders seeking actionable insights for trend-following, breakout, or reversal strategies.
Key Features:
1. Multi-Metric Trend Analysis:
- Trend Meter : Compares a Fast EMA (default: 9) and Slow EMA (default: 21) to determine short-term trend direction.
- Bias Meter : Uses a longer-term Bias EMA (default: 35) to assess the overall market bias based on the close price.
- VWAP Meter : Evaluates price position relative to the VWAP for dynamic support/resistance insights.
- HTF Meter : Analyzes higher timeframe (default: 60-minute) price action, detecting breakouts of previous highs/lows and candle direction.
- RTH Meter : Tracks price breakouts above/below the US Regular Trading Hours (09:30–16:00 EST) 15m opening range (09:30–09:45 EST).
2. Color-Coded Visuals:
- Each metric is displayed as a horizontal line with customizable colors (green for bullish, red for bearish, gray for neutral).
- Visual style options (dotted, dashed, or solid lines) allow for personalized chart clarity.
3. Dynamic Labels:
- Optional labels for each metric (Trend, Bias, VWAP, HTF, RTH) with customizable text, size (tiny to huge), and color.
- Labels update in real-time, providing clear identification of each meter’s role and current state.
4. Flexible Metric Selection:
- Toggle individual metrics (EMA, VWAP, HTF, RTH) on/off to focus on relevant indicators for your trading style.
- Option to use the previous bar’s close price for calculations, reducing noise in volatile markets.
5. RTH and Opening Range Analysis:
- Calculates the high/low of the opening range (09:30–09:45 EST) during RTH sessions.
- Signals bullish or bearish conditions when the price breaks above/below the opening range outside the initial 15-minute window.
6. Higher Timeframe Breakout Detection:
- Monitors HTF price action to identify breakouts of the previous candle’s high or low, combined with the HTF candle’s direction for trend confirmation.
How to Use:
- Trend Confirmation : Use the Trend and Bias Meters to confirm short-term and long-term market direction.
- Breakout Trading : Leverage the RTH Meter for breakout setups above/below the opening range during US trading hours.
- Support/Resistance : Utilize the VWAP Meter to identify dynamic price levels for entries or exits.
- Higher Timeframe Context : Monitor the HTF Meter for broader market trend alignment, ideal for swing or position trading.
- Customization : Adjust EMA lengths, toggle metrics, and customize visual styles and labels to suit your chart preferences.
Settings:
- Bias Settings :
- Fast EMA (default: 9), Slow EMA (default: 21), Bias EMA (default: 35).
- Higher Timeframe (default: 60-minute).
- Option to use previous close price for calculations.
- Enable/disable individual metrics (EMA, VWAP, HTF, RTH).
- Visual Settings :
- Bullish (green), bearish (red), and neutral (gray) colors.
- Line style (dotted, dashed, solid).
- Label Settings :
- Enable/disable labels.
- Customize label size (tiny, small, normal, large, huge) and text color.
- Custom text for each meter’s label (Trend, Bias, VWAP, HTF, RTH).
Notes:
- Optimized for intraday trading (e.g., 1m, 5m, 15m) but adaptable to any timeframe.
- RTH and opening range calculations are tailored for US markets (EST timezone); adjust session times in the code for other markets.
- Higher timeframe analysis enhances context for multi-timeframe strategies.
Ideal For:
- Intraday traders targeting RTH breakout opportunities.
- Swing traders aligning with higher timeframe trends.
- Traders using VWAP and EMA-based strategies for trend and momentum analysis.
- Those seeking a clean, customizable dashboard for multi-metric market analysis.

Overnight Time Box Overnight Time Box (22:59 → 09:59, minutes & TZ)
Automatically draws a time-based box for a customizable window that can cross midnight. Perfect for marking the overnight range up to London open (e.g., 22:59–09:59 in Europe/Bucharest), but works with any minute-level window.
What it does
Builds a daily box covering all price action between two user-defined times (e.g., 22:59 → 09:59).
Tracks session High/Low in real time and can plot extended HL lines for reference.
Keeps historical boxes on the chart for backtesting and review (no flicker, no errors).
How to use
Add the script to an intraday chart.
Configure:
Time zone (default: Europe/Bucharest).
Interval (HHMM-HHMM) — e.g., 2259-0959 (minutes supported).
Optional: High/Low lines, fill color, border color, line width.
Use on intraday timeframes (M1–H4).
Note: On Daily/Weekly/Monthly, a heads-up label reminds you it’s designed for intraday use.
Inputs
Time zone: correct DST handling.
Interval (HHMM-HHMM): supports windows that span midnight.
Draw High/Low lines: extended HL guides for the session.
Colors & widths: full visual customization.
Use cases
Mark the overnight range into London open (10:00 RO).
Delimit Killzones / ICT Silver Bullet windows.
Study range, liquidity raids, FVGs before major sessions.
Tech notes
Built on Pine Script v5 using input.session → stable, DST-safe.
Increased max_boxes_count / max_lines_count to preserve history.
Boxes are “frozen” at session end and remain on chart.
Limitations
Intended for intraday only.
One interval per script instance; attach multiple instances for multiple windows.

Volume Cluster Support and Resistance Levels [QuantAlgo]🟢 Overview
This indicator identifies statistically significant support and resistance levels through volume cluster analysis, isolating price zones characterized by elevated trading activity and institutional participation. By quantifying areas where volume concentration exceeded historical norms, it reveals price levels with demonstrated supply-demand imbalances that exhibit persistent influence on subsequent price action. The methodology is asset-agnostic and timeframe-independent, applicable across equities, cryptocurrencies, forex, and commodities from intraday to weekly intervals.
🟢 Key Features
1. Support and Resistance Levels
The indicator scans historical price data to identify bars where volume exceeds a user-defined threshold multiplier relative to the rolling average. For each qualifying bar, a representative price is calculated using the average of high, low, and close. Proximate price levels within a specified percentage range are then aggregated into discrete clusters using volume-weighted averaging, eliminating redundant signals. Clusters are ranked by cumulative volume to determine statistical significance. Finally, the indicator plots horizontal levels at each cluster price: support levels (green) below current price indicate zones where historical buying pressure exceeded selling pressure, while resistance levels (red) above current price mark zones where sellers historically dominated. These levels represent areas of established liquidity and price discovery, where institutional order flow previously concentrated.
The Touch Count (T) metric quantifies historical price interaction frequency, while Total Volume (TV) measures aggregate trading activity at each level, providing objective criteria for assessing level strength and trade execution decisions.
2. Volume Histogram
A histogram appears below the price chart, displaying relative volume for each bar within the lookback period, with bar height scaled to the maximum volume observed. Green bars represent up-periods (close > open) indicating buying pressure, while red bars show down-periods (close < open) indicating selling pressure. This visualization helps you confirm the validity of support/resistance levels by seeing where volume actually spiked, identify accumulation/distribution patterns, and validate breakouts by checking if they occur on above-average volume.
3. Built-in Alerts
Automated alerts trigger when price crosses below support levels or breaks above resistance levels, allowing you to monitor multiple assets without constant chart-watching.
4. Customizable Color Schemes
The indicator provides four preset color configurations (Classic, Aqua, Cosmic, Custom) optimized for visual clarity across different charting environments. Each scheme maintains consistent color mapping for support and resistance zones across both level lines and volume histogram components. The Custom configuration permits full color specification to accommodate individual charting setups, ensuring optimal visual contrast for extended analysis sessions.
Classic:
Aqua:
Cosmic:
Custom:
🟢 Pro Tips
→ Trade entry optimization: Execute long positions at support levels with high touch counts or upon confirmed resistance breakouts accompanied by above-average volume
→ Risk parameter definition: Position stop-loss orders near identified support/resistance zones with statistical significance to minimize premature exits
→ Breakout validation: Require volume confirmation exceeding historical average when price penetrates resistance to filter false breakouts
→ Level strength assessment: Prioritize levels with higher touch counts and total volume metrics for enhanced probability trade setups
→ Multi-timeframe confluence: Synthesize support/resistance levels across multiple timeframes to identify high-conviction zones where daily support aligns with 4-hour resistance structures

Custom Horizontal Lines | Trade Symmetry📊 Custom Horizontal Lines
🔍 Overview
The Custom Horizontal Lines is a precision utility designed for traders who perform manual higher-timeframe analysis and want to preserve their marked price levels directly on the chart.
It doesn’t calculate or detect anything automatically — instead, it acts as your personal level memory, preserving your analyzed zones and reference prices throughout the session.
Ideal for traders who manually mark the High, Low, Open, Close, Mean Thresholds, and Quarter Levels of Order Blocks, Fair Value Gaps, Inversion Fair Value Gaps and Wicks before the trading day begins.
⚙️ Key Features
✅ Manual Level Entry — Input your analyzed price levels (OB, FVG, WICK,etc) directly into the indicator settings.
✅ Preserved Levels — Once entered, your lines stay visible and consistent — even after switching symbols, timeframes, or reloading the chart.
✅ Supports All Level Types — Store any kind of manually defined level: OB highs/lows, FVG boundaries, Wicks, Mean Thresholds, Quarter levels, or custom reference prices.
✅ Clean Visualization — Customize line color, style, and labels for easy visual organization.
✅ Session-Ready Workflow — Built for pre-market preparation — enter your HTF levels once, and trade around them all day.
✅ No Auto Calculations — 100% manual by design — ensuring only your analyzed levels are shown, exactly as you defined them.
💡 How to Use
Open the indicator’s settings and manually enter those price values.
The indicator will plot and preserve those exact levels on your chart.
Switch to your lower timeframe and observe how price reacts around them — without ever needing to redraw.
🎯 Why It’s Useful
Keeps your HTF levels organized and persistent across sessions.
Saves time by avoiding redrawing.
Fits perfectly into ICT / Smart Money trading workflows.
Ensures full manual control and precision over what’s displayed on your chart.
🧩 Ideal For
ICT and Smart Money traders
Institutional-style manual analysts
Traders marking Mean Thresholds, or Quarter Levels of OBs, FVGs, Wicks etc
Anyone who wants a clean, reliable way to preserve their manual analysis

Quantum Fluxtrend [CHE] Quantum Fluxtrend — A dynamic Supertrend variant with integrated breakout event tracking and VWAP-guided risk management for clearer trend decisions.
Summary
The Quantum Fluxtrend builds on traditional Supertrend logic by incorporating a midline derived from smoothed high and low values, creating adaptive bands that respond to market range expansion or contraction. This results in fewer erratic signals during volatile periods and smoother tracking in steady trends, while an overlaid event system highlights breakout confirmations, potential traps, or continuations with visual lines, labels, and percentage deltas from the close. Users benefit from real-time VWAP calculations anchored to events, providing dynamic stop-loss suggestions to help manage exits without manual adjustments. Overall, it layers signal robustness with actionable annotations, reducing noise in fast-moving charts.
Motivation: Why this design?
Standard Supertrend indicators often generate excessive flips in choppy conditions or lag behind in low-volatility drifts, leading to whipsaws that erode confidence in trend direction. This design addresses that by centering bands around a midline that reflects recent price spreads, ensuring adjustments are proportional to observed variability. The added event layer captures regime shifts explicitly, turning abstract crossovers into labeled milestones with trailing VWAP for context, which helps traders distinguish genuine momentum from fleeting noise without over-relying on raw price action.
What’s different vs. standard approaches?
- Baseline reference: Diverges from the classic Supertrend, which uses average true range for fixed offsets from a median price.
- Architecture differences:
- Bands form around a central line averaged from smoothed highs and lows, with offsets scaled by half the range between those smooths.
- Regime direction persists until a clear breach of the prior opposite band, preventing premature reversals.
- Event visualization draws persistent lines from flip points, updating labels based on price sustainment relative to the trigger level.
- VWAP resets at each event, accumulating volume-weighted prices forward for a trailing reference.
- Practical effect: Charts show fewer direction changes overall, with color-coded annotations that evolve from initial breakout to continuation or trap status, making it easier to spot sustained moves early. VWAP lines provide a volume-informed anchor that curves with price, offering visual cues for adverse drifts.
How it works (technical)
The process starts by smoothing high and low prices over a user-defined period to form upper and lower references. A midline sits midway between them, and half the spread acts as a base for band offsets, adjusted by a multiplier to widen or narrow sensitivity. On each bar, the close is checked against the previous bar's opposite band: crossing above expands the lower band downward in uptrends, or below contracts the upper band upward in downtrends, creating a ratcheting effect that locks in direction until breached.
Persistent state tracks the current regime, seeding initial bands from the smoothed values if no prior data exists. Flips trigger new horizontal lines at the breach level, styled by direction, alongside labels that monitor sustainment—price holding above for up-flips or below for down-flips keeps the regime, while reversal flags a trap.
Separately, at each flip, a dashed VWAP line initializes at the breach price and extends forward, accumulating the product of typical prices and volumes divided by total volume. This yields a curving reference that updates bar-by-bar. Warnings activate if price strays adversely from this VWAP, tinting the background for quick alerts.
No higher timeframe data is pulled, so all computations run on the chart's native resolution, avoiding lookahead biases unless repainting is enabled via input.
Parameter Guide
SMA Length — Controls smoothing of highs and lows for midline and range base; longer values dampen noise but increase lag. Default: 20. Trade-offs: Shortens responsiveness in trends (e.g., 10–14) but risks more flips; extend to 30+ for stability in ranging markets.
Multiplier — Scales band offsets from the half-range; higher amplifies to capture bigger swings. Default: 1.0. Trade-offs: Above 1.5 widens for volatile assets, reducing false signals; below 0.8 tightens for precision but may miss subtle shifts.
Show Bands — Toggles visibility of basic and adjusted band lines for reference. Default: false. Tip: Enable briefly to verify alignment with price action.
Show Background Color — Displays red tint on VWAP adverse crosses for visual warnings. Default: false. Trade-offs: Helps in live monitoring but can clutter clean charts.
Line Width — Sets thickness for event and VWAP lines. Default: 2. Tip: Thicker (3–5) for emphasis on key levels.
+Bars after next event — Extends old lines briefly before cleanup on new flips. Default: 20. Trade-offs: Longer preserves history (40+) at resource cost; shorter keeps charts tidy.
Allow Repainting — Permits live-bar updates for smoother real-time view. Default: false. Tip: Disable for backtest accuracy.
Extension 1 Settings (Show, Width, Size, Decimals, Colors, Alpha) — Manages dotted connector from event label to current close, showing percentage change. Defaults: Shown, width 2, normal size, 2 decimals, lime/red for gains/losses, gray line, 90% transparent background. Trade-offs: Fewer decimals for clean display; adjust alpha for readability.
Extension 2 Settings (Show, Method, Stop %, Ticks, Decimals, Size, Color, Inherit, Alpha) — Positions stop label at VWAP end, offset by percent or ticks. Defaults: Shown, percent method, 1.0%, 20 ticks, 4 decimals, normal size, white text, inherit tint, 0% alpha. Trade-offs: Percent for proportional risk; ticks for fixed distance in tick-based assets.
Alert Toggles — Enables notifications for breakouts, continuations, traps, or VWAP warnings. All default: true. Tip: Layer with chart alerts for multi-condition setups.
Reading & Interpretation
The main Supertrend line colors green for up-regimes (price above lower band) and red for down (below upper band), serving as a dynamic support/resistance trail. Flip shapes (up/down triangles) mark regime changes at band breaches.
Event lines extend horizontally from flips: green for bull, red for bear. Labels start blank and update to "Bull/Bear Cont." if price sustains the direction, or "Trap" if it reverses, with colors shifting lime/red/gray accordingly. A dotted vertical links the trailing label to the current close, mid-labeled with the percentage delta (positive green, negative red).
VWAP dashes yellow (bull) or orange (bear) from the event, curving to reflect volume-weighted average. At its end, a left-aligned label shows suggested stop price, annotated with offset details. Background red hints at weakening if price crosses VWAP opposite the regime.
Deltas near zero suggest consolidation; widening extremes signal momentum buildup or exhaustion.
Practical Workflows & Combinations
- Trend following: Enter long on green flip shapes confirmed by higher highs, using the event line as initial stop below. Trail stops to VWAP for bull runs, exiting on trap labels or red background warnings. Filter with volume spikes to avoid low-conviction breaks.
- Exits/Stops: Conservative: Set hard stops at suggested SL labels. Aggressive: Hold through minor traps if delta stays positive, but cut on regime flip. Pair with momentum oscillators for overbought pullbacks.
- Multi-asset/Multi-TF: Defaults suit forex/stocks on 15m–4H; for crypto, bump multiplier to 1.5 for volatility. Scale SMA length proportionally across timeframes (e.g., double for daily). Combine with structure tools like Fibonacci for confluence on event lines.
Behavior, Constraints & Performance
Live bars update lines and labels dynamically if repainting is allowed, but signals confirm on close for stability—flips only trigger post-bar. No higher timeframe calls, so no inherent lookahead, though volume weighting assumes continuous data.
Resources cap at 1000 bars back, 50 lines/labels max; events prune old ones on new flips to stay under budget, with brief extensions for visibility. Arrays or loops absent, keeping it lightweight.
Known limits include lag in extreme gaps (e.g., overnight opens) where bands may not adjust instantly, and VWAP sensitivity to sparse volume in illiquid sessions.
Sensible Defaults & Quick Tuning
Start with SMA 20, multiplier 1.0 for balanced response across majors. For choppy pairs: Lengthen SMA to 30, multiplier 0.8 to tighten bands and cut flips. For trending equities: Shorten to 14, multiplier 1.2 for quicker entries. If traps dominate, enable bands to inspect range compression; for sluggish signals, reduce extension bars to focus on recent events.
What this indicator is—and isn’t
This serves as a visualization and signal layer for trend regimes and breakouts, highlighting sustainment via annotations and risk cues through VWAP—ideal atop price action for confirmation. It is not a standalone system, predictive oracle, or risk calculator; always integrate with broader analysis, position sizing, and stops. Use responsibly as an educational tool.
Disclaimer
The content provided, including all code and materials, is strictly for educational and informational purposes only. It is not intended as, and should not be interpreted as, financial advice, a recommendation to buy or sell any financial instrument, or an offer of any financial product or service. All strategies, tools, and examples discussed are provided for illustrative purposes to demonstrate coding techniques and the functionality of Pine Script within a trading context.
Any results from strategies or tools provided are hypothetical, and past performance is not indicative of future results. Trading and investing involve high risk, including the potential loss of principal, and may not be suitable for all individuals. Before making any trading decisions, please consult with a qualified financial professional to understand the risks involved.
By using this script, you acknowledge and agree that any trading decisions are made solely at your discretion and risk.
Do not use this indicator on Heikin-Ashi, Renko, Kagi, Point-and-Figure, or Range charts, as these chart types can produce unrealistic results for signal markers and alerts.
Best regards and happy trading
Chervolino

Average Daily Session Range PRO [Capitalize Labs]Average Daily Session Range PRO
The Average Daily Session Range PRO (ADSR PRO) is a professional-grade analytical tool designed to quantify and visualize the probabilistic range behavior of intraday sessions.
It calculates directional range statistics using historical session data to show how far price typically moves up or down from the session open.
This helps traders understand session volatility profiles, range asymmetry, and probabilistic extensions relative to prior performance.
Key Features
Asymmetric Range Modeling: Separately tracks average upside and downside excursions from each session open, revealing directional bias and volatility imbalance.
Probability Engine Modes: Choose between Rolling Window (fixed-length lookback) and Exponential Decay (weighted historical memory) to control how recent or historic data influences probabilities.
Session-Aware Statistics: Calculates values independently for each defined session, allowing region-specific insights (e.g., Tokyo, London, New York).
Dynamic Range Table: Displays key metrics such as average up/down ticks, expected range extensions, and percentage probabilities.
Adaptive Display: Works across timeframes and instruments, automatically aligning with user-defined session start and end times.
Visual Clarity: Includes clean range markers and labels optimized for both backtesting and live-chart analysis.
Intended Use
ADSR PRO is a statistical reference indicator.
It does not generate buy/sell signals or predictive forecasts.
Its purpose is to help users observe historical session behavior and volatility tendencies to support their own discretionary analysis.
Credits
Developed by Capitalize Labs, specialists in quantitative and discretionary market research tools.
Risk Warning
This material is educational research only and does not constitute financial advice, investment recommendation, or a solicitation to buy or sell any instrument.
Foreign exchange and CFDs are complex, leveraged products that carry a high risk of rapid losses; leverage amplifies both gains and losses, and you should not trade with funds you cannot afford to lose.
Market conditions can change without notice, and news or illiquidity may cause gaps and slippage; stop-loss orders are not guaranteed.
The analysis presented does not take into account your objectives, financial situation, or risk tolerance.
Before acting, assess suitability in light of your circumstances and consider seeking advice from a licensed professional.
Past performance and back-tested or hypothetical scenarios are not reliable indicators of future results, and no outcome or level mentioned here is assured.
You are solely responsible for all trading decisions, including position sizing and risk management.
No external links, promotions, or contact details are provided, in line with TradingView House Rules.

10Y–2Y Treasury Yield Curve Spread & MES % Change📝 Description:
This indicator tracks the U.S. 10-Year minus 2-Year Treasury yield spread — a powerful macroeconomic signal often used by professional traders to gauge market sentiment and recession risk — and overlays an optional MES % change line to help intraday futures traders spot macro–price divergences in real time.
Features:
🏦 Plots the 10Y–2Y spread, with optional EMA smoothing.
📉 Highlights yield curve inversion (background turns red when spread < 0).
📊 Optional MES % change line from daily or RTH open for directional bias.
🔔 Alert conditions for:
Yield curve inversion / un-inversion.
Sudden spread spikes in basis points (customizable).
🧮 Optional correlation plot to visualize relationship strength between MES and the yield curve.
🧭 Z-score normalization allows both series to be viewed in one pane without scaling issues.
Why it matters:
A falling or inverted 2s10s spread often signals risk-off behavior and pressure on equities.
A steepening curve tends to support risk-on rallies.
Divergences between MES price action and the spread can provide early warning signals of reversals or fakeouts.
Best used with:
MES (MES1!) or MYM charts for intraday & swing bias.
Fed event days, CPI/NFP, or any macro-sensitive sessions.
VWAP or structure-based intraday trading strategies.
⚠️ Note: This indicator is for informational purposes only and does not constitute financial advice. Always combine macro context with your own trade plan and risk management.

Asia & London Session High/Low – EOD Segments (v4.5)What it does
Plots the Asia and London session high & low each day.
When a session ends, its high/low are locked (non-repainting) and drawn as horizontal segments that auto-extend to the end of that same day (no infinite rays).
Optional labels show the exact level at session close.
Toggle whether to keep prior days on the chart or auto-clear them on the first bar of a new day.
Why traders use it
Quickly see overnight liquidity levels that often act as magnets or barriers during the U.S. session.
Map session range extremes for breakout/reversal planning, partials, and invalidation.
Works great alongside VWAP, 8/20/200 MAs, or your NY session tools to build confluence.
How it works
You define the session windows (defaults: Asia 00:00–06:00, London 07:00–11:00).
While a session is active, the script tracks running high/low.
On the bar after the session ends, the level is finalized and drawn; the segment’s right edge updates each bar until EOD, then stops automatically.
Inputs
Session Timezone: “Exchange”, UTC, or a specific region (set this to match your venue).
Asia / London Session: editable HHMM-HHMM windows.
Show Asia / Show London: enable either/both sessions.
Keep history: keep or auto-delete previous days.
Show labels: price labels at session close.
Colors & width: customize high/low colors and line width.
Best practices
Use on intraday timeframes (1–60m).
For equities/futures, set timezone to your exchange (e.g., America/New_York). For FX/crypto, pick what matches your workflow.
Common tweak: London 08:00–12:00 local; Asia 00:00–05:00 or your broker’s definition.
Notes
Non-repainting: levels only print once the session is complete.
Designed to be light and reliable—no boxes, just clean lines and labels.
If you want NY session levels, midlines (50%), anchored stop-time, or alerts on touches, this script can be extended.
For educational use only. Not financial advice.

ICT Liquidity Sweep Asia/London 1 Trade per High & Low🧠 ICT Liquidity Sweep Asia/London — 1 Trade per High & Low
This strategy is inspired by the ICT (Inner Circle Trader) concepts of liquidity sweeps and market structure, focusing on the Asia and London sessions.
It automatically identifies liquidity grabs (sweeps) above or below key session highs/lows and enters trades with a fixed risk/reward ratio (RR).
----------------------------------------------------------------------------------
----------------------------------------------------------------------------------
⚙️ Core Logic
-Asia Session: 8:00 PM – 11:59 PM (New York time)
-London Session: 2:00 AM – 5:00 AM (New York time)
-The script marks the Asia High/Low and London High/Low ranges for each day.
-When the market sweeps above a session high → potential Short setup
-When the market sweeps below a session low → potential Long setup
-A trade is triggered when the confirmation candle closes in the opposite direction of the sweep (bearish after a high sweep, bullish after a low sweep).
-Only one trade per sweep type (1 per High, 1 per Low) is allowed per session.
----------------------------------------------------------------------------------
----------------------------------------------------------------------------------
📈 Risk Management
-Configurable Risk/Reward Target (default = 2:1)
-Configurable Position Size (number of contracts)
-Each trade uses a fixed Stop Loss (beyond the wick of the sweep) and a Take Profit calculated from the RR setting.
-All trades are automatically logged in the Strategy Tester with performance metrics.
----------------------------------------------------------------------------------
----------------------------------------------------------------------------------
💡 Features
✅ Visual session highlighting (Asia = Aqua, London = Orange)
✅ Automatic liquidity line plotting (session highs/lows)
✅ Entry & exit labels (optional visual display)
✅ Customizable RR and contract size
✅ Works on any instrument (ideal for indices, futures, or forex)
✅ Compatible with all timeframes (optimized for 1M–15M)
----------------------------------------------------------------------------------
----------------------------------------------------------------------------------
⚠️ Notes
-Best used on New York time-based charts.
-Designed for educational and backtesting purposes — not financial advice.
-Use as a foundation for further optimization (e.g., SMT confirmation, FVG filter, or time-based restrictions).
----------------------------------------------------------------------------------
----------------------------------------------------------------------------------
🧩 Recommended Use
Pair this with:
-ICT’s concepts like CISD (Change in State of Delivery) and FVGs (Fair Value Gaps)
-Higher timeframe liquidity maps
-Session bias or daily narrative filters
----------------------------------------------------------------------------------
----------------------------------------------------------------------------------
Author: jygirouard
Strategy Version: 1.3
Type: ICT Liquidity Sweep Automation
Timezone: America/New_York

Realtime RenkoI've been working on real-time renko for a while as a coding challenge. The interesting problem here is building renko bricks that form based on incoming tick data rather than waiting for bar closes. Every tick that comes through gets processed immediately, and when price moves enough to complete a brick, that brick closes and a new one opens right then. It's just neat because you can run it and it updates as you'd expect with renko, forming bricks based purely on price movement happening in real time rather than waiting for arbitrary time intervals to pass.
The three brick sizing methods give you flexibility in how you define "enough movement" to form a new brick. Traditional renko uses a fixed price range, so if you set it to 10 ticks, every brick represents exactly 10 ticks of movement. This works well for instruments with stable tick sizes and predictable volatility. ATR-based sizing calculates the average true range once at startup using a weighted average across all historical bars, then divides that by your brick value input. If you want bricks that are one full ATR in size, you'd use a brick value of 1. If you want half-ATR bricks, use 2. This inverted relationship exists because the calculation is ATR divided by your input, which lets you work with multiples and fractions intuitively. Percentage-based sizing makes each brick a fixed percentage move from the previous brick's close, which automatically scales with price level and works well for instruments that move proportionally rather than in absolute tick increments.
The best part about this implementation is how it uses varip for state management. When you first load the indicator, there's no history at all. Everything starts fresh from the moment you add it to your chart because varip variables only exist in real-time. This means you're watching actual renko bricks form from real tick data as it arrives. The indicator builds its own internal history as it runs, storing up to 250 completed bricks in memory, but that history only exists for the current session. Refresh the page or reload the indicator and it starts over from scratch.
The visual implementation uses boxes for brick bodies and lines for wicks, drawn at offset bar indices to create the appearance of a continuous renko chart in the indicator pane. Each brick occupies two bar index positions horizontally, which spaces them out and makes the chart readable. The current brick updates in real time as new ticks arrive, with its high, low, and close values adjusting continuously until it reaches the threshold to close and become finalized. Once a brick closes, it gets pushed into the history array and a new brick opens at the closing level of the previous one.
What makes this especially useful for debugging and analysis are the hover tooltips on each brick. Clicking on any brick brings up information showing when it opened with millisecond precision, how long it took to form from open to close, its internal bar index within the renko sequence, and the brick size being used. That time delta measurement is particularly valuable because it reveals the pace of price movement. A brick that forms in five seconds indicates very different market conditions than one that takes three minutes, even though both bricks represent the same amount of price movement. You can spot acceleration and deceleration in trend development by watching how quickly consecutive bricks form.
The pine logs that generate when bricks close serve as breadcrumbs back to the main chart. Every time a brick finalizes, the indicator writes a log entry with the same information shown in the tooltip. You can click that log entry and TradingView jumps your main chart to the exact timestamp when that brick closed. This lets you correlate renko brick formation with what was happening on the time-based chart, which is critical for understanding context. A brick that closed during a major news announcement or at a key support level tells a different story than one that closed during quiet drift, and the logs make it trivial to investigate those situations.
The internal bar indexing system maintains a separate count from the chart's bar_index, giving each renko brick its own sequential number starting from when the indicator begins running. This makes it easy to reference specific bricks in your analysis or when discussing patterns with others. The internal index increments only when a brick closes, so it's a pure measure of how many bricks have formed regardless of how much chart time has passed. You can match these indices between the visual bricks and the log entries, which helps when you're trying to track down the details of a specific brick that caught your attention.
Brick overshoot handling ensures that when price blows through the threshold level instead of just barely touching it, the brick closes at the threshold and the excess movement carries over to the next brick. This prevents gaps in the renko sequence and maintains the integrity of the brick sizing. If price shoots up through your bullish threshold and keeps going, the current brick closes at exactly the threshold level and the new brick opens there with the overshoot already baked into its initial high. Without this logic, you'd get renko bricks with irregular sizes whenever price moved aggressively, which would undermine the whole point of using fixed-range bricks.
The timezone setting lets you adjust timestamps to your local time or whatever reference you prefer, which matters when you're analyzing logs or comparing brick formation times across different sessions. The time delta formatter converts raw milliseconds into human-readable strings showing days, hours, minutes, and seconds with fractional precision. This makes it immediately clear whether a brick took 12.3 seconds or 2 minutes and 15 seconds to form, without having to parse millisecond values mentally.
This is the script version that will eventually be integrated into my real-time candles library. The library version had an issue with tooltips not displaying correctly, which this implementation fixes by using a different approach to label creation and positioning. Running it as a standalone indicator also gives you more control over the visual settings and makes it easier to experiment with different brick sizing methods without affecting other tools that might be using the library version.
What this really demonstrates is that real-time indicators in Pine Script require thinking about state management and tick processing differently than historical indicators. Most indicator code assumes bars are immutable once closed, so you can reference `close ` and know that value will never change. Real-time renko throws that assumption out because the current brick is constantly mutating with every tick until it closes. Using varip for state variables and carefully tracking what belongs to finalized bricks versus the developing brick makes it possible to maintain consistency while still updating smoothly in real-time. The fact that there's no historical reconstruction and everything starts fresh when you load it is actually a feature, not a limitation, because you're seeing genuine real-time brick formation rather than some approximation of what might have happened in the past.

Equinox Wolf - ICT MacrosEquinox Wolf – ICT Macros plots the key ICT session macro windows on your chart so you can focus on how price behaves inside each time range. The script anchors every session to America/New_York time, updates live or in backtesting, and only keeps the current trading day on screen, avoiding clutter from prior sessions. Each window can be toggled individually, the box fill, borders, and high/low/equilibrium levels share global color and style controls, and the levels extend forward until the next macro begins. Use it to highlight the ICT LND, NYAM, lunch, afternoon, and final-hour ranges and monitor how price reacts around their highs, lows, and midpoints.

Daily Levels: PD / PM / OR (RTH/Pre)# Daily Levels: PD / PM / OR (RTH/Pre)
## Overview
This indicator displays key intraday support and resistance levels for US equity markets, specifically designed for traders who use Previous Day, Pre-Market, and Opening Range levels in their trading strategy.
## Key Features
**Seven Critical Levels Displayed:**
- **PDH (Previous Day High)** - Blue line: The highest price from yesterday's regular trading hours (9:30 AM - 4:00 PM ET)
- **PDL (Previous Day Low)** - Blue line: The lowest price from yesterday's regular trading hours
- **PDC (Previous Day Close)** - Orange line: The closing price from yesterday's regular trading hours
- **PMH (Pre-Market High)** - Yellow line: The highest price during today's pre-market session (4:00 AM - 9:30 AM ET)
- **PML (Pre-Market Low)** - Yellow line: The lowest price during today's pre-market session
- **ORH (Opening Range High)** - Red line: The highest price during the first 30 minutes of trading (9:30 AM - 10:00 AM ET)
- **ORL (Opening Range Low)** - Red line: The lowest price during the first 30 minutes of trading
## How It Works
**At 9:30 AM ET (Market Open):**
- PDH, PDL, PDC levels appear (from previous day's RTH)
- PMH, PML levels appear (from today's pre-market session)
- All lines begin at the 9:30 AM bar and extend right
**At 10:00 AM ET (Opening Range Close):**
- ORH, ORL levels appear (from today's first 30 minutes)
- Lines begin at the 9:30 AM bar and extend right
**Level Persistence:**
- All levels remain visible until the next trading day at 9:30 AM ET
- Levels reset daily for the new trading session
## Use Cases
**Day Trading:**
- Identify key support and resistance zones before placing trades
- Use PDH/PDL as potential profit targets or stop loss areas
- Monitor price reaction at pre-market levels for early trading signals
- Trade breakouts or rejections at opening range levels
**Swing Trading:**
- Assess daily momentum by observing breaks above/below previous day levels
- Use multiple timeframes while maintaining consistent reference points
**Market Structure:**
- Quickly identify if the market is trading above or below key levels
- Recognize accumulation/distribution patterns around these zones
## Technical Details
- **Timezone:** All times referenced are US Eastern Time (America/New_York)
- **Session Windows:**
- Pre-Market: 4:00 AM - 9:30 AM ET
- Regular Trading Hours: 9:30 AM - 4:00 PM ET
- Opening Range: 9:30 AM - 10:00 AM ET
- **Timeframe Agnostic:** Works on any chart timeframe
- **Visual Clarity:** Color-coded lines and labels for easy identification
## Color Scheme
- **Blue:** Previous Day levels (PDH, PDL)
- **Orange:** Previous Day Close (PDC)
- **Yellow:** Pre-Market levels (PMH, PML)
- **Red:** Opening Range levels (ORH, ORL)
## Best Practices
1. Use on US equity indices (SPY, QQQ, ES, NQ) and liquid US stocks
2. Combine with volume analysis for confirmation
3. Pay attention to how price reacts at these levels (bounce vs. break)
4. Most effective during the first 2 hours of trading when volatility is highest
5. Consider the market context (trending vs. ranging) when interpreting these levels
## Note
This indicator is specifically designed for US market hours. Results may vary when applied to international markets or instruments with different trading sessions.

ATR Adaptive (auto timeframe)This indicator automatically adjusts the Average True Range (ATR) period based on the current chart timeframe, helping traders define dynamic Stop Loss (SL) and Take Profit (TP) levels that adapt to market volatility.
The ATR measures the average range of price movement over a defined number of bars. By using adaptive periods, the indicator ensures that volatility is interpreted consistently across different timeframes — from 1-minute charts to daily or weekly charts.
It plots two main levels on the chart:
🔴 Low – ATR × Multiplier → Suggested Stop Loss (below the candle’s low)
🟢 High + ATR × Multiplier → Suggested Take Profit or trailing level (above the candle’s high)
Optional additional lines show ATR-based TP levels calculated from the current close.
💡 How to use
Select your desired ATR multiplier (e.g., 1.3× for SL, 1.0× for TP).
The script automatically detects the chart timeframe and uses an appropriate ATR length (e.g., ATR(30) on M5, ATR(21) on H1, ATR(14) on Daily).
Use the plotted levels to:
Set Stop Loss just below the red ATR band (for long trades).
Set Take Profit near or slightly below the green ATR band (for short trades, reverse logic).
⚙️ Why it helps
Maintains consistent volatility-based risk across multiple timeframes.
Avoids arbitrary fixed SL/TP values.
Makes the trading strategy more responsive in high-volatility markets and more conservative when volatility contracts.
Particularly useful for intraday and swing trading, where volatility varies significantly between sessions.

HTF Cross Breakout [CHE] HTF Cross Breakout — Detects higher timeframe close crossovers for breakout signals, anchors VWAP for trend validation, and flags continuations or traps with visual extensions for delta percent and stop levels.
Summary
This indicator spots moments when the current chart's close price crosses a higher timeframe close, marking potential breakouts only when the current bar shows directional strength. It anchors a volume-weighted average price line from the breakout point to track trend health, updating labels to show if the move continues or reverses into a trap. Extensions add a dotted line linking the breakout level to the current close with percent change display, plus a stop-loss marker at the VWAP end. Signals gain robustness from higher timeframe confirmation and anti-repainting options, reducing noise in live bars compared to simple crossover tools.
Motivation: Why this design?
Traders often face false breakouts from intrabar wiggles on lower timeframes, especially without higher timeframe alignment, leading to whipsaws in volatile sessions. This design uses higher timeframe close as a stable reference for crossover detection, combined with anchored volume weighting to gauge sustained momentum. It addresses these by enforcing bar confirmation and directional filters, providing clearer entry validation and risk points without overcomplicating the chart.
What’s different vs. standard approaches?
Reference baseline
Standard crossover indicators like moving average crosses operate solely on the chart timeframe, ignoring higher timeframe context and lacking volume anchoring.
Architecture differences
- Higher timeframe data pulls via security calls with optional repainting control for stability.
- Anchored VWAP resets at each signal, accumulating from the breakout bar only.
- Label dynamics update in real-time for continuation checks, with extensions for visual delta and stop computation.
- Event-driven line finalization prunes old elements after a set bar extension.
Practical effect
Charts show persistent lines and labels that extend live but finalize cleanly on new events, avoiding clutter. This matters for spotting trap reversals early via label color shifts, and extensions provide quick risk visuals without manual calculations, improving decision speed in trend trades.
How it works (technical)
The indicator first determines a higher timeframe based on user selection, pulling its close price securely. It checks for crossovers or crossunders of the current close against this higher close, but only triggers on confirmed bars with matching directional opens and closes. On a valid event, a horizontal line and label mark the higher close level, while a dashed VWAP line starts accumulating typical price times volume from that bar onward. During the active phase, the breakout line extends to the current bar, the label repositions and updates text based on whether the current close holds above or below the level for bulls or bears. A background tint warns if the close deviates adversely from the current VWAP. Extensions draw a vertical dotted line at the last bar between the breakout level and close, placing a midpoint label with percent difference; separately, a label at the VWAP end shows a computed stop price. Persistent variables track the active state and accumulators, resetting on new events after briefly extending old elements. Repaint risk from security calls is mitigated by confirmed bar gating or user opt-in.
Parameter Guide
Plateau Length (reserved for future, currently unused): Sets a length for potential plateau detection in extensions; default 3, minimum 1. Higher values would increase stability but are not active yet—leave at default to avoid tuning.
Line Width: Controls thickness of breakout, VWAP, and extension lines; default 2, range 1 to 5. Thicker lines improve visibility on busy charts but may obscure price action—use 1 for clean views, 3 or more for emphasis.
+Bars after next HTF event (finalize old, then delete): Extends old lines and labels by this many bars before deletion on new signals; default 20, minimum 0. Shorter extensions keep charts tidy but risk cutting visuals prematurely; longer aids review but builds clutter over time.
Evaluate label only on HTF close (prevents gray traps intrabar): When true, label updates wait for higher timeframe confirmation; default true. Enabling reduces intrabar flips for stabler signals, though it may delay feedback—disable for faster live trading at repaint cost.
Allow Repainting: Permits real-time security data without confirmation offset; default false. False ensures historical accuracy but lags live bars; true speeds updates but can repaint on HTF closes.
Timeframe Type: Chooses HTF method—Auto Timeframe (dynamic steps up), Multiplier (chart multiple), or Manual (fixed string); default Auto Timeframe. Auto adapts to chart scale for convenience; Multiplier suits custom scaling like 5 times current; Manual for precise like 1D on any chart.
Multiplier for Alternate Resolution: Scales chart timeframe when Multiplier type selected; default 5, minimum 1. Values near 1 mimic current resolution for subtle shifts; higher like 10 jumps to broader context, increasing signal rarity.
Manual Resolution: Direct timeframe string like 60 for 1H when Manual type; default 60. Match to trading horizon—shorter for swing, longer for positional—to balance frequency and reliability.
Show Extension 1: Toggles dotted line and delta percent label between breakout level and current close; default true. Disable to simplify for basic use, enable for precise momentum tracking.
Dotted Line Width: Thickness for Extension 1 line; default 2, range 1 to 5. Align with main Line Width for consistency.
Text Size: Size for delta percent label; options tiny, small, normal, large; default normal. Smaller reduces overlap on dense charts; larger aids glance reads.
Decimals for Δ%: Precision in percent change display; default 2, range 0 to 6. Fewer decimals speed reading; more suit low-volatility assets.
Positive Δ Color: Hue for upward percent changes; default lime. Choose contrasting for visibility.
Negative Δ Color: Hue for downward percent changes; default red. Pair with positive for quick polarity scan.
Dotted Line Color: Color for Extension 1 line; default gray. Neutral tones blend well; brighter for emphasis.
Background Transparency (0..100): Opacity for delta label background; default 90. Higher values fade for subtlety; lower solidifies for readability.
Show Extension 2: Toggles stop-loss label at VWAP end; default true. Turn off for entry focus only.
Stop Method: Percent from VWAP end or fixed ticks; options Percent, Ticks; default Percent. Percent scales with price levels; Ticks suits tick-based instruments.
Stop %: Distance as fraction of VWAP for Percent method; default 1.0, step 0.05, minimum 0.0. Tighter like 0.5 reduces risk but increases stops; wider like 2.0 allows breathing room.
Stop Ticks: Tick count offset for Ticks method; default 20, minimum 0. Adjust per asset volatility—fewer for tight control.
Price Decimals: Rounding for stop price text; default 4, range 0 to 10. Match syminfo.precision for clean display.
Text Size: Size for stop label; options tiny, small, normal, large; default normal. Scale to chart zoom.
Text Color: Foreground for stop text; default white. Ensure contrast with background.
Inherit VWAP Color (BG tint): Bases stop label background on VWAP hue; default true. True maintains theme; false allows custom black base.
BG Transparency (0..100): Opacity for stop label background; default 0. Zero for no tint; up to 100 for full fade.
Reading & Interpretation
Breakout lines appear green for bullish crosses or red for bearish, extending live until a new event finalizes them briefly then deletes. Labels start blank, updating to Bull Cont. or Bear Cont. in matching colors if holding the level, or gray Bull Trap/Bear Trap on reversal. VWAP dashes yellow for bulls, orange for bears, sloping with accumulated volume weight—deviations trigger faint red background warnings. Extension 1's dotted vertical shows at the last bar, with midpoint label green/red for positive/negative percent from breakout to close. Extension 2 places a left-aligned label at VWAP end with stop price and method note, tinted to VWAP for context.
Practical Workflows & Combinations
For trend following, enter long on green Bull Cont. labels above VWAP with higher highs confirmation, filtering via rising structure; short on red Bear Cont. below. Pair with volume surges or RSI above 50 for bulls to avoid traps. For exits, trail stops using the Extension 2 level, tightening on warnings or gray labels—aggressive on continuations, conservative post-trap. In multi-timeframe setups, use default Auto on 15m charts for 1H signals, scaling multiplier to 4 for daily context on hourly; test on forex/stocks where volume is reliable, avoiding low-liquidity assets.
Behavior, Constraints & Performance
Signals confirm on bar close with HTF gating when strict mode active, but live bars may update if repainting enabled—opt false for backtest fidelity, true for intraday speed. Security calls risk minor repaints on HTF closes, mitigated by confirmation offsets. Resources cap at 1000 bars back, 50 lines/labels total, with event prunes to stay under budgets—no loops, minimal arrays. Limits include VWAP lag in low-volume periods and dependency on accurate HTF data; gaps or holidays may skew anchors.
Sensible Defaults & Quick Tuning
Defaults suit 5m-1H charts on liquid assets: Auto HTF, no repaint, 1% stops. For choppy markets with excess signals, enable strict eval and bump multiplier to 10 for rarer triggers. If sluggish in trends, shorten extend bars to 10 and allow repainting for quicker visuals. On high-vol like crypto, widen stop % to 2.0 and use Ticks method; for stables like indices, tighten to 0.5% and keep Percent.
What this indicator is—and isn’t
This is a signal visualization layer for breakout confirmation and basic risk marking, best as a filter in discretionary setups. It isn’t a standalone system or predictive oracle—combine with price structure, news awareness, and sizing rules for real edges.
Disclaimer
The content provided, including all code and materials, is strictly for educational and informational purposes only. It is not intended as, and should not be interpreted as, financial advice, a recommendation to buy or sell any financial instrument, or an offer of any financial product or service. All strategies, tools, and examples discussed are provided for illustrative purposes to demonstrate coding techniques and the functionality of Pine Script within a trading context.
Any results from strategies or tools provided are hypothetical, and past performance is not indicative of future results. Trading and investing involve high risk, including the potential loss of principal, and may not be suitable for all individuals. Before making any trading decisions, please consult with a qualified financial professional to understand the risks involved.
By using this script, you acknowledge and agree that any trading decisions are made solely at your discretion and risk.
Do not use this indicator on Heikin-Ashi, Renko, Kagi, Point-and-Figure, or Range charts, as these chart types can produce unrealistic results for signal markers and alerts.
Best regards and happy trading
Chervolino

Illuminati Zone🟣 Illuminati Zone — Hidden Power of the 11 PM NZ Candle
The Illuminati Zone reveals the hidden footprints of liquidity and market imbalance formed by the 11 PM New Zealand 15-minute candle — a time when global liquidity transitions between major sessions.
This candle often defines key intraday supply and demand boundaries, serving as a magnet for price and a pivot point for high-probability reversals or breakouts.
🧠 How it works
Automatically detects and marks the 11 PM NZ 15-minute candle each day.
Draws a translucent zone box between its high and low.
Extends two reference lines at +1 × range and –1 × range above and below the zone — ideal for spotting overextensions or liquidity sweeps.
Supports custom lookback, colors, and visual options.
💡 How to use it
Watch how price interacts with the zone — rejection often signals smart-money activity.
Use +1 and –1 levels as overextended zones for potential reversals or breakout retests.
Combine with your own confluence tools or volume analysis for precision entries.
⚙️ Customization Options
Target hour (NZ time)
Days back to display
Zone and line colors
Transparency and visual preferences
🔮 Pro Tip: Pair it with a volume or imbalance indicator for surgical-level precision in identifying where smart money positions are built or released.

Adaptive Z-Momentum (AZM) [Blk0ut]Adaptive Z-Momentum (AZM) is a momentum indicator that expresses the normalized deviation of price from a dynamic anchor (VWAP or EMA) in standard-score (z-score) terms, with adaptive “extreme” thresholds, trend sensitivity, and optional regime filtering. The line color, background shading, and labels help you visually discern when momentum is mild, building, or overextended.
---
## Features & Concept
* Computes **z = (price – anchor) / σ**, where the anchor is either Session VWAP (intraday) or EMA (non-intraday).
* Uses exponential moving averages (EWMA) to adaptively estimate the running mean and variance, making the indicator responsive to regime changes.
* Defines an **adaptive extreme threshold** (±z threshold) based on the chosen percentile of |z| over a lookback window (e.g. 90th percentile) — dynamically adjusting to volatility environment.
* Colors the main z-line **differently when inside vs. outside the extreme thresholds**, giving immediate visual feedback.
* Optionally shades the background when momentum is over the extremes (bullish or bearish).
* Supports a **self-tuning mode** (ADX-aware) that tightens or relaxes lookback/smoothing in strong trend vs. chop regimes.
* Regime filtering options (EMA slope or ADX threshold) let you filter signals in trend vs. non-trend markets.
* Plots Δz (the change in z) in various styles to help detect acceleration or deceleration in momentum.
* Adds optional thrust/fade labels to highlight when z crosses ±extreme zones, or when momentum stalls.
---
## How to Use
* Look for **z crossing** above zero (bullish momentum) or below zero (bearish momentum).
* When **z enters the extreme band**, it suggests strong momentum; when it exits, that may indicate exhaustion or reversal.
* Watch **Δz** (momentum acceleration) for clues of weakening or strengthening momentum before z itself reacts.
* Use the **regime filter** to enforce that signals only count in favorable directional markets.
* Customize inputs: lookback window, smoothing length, extreme percentile, ADX/auto settings, colors, etc., to match your trading style and timeframe.
*Use VWAP as the anchor on intraday/session charts — because it resets each session, it highlights deviations from session “fair value” and captures volume-flow bias.
*Use EMA on swing or multi-day charts — it doesn’t reset, so it preserves trend structure and gives a smoother momentum baseline across sessions.
*In trending markets, EMA tends to deliver more reliable momentum extremes; in range or mean-reversion regimes, VWAP often gives more intuitive reversal zones.
---
## Limitations & Disclaimers
* Like all indicators, AZM is **lagging** (though adaptive) and should not be used as a standalone entry/exit trigger — always combine with price action, structure, or confirmation.
* The extreme thresholds are **percentile-based**, meaning in very quiet or very noisy periods, “extreme” may shift rapidly; use your eyes alongside the indicator.
* Because the script uses historical data and smoothing, earlier bars may differ from real-time behavior.
* Past behavior is no guarantee of future performance. Use proper risk management and test ideas on historical data before trading live.
---
## Inputs & Customization
* **Anchor** mode: Session VWAP (intraday) or EMA
* **Lookback window** and **smoothing EMA** for computing z
* **Extreme percentile** (e.g. 90) to define ±z thresholds
* **Auto / ADX-based tuning** to allow dynamic parameter changes in trending vs chop markets
* **Regime filter** (EMA slope or ADX) to restrict signals to trending conditions
* **Color settings** for inside vs outside extremes, background shading, zero line, Δz style, labels, etc.
* **Show/hide labels**, choose Δz style (columns, histogram, line, etc.)
---
## Why It’s Useful
By combining standard-score normalization with adaptive thresholds and regime sensitivity, AZM helps you see **relative momentum extremes** in a way that adjusts to market regime shifts. The dual visual cues (line color + background) reduce ambiguity at a glance.
---
MTF TR HelperThe “MTF TR Helper” is a TradingView indicator that displays TC888’s Time Rotation (TR) slots for the London and New York sessions. It’s designed for intraday traders who want precise timing references based on TC888’s method.
It marks expert-level (orange) and sweetspot (green) TR timings directly on the chart using small visual cues. These slots help identify potential points of interest during active market hours. The script is optimized for lower timeframes and automatically filters out markers on higher timeframes to reduce clutter.
Key Features:
• 🔶 Orange lines = Expert TR slots (per TC888)
• 🟢 Green lines = Sweetspot TR slots (per TC888)
• ⚪ Dots = Hourly rotation points, including new 4-hour bars
• 📈 Works best on 1m and 5m charts; adapts visibility based on timeframe
• 🕒 Built on London and New York time zone references
This tool follows the timing logic of TC888, offering a clean and practical way to stay aligned with key session-based rotations.

Candle Color [AY¹]Visually highlight specific time periods with custom colors on intraday charts.
Ideal for session-based traders who want to emphasize New York, London or any custom trading hours. Developed by AY¹
Candle Color Highlighter
A simple yet powerful intraday visualization tool that colors candles or chart background during your chosen trading sessions.
Perfect for traders who rely on time-based confluences — such as ICT, SMC, or session scalping frameworks.
🔧 Key Features
✅ Highlight up to four custom time periods (e.g. London Open, NY Open, Lunch Hour, etc.)
✅ Supports multiple highlight styles:
• Bar Color only
• Background only
• Both
✅ Full timezone control (Exchange, UTC, New York, London, Tokyo, or custom UTC+3)
✅ Works on all intraday timeframes or only those you select (1m–4h).
✅ Optional labels marking session starts.
✅ Integrated alerts when any period becomes active.
✅ Informative status table showing timezone, timeframe, and active period.
🕒 Use Cases
Highlight New York Killzone (07:30–09:30) or London Open (02:00–03:00)
Separate different liquidity windows
Emphasize your backtest periods
Combine with volume, displacement, or structure indicators for time-based confluence setups
🎨 Customization
Each of the four configurable periods allows you to choose:
Start/End time
Custom color and transparency
Session label visibility
Highlight style preference
💡 Example Setup
Period Session Time Color Notes
Period 1 02:00–03:00 Magenta London Killzone
Period 2 07:30–08:30 Yellow NY Pre-market
Period 3 08:30–09:30 Blue NY Open
Period 4 09:30–10:00 Green Initial Balance
VWAP Deviation Oscillator [BackQuant]VWAP Deviation Oscillator
Introduction
The VWAP Deviation Oscillator turns VWAP context into a clean, tradeable oscillator that works across assets and sessions. It adapts to your workflow with four VWAP regimes plus two rolling modes, and three deviation metrics: Percent, Absolute, and Z-Score. Colored zones, optional standard deviation rails, and flexible plot styles make it fast to read for both trend following and mean reversion.
What it does
This tool measures how far price is from a chosen VWAP and expresses that gap as an oscillator. You can view the deviation as raw price units, percent, or standardized Z-Score. The plot can be a histogram or a line with optional fills and sigma bands, so you can quickly spot polarity shifts, overbought and oversold conditions, and strength of extension.
VWAP modes track a session VWAP that resets (4H, Daily, Weekly) or a rolling VWAP that updates continuously over a fixed number of bars or days.
Deviation modes let you choose the lens: Percent, Absolute, or Z-Score. Each highlights different aspects of stretch and mean pressure.
Visual encoding uses a 10-zone color palette to grade the magnitude of deviation on both sides of zero.
Volatility guards compute mode-specific sigma so thresholds are stable even when volatility compresses.
Why this works
VWAP is a high signal anchor used by institutions to gauge fair participation. Deviations around VWAP cluster in regimes: mild oscillations within a band, decisive pushes that signal imbalance, and standardized extremes that often precede either continuation or snapback. Expressing that distance as a single time series adds clarity: bias is the oscillator’s sign, risk context is its magnitude, and regime is the way it behaves around sigma lines.
How to use it
Trend following
Favor the side of the zero line. Bullish when the oscillator is above zero and making higher swing highs. Bearish when below zero and making lower swing lows. Use +1 sigma and +2 sigma in your mode as strength tiers. Pullbacks that hold above zero in uptrends, or below zero in downtrends, are often continuation entries.
Mean reversion
Fade stretched readings when structure supports it. Look for tests of +2 sigma to +3 sigma that fail to progress and roll back toward zero, or the mirror on the downside. Z-Score mode is best when you want standardized gates across assets. Percent mode is intuitive for intraday scalps where a given percent stretch tends to mean revert.
Session playbook
Use Daily or Weekly VWAP for intraday or swing context. Rolling modes help when the asset lacks clean session boundaries or when you want a continuous anchor that adapts to liquidity shifts.
Key settings
VWAP computation
VWAP Mode = 4 Hours, Daily, Weekly, Rolling (Bars), Rolling (Days). Session modes reset the VWAP when a new session begins. Rolling modes compute VWAP over a fixed trailing window.
Rolling (Lookback: Bars) controls the trailing bar count when using Rolling (Bars).
Rolling (Lookback: Days) converts days to bars at runtime and uses that trailing span.
Use Close instead of HLC3 switches the price reference. HLC3 is smoother. Close makes the anchor track settlement more tightly.
Deviation measurement
Deviation Mode
Percent : 100 * (Price / VWAP - 1). Good for uniform scaling across instruments.
Absolute : Price - VWAP. Good when price units themselves matter.
Z-Score : Standardizes the absolute residual by its own mean and standard deviation over Z/Std Window . Ideal for cross-asset comparability and regime studies.
Z/Std Window sets the mean and standard deviation window for Z-Score mode.
Volatility controls
Percent Mode Volatility Lookback estimates sigma for percent deviations.
Absolute Mode Volatility Lookback estimates sigma for absolute deviations.
Minimum Sigma Guard (pct pts) prevents the percent sigma from collapsing to near zero in extremely quiet markets.
Visualization
Plot Type = Histogram or Line. Histogram emphasizes impulse and polarity changes. Line emphasizes trend waves and divergences.
Positive Color / Negative Color define the palette for line mode. Histogram uses a 10-bucket gradient automatically.
Show Standard Deviations plots symmetric rails at ±1, ±2, ±3 sigma in the current mode’s units.
Fill Line Oscillator and Fill Opacity add a soft bias band around zero for line mode.
Line Width affects both the oscillator and the sigma rails.
Reading the zones
The oscillator’s color and height map deviation to nine graded buckets on each side of zero, with deeper greens above and deeper reds below. In Percent and Absolute modes, those buckets are scaled by their mode-specific sigma. In Z-Score mode the bucket edges are fixed at 0.5, 1.0, 2.0, and 2.8.
0 to +1 sigma weak positive bias, usually rotational.
+1 to +2 sigma constructive impulse. Pullbacks that hold above zero often continue.
+2 to +3 sigma strong expansion. Watch for either trend continuation or exhaustion tells.
Beyond +3 sigma statistical extreme. Requires structure to avoid fading too soon.
Mirror logic applies on the negative side.
Suggested workflows
Trend continuation checklist
Pick a session VWAP that matches your timeframe, for example Daily for intraday or Weekly for position trades.
Wait for the oscillator to hold the correct side of zero and for a sequence of higher swing lows in the oscillator (uptrend) or lower swing highs (downtrend).
Buy pullbacks that stabilize between zero and +1 sigma in an uptrend. Sell rallies that stabilize between zero and -1 sigma in a downtrend.
Use the next sigma band or a prior price swing as your target reference.
Mean reversion checklist
Switch to Z-Score mode for standardized thresholds.
Identify tests of ±2 sigma to ±3 sigma that fail to extend while price meets support or resistance.
Enter on a polarity change through the prior histogram bar or a small hook in line mode.
Fade back to zero or to the opposite inner band, then reassess.
Notes on the three modes
Percent is easy to reason about when you care about proportional stretch. It is well suited to intraday and multi-asset dashboards.
Absolute tracks cash distance from VWAP. This is useful when instruments have tight ticks and you plan risk in price units.
Z-Score standardizes the residual and is best for quant studies, cross-asset comparisons, and threshold research that must be scale invariant.
What the alerts can tell you
Polarity changes at zero can mark the start or end of a leg.
Crosses of ±1 sigma identify overbought or oversold in the current mode’s units.
Zone changes signal an upgrade or downgrade in deviation strength.
Troubleshooting and edge cases
If your instrument has long flat periods, keep Minimum Sigma Guard above zero in Percent mode so the rails do not vanish.
In Rolling modes, very short windows will respond quickly but can whip around. Session modes smooth this by resetting at well known boundaries.
If Z-Score looks erratic, increase Z/Std Window to stabilize the estimate of mean and sigma for the residual.
Final thoughts
VWAP is the anchor. The deviation oscillator is the narrative. By separating bias, magnitude, and regime into a simple stream you can execute faster and review cleaner. Pick the VWAP mode that matches your horizon, choose the deviation lens that matches your risk framework, and let the color graded zones guide your decisions.

X Trade Planlets you define up to 10 fully manual price levels and ranges—each with its own toggle, two prices (for a band/box), an optional note, and a color. The tool draws lines that start at the first bar of a chosen anchor timeframe (e.g., Daily) and extend to the right, mirroring the “fresh start-of-session” look. If two prices are entered, the area between them is shaded using the same color at 60% transparency, so the line and box fill are visually consistent.
Key Features
10 explicit categories (Cat 1 … Cat 10)
Each category includes:
Enable/disable toggle
Price 1 (line) and Price 2 (optional, defines box top/bottom)
Note (optional): label shows note only; hidden automatically if blank
Color: used for the line, box border, and box fill (with 60% transparency)
Anchor-aware drawing
Lines and boxes begin at the new bar of your selected Anchor Timeframe (e.g., D/W/H4), producing clean, session-style extensions.
Clean visuals
Line width is standardized at 1 for a crisp, unobtrusive look
Labels are aligned to the right of current bars and inherit user label styling options (size, text color, background)
No historical dependence
The indicator does not compute or display historical pivots, opens, or derived levels. Everything is user-defined.
Inputs (Per Category)
Cat N (toggle): Show/hide the category
Price 1: Primary level; a horizontal line is drawn when set
Price 2 (optional): When set with Price 1, a box is drawn between the two values
Note (optional): Free-text label; shown only if non-empty
Color: Applies to line, box border, and box fill (fill uses 60% transparency)
Global Inputs
Anchor Timeframe: Timeframe whose new bar defines the start (anchor) of all lines/boxes
Extend Right (bars): Number of bars to extend into the future
Labels (on/off) and label style options (size, text color, background)
How It Works
On the first bar and on each new bar of the anchor timeframe, the indicator captures the current bar index as the anchor for each category.
For each enabled category:
If Price 1 is set, the script draws a horizontal line from the anchor to extend_len bars into the future.
If Price 2 is also set, a box spanning Price 1 ↔ Price 2 is drawn from the anchor to the same future point.
If a Note is provided, a right-side label is rendered at the level (or box midpoint). If the note is empty, no label is shown.
Visual objects are refreshed every bar to ensure alignment with current settings.
Common Use Cases
Scenario planning & playbooks: Define “watch zones” (e.g., Look Above & Fail) and keep them consistent across sessions.
Manual S/R & liquidity areas: Mark hand-picked levels/ranges you care about, without auto-calculated clutter.
Session-like anchoring: Start-of-day/week anchoring to mimic institutional levels that reset each period.
Trade management: Color-coded bands for entries, invalidation, and targets with clear notes
