Apex Edge SMC Tactical Suite
🛰 Apex Edge SMC Tactical Suite
Apex Edge SMC Tactical Suite is a precision-engineered multi-signal tool designed for advanced traders who demand real-time edge detection, breakout identification, and smart volatility-based risk placement. Built to blend seamlessly into any price action, SMC, or momentum-based strategy.
🔧 Core Features:
📍 Entry Signals
Green & red arrows appear only when a candle meets strict "Power Candle" criteria:
High momentum breakout
Volume spike confirmation
OBV spike divergence
Trend & HTF filter optional
Volatility-adjusted stop placement
💥 Power Candles
Smart detection of explosive volume+range candles
Custom "fuel score" system ranks their momentum potential
Displays as either candle highlights or subtle labels
📊 Fuel Meter
RSI-based energy tracker with customizable threshold
Plots real-time bar strength on a mini histogram
🧠 Trap Detection + Reversals
Detects stop hunt wicks or "liquidity traps"
Shows reversal diamonds on potential reclaim setups
Built-in swing logic confirms trap reversals
🧮 HTF Filtering
Optional higher-timeframe trend filter via Hull MA
Keeps signals aligned with broader market direction
📦 TP/SL Zones
Risk is calculated using volatility clustering (recent swing zones)
TP auto-calculated using ATR-based expansion
🔔 Alerts Included:
✅ Power Candle Detection
✅ Long/Short Entry Alerts
✅ Exit Signal Alerts
✅ Trap Defense Alerts
✅ Trap Reversal Confirmations
🎯 Ideal For:
SMC / ICT traders
Breakout traders
Trend followers
Scalpers / intraday setups
Momentum + volume combo traders
⚠️ Tip: Best paired with clean chart layouts, market structure, or order block frameworks. Can be combined with internal/external liquidity sweep logic for extra confluence.
Feel free to play around with the code and if you're a professional coder (unlike me) then please tag me into any versions that you can make better. Enjoy!
Disclaimer - This script was created entirely with many hours using the assistance of ChatGPT
Recherche dans les scripts pour "smart"

Bounty SeekerBounty Seeker - Advanced Market Structure & Order Block Detection
A sophisticated indicator that identifies high-probability reversal zones through the analysis of market structure, volume patterns, and institutional order blocks. This tool helps traders spot potential reversals and fake-outs with precision.
Core Components:
1. Pivot Detection System
• Smart pivot high/low identification
• Volume-enhanced confirmation
• RSI confluence validation
• Real-time market structure analysis
2. Order Block Detection
• Institutional buying/selling zones
• Historical support/resistance levels
• Smart volume threshold analysis
• Dynamic level adaptation
Signal Types:
1. Bull Pivots (White X)
• Strong volume confirmation
• RSI oversold conditions
• Price action validation
• Order block confluence
2. Bear Pivots (Purple X)
• Volume surge confirmation
• RSI overbought alignment
• Bearish price action
• Resistance zone validation
3. Fake Pivots (Orange X)
• Low volume warning signals
• Trap zone identification
• False breakout detection
• Risk management guide
Visual Elements:
• Dashed Lines: Order block zones
• White/Purple X's: Major pivot points
• Orange X's: Potential fake moves
• Dynamic support/resistance levels
Best Usage Practices:
• Most effective on 1H+ timeframes
• Focus on major market pairs
• Wait for complete signal formation
• Combine with trend direction
• Monitor volume confirmation
• Use proper position sizing
The indicator excels at:
1. Identifying potential reversal zones
2. Detecting institutional order blocks
3. Warning of potential fake moves
4. Providing clear entry/exit levels
5. Highlighting strong volume zones
Risk Management:
• Always wait for signal confirmation
• Use appropriate stop loss levels
• Consider multiple timeframe analysis
• Don't trade against major trends
• Monitor volume for validation
This indicator combines advanced market structure analysis with volume profiling to help traders identify high-probability trading opportunities while warning of potential traps and fake-outs.
Note: Past performance does not guarantee future results. Always use proper risk management techniques.
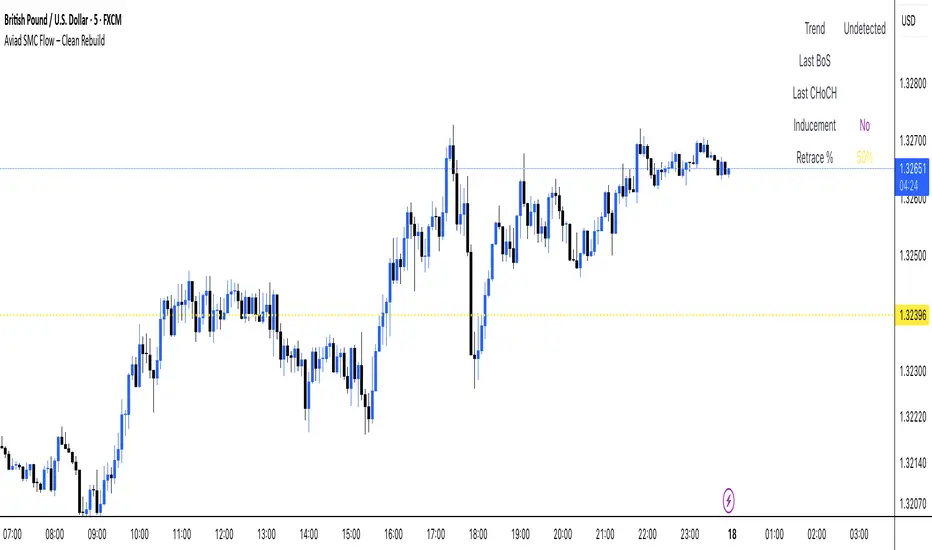
Aviad SMC Flow🔹 Aviad SMC Flow – Smart Structure & Zones Indicator
A professional SMC-based indicator for identifying:
✅ BoS – Break of Structure
✅ CHoCH – Change of Character
✅ MSS – Market Structure Shift
✅ Automated Support & Resistance Zones
✅ Liquidity Grab and Reversal Points
✅ Market Structure with historical display
Optimized for 1H and lower timeframes.
Designed for real Smart Money Concepts (SMC) trading.
Perfect for intraday traders, swing traders, and scalpers.
PRIME 2.0PRIME 2.0 — Precision Entry Tool
PRIME 2.0 is a smart price action-based indicator designed for intraday traders who want to catch high-probability moves during the London session. It uses a combination of market structure shifts (CHOCH – Change of Character) and session-based timing to identify potential entries.
🔍 Key Features:
Session-Based Logic: Activates after the London market opens, filtering noise from other sessions.
CHOCH Detection: Spots shifts in market structure by identifying crossover and crossunder of candle highs/lows.
Visual Entry Points: Plots real-time entry points based on structure change.
🧠 Who Is It For?
Scalpers and day traders
Traders who follow Smart Money Concepts (SMC)
Anyone looking to improve entry precision without clutter
⚠️ Disclaimer:
This indicator does not generate buy/sell signals or exit points. It is meant to be used as a tool within a broader trading strategy. Combine it with your own risk management and market knowledge for best results

Liquidity Zones Alerts"Liquidity Zones Alerts" is a powerful smart-money-based indicator designed to detect key liquidity grabs and provide high-probability reversal signals using a combination of market structure, volume, volatility, and candlestick confirmation.
🧠 How It Works
The core logic of this indicator is built around the Smart Money Concepts:
🔺 Liquidity Sweeps: Detects when price takes out previous daily or weekly highs/lows, suggesting stop hunts or engineered liquidity moves by institutional players.
📈 Volume Filter: Ensures signals only appear during above-average volume, filtering out noise and low-interest moves.
⚡ Volatility Filter: Flags high-range candles relative to the average, catching flash crashes/spikes that often precede strong reversals.
🔄 Engulfing Candle Confirmation: Confirms entry with a bullish or bearish engulfing pattern after liquidity is taken — increasing signal reliability.
🧭 Premium/Discount Zone Logic: Trades are filtered to ensure longs are only taken in discount zones, and shorts in premium zones, using a 20-period market range for context.
📌 Features
✅ Daily & Weekly liquidity zones toggle
✅ Visual signals with clean 🔻(short) & 🔺(long) arrows
✅ Auto-detection of flash crashes
✅ Alerts on both long and short setups
✅ Optional previous high/low level plotting for context
✅ Background highlighting of valid signal candles
✅ Multi-timeframe friendly and compatible with any asset
🛠️ Use Case
Whether you're a scalper or a swing trader, this tool helps you spot institutional entry zones before the move happens. It works especially well when combined with your existing bias or supply/demand zones.
💬 “Price doesn't move randomly — it hunts liquidity. This indicator shows you where and when it happens.”

SMC+The "SMC+" indicator is a comprehensive tool designed to overlay key Smart Money Concepts (SMC) levels, support/resistance zones, order blocks (OB), fair value gaps (FVG), and trap detection on your TradingView chart. It aims to assist traders in identifying potential areas of interest based on price action, swing structures, and volume dynamics across multiple timeframes. This indicator is fully customizable, allowing users to adjust lookback periods, colors, opacity, and sensitivity to suit their trading style.
Key Components and Functionality
1. Key Levels (Support and Resistance)
This section plots horizontal lines representing support and resistance levels based on highs and lows over three distinct lookback periods, plus daily nearest levels.
Short-Term Lookback Period (Default: 20 bars)
Plots the highest high (short_high) and lowest low (short_low) over the specified period.
Visualized as dotted lines with customizable colors (Short-Term Resistance Color, Short-Term Support Color) and opacity (Short-Term Resistance Opacity, Short-Term Support Opacity).
Adjustment Tip: Increase the lookback (e.g., to 30-50) for less frequent but stronger levels on higher timeframes, or decrease (e.g., to 10-15) for scalping on lower timeframes.
Long-Term Lookback Period (Default: 50 bars)
Plots broader support (long_low) and resistance (long_high) levels using a solid line style.
Customizable via Long-Term Resistance Color, Long-Term Support Color, and their respective opacity settings.
Adjustment Tip: Extend to 100-200 bars for swing trading or major trend analysis on daily/weekly charts.
Extra-Long Lookback Period (Default: 100 bars)
Identifies significant historical highs (extra_long_high) and lows (extra_long_low) with dashed lines.
Configurable with Extra-Long Resistance Color, Extra-Long Support Color, and opacity settings.
Adjustment Tip: Use 200-500 bars for monthly charts to capture macro-level key zones.
Daily Nearest Resistance and Support Levels
Dynamically calculates the nearest resistance (daily_res_level) and support (daily_sup_level) based on the current day’s price action relative to historical highs and lows.
Displayed with Daily Resistance Color and Daily Support Color (with opacity options).
Adjustment Tip: Works best on intraday charts (e.g., 15m, 1h) to track daily pivots; combine with volume profile for confirmation.
How It Works: These levels update dynamically as new highs/lows form, providing a visual guide to potential reversal or breakout zones.
2. SMC Inputs (Smart Money Concepts)
This section identifies swing structures, order blocks, fair value gaps, and entry signals based on SMC principles.
SMC Swing Lookback Period (Default: 12 bars)
Defines the period for detecting swing highs (smc_swing_high) and lows (smc_swing_low).
Adjustment Tip: Increase to 20-30 for smoother swings on higher timeframes; reduce to 5-10 for faster signals on lower timeframes.
Minimum Swing Size (%) (Default: 0.5%)
Filters out minor price movements to focus on significant swings.
Adjustment Tip: Raise to 1-2% for volatile markets (e.g., crypto) to avoid noise; lower to 0.2-0.3% for forex pairs with tight ranges.
Order Block Sensitivity (Default: 1.0)
Scales the size of detected order blocks (OBs) for bullish reversal (smc_ob_bull), bearish reversal (smc_ob_bear), and continuation (smc_cont_ob).
Visuals include customizable colors, opacity, border thickness, and blinking effects (e.g., SMC Bullish Reversal OB Color, SMC Bearish Reversal OB Blink Thickness).
Adjustment Tip: Increase to 1.5-2.0 for wider OBs in choppy markets; keep at 1.0 for precision in trending conditions.
Minimum FVG Size (%) (Default: 0.3%)
Sets the minimum gap size for Fair Value Gaps (fvg_high, fvg_low), displayed as boxes with Fair Value Gap Color and FVG Opacity.
Adjustment Tip: Increase to 0.5-1% for larger, more reliable gaps; decrease to 0.1-0.2% for scalping smaller inefficiencies.
How It Works:
Bullish Reversal OB: Detects a bearish candle followed by a bullish break, marking a potential demand zone.
Bearish Reversal OB: Identifies a bullish candle followed by a bearish break, marking a supply zone.
Continuation OB: Spots strong bullish momentum after a prior high, indicating a continuation zone.
FVG: Highlights bullish gaps where price may retrace to fill.
Entry Signals: Plots triangles (SMC Long Entry) when price retests an OB with a liquidity sweep or break of structure (BOS).
3. Trap Inputs
This section detects potential bull and bear traps based on price action, volume, and key level rejections.
Min Down Move for Bear Trap (%) (Default: 1.0%)
Sets the minimum drop required after a bearish OB to qualify as a trap.
Visualized with Bear Trap Color, Bear Trap Opacity, and blinking borders.
Adjustment Tip: Increase to 2-3% for stronger traps in trending markets; lower to 0.5% for ranging conditions.
Min Up Move for Bull Trap (%) (Default: 1.0%)
Sets the minimum rise required after a bullish OB to flag a trap.
Customizable with Bull Trap Color, Bull Trap Border Thickness, etc.
Adjustment Tip: Adjust similarly to bear traps based on market volatility.
Volume Lookback for Traps (Default: 5 bars)
Compares current volume to a moving average (avg_volume) to filter low-volume traps.
Adjustment Tip: Increase to 10-20 for confirmation on higher timeframes; reduce to 3 for intraday sensitivity.
How It Works:
Bear Trap: Triggers when price drops significantly after a bearish OB but reverses up with low volume or support rejection.
Bull Trap: Activates when price rises after a bullish OB but fails with low volume or resistance rejection.
Boxes highlight trap zones, resetting when price breaks out.
4. Visual Customization
Line Width (Default: 2)
Adjusts thickness of support/resistance lines.
Tip: Increase to 3-4 for visibility on cluttered charts.
Blink On (Default: Close)
Sets whether OB/FVG borders blink based on Open or Close price interaction.
Tip: Use "Open" for intraday precision; "Close" for confirmed reactions.
Colors and Opacity: Each element (OBs, FVGs, traps, key levels) has customizable colors, opacity (0-100), border thickness (1-5 or 1-7), and blink effects for dynamic visualization.
How to Use SMC+
Setup: Apply the indicator to any chart and adjust inputs based on your timeframe and market.
Key Levels: Watch for price reactions at short, long, extra-long, or daily levels for potential reversals or breakouts.
SMC Signals: Look for entry signals (triangles) near OBs or FVGs, confirmed by liquidity sweeps or BOS.
Traps: Avoid false breakouts by monitoring trap boxes, especially near key levels with low volume.
Notes:
This indicator is a visual aid and does not guarantee trading success. Combine it with other analysis tools and risk management strategies.
Performance may vary across markets and timeframes; test settings thoroughly before use.
For optimal results, experiment with lookback periods and sensitivity settings to match your trading style.
The default settings are optimal for 1 minute and 10 second time frames for small cap low float stocks.
Continuation OB are Blue.
Bullish Reversal OB color is Green
Bearish Reversal OB color is Red
FVG color is purple
Bear Trap OB is red with a green border and often appears with a Bearish Reversal OB signaling caution to a short position.
Bull trap OB is green with a Red border signaling caution to a long position.
All active OB area are highlighted and solid in color while other non active OB area are dimmed.
My personal favorite setups are when we have an active bullish reversal with an active FVG along with an active Continuation OB.
Another personal favorite is the Bearish reversal OB signaling an end to a recent uptrend.
The Trap OB detection are also a unique and Original helpful source of information.
The OB have a white boarder by default that are colored black giving a simulated blinking effect when price is acting in that zone.
The Trap OB border are colored with respect to direction of intended trap, all of which can be customized to personal style.
All vaild OB zones are shown compact in size ,a unique and original view until its no longer valid.

Math by Thomas Order Blocks🔥 Description:
🚀 Math by Thomas Order Blocks is a precision tool for Smart Money Concept (SMC) and price action traders, designed to automatically detect Bullish and Bearish Order Blocks (OBs). It highlights key institutional trading zones where large orders are placed, helping you identify potential reversal and continuation areas.
⚙️ Key Features:
✅ Automatic Order Block Detection:
Detects Bearish OBs when price sharply reverses after a significant bullish move.
Identifies Bullish OBs following a sharp reversal from a bearish push.
✅ Dynamic Sensitivity & Volume Filter:
Sensitivity Control: Customize OB detection precision.
Minimum Volume Filter: Ensures OBs form only on significant volume spikes.
✅ Flexible OB Mitigation:
Choose between "Close" or "Wick" mitigation for OB invalidation.
Mitigated OBs are automatically removed from the chart.
✅ Adaptive Swing & Price Change Detection:
Adjusts OB detection logic based on timeframe for flexibility.
Uses adaptive rate of change (ROC) calculations to spot momentum shifts.
✅ Visual Customization:
OBs are displayed as shaded boxes with configurable background and border colors.
Bullish OBs = Green (support zones).
Bearish OBs = Red (resistance zones).
✅ Alerts for OB Touch:
Get real-time alerts when price touches a Bullish or Bearish OB.
Helps you catch potential reversal points without constant chart monitoring.
📊 How It Works:
Bullish OB Logic:
Detected when price crosses over a positive momentum threshold (ROC) with high volume.
Plots a green OB box from the low of the swing candle.
Bearish OB Logic:
Identified when price crosses under a negative momentum threshold with high volume.
Plots a red OB box from the high of the swing candle.
Mitigation Rules:
OBs are removed once invalidated by price action based on your chosen mitigation type (Close or Wick).
📈 Usage Tips:
Use Bullish OBs as potential support areas for buy entries.
Treat Bearish OBs as resistance zones for sell setups.
Combine with Fair Value Gaps, volume profile, and RSI for confluence.
Adjust sensitivity and volume filters to fine-tune OB detection.
✅ Chart Example:
The script displays:
Bullish OBs in green, marking potential support zones.
Bearish OBs in red, indicating resistance zones.
Real-time alerts when price touches OBs.
🔥 Why Use This Indicator?
Designed for intraday and swing traders aiming to identify institutional trading zones.
Helps you spot reversal and continuation setups with precision.
Ideal for Smart Money Concept (SMC), price action, and order flow traders.

FunkyQuokka's $ Volume💡 Why $ Volume Matters
Share volume alone is a half-truth — 1M shares traded at $5 isn’t the same as 1M shares at $500. That’s where dollar volume steps in, offering a far more accurate view of institutional interest, breakout validity, liquidity zones and overall trader conviction.
📈 Features:
Clean histogram of dollar volume (close × volume)
Orange line showing customizable average $ volume
K/M/B formatting for axis scale (no huge ugly numbers)
Minimal design to blend into a multi-pane layout
⚙️ Inputs:
Tweakable average length – defaults to 20
By FunkyQuokka 🦘

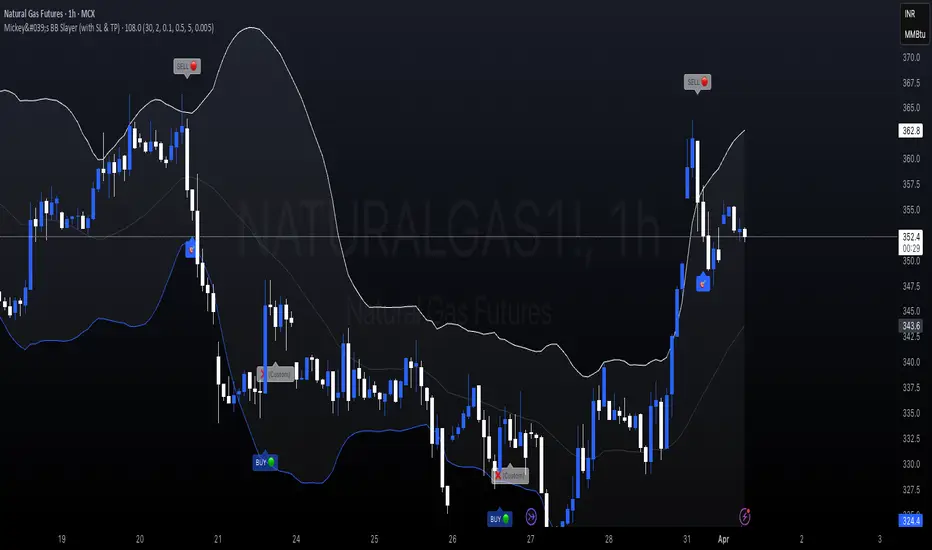
Mickey's BBMickey's BB – Smart Reversal Detector with SL Tracking 🔁
This indicator combines the power of Bollinger Bands with engulfing candle patterns to identify high-probability reversal points.
✅ Buy Signal: Triggered when a red candle touches the lower Bollinger Band and is engulfed by a green candle within the next few candles.
✅ Sell Signal: Triggered when a green candle touches the upper Bollinger Band and is engulfed by a red candle within the next few candles.
✅ Smart Lookahead: Scans up to X candles ahead (user-defined) to confirm engulfing reversals — reducing noise in sideways markets.
✅ Dynamic Stop-Loss & Target: Automatically plots SL/TP levels based on user-defined % thresholds.
✅ SL HIT Labels: Highlights exactly when a stop-loss is breached, giving clear visual feedback on trade failures.
✅ Adaptive Market Filter: Signals are only shown when Bollinger Band width exceeds a minimum threshold — filtering out weak/noise signals in low volatility.
🔍 Ideal for reversal traders, scalpers, and those who love combining price action with volatility-based setups.
🛠️ Customizable Parameters:
SMA Period & Std Dev Multiplier (for BB)
SL/Target % levels
Engulf Lookahead range
Minimum BB width to filter signals
🎯 Build it into your strategy, set alerts, or just use it visually to time your entries and exits with clarity.
02 SMC + BB Breakout (Improved)This strategy combines Smart Money Concepts (SMC) with Bollinger Band breakouts to identify potential trading opportunities. SMC focuses on identifying key price levels and market structure shifts, while Bollinger Bands help pinpoint overbought/oversold conditions and potential breakout points. The strategy also incorporates higher timeframe trend confirmation to filter out trades that go against the prevailing trend.
Key Components:
Bollinger Bands:
Calculated using a Simple Moving Average (SMA) of the closing price and a standard deviation multiplier.
The strategy uses the upper and lower bands to identify potential breakout points.
The SMA (basis) acts as a centerline and potential support/resistance level.
The fill between the upper and lower bands can be toggled by the user.
Higher Timeframe Trend Confirmation:
The strategy allows for optional confirmation of the current trend using a higher timeframe (e.g., daily).
It calculates the SMA of the higher timeframe's closing prices.
A bullish trend is confirmed if the higher timeframe's closing price is above its SMA.
This helps filter out trades that go against the prevailing long-term trend.
Smart Money Concepts (SMC):
Order Blocks:
Simplified as recent price clusters, identified by the highest high and lowest low over a specified lookback period.
These levels are considered potential areas of support or resistance.
Liquidity Zones (Swing Highs/Lows):
Identified by recent swing highs and lows, indicating areas where liquidity may be present.
The Swing highs and lows are calculated based on user defined lookback periods.
Market Structure Shift (MSS):
Identifies potential changes in market structure.
A bullish MSS occurs when the closing price breaks above a previous swing high.
A bearish MSS occurs when the closing price breaks below a previous swing low.
The swing high and low values used for the MSS are calculated based on the user defined swing length.
Entry Conditions:
Long Entry:
The closing price crosses above the upper Bollinger Band.
If higher timeframe confirmation is enabled, the higher timeframe trend must be bullish.
A bullish MSS must have occurred.
Short Entry:
The closing price crosses below the lower Bollinger Band.
If higher timeframe confirmation is enabled, the higher timeframe trend must be bearish.
A bearish MSS must have occurred.
Exit Conditions:
Long Exit:
The closing price crosses below the Bollinger Band basis.
Or the Closing price falls below 99% of the order block low.
Short Exit:
The closing price crosses above the Bollinger Band basis.
Or the closing price rises above 101% of the order block high.
Position Sizing:
The strategy calculates the position size based on a fixed percentage (5%) of the strategy's equity.
This helps manage risk by limiting the potential loss per trade.
Visualizations:
Bollinger Bands (upper, lower, and basis) are plotted on the chart.
SMC elements (order blocks, swing highs/lows) are plotted as lines, with user-adjustable visibility.
Entry and exit signals are plotted as shapes on the chart.
The Bollinger band fill opacity is adjustable by the user.
Trading Logic:
The strategy aims to capitalize on Bollinger Band breakouts that are confirmed by SMC signals and higher timeframe trend. It looks for breakouts that align with potential market structure shifts and key price levels (order blocks, swing highs/lows). The higher timeframe filter helps avoid trades that go against the overall trend.
In essence, the strategy attempts to identify high-probability breakout trades by combining momentum (Bollinger Bands) with structural analysis (SMC) and trend confirmation.
Key User-Adjustable Parameters:
Bollinger Bands Length
Standard Deviation Multiplier
Higher Timeframe
Higher Timeframe Confirmation (on/off)
SMC Elements Visibility (on/off)
Order block lookback length.
Swing lookback length.
Bollinger band fill opacity.
This detailed description should provide a comprehensive understanding of the strategy's logic and components.
***DISCLAIMER: This strategy is for educational purposes only. It is not financial advice. Past performance is not indicative of future results. Use at your own risk. Always perform thorough backtesting and forward testing before using any strategy in live trading.***

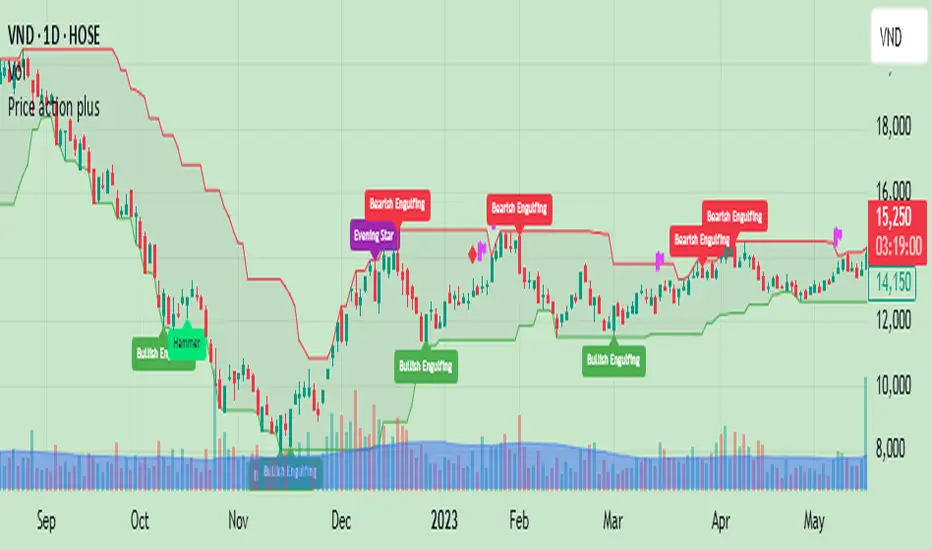
Price action plus//The system combines the divergence of A/D and OBV with identifying reversal points using Japanese candlestick patterns, creating an enhanced version of price action. This helps investors more easily and accurately recognize reversal patterns in technical analysis.
Divergence of A/D vs. OBV includes:
Positive divergence: Identifies smart money leaving the market.
Negative divergence: Identifies smart money entering the market.
Reversal candlestick patterns include:
Buy signals: Morning Star, Bullish Engulfing, Hammer.
Strong Buy signals: Buy signals + Negative divergence
Sell signals: Evening Star, Bearish Engulfing, Shooting Star.
Strong Sell signals : Sell signals + Positive divergence
//Hope this system will be helpful for you!
ICT FVG & Swing Detector Basic by Trader RiazICT FVG & Swing Detector Basic by Trader Riaz
Unlock Precision Trading with the Ultimate Fair Value Gap (FVG) and Swing Detection Tool!
Developed by Trader Riaz , the ICT FVG and Swing Detector Basic is a powerful Pine Script indicator designed to help traders identify key market structures with ease. Whether you're a day trader, swing trader, or scalper, this indicator provides actionable insights by detecting Bullish and Bearish Fair Value Gaps (FVGs) and Swing Highs/Lows on any timeframe. Perfect for trading forex, stocks, crypto, and more on TradingView!
Key Features:
1: Bullish and Bearish FVG Detection
- Automatically identifies Bullish FVGs (highlighted in green) and Bearish FVGs (highlighted in red) to spot potential reversal or continuation zones.
- Displays FVGs as shaded boxes with a dashed midline at 70% opacity, making it easy to see the midpoint of the gap for precise entries and exits.
- Labels are placed inside the FVG boxes at the extreme right for clear visibility.
2: Customizable FVG Display
- Control the number of Bullish and Bearish FVGs displayed on the chart with user-defined inputs (fvg_bull_count and fvg_bear_count).
- Toggle the visibility of Bullish and Bearish FVGs with simple checkboxes (show_bull_fvg and show_bear_fvg) to declutter your chart.
3: Swing High and Swing Low Detection
- Detects Swing Highs (blue lines) and Swing Lows (red lines) to identify key market turning points.
- Labels are positioned at the extreme right edge of the lines for better readability and alignment.
- Customize the number of Swing Highs and Lows displayed (swing_high_count and swing_low_count) to focus on the most recent market structures.
4: Fully Customizable Display
- Toggle visibility for Swing Highs and Lows (show_swing_high and show_swing_low) to suit your trading style.
- Adjust the colors of Swing High and Low lines (swing_high_color and swing_low_color) to match your chart preferences.
5: Clean and Efficient Design
- Built with Pine Script v6 for optimal performance on TradingView.
- Automatically removes older FVGs and Swing points when the user-defined count is exceeded, keeping your chart clean and focused.
- Labels are strategically placed to avoid clutter while providing clear information.
Why Use This Indicator?
Precision Trading: Identify high-probability setups with FVGs and Swing points, commonly used in Smart Money Concepts (SMC) and Institutional Trading strategies.
User-Friendly: Easy-to-use inputs allow traders of all levels to customize the indicator to their needs.
Versatile: Works on any market (Forex, Stocks, Crypto, Commodities) and timeframe (1M, 5M, 1H, 4H, Daily, etc.).
Developed by Trader Riaz: Backed by the expertise of Trader Riaz, a seasoned trader dedicated to creating tools that empower the TradingView community.
How to Use:
- Add the Custom FVG and Swing Detector to your chart on TradingView.
- Adjust the input settings to control the number of FVGs and Swing points displayed.
- Toggle visibility for Bullish/Bearish FVGs and Swing Highs/Lows as needed.
- Use the identified FVGs and Swing points to plan your trades, set stop-losses, and target key levels.
Ideal For:
- Traders using Smart Money Concepts (SMC), Price Action, or Market Structure strategies.
- Those looking to identify liquidity grabs, imbalances, and trend reversals.
- Beginners and advanced traders seeking a reliable tool to enhance their technical analysis.
Happy trading!

Pivot S/R with Volatility Filter## *📌 Indicator Purpose*
This indicator identifies *key support/resistance levels* using pivot points while also:
✅ Detecting *high-volume liquidity traps* (stop hunts)
✅ Filtering insignificant pivots via *ATR (Average True Range) volatility*
✅ Tracking *test counts and breakouts* to measure level strength
---
## *⚙ SETTINGS – Detailed Breakdown*
### *1️⃣ ◆ General Settings*
#### *🔹 Pivot Length*
- *Purpose:* Determines how many bars to analyze when identifying pivots.
- *Usage:*
- *Low values (5-20):* More pivots, better for scalping.
- *High values (50-200):* Fewer but stronger levels for swing trading.
- *Example:*
- Pivot Length = 50 → Only the most significant highs/lows over 50 bars are marked.
#### *🔹 Test Threshold (Max Test Count)*
- *Purpose:* Sets how many times a level can be tested before being invalidated.
- *Example:*
- Test Threshold = 3 → After 3 tests, the level is ignored (likely to break).
#### *🔹 Zone Range*
- *Purpose:* Creates a price buffer around pivots (±0.001 by default).
- *Why?* Markets often respect "zones" rather than exact prices.
---
### *2️⃣ ◆ Volatility Filter (ATR)*
#### *🔹 ATR Period*
- *Purpose:* Smoothing period for Average True Range calculation.
- *Default:* 14 (standard for volatility measurement).
#### *🔹 ATR Multiplier (Min Move)*
- *Purpose:* Requires pivots to show *meaningful price movement*.
- *Formula:* Min Move = ATR × Multiplier
- *Example:*
- ATR = 10 pips, Multiplier = 1.5 → Only pivots with *15+ pip swings* are valid.
#### *🔹 Show ATR Filter Info*
- Displays current ATR and minimum move requirements on the chart.
---
### *3️⃣ ◆ Volume Analysis*
#### *🔹 Volume Change Threshold (%)*
- *Purpose:* Filters for *unusual volume spikes* (institutional activity).
- *Example:*
- Threshold = 1.2 → Requires *120% of average volume* to confirm signals.
#### *🔹 Volume MA Period*
- *Purpose:* Lookback period for "normal" volume calculation.
---
### *4️⃣ ◆ Wick Analysis*
#### *🔹 Wick Length Threshold (Ratio)*
- *Purpose:* Ensures rejection candles have *long wicks* (strong reversals).
- *Formula:* Wick Ratio = (Upper Wick + Lower Wick) / Candle Range
- *Example:*
- Threshold = 0.6 → 60% of the candle must be wicks.
#### *🔹 Min Wick Size (ATR %)*
- *Purpose:* Filters out small wicks in volatile markets.
- *Example:*
- ATR = 20 pips, MinWickSize = 1% → Wicks under *0.2 pips* are ignored.
---
### *5️⃣ ◆ Display Settings*
- *Show Zones:* Toggles support/resistance shaded areas.
- *Show Traps:* Highlights liquidity traps (▲/▼ symbols).
- *Show Tests:* Displays how many times levels were tested.
- *Zone Transparency:* Adjusts opacity of zones.
---
## *🎯 Practical Use Cases*
### *1️⃣ Liquidity Trap Detection*
- *Scenario:* Price spikes *above resistance* then reverses sharply.
- *Requirements:*
- Long wick (Wick Ratio > 0.6)
- High volume (Volume > Threshold)
- *Outcome:* *Short Trap* signal (▼) appears.
### *2️⃣ Strong Support Level*
- *Scenario:* Price bounces *3 times* from the same level.
- *Indicator Action:*
- Labels the level with test count (3/5 = 3 tests out of max 5).
- Turns *red* if broken (Break Count > 0).
Deep Dive: How This Indicator Works*
This indicator combines *four professional trading concepts* into one powerful tool:
1. *Classic Pivot Point Theory*
- Identifies swing highs/lows where price previously reversed
- Unlike basic pivot indicators, ours uses *confirmed pivots only* (filtered by ATR)
2. *Volume-Weighted Validation*
- Requires unusual trading volume to confirm levels
- Filters out "phantom" levels with low participation
3. *ATR Volatility Filtering*
- Eliminates insignificant price swings in choppy markets
- Ensures only meaningful levels are plotted
4. *Liquidity Trap Detection*
- Spots institutional stop hunts where markets fake out traders
- Uses wick analysis + volume spikes for high-probability signals
---
## *📊 Parameter Encyclopedia (Expanded)*
### *1️⃣ Pivot Engine Settings*
#### *Pivot Length (50)*
- *What It Does:*
Determines how many bars to analyze when searching for swing highs/lows.
- *Professional Adjustment Guide:*
| Trading Style | Recommended Value | Why? |
|--------------|------------------|------|
| Scalping | 10-20 | Captures short-term levels |
| Day Trading | 30-50 | Balanced approach |
| Swing Trading| 50-200 | Focuses on major levels |
- *Real Market Example:*
On NASDAQ 5-minute chart:
- Length=20: Identifies levels holding for ~2 hours
- Length=50: Finds levels respected for entire trading day
#### *Test Threshold (5)*
- *Advanced Insight:*
Institutions often test levels 3-5 times before breaking them. This setting mimics the "probe and push" strategy used by smart money.
- *Psychology Behind It:*
Retail traders typically give up after 2-3 tests, while institutions keep testing until stops are run.
---
### *2️⃣ Volatility Filter System*
#### *ATR Multiplier (1.0)*
- *Professional Formula:*
Minimum Valid Swing = ATR(14) × Multiplier
- *Market-Specific Recommendations:*
| Market Type | Optimal Multiplier |
|------------------|--------------------|
| Forex Majors | 0.8-1.2 |
| Crypto (BTC/ETH) | 1.5-2.5 |
| SP500 Stocks | 1.0-1.5 |
- *Why It Matters:*
In EUR/USD (ATR=10 pips):
- Multiplier=1.0 → Requires 10 pip swings
- Multiplier=1.5 → Requires 15 pip swings (fewer but higher quality levels)
---
### *3️⃣ Volume Confirmation System*
#### *Volume Threshold (1.2)*
- *Institutional Benchmark:*
- 1.2x = Moderate institutional interest
- 1.5x+ = Strong smart money activity
- *Volume Spike Case Study:*
*Before Apple Earnings:*
- Normal volume: 2M shares
- Spike threshold (1.2): 2.4M shares
- Actual volume: 3.1M shares → STRONG confirmation
---
### *4️⃣ Liquidity Trap Detection*
#### *Wick Analysis System*
- *Two-Filter Verification:*
1. *Wick Ratio (0.6):*
- Ensures majority of candle shows rejection
- Formula: (UpperWick + LowerWick) / Total Range > 0.6
2. *Min Wick Size (1% ATR):*
- Prevents false signals in flat markets
- Example: ATR=20 pips → Min wick=0.2 pips
- *Trap Identification Flowchart:*
Price Enters Zone →
Spikes Beyond Level →
Shows Long Wick →
Volume > Threshold →
TRAP CONFIRMED
---
## *💡 Master-Level Usage Techniques*
### *Institutional Order Flow Analysis*
1. *Step 1:* Identify pivot levels with ≥3 tests
2. *Step 2:* Watch for volume contraction near levels
3. *Step 3:* Enter when trap signal appears with:
- Wick > 2×ATR
- Volume > 1.5× average
### *Multi-Timeframe Confirmation*
1. *Higher TF:* Find weekly/monthly pivots
2. *Lower TF:* Use this indicator for precise entries
3. *Example:*
- Weekly pivot at $180
- 4H shows liquidity trap → High-probability reversal
---
## *⚠ Critical Mistakes to Avoid*
1. *Using Default Settings Everywhere*
- Crude oil needs higher ATR multiplier than bonds
2. *Ignoring Trap Context*
- Traps work best at:
- All-time highs/lows
- Major psychological numbers (00/50 levels)
3. *Overlooking Cumulative Volume*
- Check if volume is building over multiple tests

VSA Vol Key VSA Signals
(1) No Demand – Bearish Signal
Low volume, narrow spread.
Price rises, but volume does not increase → Weak market, lack of buyers.
If this appears in an uptrend, it may indicate a potential reversal.
(2) No Supply – Bullish Signal
Low volume, narrow spread.
Price declines, but volume does not increase → Weak selling pressure.
If this appears in an uptrend, it may confirm the continuation of the uptrend.
(3) Stopping Volume – Bullish Reversal Signal
Strong price decline, but unusually high volume.
Candle shows a long lower wick, closing near the top.
Indicates Smart Money absorbing supply, signaling a potential reversal upwards.
(4) Climactic Volume – Possible Trend Reversal
Extremely high volume with a sharp price increase or decrease.
If this occurs after a long trend, it may indicate a trend reversal.
Smart Money may be taking profits after a prolonged price movement.
(5) Effort vs. Result
If volume is high but price movement is weak → Inefficient buying/selling, possible reversal.
If volume is high and price moves strongly in the same direction → Trend is likely to continue.

Quantum Motion Oscillator-QMO (TechnoBlooms)Quantum Motion Oscillator (QMO) is a momentum indicator designed for traders who demand precision. Combining multi-timeframe weighted linear regression with EMA crossovers, QMO offers a dynamic view of market momentum, helping traders anticipate trend shifts with greater accuracy.
This oscillator is inspired by quantum mechanics and wave theory, where market movement is seen as a series of probabilistic waves rather than rigid structures.
The histogram is plotted in proportion to the price movement of the candlesticks.
KEY FEATURES
1. Multi-Timeframe Histogram - Integrates 1 to 5 weighted linear regression averages, reducing lag while maintaining accuracy.
2. EMA Crossover Signal - Uses a Short and Long EMA to confirm trend shifts with minimal noise.
3. Adaptive Trend Analysis - Self-adjusting mechanics make QMO effective in both ranging and trending markets.
4. Scalable for Different Trading Styles - Works seamlessly for scalping, intraday, swing and position trading.
ADVANCED PROFESSIONAL INSIGHTS
1. Wave Dynamics and Market Flow - Inspired by wave mechanics, QMO reflects the energy accumulation and dissipation in price movements.
Expanding histogram waves = Strong momentum surge
Contracting waves = Momentum weakening, potential reversal zone.
2. Liquidity and Order Flow Applications - QMO works well alongside liquidity concepts and smart money techniques:
Combine with Fair Value Gaps & Order Blocks -> Enter when QMO signals align with liquidity zones.
Avoid False Moves - If price sweeps liquidity, but QMO momentum diverges, it is a sign of potential smart money manipulation.

[COG]TMS Crossfire 🔍 TMS Crossfire: Guide to Parameters
📊 Core Parameters
🔸 Stochastic Settings (K, D, Period)
- **What it does**: These control how the first stochastic oscillator works. Think of it as measuring momentum speed.
- **K**: Determines how smooth the main stochastic line is. Lower values (1-3) react quickly, higher values (3-9) are smoother.
- **D**: Controls the smoothness of the signal line. Usually kept equal to or slightly higher than K.
- **Period**: How many candles are used to calculate the stochastic. Standard is 14 days, lower for faster signals.
- **For beginners**: Start with the defaults (K:3, D:3, Period:14) until you understand how they work.
🔸 Second Stochastic (K2, D2, Period2)
- **What it does**: Creates a second, independent stochastic for stronger confirmation.
- **How to use**: Can be set identical to the first one, or with slightly different values for dual confirmation.
- **For beginners**: Start with the same values as the first stochastic, then experiment.
🔸 RSI Length
- **What it does**: Controls the period for the RSI calculation, which measures buying/selling pressure.
- **Lower values** (7-9): More sensitive, good for short-term trading
- **Higher values** (14-21): More stable, better for swing trading
- **For beginners**: The default of 11 is a good balance between speed and reliability.
🔸 Cross Level
- **What it does**: The centerline where crosses generate signals (default is 50).
- **Traditional levels**: Stochastics typically use 20/80, but 50 works well for this combined indicator.
- **For beginners**: Keep at 50 to focus on trend following strategies.
🔸 Source
- **What it does**: Determines which price data is used for calculations.
- **Common options**:
- Close: Most common and reliable
- Open: Less common
- High/Low: Used for specialized indicators
- **For beginners**: Stick with "close" as it's most commonly used and reliable.
🎨 Visual Theme Settings
🔸 Bullish/Bearish Main
- **What it does**: Sets the overall color scheme for bullish (up) and bearish (down) movements.
- **For beginners**: Green for bullish and red for bearish is intuitive, but choose any colors that are easy for you to distinguish.
🔸 Bullish/Bearish Entry
- **What it does**: Colors for the entry signals shown directly on the chart.
- **For beginners**: Use bright, attention-grabbing colors that stand out from your chart background.
🌈 Line Colors
🔸 K1, K2, RSI (Bullish/Bearish)
- **What it does**: Controls the colors of each indicator line based on market direction.
- **For beginners**: Use different colors for each line so you can quickly identify which line is which.
⏱️ HTF (Higher Timeframe) Settings
🔸 HTF Timeframe
- **What it does**: Sets which higher timeframe to use for filtering (e.g., 240 = 4 hour chart).
- **How to choose**: Should be at least 4x your current chart timeframe (e.g., if trading on 15min, use 60min or higher).
- **For beginners**: Start with a timeframe 4x higher than your trading chart.
🔸 Use HTF Filter
- **What it does**: Toggles whether the higher timeframe filter is applied or not.
- **For beginners**: Keep enabled to reduce false signals, especially when learning.
🔸 HTF Confirmation Bars
- **What it does**: How many bars must confirm a trend change on higher timeframe.
- **Higher values**: More reliable but slower to react
- **Lower values**: Faster signals but more false positives
- **For beginners**: Start with 2-3 bars for a good balance.
📈 EMA Settings
🔸 Use EMA Filter
- **What it does**: Toggles price filtering with an Exponential Moving Average.
- **For beginners**: Keep enabled for better trend confirmation.
🔸 EMA Period
- **What it does**: Length of the EMA for filtering (shorter = faster reactions).
- **Common values**:
- 5-13: Short-term trends
- 21-50: Medium-term trends
- 100-200: Long-term trends
- **For beginners**: 5-10 is good for short-term trading, 21 for swing trading.
🔸 EMA Offset
- **What it does**: Shifts the EMA forward or backward on the chart.
- **For beginners**: Start with 0 and adjust only if needed for visual clarity.
🔸 Show EMA on Chart
- **What it does**: Toggles whether the EMA appears on your main price chart.
- **For beginners**: Keep enabled to see how price relates to the EMA.
🔸 EMA Color, Style, Width, Transparency
- **What it does**: Customizes how the EMA line looks on your chart.
- **For beginners**: Choose settings that make the EMA visible but not distracting.
🌊 Trend Filter Settings
🔸 Use EMA Trend Filter
- **What it does**: Enables a multi-EMA system that defines the overall market trend.
- **For beginners**: Keep enabled for stronger trend confirmation.
🔸 Show Trend EMAs
- **What it does**: Toggles visibility of the trend EMAs on your chart.
- **For beginners**: Enable to see how price moves relative to multiple EMAs.
🔸 EMA Line Thickness
- **What it does**: Controls how the thickness of EMA lines is determined.
- **Options**:
- Uniform: All EMAs have the same thickness
- Variable: Each EMA has its own custom thickness
- Hierarchical: Automatically sized based on period (longer periods = thicker)
- **For beginners**: "Hierarchical" is most intuitive as longer-term EMAs appear more dominant.
🔸 EMA Line Style
- **What it does**: Sets the line style (solid, dotted, dashed) for all EMAs.
- **For beginners**: "Solid" is usually clearest unless you have many lines overlapping.
🎭 Trend Filter Colors/Width
🔸 EMA Colors (8, 21, 34, 55)
- **What it does**: Sets the color for each individual trend EMA.
- **For beginners**: Use a logical progression (e.g., shorter EMAs brighter, longer EMAs darker).
🔸 EMA Width Settings
- **What it does**: Controls the thickness of each EMA line.
- **For beginners**: Thicker lines for longer EMAs make them easier to distinguish.
🔔 How These Parameters Work Together
The power of this indicator comes from how these components interact:
1. **Base Oscillator**: The stochastic and RSI components create the main oscillator
2. **HTF Filter**: The higher timeframe filter prevents trading against larger trends
3. **EMA Filter**: The EMA filter confirms signals with price action
4. **Trend System**: The multi-EMA system identifies the overall market environment
Think of it as multiple layers of confirmation, each adding more reliability to your trading signals.
💡 Tips for Beginners
1. **Start with defaults**: Use the default settings first and understand what each element does
2. **One change at a time**: When customizing, change only one parameter at a time
3. **Keep notes**: Write down how each change affects your results
4. **Backtest thoroughly**: Test any changes on historical data before trading real money
5. **Less is more**: Sometimes simpler settings work better than complicated ones
Remember, no indicator is perfect - always combine this with proper risk management and other forms of analysis!

Crystal Order BlockThe Crystal Order Block Indicator is a powerful tool designed to help traders identify key institutional order blocks with high precision. This indicator is ideal for traders following Smart Money Concepts (SMC) and Institutional Trading Strategies, providing clear insights into potential high-probability trade setups.
🔹 Key Features:
✔ Automatic Order Block Detection: Identifies valid bullish & bearish order blocks.
✔ Unmitigated Order Blocks Highlighted: Focuses on fresh order blocks for improved trade opportunities.
✔ Trend-Focused Trading: Works best when combined with market structure analysis.
✔ Multi-Timeframe Support: Suitable for scalping, swing trading, and intraday trading.
✔ Risk Management Enhancement: Helps traders refine entries and exits based on institutional price movements.
📈 How to Use the Crystal Order Block Indicator:
🔹 Identifying Order Blocks:
➡ The indicator automatically detects order blocks formed by institutional trading activity.
➡ Unmitigated order blocks are highlighted, indicating areas where price may react.
🔹 High-Probability Trade Setups:
➡ Buy Setup: Look for a bullish order block in an uptrend, confirming strength.
➡ Sell Setup: Identify a bearish order block in a downtrend for potential short trades.
🔹 Order Block Mitigation:
➡ The updated version filters out mitigated order blocks, allowing traders to focus on fresh trading opportunities.
📊 Best Practices & Timeframes:
🔸 Works on all timeframes, but higher accuracy is observed on M30 and above.
🔸 Best suited for Smart Money Trading, Institutional Trading, and Price Action Strategies.
🔸 Should be used with liquidity concepts and market structure analysis for enhanced precision.
⚠ Important Note:
This indicator is a technical tool designed to assist traders in market analysis. It does not guarantee success and should be used alongside proper risk management and trading discipline.

Multi-Timeframe Open LinesThe Multi-Timeframe Open Lines indicator is designed to help traders visualize key price levels at the open of specific time intervals. It draws horizontal lines at the open of 5-minute, 15-minute, 30-minute, and hourly candles, extending these lines to the start of the next respective interval. Traders can now control which timeframes are displayed and how many past opening lines are shown, ensuring a clean and organized chart.
Key Features:
Customizable Lines:
5-Minute Lines: Highlight the open of every 5-minute candle, ending at the start of the next 5-minute candle.
15-Minute Lines: Highlight the open of every 15-minute candle, ending at the start of the next 15-minute candle.
30-Minute Lines: Highlight the open of every 30-minute candle, ending at the start of the next 30-minute candle.
Hourly Lines: Highlight the open of every hourly candle, ending at the start of the next hourly candle.
Each timeframe's lines can be customized in terms of color, line style, and thickness.
Toggle Options:
Easily turn on or off the display of lines for each timeframe (5m, 15m, 30m, 1h) using checkboxes in the settings.
User-Defined Limits:
Control the number of past opening lines displayed for each timeframe (5m, 15m, 30m, 1h).
Prevents chart clutter by limiting the number of visible lines.
Multi-Timeframe Analysis:
Enables traders to analyze price action across multiple timeframes simultaneously, providing a clearer picture of market structure and key levels.
User-Friendly Inputs:
Easy-to-use settings for customizing line appearance and behavior, ensuring the indicator fits seamlessly into any trading strategy.
How to Use:
Apply the indicator to your chart to visualize the open price levels for 5-minute, 15-minute, 30-minute, and hourly candles.
Use the lines as dynamic support/resistance levels or to identify potential breakout/breakdown points.
Customize the colors, styles, and the number of visible lines to match your chart theme or trading preferences.
Toggle specific timeframes on or off to focus on the most relevant price levels.
Ideal For:
Traders who use multi-timeframe analysis.
Those who rely on key price levels for decision-making.
Anyone looking to enhance their chart with clear, customizable reference lines while avoiding clutter.

Volume Delta Imbalance Index [PhenLabs]📊 Volume Delta Imbalance Index (VDII)
Version: PineScript™ v6
Description
The Volume Delta Imbalance Index is an advanced technical analysis tool that combines volume profile analysis with price movement dynamics to identify significant market imbalances. It features a sophisticated analysis system that weighs recent versus historical volume delta imbalance patterns, providing traders with insights into potential market reversals and trend continuation scenarios.
Points of Innovation:
Custom volume delta calculation incorporating price and volume relationships
Adaptive smoothing system based on market volatility
Multi-component analysis combining flow, acceleration, and strength metrics
Real-time volume profile integration with historical context
🔧 Core Components
Volume Profile Analysis: Dynamic volume delta imbalance distribution assessment
Flow Imbalance Detection: Buy/sell pressure evaluation
Strength Analysis: Composite market strength measurement
Acceleration Framework: Volume movement dynamics
Statistical Bands: Adaptive threshold system
🚨 Key Features 🚨
The indicator provides comprehensive analysis through:
Volume Delta: Up to date volume imbalance measurement
Market Structure: Support/resistance level identification
Flow Analysis: Buy/sell pressure visualization
Acceleration Signals: Movement momentum detection
Adaptive Bands: Dynamic overbought/oversold levels
📈 Visualization
Color-coded Columns: Shows direction and strength of imbalance
Signal Lines: Strong buy/sell level indicators
Statistical Bands: Shows normal trading ranges
Gradient Fills: Indicates extreme market conditions
Dynamic Opacity: Reflects trend strength
📌 Usage Guidelines
The indicator offers several customization options:
Basic Settings:
Lookback Period: Analysis timeframe adjustment
Sensitivity Level: Signal response calibration
History Depth: Historical context range
Memory Setting: Recent vs. historical data weight
Visual Settings:
Color Scheme: Bullish/bearish signal colors
Signal Levels: Strong buy/sell thresholds
Band Display: Statistical range visualization
✅ Best Use Cases / Things To Look For:
Wait for establishment in the initial trend when the VDII comes back towards zero and the color of the volume becomes more faint
Once this is established and the VDII pushes through to the other side look for small retracements above the zero line on the VDII leading you to believe it is a likely area for price to retrace and continue in its prior direction
Make sure you see the volume bars become more faint in color to give yo further confluence price will continue in its priorly established direction
⚠️ Limitations
Requires sufficient volume data
Most effective in liquid markets
Historical depth affects calculation speed
Possible lag in highly volatile conditions
What Makes This Unique
Composite Volume Analysis: Combines multiple volume metrics
Adaptive Calculation: Adjusts to market volatility
Profile Integration: Incorporates volume profile analysis
Multi-component Scoring: Weighted analysis system
Memory-efficient Design: Optimized for real-time analysis
🔧 How It Works
The indicator processes market data through four main components:
1. Volume Profile Analysis:
Creates dynamic volume delta distribution profiles
Weights recent versus historical data
Identifies significant price levels
2. Flow Imbalance Detection:
Analyzes buying versus selling pressure
Calculates normalized flow ratios
Determines market bias
3. Strength Analysis:
Measures composite market strength
Incorporates volume-weighted movements
Provides trend strength indication
4. Final Score Calculation:
Combines all components with weighted importance
Applies volatility-based smoothing
Generates final signal output
5. VDII Potential Reversal Confluences
Bars between signal confluence is default set to 10 but you can change it to whatever you’d prefer
Signals are a compiled look at the indicator as a whole determining where it think reversals or retracements are likely
💡 Note:
The indicator performs best in markets with consistent volume and clear trending or ranging conditions. Its sophisticated volume analysis provides valuable insights into market dynamics beyond traditional price-based indicators.

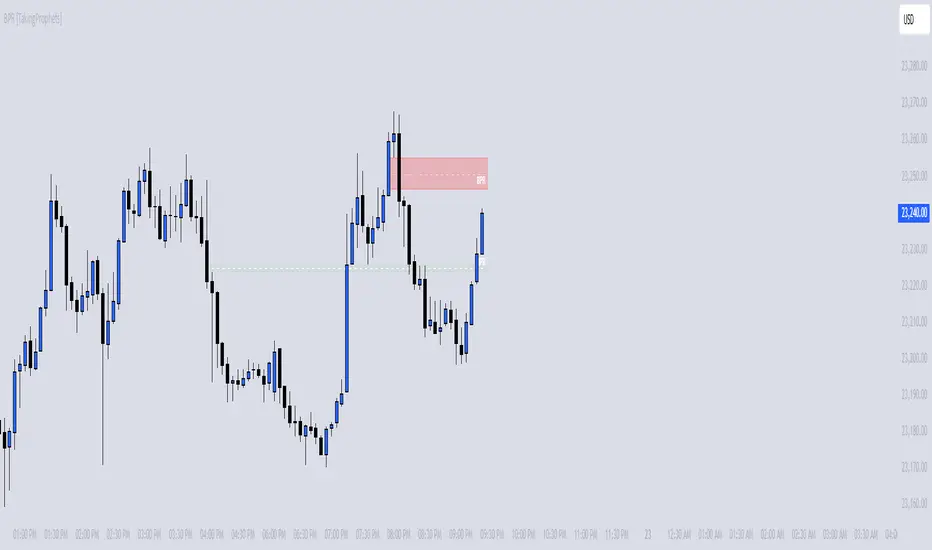
BPR [TakingProphets]The BPR (Balanced Price Range) Indicator by Taking Prophets is built for traders who follow ICT (Inner Circle Trader) concepts and smart money strategies. In ICT methodology, a Balanced Price Range (BPR) occurs when price rapidly moves in one direction, creating an imbalance that often gets revisited before price continues its trend. These areas represent inefficiencies in the market where liquidity was not properly distributed, making them key zones for potential retracements and trade setups.
How the Indicator Works:
🔹 Automatically Detects BPRs – No need to manually mark imbalances; the indicator highlights them for you.
🔹 Helps Identify Smart Money Footprints – Spot areas where price is likely to retrace and rebalance liquidity.
🔹 Customizable Sensitivity – Adjust detection parameters based on your preferred trading style.
🔹 Works Across All Markets – Apply it to Forex, Futures, Crypto, and Stocks on TradingView.
🔹 Clean and Intuitive Interface – Designed to be simple yet powerful for both new and experienced traders.
[COG]StochRSI Zenith📊 StochRSI Zenith
This indicator combines the traditional Stochastic RSI with enhanced visualization features and multi-timeframe analysis capabilities. It's designed to provide traders with a comprehensive view of market conditions through various technical components.
🔑 Key Features:
• Advanced StochRSI Implementation
- Customizable RSI and Stochastic calculation periods
- Multiple moving average type options (SMA, EMA, SMMA, LWMA)
- Adjustable signal line parameters
• Visual Enhancement System
- Dynamic wave effect visualization
- Energy field display for momentum visualization
- Customizable color schemes for bullish and bearish signals
- Adaptive transparency settings
• Multi-Timeframe Analysis
- Higher timeframe confirmation
- Synchronized market structure analysis
- Cross-timeframe signal validation
• Divergence Detection
- Automated bullish and bearish divergence identification
- Customizable lookback period
- Clear visual signals for confirmed divergences
• Signal Generation Framework
- Price action confirmation
- SMA-based trend filtering
- Multiple confirmation levels for reduced noise
- Clear entry signals with customizable display options
📈 Technical Components:
1. Core Oscillator
- Base calculation: 13-period RSI (adjustable)
- Stochastic calculation: 8-period (adjustable)
- Signal lines: 5,3 smoothing (adjustable)
2. Visual Systems
- Wave effect with three layers of visualization
- Energy field display with dynamic intensity
- Reference bands at 20/30/50/70/80 levels
3. Confirmation Mechanisms
- SMA trend filter
- Higher timeframe alignment
- Price action validation
- Divergence confirmation
⚙️ Customization Options:
• Visual Parameters
- Wave effect intensity and speed
- Energy field sensitivity
- Color schemes for bullish/bearish signals
- Signal display preferences
• Technical Parameters
- All core calculation periods
- Moving average types
- Divergence detection settings
- Signal confirmation criteria
• Display Settings
- Chart and indicator signal placement
- SMA line visualization
- Background highlighting options
- Label positioning and size
🔍 Technical Implementation:
The indicator combines several advanced techniques to generate signals. Here are key components with code examples:
1. Core StochRSI Calculation:
// Base RSI calculation
rsi = ta.rsi(close, rsi_length)
// StochRSI transformation
stochRSI = ((ta.highest(rsi, stoch_length) - ta.lowest(rsi, stoch_length)) != 0) ?
(100 * (rsi - ta.lowest(rsi, stoch_length))) /
(ta.highest(rsi, stoch_length) - ta.lowest(rsi, stoch_length)) : 0
2. Signal Generation System:
// Core signal conditions
crossover_buy = crossOver(sk, sd, cross_threshold)
valid_buy_zone = sk < 30 and sd < 30
price_within_sma_bands = close <= sma_high and close >= sma_low
// Enhanced signal generation
if crossover_buy and valid_buy_zone and price_within_sma_bands and htf_allows_long
if is_bullish_candle
long_signal := true
else
awaiting_bull_confirmation := true
3. Multi-Timeframe Analysis:
= request.security(syminfo.tickerid, mtf_period,
)
The HTF filter looks at a higher timeframe (default: 4H) to confirm the trend
It only allows:
Long trades when the higher timeframe is bullish
Short trades when the higher timeframe is bearish
📈 Trading Application Guide:
1. Signal Identification
• Oversold Opportunities (< 30 level)
- Look for bullish crosses of K-line above D-line
- Confirm with higher timeframe alignment
- Wait for price action confirmation (bullish candle)
• Overbought Conditions (> 70 level)
- Watch for bearish crosses of K-line below D-line
- Verify higher timeframe condition
- Confirm with bearish price action
2. Divergence Trading
• Bullish Divergence
- Price makes lower lows while indicator makes higher lows
- Most effective when occurring in oversold territory
- Use with support levels for entry timing
• Bearish Divergence
- Price makes higher highs while indicator shows lower highs
- Most reliable in overbought conditions
- Combine with resistance levels
3. Wave Effect Analysis
• Strong Waves
- Multiple wave lines moving in same direction indicate momentum
- Wider wave spread suggests increased volatility
- Use for trend strength confirmation
• Energy Field
- Higher intensity in trading zones suggests stronger moves
- Use for momentum confirmation
- Watch for energy field convergence with price action
The energy field is like a heat map that shows momentum strength
It gets stronger (more visible) when:
Price is in oversold (<30) or overbought (>70) zones
The indicator lines are moving apart quickly
A strong signal is forming
Think of it as a "strength meter" - the more visible the energy field, the stronger the potential move
4. Risk Management Integration
• Entry Confirmation
- Wait for all signal components to align
- Use higher timeframe for trend direction
- Confirm with price action and SMA positions
• Stop Loss Placement
- Consider placing stops beyond recent swing points
- Use ATR for dynamic stop calculation
- Account for market volatility
5. Position Management
• Partial Profit Taking
- Consider scaling out at overbought/oversold levels
- Use wave effect intensity for exit timing
- Monitor energy field for momentum shifts
• Trade Duration
- Short-term: Use primary signals in trading zones
- Swing trades: Focus on divergence signals
- Position trades: Utilize higher timeframe signals
⚠️ Important Usage Notes:
• Avoid:
- Trading against strong trends
- Relying solely on single signals
- Ignoring higher timeframe context
- Over-leveraging based on signals
Remember: This tool is designed to assist in analysis but should never be used as the sole decision-maker for trades. Always maintain proper risk management and combine with other forms of analysis.

Son Model ICT [TradingFinder] HTF DOL H1 + Sweep M15 + FVG M1🔵 Introduction
The ICT Son Model setup is a precise trading strategy based on market structure and liquidity, implemented across multiple timeframes. This setup first identifies a liquidity level in the 1-hour (1H) timeframe and then confirms a Market Structure Shift (MSS) in the 5-minute (5M) timeframe to validate the trend. After confirmation, the price forms a new swing in the 5-minute timeframe, absorbing liquidity.
Once this level is broken, traders typically drop to the 30-second (30s) timeframe and enter trades based on a Fair Value Gap (FVG). However, since access to the 30-second timeframe is not available to most traders, we take the entry signal directly from the 5-minute timeframe, using the same liquidity zones and confirmed breakouts to execute trades. This approach simplifies execution and makes the strategy accessible to all traders.
This model operates in two setups :
Bullish ICT Son Model and Bearish ICT Son Model. In the bullish setup, liquidity is first accumulated at the lows of the 1-hour timeframe, and after confirming a market structure shift, a long position is initiated. Conversely, in the bearish setup, liquidity is first drawn from higher levels, and upon confirmation of a bearish trend, a short position is executed.
Bullish Setup :
Bearish Setup :
🔵 How to Use
The ICT Son Model setup is designed around liquidity analysis and market structure shifts and can be applied in both bullish and bearish market conditions. The strategy first identifies a liquidity level in the 1-hour (1H) timeframe and then confirms a Market Structure Shift (MSS) in the 5-minute (5M) timeframe.
After this shift, the price forms a new swing, absorbing liquidity. When this level is broken in the 5-minute timeframe, the trader enters based on a Fair Value Gap (FVG). While the ideal entry is in the 30-second (30s) timeframe, due to accessibility constraints, we take entry signals directly from the 5-minute timeframe.
🟣 Bullish Setup
In the Bullish ICT Son Model, the 1-hour timeframe first identifies liquidity at the market lows, where price sweeps this level to absorb liquidity. Then, in the 5-minute timeframe, an MSS confirms the bullish shift.
After confirmation, the price forms a new swing, absorbing liquidity at a higher level. The price then retraces into a Fair Value Gap (FVG) created in the 5-minute timeframe, where the trader enters a long position, placing the stop-loss below the FVG.
🟣 Bearish Setup
In the Bearish ICT Son Model, liquidity at higher market levels is identified in the 1-hour timeframe, where price sweeps these levels to absorb liquidity. Then, in the 5-minute timeframe, an MSS confirms the bearish trend.
After confirmation, the price forms a new swing, absorbing liquidity at a lower level. The price then retraces into a Fair Value Gap (FVG) created in the 5-minute timeframe, where the trader enters a short position, placing the stop-loss above the FVG.
🔵 Settings
Swing period : You can set the swing detection period.
Max Swing Back Method : It is in two modes "All" and "Custom". If it is in "All" mode, it will check all swings, and if it is in "Custom" mode, it will check the swings to the extent you determine.
Max Swing Back : You can set the number of swings that will go back for checking.
FVG Length : Default is 120 Bar.
MSS Length : Default is 80 Bar.
FVG Filter : This refines the number of identified FVG areas based on a specified algorithm to focus on higher quality signals and reduce noise.
Types of FVG filters :
Very Aggressive Filter: Adds a condition where, for an upward FVG, the last candle's highest price must exceed the middle candle's highest price, and for a downward FVG, the last candle's lowest price must be lower than the middle candle's lowest price. This minimally filters out FVGs.
Aggressive Filter: Builds on the Very Aggressive mode by ensuring the middle candle is not too small, filtering out more FVGs.
Defensive Filter: Adds criteria regarding the size and structure of the middle candle, requiring it to have a substantial body and specific polarity conditions, filtering out a significant number of FVGs.
Very Defensive Filter: Further refines filtering by ensuring the first and third candles are not small-bodied doji candles, retaining only the highest quality signals.
🔵 Conclusion
The ICT Son Model setup is a structured and precise method for trade execution based on liquidity analysis and market structure shifts. This strategy first identifies a liquidity level in the 1-hour timeframe and then confirms a trend shift using the 5-minute timeframe.
Trade entries are executed based on Fair Value Gaps (FVGs), which highlight optimal entry points. By applying this model, traders can leverage existing market liquidity to enter high-probability trades. The bullish setup activates when liquidity is swept from market lows and a market structure shift confirms an upward trend, whereas the bearish setup is used when liquidity is drawn from market highs, confirming a downtrend.
This approach enables traders to identify high-probability trade setups with greater precision compared to many other strategies. Additionally, since access to the 30-second timeframe is limited, the strategy remains fully functional in the 5-minute timeframe, making it more practical and accessible for a wider range of traders.

Turtle Soup Model [PhenLabs]📊 Turtle Soup Model
Version: PineScript™ v6
Description
The Turtle Soup Model is an innovative technical analysis tool that combines market structure analysis with inter-market comparison and gap detection. Unlike traditional structure indicators, it validates market movements against a comparison symbol (default: ES1!) to identify high-probability trading opportunities. The indicator features a unique “soup pattern” detection system, comprehensive gap analysis, and real-time structure breaks visualization.
Innovation Points:
First indicator to combine structure analysis with gap detection and inter-market validation
Advanced memory management system for efficient long-term analysis
Sophisticated pattern recognition with multi-market confirmation
Real-time structure break detection with comparative validation
🔧 Core Components
Structure Analysis: Advanced pivot detection with inter-market validation
Gap Detection: Sophisticated gap identification and classification system
Inversion Patterns: “Soup pattern” recognition for reversal opportunities
Visual System: Dynamic rendering of structure levels and gaps
Alert Framework: Multi-condition notification system
🚨 Key Features 🚨
The indicator provides comprehensive analysis through:
Structure Levels: Validated support and resistance zones
Gap Patterns: Identification of significant market gaps
Inversion Signals: Detection of potential reversal points
Real-time Comparison: Continuous inter-market analysis
Visual Alerts: Dynamic structure break notifications
📈 Visualization
Structure Lines: Color-coded for highs and lows
Gap Boxes: Visual representation of gap zones
Inversion Patterns: Clear marking of potential reversal points
Comparison Overlay: Inter-market divergence visualization
Alert Indicators: Visual signals for structure breaks
💡Example
📌 Usage Guidelines
The indicator offers multiple customization options:
Structure Settings:
Pivot Period: Adjustable for different market conditions
Comparison Symbol: Customizable reference market
Visual Style: Configurable colors and line widths
Gap Analysis:
Signal Mode: Choice between close and wick-based signals
Box Rendering: Automatic gap zone visualization
Middle Line: Reference point for gap measurements
✅ Best Practices:
🚨Use comparison symbol from related market🚨
Monitor both structure breaks and gap inversions
Combine signals for higher probability trades
Pay attention to inter-market divergences
⚠️ Limitations
Requires comparison symbol data
Performance depends on market correlation
Best suited for liquid markets
What Makes This Unique
Inter-market Validation: Uses comparison symbol for signal confirmation
Gap Integration: Combines structure and gap analysis
Soup Pattern Detection: Identifies specific reversal patterns
Dynamic Structure Management: Automatically updates and removes invalid levels
Memory-Efficient Design: Optimized for long-term chart analysis
🔧 How It Works
The indicator processes market data through three main components:
1. Structure Analysis:
Detects pivot points with comparison validation
Tracks structure levels with array management
Identifies and processes structure breaks
2. Gap Analysis:
Identifies significant market gaps
Processes gap inversions
Manages gap zones visualization
3. Pattern Recognition:
Detects “soup” patterns
Validates with comparison market
Generates structure break signals
💡 Note: The indicator performs best when used with correlated comparison symbols and appropriate timeframe selection. Its unique inter-market validation system provides additional confirmation for traditional structure-based trading strategies.
