Smart Market Structure and Swing Points, version 1.0Smart Market Structure and Swing Points, Version 1.0
Overview
The Smart Market Structure and Swing Points script is designed to provide advanced insights into market structure and key swing points. This script helps identify important highs and lows, trend direction changes (structure breaks), and swing points, enhancing decision-making for both trend-following and reversal strategies. See below for detail presentation and why it has unique features.
Unique Features of the New Script
Market Structure Identification : Analyzes and marks key highs and lows to determine market structure, including higher highs, lower highs, higher lows, and lower lows.
Customizable Detection Length : Allows users to set the length for detecting highs and lows, providing flexibility to adapt to different market conditions and timeframes. Default value is 5 bars, but can be changed if needed.
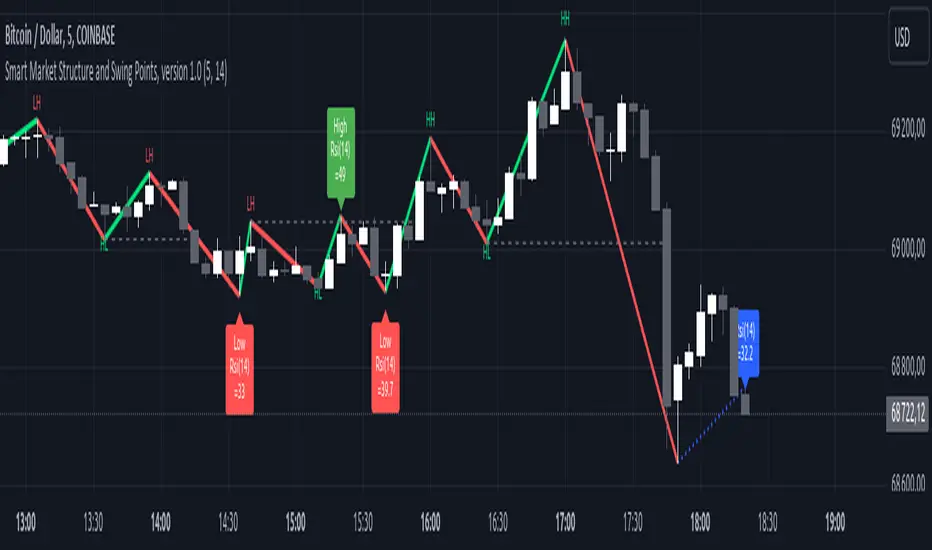
Visual Signal Indicators (Labels) : Plots labels on the chart to indicate higher highs (HH), lower highs (LH), higher lows (HL), and lower lows (LL), along with corresponding RSI values, offering clear visual cues for market structure analysis. The indication of RSI values directly on high and low points enables to better judge whether the points are strong references (extreme RSI values) or weak references (middle RSI values)
Dynamic Trend Lines : Draws solid and dotted lines to connect significant highs and lows, visually representing the current trend direction and potential trend changes. Dashed lines indicates structure breaks.
Swing High and Swing Low Detection : Identifies and marks the most recent swing highs and swing lows, helping traders spot potential reversal points and key levels for setting stop losses or take profit targets .
Originality and Usefulness
This script combines market structure, trend breaks and RSI to provide a more robust view of market dynamic by indicating the strength or weakness of swing points , in that way the script is unique.
Signal Description
The script includes various signal features that highlight potential trading opportunities based on market structure:
Higher Highs (HH) and Higher Lows (HL) : These labels are plotted when new highs or lows are formed, indicating a continuation of an uptrend. The labels are positioned with consideration of the Average True Range (ATR) for better visibility.
Lower Highs (LH) and Lower Lows (LL) : These labels are plotted when new highs or lows are formed, indicating a continuation of a downtrend. The labels include RSI values to provide additional information on the strength or weakness of the points.
Trend Direction Change : Dotted lines are drawn to indicate potential trend direction changes when the script detects significant shifts in market structure.
Swing Highs and Swing Lows : These are identified based on a customizable swing length, marking recent significant highs and lows to highlight potential reversal points.
These signals help identify high-probability turning points and confirm trend direction by ensuring that the market structure aligns with the trading strategy.
Detailed Description
Input Variables
Length for High/Low Detection (`length`) : Defines the range to check for highs and lows. Default is 5.
RSI Length (`rsilength`) : The number of periods to calculate the RSI. Default is 14.
Functionality
Market Structure Calculation : The script determines the highest high and lowest low within the specified range to identify key points in market structure.
```pine
h = ta.highest(high, length * 2 + 1)
l = ta.lowest(low, length * 2 + 1)
```
Directional Logic : Variables and functions manage the state of the indicator, updating highs and lows based on the current trend direction.
```pine
var bool dirUp = false
var float lastLow = high * 100
var float lastHigh = 0.0
// Additional variables for tracking state
```
Drawing Lines and Labels : Functions draw lines and labels on the chart to visualize market structure and trend changes.
```pine
f_drawLine() =>
_li_color = dirUp ? color.red : color.lime
line.new(x1=timeHigh - length, y1=lastHigh, x2=timeLow - length, y2=lastLow, color=_li_color, width=3, style=line.style_solid, xloc=xloc.bar_index)
f_drawLastLine() =>
_li_color = dirUp ? color.blue : color.blue
if timeHigh > timeLow
line.new(x1=timeHigh - length, y1=lastHigh, x2=bar_index, y2=low, color=_li_color, width=2, style=line.style_dotted, xloc=xloc.bar_index)
else
line.new(x1=timeLow - length, y1=lastLow, x2=bar_index, y2=high, color=_li_color, width=2, style=line.style_dotted, xloc=xloc.bar_index)
```
Updating Highs and Lows : The main logic updates highs and lows based on the current trend direction, adding labels for new higher highs, lower highs, higher lows, and lower lows.
```pine
if dirUp
if f_isMin(length)
lastLow := low
// Additional logic for updating lows and labels
if f_isMax(length) and high > lastLow
lastHigh := high
// Additional logic for updating highs and labels
dirUp := false
li := f_drawLine()
```
Swing Highs and Lows : The script identifies recent swing highs and swing lows based on a customizable swing length, drawing lines to mark these points.
```pine
swingLength = 3 * length
isSwingHigh = ta.highestbars(high, swingLength) == 0
isSwingLow = ta.lowestbars(low, swingLength) == 0
if (isSwingHigh)
if (na(highLine))
highLine := line.new(bar_index, high, bar_index, high, color=color.green, style=line.style_solid, width=1)
else
line.set_xy1(highLine, bar_index, high)
line.set_xy2(highLine, bar_index + swingLength, high)
if (isSwingLow)
if (na(lowLine))
lowLine := line.new(bar_index, low, bar_index, low, color=color.red, style=line.style_solid, width=1)
else
line.set_xy1(lowLine, bar_index, low)
line.set_xy2(lowLine, bar_index + swingLength, low)
```
How to Use
Configuring Inputs : Adjust the detection length and RSI length as needed. Modify the lookback periods to suit your trading strategy. The indicator is adaptable and can be used on any timeframe.
Interpreting the Indicator : Use the labels and lines to gauge market structure and trend direction. Look for higher highs, lower highs, higher lows, and lower lows to confirm market structure.
Signal Confirmation : Pay attention to the labels and lines that provide signals for potential trend changes and swing points. Use these signals to better time entries and exits.
This script provides a detailed view of market structure and swing points, helping make more informed decisions by considering key highs and lows, trend direction changes, and the strength or weakness of swing points.
Recherche dans les scripts pour "smart"
Smart Money Oscillator [ChartPrime]The "Smart Money Oscillator " is a premium and discount zone oscillator with BOS and CHoCH built in for further analysis of price action. This indicator works by first determining the the premium and discount zones by using pivot points and high/lows. The top of this oscillator represents the current premium zone while the bottom half of this oscillator represents the discount zone. This oscillator functionally works like a stochastic oscillator with more sophisticated upper and lower bounds generated using smart money concept theories. We have included a moving average to allow the user to visualize the currant momentum in the oscillator. Another key feature we have included lagging divergences to help traders visualize potential reversal conditions.
Understanding the concepts of Premium and Discount zones, as well as Break of Structure (BoS) and Change of Character (CHoCH), is crucial for traders using the Smart Money Oscillator. These concepts are rooted in market structure analysis, which involves studying price levels and movements.
Premium Zone is where the price is considered to be relatively high or 'overbought'. In this zone, prices have risen significantly and may indicate that the asset is becoming overvalued, potentially leading to a reversal or slowdown in the upward trend.
The Discount Zone represents a 'discount' or 'oversold' area. Here, prices have fallen substantially, suggesting that the asset might be undervalued. This could be an indicator of a potential upward reversal or a pause in the downward trend.
Break of Structure (BoS) is about the continuation of a trend. In a bullish trend, a BoS is identified by the break of a recent higher high. In a bearish trend, it's the break of a recent Lower Low. BoS indicates that the trend is strong and likely to continue in its current direction. It's a sign of strength in the prevailing trend, whether up or down.
Change of Character (CHoCH) is an indication of a potential end to a trend. It occurs when there's a significant change in the market's behavior, contradicting the current trend. For example, in an uptrend characterized by higher highs and higher lows, a CHoCH may occur if a new high is formed but then is followed by an impulsive move downwards. This suggests that the bullish trend may be weakening and a bearish reversal could be imminent. CHoCH is essentially a sign of trend exhaustion and potential reversal.
With each consecutive BoS, the signal line of the oscillator will deepen in color. This allows you to visually see the strength of the current trend. The maximum strength of the trend is found by keeping track of the maximum number of consecutive BoS's within a window of 10. This calculation excludes periods without any BoS's to allow for a more stable max.
Quick Update is a feature that implements a more aggressive algorithm to update the highs and lows. Instead of updating the pivot points exclusively to update the range levels, it will attempt to use the current historical highs/lows to update the bounds. This results in a more responsive range at the cost of stability. There are pros and cons for both settings. With Quick Update disabled, the indicator will allow for strong reversals to register without the indicator maxing out. With Quick Update enabled, the indicator will show shorter term extremes with the risk of the signal being pinned to the extremities during strong trends or large movements. With Quick Update disabled, the oscillator prioritizes stability, using a more historical perspective to set its bounds. When Quick Update is enabled, the oscillator becomes more responsive, adjusting its bounds rapidly to reflect the latest market movements.
The Scale Offset feature allows the indicator to break the boundaries of the oscillator. This can be useful when the market is breaking highs or lows allowing the user to identify extremities in price. With Scale Offset disabled the oscillator will always remain inside of the boundaries because the extremities will be updated instantly. When this feature is enabled it will update the boundaries one step behind instead of updating it instantly. This allows the user to more easily see overbought and oversold conditions at the cost of incurring a single bar lag to the boundaries. Generally this is a good idea as this behavior makes the oscillator more sensitive to recent price spikes or drops, reflecting sudden market movements more accurately. It accentuates the extremities of the market conditions, potentially offering a more aggressive analysis. The main trade-off with the Scale Offset feature is between sensitivity and potential overreaction. It offers a more immediate and exaggerated reflection of market conditions but might also lead to misinterpretations in certain scenarios, especially in highly volatile markets.
Divergence is used to predict potential trend reversals. It occurs when the price of an asset and the reading of an oscillator move in opposite directions. This discrepancy can signal a weakening of the current trend and possibly indicate a potential reversal.
Divergence doesn't always lead to a trend reversal, but it's a warning sign that the current trend might be weakening. Divergence can sometimes give false signals, particularly in strongly trending markets where the oscillator may remain in overbought or oversold conditions for extended periods. The lagging nature of using pivot points to calculate divergences means that all divergences are limited by the pivot look forward input. The upside of using a longer look forward is that the divergences will be more accurate. The obvious con here is that it will be more delayed and might be useless by the time it appears. Its recommended to use the built in divergences as a way to learn how these are formed so you can make your own in real time.
By default, the oscillator uses a smoothing of 3 to allow for a more price like behavior while still being rather smooth compared to raw price data. Conversely, you can increase this value to make this indicator behave smoother. Something to keep in mind is that the amount of delay from real time is equal to half of the smoothing period.
We have included a verity of alerts in this indicator. Here is a list of all of the available alerts: Bullish BOS, Bearish BOS, Bullish CHoCH, Bearish CHoCH, Bullish Divergence, Hidden Bullish Divergence, Bearish Divergence, Hidden Bearish Divergence, Cross Over Average, Cross Under Average.
Below are all of the inputs and their tooltips to get you started:
Settings:
Smoothing: Specifies the degree of smoothing applied to the oscillator. Higher values result in smoother but potentially less responsive signals.
Average Length: Sets the length of the moving average applied to the oscillator, affecting its sensitivity and smoothness.
Pivot Length: Specifies the forward-looking length for pivot points, affecting how the oscillator anticipates future price movements. This directly impacts the delay in finding a pivot.
Max Length: Sets the maximum length to consider for calculating the highest values in the oscillator.
Min Length: Defines the minimum length for calculating the lowest values in the oscillator.
Quick Update: Activates a faster update mode for the oscillator's extremities, which may result in less stable range boundaries.
Scale Offset: When enabled, delays updating minimum and maximum values to enhance signal directionality, allowing the signal to occasionally exceed normal bounds.
Candle Color: Enables coloring of candles based on the current directional signal of the oscillator.
Labels:
Enable BOS/CHoCH Labels: Activates the display of BOS (Break of Structure) and CHoCH (Change of Character) labels on the chart.
Visual Padding: Turns on additional visual padding at the top and bottom of the chart to accommodate labels. Determines the amount of visual padding added to the chart for label display.
Divergence:
Divergence Pivot: Defines the number of bars to the right of the pivot in divergence calculations, influencing the oscillator's responsiveness.
Divergence Pivot Forward: Directly impacts latency. Longer periods results in more accurate results at the sacrifice of delay.
Upper Range: Sets the upper range limit for divergence calculations, influencing the oscillator's sensitivity to larger trends.
Lower Range: Determines the lower range limit for divergence calculations, affecting the oscillator's sensitivity to shorter trends.
Symbol: Allows selection of the label style for divergence indicators, with options for text or symbolic representation.
Regular Bullish: Activates the detection and marking of regular bullish divergences in the oscillator.
Hidden Bullish: Enables the identification and display of hidden bullish divergences.
Regular Bearish: Turns on the feature to detect and highlight regular bearish divergences.
Hidden Bearish: Activates the functionality for detecting and displaying hidden bearish divergences.
Color:
Bullish: Determines the minimum/maximum color gradient for bullish signals, impacting the chart's visual appearance.
Bearish: Defines the minimum/maximum color gradient for bearish signals, affecting their visual representation.
Average: Specifies the color for the average line of the oscillator, enhancing chart readability.
CHoCH: Sets the color for bullish/bearish CHoCH (Change of Character) signals.
Premium/Discount: Determines the color for the premium/discount zone in the oscillator's visual representation.
Text Color: Sets the color for the text in BoS/CHoCH labels.
Regular Bullish: Defines the color used to represent regular bullish divergences.
Hidden Bullish: Specifies the color for hidden bullish divergences.
Regular Bearish: Determines the color for hidden bearish divergences.
Divergence Text Color: Specifies the color for the text in divergence labels.

Smart MAThe Smart MA indicator is a tool designed for traders seeking insights into market trends, with its foundation rooted in moving averages. It offers two distinctive color options, with "Crossing" as the default choice and "Direction" as an alternative. Let's delve deeper into these options:
1. "Crossing" Color Option (Default):
Key Features:
Utilizes the interaction between fast and slow moving averages.
The color of the base moving average (MA) line dynamically changes based on crossovers between these moving averages.
Offers real-time visual signals for potential shifts in market sentiment.
Interpretation:
With the "Crossing" color option as the default setting, the base MA line's color responds to the interaction of the fast and slow moving averages.
A crossover where the fast MA crosses above the slow MA may prompt the base MA line to change to a bullish color (e.g., teal), indicating a potential bullish trend.
Conversely, if the fast MA crosses below the slow MA, the base MA line's color may alter to represent a bearish sentiment (e.g., red). This color shift provides a visual marker for a potential bearish trend, potentially guiding traders towards shorting opportunities.
2. "Direction" Color Option:
Key Features:
Focuses on the directional trend of the base moving average (MA).
The color of the base MA line signifies the direction in which the base MA is moving.
Aids in quickly identifying the prevailing market trend.
Interpretation:
Uptrend - Bullish Direction: When the base MA slopes upward, indicating an average price increase over the chosen base MA length, the base MA line's color may shift to a bullish hue (e.g., teal). This visual cue signals a potential uptrend, suggesting favorable long positions.
Downtrend - Bearish Direction: If the base MA slopes downward, signifying an average price decrease over the selected base MA length, the base MA line could change to a bearish shade (e.g., red). This color shift acts as an indicator of a potential downtrend, implying possible opportunities for shorting.
Customization:
Both color options allow traders to adjust the indicator's parameters, including base MA length, MA type, fast MA length, and slow MA length, to align with their trading strategies and preferred timeframes.
In summary, the Smart MA indicator, based on moving averages, provides traders with two color options: the default "Crossing" and "Direction" as an alternative. The "Crossing" option leverages fast and slow moving averages to offer real-time visual cues for dynamic market shifts. The "Direction" option simplifies trend analysis by focusing on the directional trend of the base MA. The choice between these options depends on your trading style and the depth of analysis you require. With the Smart MA indicator, you're equipped to make informed trading decisions in today's financial markets.

Smart Disparity IndexThe Smart Disparity Index (SDI) is an optimized version of the Disparity Index indicator invented by Steve Nison (book "Beyond Candlesticks").
According to Steve Nison, "The disparity index (or disparity ratio), compares, as a percentage, the latest close to a chosen moving average", which means that the indicator gives the difference in % between the closing price and a simple moving average.
The calculation formula is therefore as follows:
Disparity Index = 100 x (closing_price - simple_moving_average) / simple_moving_average
In order to optimize the calculation, I replaced the closing price with the 6-period exponential moving average (EMA6) which, according to many years of experience, allows prices to be smoothed by eliminating excesses.
Formula for calculating the Smart Disparity Index:
SDI = 100 x (EMA6 - simple_moving_average) / simple_moving_average
The provided script displays the SDI for the 20, 50, 100 and 200 periods.
From my point of view, I recommend using the SDI50 as a priority:
SDI50 = 100 x (EMA6 - SMA50) / SMA50
In the chart, we can see the SDI50 (in purple) is on a long-term support (in green), this indicates a probability of a Bitcoin rise in the coming months.
The SDI can also be used as a momentum type indicator.

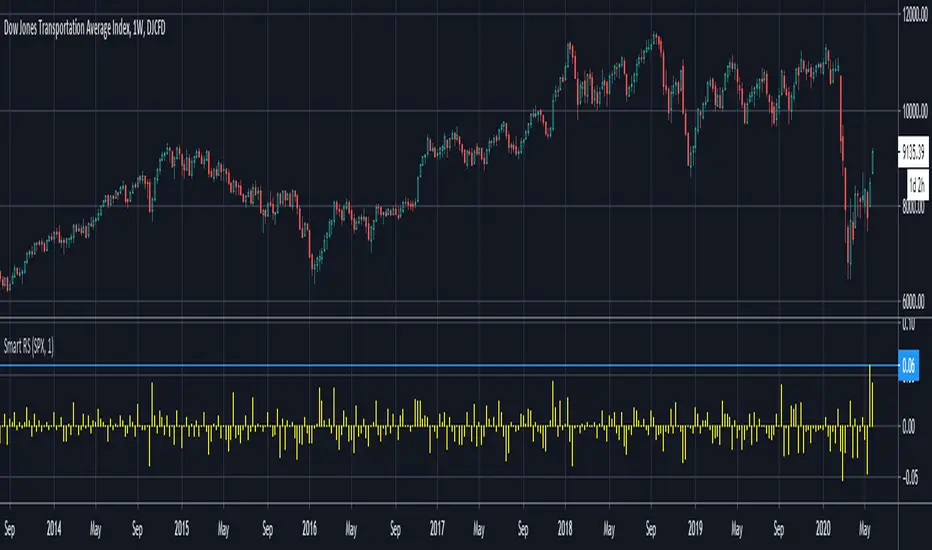
Smart Relative Strength Can Remove False SignalsRelative strength is one of the most useful indicators in the market, highlighting when stocks and sectors are outperforming or underperforming a broader index.
Traditional RS compares the percentage change of one symbol over a given time frame and subtracts the percentage change of the S&P 500 over the same period.
This is handy, but it can produce false signals at times of volatility. For example, when the broader market is crashing, certain sectors may “outperform” simply by falling less than the S&P 500.
Smart Relative Strength addresses this shortcoming by requiring that the symbol’s absolute AND relative returns both be positive. Otherwise a zero is returned.
This was useful last week on the Dow Jones Transportation Average . Using simple relative strength, it had its best one-week performance against the S&P 500 since October 2008. This was obviously a false signal because October 2008 was a time that everything else was crashing.
Smart Relative Strength showed that, excluding periods of overall decline, DJT had its best week since January 2008.
Note: This chart uses a 1-period interval, while the code defaults to 21 periods.
Smart Money Sector RotationSTOP MISTAKING INFLATION FOR PERFORMANCE.
Your PnL might look green in nominal terms, but are you actually generating wealth, or just floating on a rising tide of liquidity?
The "Smart Money Sector Rotation" indicator is an institutional-grade dashboard designed to answer that single, critical question. It strips away the noise of nominal price action and benchmarks major assets against the "Honest Hurdle"—a dynamic baseline derived from M2 Money Supply, Inflation Breakevens, and Treasury Yields.
If an asset isn't beating the Hurdle, you aren't generating real wealth—you're just keeping pace with debasement.
THE HONEST FRAMEWORK Most screeners rank assets by simple percentage gain. This tool is different. It calculates a "Required Rate of Return" (Min Return) based on live Federal Reserve data (FRED).
1. Quantify the Debasement. We automatically fetch M2 Money Supply Growth and Inflation expectations to set the "floor."
2. Calculate Real Alpha. We measure how far an asset is trading above or below that floor.
3. Classify the Trend. Using RRG-style logic (Relative Rotation Graph), we categorize assets into four actionable phases based on their Real Yield and Momentum.
THE 4 MARKET PHASES Instead of vague signals, get a clear read on the asset's lifecycle:
ZONE 1: ELITE / LEADING (Cyan/Green) -- The State: Expansion. -- The Logic: The asset is generating positive Real Yields (beating the money printer) and has strong momentum relative to its peers.
ZONE 2: IMPROVING (Gold) -- The State: Recovery. -- The Logic: The asset may be below the Hurdle, but momentum is shifting positively. It is "waking up."
ZONE 3: LAGGING / WEAKENING (Orange/Red) -- The State: Contraction. -- The Logic: The asset is failing to keep up with debasement or is actively losing relative strength.
KEY FEATURES -- Auto-Macro Data: Connects directly to FRED for M2 (WM2NS), 10Y Inflation (T10YIE), and Yields (DGS10). No manual entry required. -- Trend Visualization: Tickers are marked with Green/Red indicators based on their 200-day Moving Average status. -- Prestige Color System: A dark-mode optimized, high-contrast palette designed for professional clarity. -- Multi-Asset Universe: Tracks Equities (XLK, XLE, etc.), Commodities (Gold, Silver, Oil), and Rates (TLT, HYG) in a single view.
HOW TO USE
1. Check the Header: Look at the "Min Ret" (Minimum Return). This is your beat-to-profit line.
2. Scan the Status: Focus on assets in the Elite or Leading zones for trend continuation. Watch Improving assets for potential reversals.
3. Respect the Trend: Use the SMA200 indicator as a final filter. A "Leading" status with a Red trend mark may indicate a trend that is rolling over.
DISCLAIMER This tool is for informational and educational purposes only. It visualizes macroeconomic data and does not constitute financial advice or a recommendation to buy/sell.

Smart Volume Radar (TR/EN)
ENGLISH DESCRIPTION
Stop guessing the volume bars! This indicator is designed to be a "Decision Maker" for traders who want to understand the true power behind price movements instantly. It replaces complex volume analysis with a simple, high-contrast dashboard.
Key Features:
🚦 Traffic Light Logic: The entire panel changes color based on the volume status.
Dark Green: Volume is above average (Fuel is ready 🚀).
Dark Red: Volume is below average (No interest / Trap Zone ⚠️).
📊 RVOL (Relative Volume): Shows exactly how many times the current volume is compared to the average (e.g., 2.5x).
🧠 Trader Logic (Smart Status): It doesn't just show numbers; it interprets them for you:
DEAD: No liquidity, stay away.
STANDARD: Routine market flow.
POWER ENTRY: Ideal volume for breakouts.
ULTRA HIGH (FOMO): Warning! Volume is too high, a reversal might be near.
👀 High Contrast Design: Dark solid backgrounds with white bold text for maximum readability on any chart.
How to Use:
Look at the panel color. If it's RED, ignore breakout signals (likely a fakeout).
If it's GREEN, check the "Trader Note" at the bottom.
If you see "POWER ENTRY", the trend is supported by real volume.

Smart Z-Score OB Z-Score Impulse & Institutional Order Blocks
This indicator identifies high-probability Order Blocks (OB) by calculating the statistical deviation of price momentum using Z-Score analysis. Unlike standard pivot-based indicators, it focuses exclusively on "Institutional Footprints"—areas where price exploded with significant force.
How it Works
Statistical Outlier Detection: The script analyzes the last 100 bars to determine the "normal" volatility range. When price momentum exceeds the 6.0 Z-Score threshold, it identifies a move that has less than a 0.001% probability of being random noise.
Impulse Tracking: It monitors cumulative one-way price distance (momentum). A breakout only triggers a signal if the movement is exceptionally strong relative to recent history.
Smart Order Blocks: When a "Z-UP" or "Z-DOWN" impulse is detected, the script automatically draws a horizontal box at the origin of the move. These zones represent high-interest areas where institutional orders were likely placed.
Trading Strategy (SMC Focus)
Z-UP (Green): Indicates an aggressive institutional buy. The resulting green box acts as a Bullish Order Block (Demand Zone).
Z-DOWN (Red): Indicates aggressive institutional selling. The red box acts as a Bearish Order Block (Supply Zone).
Entry: Look for price to return (Retest) to these boxes. Since these zones were created by massive momentum, they often provide high-probability entry points with clear Stop-Loss levels just outside the zone.
"Higher Z-Score = Fewer, more potent Order Block signals."

Smart Money Swing Strategy [All-in-One]# Pro Swing Trader 📈
A comprehensive swing trading indicator for TradingView that combines multiple confluence factors to identify high-probability trade setups with built-in risk management.
## 🎯 Overview
This indicator is designed for swing traders who want to catch momentum pullbacks with precision entries. It filters trades using multiple timeframe analysis, RSI zones, volume confirmation, and EMA trends to deliver only the highest-confidence setups.
### Key Features
✅ **Multi-Timeframe Confluence** - Confirms trades with higher timeframe analysis (Daily, 4H, etc.)
✅ **Smart Entry Signals** - Detects pullback-to-EMA reclaim patterns
✅ **Automatic Risk Management** - Calculates stops, targets, and R-multiples
✅ **Dynamic Stop Loss** - ATR trailing stop + break-even automation
✅ **Real-Time HUD Dashboard** - Live confluence scoring and trade metrics
✅ **Comprehensive Alerts** - Entry, TP1, TP2, and stop-loss notifications
✅ **Visual Trade Levels** - Clear on-chart stop-loss and take-profit lines
---
## 📊 How It Works
### Signal Logic
The indicator identifies two types of signals:
**Base Signals** (Small triangles):
- Price pulls back between Fast EMA and Slow EMA
- RSI is in the swing zone (40-60 by default)
- Price reclaims the Fast EMA with momentum
- Optional: Volume spike confirmation
**High-Confidence Signals** (Large triangles):
- All base signal criteria met
- Higher timeframe confirms the trend direction
- HTF RSI and slope alignment
- These are your primary trade signals
### Entry Conditions
#### Long Entry (🟢 HC L)
1. Fast EMA > Slow EMA (uptrend)
2. Previous candle closed between the EMAs (pullback)
3. Current candle crosses above and closes above Fast EMA (reclaim)
4. RSI between 40-60 (swing zone)
5. **HTF Confirmation**: Daily/4H price above EMA50, RSI > 50, positive slope
6. Optional: Volume > 1.5x 20-bar average
#### Short Entry (🔻 HC S)
1. Fast EMA < Slow EMA (downtrend)
2. Previous candle closed between the EMAs (pullback)
3. Current candle crosses below and closes below Fast EMA (reclaim)
4. RSI between 40-60 (swing zone)
5. **HTF Confirmation**: Daily/4H price below EMA50, RSI < 50, negative slope
6. Optional: Volume > 1.5x 20-bar average
---
## 🎛️ Settings & Parameters
### Trend Parameters
- **Fast EMA**: Default 20 - Quick trend detection
- **Slow EMA**: Default 50 - Major trend filter
- **Swing Lookback**: Default 10 - Bars to find swing high/low for stops
### RSI Settings
- **RSI Length**: Default 14
- **RSI Min**: Default 40 - Lower bound of swing zone
- **RSI Max**: Default 60 - Upper bound of swing zone
### Risk Management
- **Final TP Risk-Reward (R)**: Default 2.0 - Main profit target multiplier
- **TP1 R Multiple**: Default 1.0 - Partial profit target
- **Use Break-even Stop**: Move stop to entry after 1R profit
- **ATR Trailing Stop**: Dynamic stop based on ATR(14) x 2.0
### Filters
- **Require Volume Spike**: Optional volume confirmation filter
- **Use Higher TF Confirmation**: Enable multi-timeframe analysis
- **Higher TF**: Default "D" (Daily) - Can use 240 (4H), W (Weekly), etc.
---
## 📈 Dashboard (HUD)
The top-center dashboard shows real-time confluence status:
| Column | Meaning |
|--------|---------|
| **Trend** | Current trend direction (UP/DOWN/Flat) |
| **HTF** | Higher timeframe alignment (Bull/Bear/Flat) |
| **RSI Zone** | Is RSI in swing zone? (YES/NO) |
| **Volume** | Volume spike detected? (YES/NO) |
| **Signal** | Active signal type (HC LONG/HC SHORT/None) |
| **R Risk** | Current profit in R-multiples |
| **Stop** | Current stop-loss level |
| **TP1** | Partial take-profit status |
| **TP2** | Final take-profit status |
| **Conf %** | Overall confluence score (0-100%) |
### Confidence Score Breakdown
- **20%** - Trend present (up or down)
- **30%** - HTF confirmation aligned (or 15% if HTF off)
- **20%** - RSI in swing zone
- **10%** - Volume spike
- **20%** - High-confidence signal triggered
**Scoring**:
- 🟢 70%+ = High probability setup
- 🟡 40-69% = Moderate setup
- 🔴 <40% = Low probability
---
## 🔔 Alert Setup
The indicator includes 8 alert conditions:
### Entry Alerts
- **HC LONG ENTRY** - High-confidence long signal triggered
- **HC SHORT ENTRY** - High-confidence short signal triggered
### Profit Target Alerts
- **LONG TP1 Reached** - Hit partial profit (1R by default)
- **LONG Final TP Reached** - Hit final target (2R by default)
- **SHORT TP1 Reached** - Hit partial profit
- **SHORT Final TP Reached** - Hit final target
### Stop Loss Alerts
- **LONG Stop/BE/Trail Level Hit** - Long position stopped out
- **SHORT Stop/BE/Trail Level Hit** - Short position stopped out
### How to Set Up Alerts
1. Click "Add Alert" on TradingView
2. Choose this indicator from the dropdown
3. Select desired alert condition
4. Set alert to trigger "Once Per Bar Close"
5. Customize notification method (popup/email/webhook)
---
## 📋 Trading Workflow
### 1. Wait for High-Confidence Signal
Look for the large **HC L** or **HC S** triangle on chart close.
### 2. Verify Confluence
Check the HUD dashboard:
- Confidence score should be 70%+
- HTF status should show alignment
- RSI Zone should be "YES"
### 3. Entry
Enter the trade at market or on next candle open.
### 4. Set Stop Loss
Use the **initial stop** shown in the HUD (red line on chart):
- **Longs**: Below the swing low (10-bar lookback)
- **Shorts**: Above the swing high (10-bar lookback)
### 5. Set Take Profits
- **TP1**: 1R (50% position close) - Yellow line
- **TP2**: 2R (remaining 50% close) - Green line
### 6. Manage the Trade
- Monitor the **R Risk** column to track profit
- Stop moves to break-even automatically after 1R (if enabled)
- ATR trailing stop engages dynamically (red line adjusts)
- Exit if price hits dynamic stop level
---
## 🎨 Visual Guide
### On-Chart Elements
**Triangles**:
- Small lime/red triangles = Base signals (lower confidence)
- Large lime/red triangles = High-confidence signals (trade these!)
**Lines**:
- 🟢 Green line = Fast EMA (20)
- 🟠 Orange line = Slow EMA (50)
- 🔴 Red line = Dynamic stop-loss level
- 🟡 Yellow line = TP1 level
- 🟢 Green line = TP2 (final target)
**HUD Colors**:
- 🟢 Green = Bullish/Active/Good
- 🔴 Red = Bearish/Inactive/Warning
- 🟡 Yellow = Neutral/Caution
- 🔵 Blue = Informational
- ⚫ Gray = Disabled/Off
---
## 💡 Strategy Tips
### Best Practices
1. **Only trade High-Confidence signals** - Ignore base signals unless very experienced
2. **Respect the HTF** - Don't fight the higher timeframe trend
3. **Use proper position sizing** - Risk 1-2% of account per trade
4. **Partial profits work** - Take 50% off at TP1, let rest run to TP2
5. **Let winners run** - Trailing stop helps capture extended moves
6. **Be patient** - Quality over quantity; wait for 70%+ confluence
### Optimal Timeframes
- **Primary Chart**: 1H, 4H, Daily (swing trading)
- **HTF Setting**: One level higher than your chart
- If trading 1H → Set HTF to 4H or D
- If trading 4H → Set HTF to D or W
- If trading Daily → Set HTF to W
### Market Conditions
**Best Performance**:
- Trending markets with healthy pullbacks
- Clear support/resistance zones
- Moderate volatility
**Avoid Trading**:
- Extremely choppy/sideways markets
- Major news events (unless experienced)
- Low confidence scores (<40%)
---
## ⚙️ Advanced Customization
### Aggressive Setup (More Signals)
```
Fast EMA: 12
Slow EMA: 26
RSI Min: 35
RSI Max: 65
Use HTF Confirmation: OFF
Require Volume Spike: OFF
```
### Conservative Setup (Fewer, Higher Quality)
```
Fast EMA: 20
Slow EMA: 50
RSI Min: 45
RSI Max: 55
Use HTF Confirmation: ON
Require Volume Spike: ON
Final TP R: 3.0
```
### Scalping Adaptation (Not Recommended)
```
Fast EMA: 9
Slow EMA: 21
Swing Lookback: 5
TP1 R: 0.5
Final TP R: 1.0
```
---
## ⚠️ Risk Disclaimer
**IMPORTANT**: This indicator is for educational and informational purposes only.
- Past performance does not guarantee future results
- No indicator is 100% accurate
- Always use proper risk management
- Never risk more than you can afford to lose
- Consider using a demo account first
- Seek professional financial advice if needed
Trading involves substantial risk of loss and is not suitable for all investors.
---
## 🔧 Troubleshooting
### "No signals appearing"
- Check if HTF confirmation is enabled but market isn't aligned
- Verify RSI zone isn't too restrictive
- Ensure volume spike isn't filtering out all setups
- Try adjusting EMA lengths for your asset
### "Too many false signals"
- Enable HTF confirmation
- Tighten RSI zone (e.g., 45-55)
- Enable volume spike requirement
- Only trade 70%+ confidence setups
### "Stops too tight/wide"
- Adjust Swing Lookback length
- Modify ATR multiplier for trailing stop
- Consider the asset's volatility
### "Alerts not working"
- Ensure alert is set to "Once Per Bar Close"
- Check indicator is added to the chart
- Verify TradingView notification settings
---
## 📚 Version History
**v1.0 (Current)**
- Initial release
- Multi-timeframe confluence system
- Dynamic risk management
- Real-time HUD dashboard
- Comprehensive alert system
- ATR trailing stops
- Break-even automation
---
## 🤝 Support & Feedback
If you find this indicator helpful:
- ⭐ Star the script on TradingView
- 💬 Share your results and feedback
- 🐛 Report bugs or suggest improvements
- 📖 Share with other traders
---
## 📖 Additional Resources
### Recommended Reading
- "The New Trading for a Living" by Dr. Alexander Elder
- "Swing Trading Using Multiple Timeframes" - Educational articles
- Risk management and position sizing guides
### Learn More About
- Multiple timeframe analysis
- EMA crossover strategies
- RSI divergence and zones
- ATR-based stops
- R-multiple profit management
---
## 📝 License
This indicator is provided as-is for personal trading use.
**Usage Rights**:
- ✅ Use for personal trading
- ✅ Modify for personal use
- ❌ Resell or redistribute
- ❌ Claim as original work
---
## 🎓 Quick Start Checklist
- Add indicator to TradingView chart
- Set your preferred timeframe (1H/4H/Daily)
- Configure HTF setting (one level higher)
- Review default parameters
- Set up entry alerts (HC LONG/SHORT)
- Set up TP and SL alerts
- Test on historical data
- Paper trade first
- Start with small position sizes
- Track your results
---
**Happy Trading! 📊💰**
*Remember: Discipline, patience, and risk management are the keys to long-term success.*

Smart Cloud by Ilker (Custom Matriks)A Proprietary Hybrid Trend System for All Major Financial Assets
This indicator, originally developed for the Matriks platform, is a highly effective hybrid trend identification system designed for day-to-day analysis across all major asset classes, including Stocks, Forex, Indices, and Cryptocurrencies. It combines the forward-looking principle of the Ichimoku Kinko Hyo Cloud with heavily smoothed Moving Averages (MAs) to create a clear, visually guided trading signal. (Daily Timeframe recommended for optimal results).
📊 Algorithmic Structure and Parameters
The "Smart Cloud" utilizes six primary user-adjustable parameters that govern its sensitivity and shape, moving away from standard Ichimoku settings to provide a robust, customized trend view:
P1, P2, P3 (60, 56, 248): These long-term settings define the core structure and width of the cloud, acting as the primary dynamic support and resistance zone. The significantly longer P3 (Lagging Period) ensures the cloud reflects strong, deep market cycles.
P4 (Displacement 26): Maintains the traditional Ichimoku principle of projecting the cloud 26 periods forward to provide a predictive view of future trend support/resistance.
P5 (MA50 - Blue) & P6 (MA10 - Purple): These are the two primary Moving Averages plotted inside the cloud. They serve as fast-response momentum lines:
P5 (MA50): Represents the middle-term trend average.
P6 (MA10): Represents the short-term market momentum.
📈 Core Trend and Signal Interpretation
The indicator provides powerful trend identification based on three key components:
The Cloud (Kumo):
Green Cloud (Bullish): Indicates the dominant trend is up, suggesting dynamic support for price action.
Red Cloud (Bearish): Indicates the dominant trend is down, suggesting dynamic resistance.
The thickness and slope of the cloud are key indicators of trend strength.
MA Crossover Signal (Blue/Purple):
Buy Signal: When the faster Purple MA (P6=10) crosses above the slower Blue MA (P5=50).
Sell Signal: When the faster Purple MA (P6=10) crosses below the slower Blue MA (P5=50).
Price Action & Confirmation:
The most powerful signals occur when a MA Crossover is confirmed by price breaking out of the cloud in the same direction.
Price above the cloud and MA crossover to the upside suggests a strong buy entry.
Disclaimer: This tool is intended for analysis and decision-making support. It is not financial advice. Always use stop-loss orders and manage your risk accordingly.


Smart Money Concepts Pro – OB, FVG, Liquidity + Trade SetupsThis script is a complete Smart Money Concepts (SMC) toolkit designed for traders who want clean and actionable charts without clutter.
It combines the most important institutional concepts into one indicator:
Order Blocks (OB): auto-detection of bullish and bearish order blocks with mitigation tracking, merging and TTL (time-to-live).
Fair Value Gaps (FVG): automatic gap recognition with size filters, mitigation tracking and lifetime control.
Liquidity Pools (EQH/EQL): equal highs and equal lows marked with tolerance (ATR-based or fixed).
Break of Structure (BOS): up/down structure shifts plotted directly on the chart.
Multi-Timeframe (HTF): option to use higher timeframe data (e.g. H4, Daily) for stronger zones.
Trend Filter: show zones only in the direction of market structure.
Trade Setups: automatic signals for OB Retest + Trend setups, with entry, stop-loss and take-profit levels (custom R-R).
Flexible Zone Extension: choose between extending zones to the live bar or fixed box width for a cleaner look when scrolling.
Features
Fully customizable (pivot length, ATR filters, box width, TTL, zone colors)
Separate presets for Scalping, Intraday, Swing trading styles
Visual trade planning with entry/SL/TP lines and optional labels
Works across all markets (crypto, forex, indices, stocks)
How to use
Bias: identify overall direction (BOS + HTF zones).
Wait: for price to return to an unmitigated OB or FVG.
Entry: take the setup signal (OB retest + trend filter).
Risk: stop-loss at opposite OB boundary.
Target: TP based on chosen R-R multiple (default 2R).
⚡ Whether you scalp short-term moves or swing trade HTF zones, this indicator gives you a clear institutional edge in spotting supply/demand imbalances and high-probability setups.

Smart Weekly Lines — Clean & Scroll-Proof (Pine v6)Because your chart deserves structure. Elegant weekly dividers that stay aligned, scroll smoothly, and project future weeks using your wished UTC offset.
Smart Weekly Lines draws precise, full-height vertical lines marking each new week — perfectly aligned to your local UTC offset. It stays clean, smooth, and consistent no matter how far you scroll.
Features
• Accurate weekly boundaries based on your local UTC offset (supports half-hour zones like India +5.5)
• Clean, full-height lines that never cut off with zoom or scroll
• Adjustable color, opacity, width, and style (solid, dashed, dotted)
• Future week projection for planning and alignment
• Optional visibility: show only on Daily and Intraday charts
Works with any market — stocks, crypto, forex, or futures.
Built for traders who value clarity, structure, and precision.
Developed collaboratively with the assistance of ChatGPT under my direction and testing.

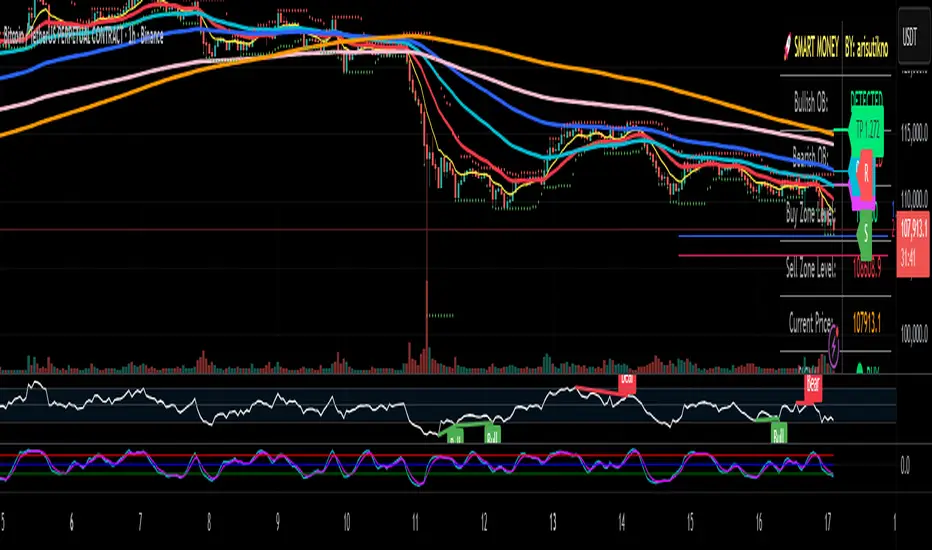
Smart Money Panel By: arisutiknoKEY FEATURES:
✅ Smart Money Detection - Automatic Order Blocks Detection
✅ Full Customization - All colors can be customized
✅ Clean Panel Design - Professional and informative look
✅ Real-time Signals - Actionable trading signals
✅ Multiple Signal Types - BUY/SELL AT OB, NEAR ZONE, WAITING
✅ Custom Signal Colors - Signal colors can be set separately
Makes it easier to make decisions. Good Luck Brooo
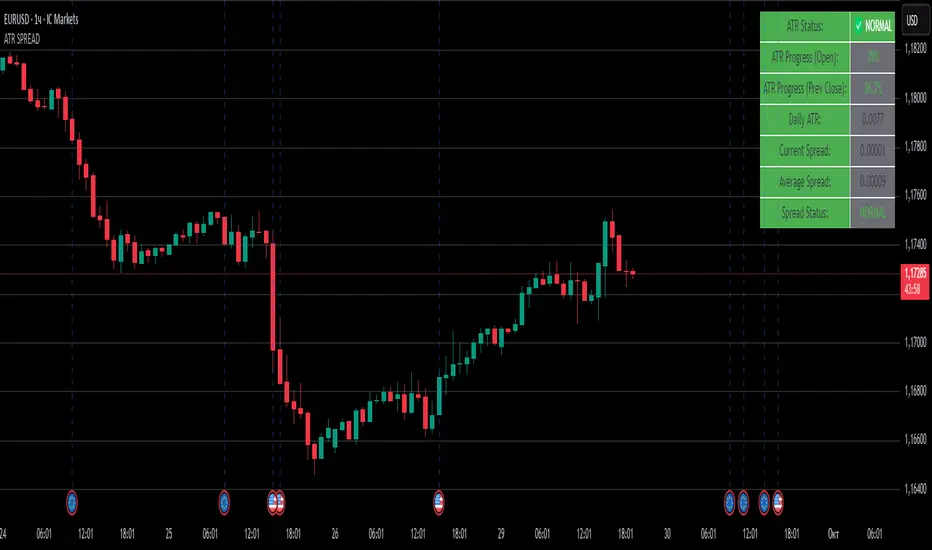
ATR SPREADThis is a comprehensive ATR SPREAD indicator for TradingView that combines volatility monitoring with spread analysis. Here's what it does and why it's useful:
Core Functionality
ATR Progress Tracking:
Monitors how much of the daily ATR (Average True Range) has been "consumed" during the current trading day
Calculates progress from two reference points: day's open and previous day's close
Displays progress as percentages or absolute values
Provides color-coded visual feedback (green → yellow → orange → red) based on ATR consumption levels
Spread Monitoring with Advanced Filtering:
Tracks current market spreads using multiple methods (minute high-low ranges, tick-to-tick differences)
Calculates rolling average spread to establish baseline conditions
Implements sophisticated filtering to exclude anomalous spread readings that could skew analysis
Key Features
Smart Filtering System:
Automatically filters out abnormal spreads during session opens
Excludes spreads that are too large relative to price or ATR
Removes outliers that exceed normal spread multiples
Maintains data quality for accurate analysis
Multi-Level Alert System:
ATR threshold alerts (50%, 80%, 100% consumption)
Customizable warning threshold (default 70%)
Spread expansion warnings and alerts
Session start notifications
Professional Dashboard:
Customizable information panel showing real-time metrics
Multiple positioning options and visual themes
Displays ATR status, progress percentages, current/average spreads
Color-coded status indicators for quick assessment
Trading Applications
Risk Management:
Helps traders understand how much daily volatility has been used up
Assists in position sizing based on remaining expected movement
Identifies periods of unusual market conditions
Market Condition Assessment:
Monitors liquidity conditions through spread analysis
Detects when spreads widen beyond normal levels
Filters out unreliable data during volatile periods
Entry/Exit Timing:
High ATR consumption may suggest limited further movement
Low ATR consumption early in the day might indicate potential for larger moves
Spread conditions help assess execution quality expectations
This indicator is particularly valuable for intraday traders, scalpers, and anyone who needs to monitor market microstructure conditions alongside volatility metrics. It provides a comprehensive view of both price movement potential (ATR) and execution environment quality (spreads) in a single, professional-grade tool.
Smart Money Flow Index (SMFI) - This tool is useful for comparing price action with underlying money flow and spotting where smart money may be entering or exiting the market.

Smart Bar Coloring: Tight Closes & Volume BreakoutsAdvanced Bar Coloring Indicator for Price Action and Volume Analysis
This sophisticated indicator automatically colors price bars based on two key market conditions: tight closing ranges and significant volume activity, helping traders quickly identify consolidation periods and potential breakout setups.
Key Features:
Tight Close Detection:
ATR-Based Analysis: Uses 14-period ATR to define "tight" price movement
Dual-Bar Confirmation: Requires both current and previous bar to have closing ranges ≤ 20% of ATR
Consolidation Identification: Highlights periods of reduced volatility that often precede significant moves
Customizable Color: Default amber/orange highlighting for easy visual identification
Volume Breakout Detection:
Multi-Criteria Volume Analysis: Triggers when volume exceeds any of three thresholds:
150% of 20-period volume SMA
150% of recent 3-bar average volume
150% of 50-period volume SMA
Price Action Filter: Requires bullish price action (close > previous close OR close in upper 75% of range)
Smart Volume Handling: Automatically detects and works only with instruments that have volume data
Customizable Color: Default teal highlighting for volume-driven moves
Technical Analysis Applications:
Consolidation Patterns: Identify tight trading ranges before potential breakouts
Volume Confirmation: Spot high-volume moves with supportive price action
Entry Timing: Use tight closes to identify potential accumulation zones
Breakout Validation: Volume-colored bars confirm legitimate breakout attempts
Risk Management: Tight closes often indicate lower immediate volatility
How to Use:
Amber/Orange Bars: Indicate tight closing ranges - potential accumulation or consolidation
Teal Bars: Show significant volume with bullish price action - potential breakout confirmation
Normal Bars: Standard market conditions without special highlighting
Pattern Recognition: Look for clusters of tight closes followed by volume breakouts
Technical Requirements:
Works on any timeframe
Automatically adapts to instruments with or without volume data
Compatible with all chart types and drawing tools

Smart Wick AnalyzerSmart Wick Analyzer (SWA)
Purpose: Highlight potential liquidity‑grab candles (long wicks) and turn them into actionable, rule‑based buy/sell signals with trend, volume, and cooldown filters.
Type: Indicator (not a strategy). Educational tool to contextualize wick events.
🧠 What This Script Does
SWA looks for candles where the wick is large relative to its body—a common signature of liquidity sweeps / rejection. It then adds three confirmations before marking a trade signal:
1. Wick Event
• Upper‑wick event (possible rejection from above)
• Lower‑wick event (possible rejection from below)
• Condition: wick length > body × Wick‑to‑Body Ratio
2. Context Filters
• Trend filter : closing price vs. SMA of lookbackBars
• Volume filter : current volume vs. average volume × volumeThreshold
3. Signal Hygiene
• Cooldown : prevents clustering; a minimum number of bars must pass before a new signal is allowed.
If a candle passes these checks:
• Buy Signal (triangle up): long lower wick + price above SMA + relative‑high volume + cooldown passed
• Sell Signal (triangle down): long upper wick + price below SMA + relative‑high volume + cooldown passed
The signal candle is also bar‑colored black for quick visual focus.
⸻
✳️ What the Dotted Lines Mean (including the green one)
On every signal bar the script draws two dotted horizontal levels, extended to the right:
• Open line of the signal candle
• Close line of the signal candle
• They use the signal color: green for Buy, red for Sell.
How to interpret (example: green = Buy signal):
• The green dotted close line represents the momentum validation level. If subsequent candles close above this line, it indicates follow‑through after the wick rejection (buyers defended into the close).
• The green dotted open line is a risk context / invalidation reference. If price falls back below it soon after the signal, the wick event may have failed or devolved into chop.
In your annotated chart: the candle initially looked constructive (“closing above could be positive momentum”), but later price failed and rotated down—hence a sell signal interpreted when an upper‑wick event occurred under down‑trend conditions.
⸻
⚙️ Inputs & What They Control
• Wick‑to‑Body Ratio (wickThreshold): how “extreme” a wick must be to count as a liquidity‑grab.
• Lookback Period (lookbackBars):
• SMA period for trend context
• Volume MA for relative‑volume check
• Volume Multiplier (volumeThreshold): strengthens/loosens volume confirmation.
• Cooldown Bars (cooldownBars): minimum spacing between consecutive signals.
• Enable Alerts (showAlerts): turns on alert conditions.
⸻
🔔 Alerts (exact titles)
• “SWA Buy Alert” — potential reversal / Buy signal detected
• “SWA Sell Alert” — potential reversal / Sell signal detected
⸻
📌 How to Use (practical guide)
1. Scan for the black‑colored signal candle and its dotted lines.
2. For Buy signals (green): Prefer continuation if price closes above the green close line within the next few bars. Manage risk using the open line or your own level.
3. For Sell signals (red): Prefer continuation if price closes below the red close line.
4. Avoid chasing during low‑volume / counter‑trend signals; the filters help, but structure (HTF trend, S/R, session context) still matters.
5. Use the cooldown to reduce noise on fast time frames.
⸻
✅ Why This Isn’t Just “Another Wick Indicator”
• The script does not flag every long‑wick; it requires trend alignment and relative volume to suggest participation.
• The two reference lines (open/close) provide post‑signal state tracking—a simple, visual framework to judge follow‑through vs. failure without additional tools.
• Cooldown logic discourages clustered, low‑quality repeats around the same zone.
⸻
⚠️ Notes & Limitations
• Works across markets/time frames, but wick behavior varies by instrument and session. Parameters may need adjustment.
• Signals are contextual, not guarantees. Consolidation and news spikes can invalidate wick reads.
• This indicator is not a strategy; it does not backtest performance on its own.
⸻
📄 Disclaimer
This tool is for educational purposes only and should be combined with personal analysis and risk management. Markets are uncertain; past behavior does not guarantee future results.

Smart Adaptive MACDAn advanced MACD variant that dynamically adapts to market volatility using ATR-based scaling.
Key Features:
Volatility-sensitive MACD and Signal lengths
Optional smoothed MACD line
Dynamic histogram heatmap (strong vs. weak momentum)
Built-in Regular and Hidden Divergence detection
Clear visual signals via solid (regular) and dashed (hidden) divergence lines
What makes this different:
Unlike traditional MACD indicators with fixed-length settings, this version adapts in real time
to changing volatility conditions. It shortens during high-momentum environments for faster
reaction, and lengthens during low-volatility phases to reduce noise. This allows better
alignment with market behavior and cleaner momentum signals.
Divergence Detection – How It Works
The Smart Adaptive MACD detects both regular and hidden divergences by comparing price action with the smoothed MACD line. It uses recent pivot highs and lows to evaluate divergence and draws lines on the chart when conditions are met.
Regular Divergence Detection
This type of divergence signals potential reversals. It occurs when the price moves in one
direction while the MACD moves in the opposite.
Bullish Regular Divergence:
Price makes lower lows, but MACD makes higher lows.
Result: A solid green line is plotted beneath the MACD curve.
Bearish Regular Divergence:
Price makes higher highs, but MACD makes lower highs.
Result: A solid red line is plotted above the MACD curve.
Hidden Divergence Detection
This type of divergence signals trend continuation. It occurs when price pulls back slightly,
but the MACD shows deeper movement in the opposite direction.
Bullish Hidden Divergence:
Price makes higher lows, but MACD makes lower lows.
Result: A dashed green line is plotted below the MACD curve.
Bearish Hidden Divergence:
Price makes lower highs, but MACD makes higher highs.
Result: A dashed red line is plotted above the MACD curve.
How to Use:
This tool is best used alongside price structure, key support/resistance levels, or as a
secondary confirmation for your trend or reversal strategy. It is designed to enhance your
interpretation of market momentum and divergence without needing extra chart clutter.
Disclaimer:
This script is provided for educational and informational purposes only. It is not intended as
financial advice or a recommendation to buy or sell any asset. Always conduct your own
research and consult with a licensed financial advisor before making trading decisions. Use
at your own risk.
License:
This script is published under the Mozilla Public License 2.0 and is fully open-source.
Built by AresIQ | 2025
Smart Breakout with ATR Stop-LossThe Smart Breakout indicator combines a classic 20-day Donchian channel breakout with a tight trailing stop, drawing green lines and “ENTRY” labels at the bar after a valid breakout, and red lines and “EXIT” label at the bar after a stop-loss breach.
By default it uses the chart’s timeframe to compute ATR and stops, but you can flip on Daily lock to freeze both ATR and price reads at the daily resolution—so your stops stay the same whether you view at 1s, 15 m, 4h or lower frequency bars.
Key features:
20-day Donchian breakout: entry when price closes above the highest high of the previous 20 bars
2 × ATR(14) trailing stop: initialized at entry and raised only when the new (close – 2 × ATR) exceeds the prior stop
Daily lock option: Ensures all ATR and close values are calculated on the daily timeframe, keeping stop levels consistent across resolutions

Smart Grid Scalping (Pullback) Strategy[BullByte]The Smart Grid Scalping (Pullback) Strategy is a high-frequency trading strategy designed for short-term traders who seek to capitalize on market pullbacks. This strategy utilizes a dynamic ATR-based grid system to define optimal entry points, ensuring precise trade execution. It integrates volatility filtering and an RSI-based confirmation mechanism to enhance signal accuracy and reduce false entries.
This strategy is specifically optimized for scalping by dynamically adjusting trade levels based on current market conditions. The grid-based system helps capture retracement opportunities while maintaining strict trade management through predefined profit targets and trailing stop-loss mechanisms.
Key Features :
1. ATR-Based Grid System :
- Uses a 10-period ATR to dynamically calculate grid levels for entry points.
- Prevents chasing trades by ensuring price has reached key levels before executing entries.
2. No Trade Zone Protection :
- Avoids low-volatility zones where price action is indecisive.
- Ensures only high-momentum trades are executed to improve success rate.
3. RSI-Based Entry Confirmation :
- Long trades are triggered when RSI is below 30 (oversold) and price is in the lower grid zone.
- Short trades are triggered when RSI is above 70 (overbought) and price is in the upper grid zone.
4. Automated Trade Execution :
- Long Entry: Triggered when price drops below the first grid level with sufficient volatility.
- Short Entry: Triggered when price exceeds the highest grid level with sufficient volatility.
5. Take Profit & Trailing Stop :
- Profit target set at a customizable percentage (default 0.2%).
- Adaptive trailing stop mechanism using ATR to lock in profits while minimizing premature exits.
6. Visual Trade Annotations :
- Clearly labeled "LONG" and "SHORT" markers appear at trade entries for better visualization.
- Grid levels are plotted dynamically to aid decision-making.
Strategy Logic :
- The script first calculates the ATR-based grid levels and ensures price action has sufficient volatility before allowing trades.
- An additional RSI filter is used to ensure trades are taken at ideal market conditions.
- Once a trade is executed, the script implements a trailing stop and predefined take profit to maximize gains while reducing risks.
---
Disclaimer :
Risk Warning :
This strategy is provided for educational and informational purposes only. Trading involves significant risk, and past performance is not indicative of future results. Users are advised to conduct their own due diligence and risk management before using this strategy in live trading.
The developer and publisher of this script are not responsible for any financial losses incurred by the use of this strategy. Market conditions, slippage, and execution quality can affect real-world trading outcomes.
Use this script at your own discretion and always trade responsibly.

Smart Money Pivot Strategy [Jason Kasei]This strategy is designed to identify key pivot points (Pivot High and Pivot Low) in the market and leverage the "Smart Money" concept to capture price breakout opportunities. It supports both long and short trades, offering customizable stop-loss (SL) and take-profit (TP) settings, while visually plotting pivot points and breakout signals on the chart.
Core Features
Pivot Point Detection:
Utilizes ta.pivothigh and ta.pivotlow functions to detect the highest (Pivot High) and lowest (Pivot Low) points within a specified period (default: 20 bars).
Trading Signals:
Long Signal: Triggered when the price breaks above a previous Pivot High, indicating a potential uptrend.
Short Signal: Triggered when the price breaks below a previous Pivot Low, indicating a potential downtrend.
How It Works
Detects Pivot High (PH) and Pivot Low (PL) over the specified period and records their price and time.
Triggers a long entry when the price breaks above a Pivot High and a short entry when it falls below a Pivot Low.
Sets exit conditions automatically based on predefined SL and TP percentages after entry.
Plots breakout points and levels on the chart for analysis.
Considerations
The strategy relies on accurate pivot point detection; adjust the period parameter based on market volatility.
In highly volatile markets, consider widening the stop loss to avoid frequent triggering.
Combine with other indicators or analysis methods to validate signals and avoid blind trading.
