Elliott Wave AnalysisInitially, Elliott wave analysis is designed to simplify and increase the objectivity of graph analysis using the Elliott method. Probably, this indicator can be successfully used in trading without knowing the Elliott method.
The indicator is based on a supertrend. Supertrends are built in accordance with the Fibonacci grid. The degree of waves in the indicator settings corresponds to a 1-hour timeframe - this is the main mode of working with the indicator. I also recommend using weekly (for evaluating large movements) and 1-minute timeframes.
When using other timeframes, the baseline of the indicator will correspond to:
1 min-Submicro
5 minutes-Micro
15 minutes-Subminuette
1 hour-Minuette
4 hours-Minute
Day-Minor
Week-Intermediate
Month-Primary
Those who are well versed in the Elliott method can see that the waves fall on the indicator almost perfectly. To demonstrate this, I put the markup on the graph
Recherche dans les scripts pour "supertrend"

Opening Range HarmoniX
This is an all-in-one, modular toolkit designed for intraday traders, especially those focusing on the New York session. It combines a fully customizable Opening Range (OR) with a suite of essential indicators (Moving Average, VWAP, Supertrend, and Pivots) to provide a complete and clean view of the market.
All modules (indicators) can be toggled on or off individually, and the entire settings menu is fully translated in both English and Farsi (Persian).
Key Features
1. Customizable Opening Range (OR):
Range Timeframe: Set your OR timeframe (5, 15, or 30 min).
Precise Start Time: Define the exact start hour and minute (default 9:30 NY Time).
Key Levels: Includes OR High, OR Low, and a crucial Mid Line for price equilibrium.
Extension Method: Choose how lines extend: "Until NY Session Close" (16:00) or for a fixed "Number of Bars".
Full Styling: Complete control over color, width, and line style (solid, dashed, dotted) for all levels.
2. Dynamic Day Label:
Automatically displays the day of the week (in English or Farsi) and the selected OR timeframe (e.g., "Monday - 15m") at the start of the range.
3. Built-in Indicator Suite (All Toggleable):
Moving Average (MA):
Multiple Types: Choose from SMA, EMA, WMA, HMA, or VWMA.
Dynamic Coloring: MA line color automatically changes based on its upward (Uptrend) or downward (Downtrend) slope.
VWAP (Daily):
Features similar dynamic coloring to quickly identify the intraday trend bias.
Supertrend:
A classic trend-following tool with customizable ATR Period and Factor.
Dynamic trend-based coloring (uptrend/downtrend).
Pivot Points:
Classic high/low pivots with customizable lookback periods (left/right) to spot key turning points in the market.
💡 Core Concept
Use the Opening Range levels (High, Low, and Mid) as primary support/resistance and to establish the bias for the day. Then, use the additional indicators (MA, VWAP, Supertrend) to confirm trend direction and identify entry/exit opportunities in relation to the OR levels.

Volume Imbalances & Gann's Square IndicatorVolume Imbalances & Gann's Square Indicator:
This script is a comprehensive trading toolkit designed to help intraday and swing traders identify high-probability trade setups by combining the strengths of Gann's Theory, price-volume analysis, and multi-indicator signal confirmation in one indicator.
Key Features and Their Roles:
Gann’s S/R Levels:
Calculates main and auxiliary support/resistance lines using Gann’s “odd square” approach based on the current price. Levels are projected historically and into the future to clearly visualize critical zones for potential reversals and breakouts.
Volume*Price (VP) Spike Table:
Detects and displays real-time buy and sell volume spikes above a configurable threshold, highlighting large market transactions. The on-chart table summarizes recent major spikes with time and price for context, resetting every session.
Multi-EMA & VWAP Logic:
Integrates three customizable EMAs, VWAP, and Supertrend. Users can toggle signals from EMA crossovers, price-VWAP positioning, or Supertrend direction to match their preferred trading style and filter signals for trend or mean-reversion strategies.
Buy/Sell Labels and Signal Source Control:
Clearly plots buy/sell marker labels with customizable text, color, and size, based on the chosen signal source (EMA cross, VWAP, Supertrend). Labels offset from candles for easy visibility.
First Candle Range & Session Tools:
Plots the initial range (high, low, and midpoint) of a user-defined session, helping visualize and trade session breakouts or range retests. Session logic ensures all statistical tables and levels reset at session start.
Automated Risk/Reward Table:
Instantly calculates capital allocation, stop-loss, potential quantity, and two profit targets for both long and short trades. Helps traders plan size and risk per trade in compliance with risk management principles.
Highest/Lowest VP Markers:
Highlights the day’s peak and trough volume*price values for context on institutional buying or selling pressure.
Previous Day Range Plotter:
Draws previous session’s high/low levels for reliable reference zones and potential trade targets.
Integration Rationale:
All components are thoughtfully integrated to provide a holistic decision-making workflow:
Volume/price spikes act as momentum or liquidity signals.
Gann levels define the “where” for reaction or breakout trades.
Signal logics (EMA/VWAP/Supertrend) answer the “when,” enabling higher-confidence entries only when multiple conditions align.
How to Use:
Select your preferred inputs for EMAs, VWAP, and risk settings in the panel.
Analyze the chart for signals where buy/sell labels align with fresh VP spikes near Gann or previous day support/resistance.
Use the risk/reward table for strict money management.
Reference spike tables and session range for contextual confirmation.
Visuals and Chart Guidance:
The script displays only essential tables, lines, and labels described above.
All chart elements are explained in this description—no external scripts needed for interpretation.
Each table and marker is linked to actionable trading logic, eliminating clutter.
Closed-source Explanation:
The indicator uses session-based calculations, real-time data arrays, and proprietary math to unify Gann theory logic, large transaction detection, and multi-indicator confirmation. All major trade conditions have alert signals for ready integration with TradingView’s alert system.

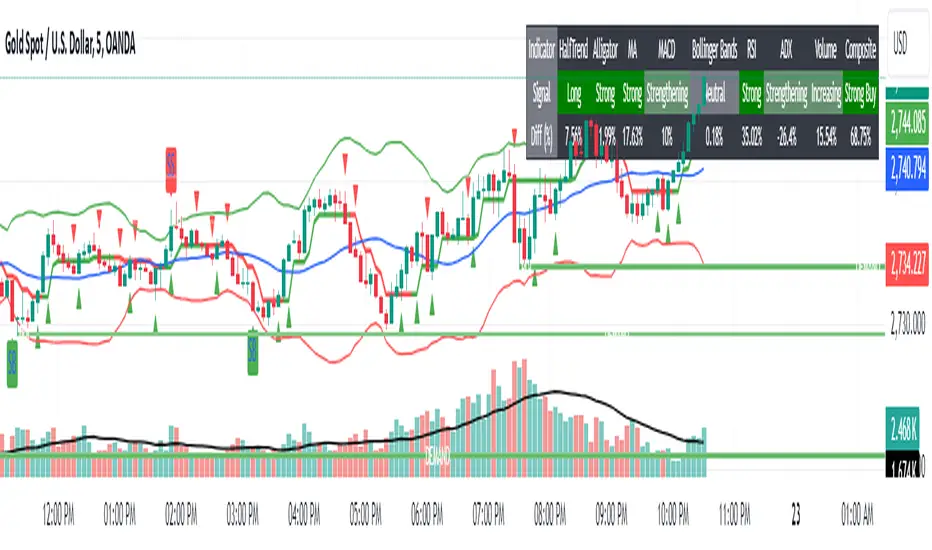
Trend, Momentum and Price value analysis Extended [deepakks444]Trend, Momentum, and Price Value Analysis Extended
This Pine Script™ indicator is designed to offer traders a comprehensive overview of price trends, momentum, and market strength through the use of several widely-recognized technical analysis tools. The indicator integrates multiple signals and plots directly on the chart, as well as a customizable table to help visually organize and interpret the data. Here’s an overview of the key features included:
Key Features:
VWAP (Volume-Weighted Average Price): Calculates the average price weighted by volume to give insight into whether the price is above or below the market's fair value.
Alligator Indicator: Uses a combination of three moving averages (jaw, teeth, and lips) to help identify trending conditions.
Supertrend: A trend-following indicator that signals potential buy or sell opportunities based on price movements relative to a dynamically calculated support/resistance line.
20-period Moving Average (MA): A basic moving average to smooth out price data and highlight the underlying trend.
MACD (Moving Average Convergence Divergence): Helps identify changes in the strength, direction, and momentum of a trend.
Volume with Moving Average: Compares current volume against its moving average to identify potential volume spikes.
RSI (Relative Strength Index): Measures the speed and change of price movements, signaling overbought or oversold conditions.
ADX (Average Directional Index): An indicator used to quantify trend strength, helping traders determine whether the market is trending or in a range.
Pivot Points: Calculates daily pivot points and identifies support and resistance levels based on price movements.
Bollinger Bands: A volatility indicator that uses standard deviation to highlight potential overbought or oversold conditions.
Customization Options:
Modify the length of the price and volume moving averages.
Adjust RSI thresholds for buy and sell signals.
Set the thresholds for ADX to differentiate between weak, average, and strong trends.
Toggle the visibility of the 20-period MA and Supertrend on the chart.
Choose to display the percentage difference between the current price and indicator values in the table.
Table Display:
The indicator includes a table that summarizes the status of all signals, showing:
Signal (Buy/Sell/Neutral): Based on each indicator's interpretation of price action.
Percentage Difference: Optional display of how far the price is from the reference level (e.g., the difference between the price and VWAP, Supertrend line, or Moving Average).
The table allows traders to quickly assess the current market conditions across several indicators in one place, making it easier to gauge overall market sentiment.
Signal Logic:
This indicator uses a scoring system to calculate the percentage of indicators signaling a buy or sell. If the buy or sell score reaches 70% or higher, the indicator will plot buy or sell signals on the chart. The combined signal logic is displayed in the table as "Buy," "Sell," or "No Signal," based on the majority of the contributing indicators.
Intended Use:
This tool is designed to assist traders in their technical analysis by consolidating multiple popular indicators into one script. It provides a clear visual representation of various market signals, helping traders to make informed decisions about potential trade entries and exits. However, this indicator is for educational purposes and should not be used as financial advice. Traders should always use proper risk management and conduct their own research before making any trading decisions.
Disclaimer: This script is for educational purposes only and does not constitute financial advice. Trading involves risk, and past performance of an indicator does not guarantee future results. Please use it alongside proper risk management practices.
Bank Nifty ScalpingThis indicator is designed for scalping purposes.
Users have the option to input the desired source and enable or disable the following indicators:
Multiple EMA (Exponential moving average)
Simultaneously displays multiple moving averages to quickly identify shifts in momentum and obtain confirmation from slower-moving averages.
By default, the EMA display settings are configured to show the 20-day EMA and the 200-day EMA. However, users have the flexibility to modify the display settings according to their preferences. This means that users can customize the indicator to show the EMA values of their choice, such as EMA 50 and EMA 100.
VWAP ( Volume weighted average price )
Default value is set to ‘hl2’
A bullish trend is indicated when the price is above the Volume Weighted Average Price (VWAP), while a bearish trend is indicated when the price is below the VWAP.
VWMA ( Volume weighted moving average )
In the VWMA (Volume Weighted Moving Average) indicator, a default value of 20 is used. If the price is higher than the VWMA, it typically indicates a bullish trend. Conversely, if the price is lower than the VWMA, it suggests a bearish trend. The VWMA takes into account both price and volume, providing a weighted average that can help identify shifts in market sentiment.
Multiple SuperTrends
Default value is 10 and 2 / 10 and 3
A bullish trend is identified when the price is above the SuperTrend indicator, whereas a bearish trend is observed when the price is below the SuperTrend indicator.
Camarilla Pivot Points (Level 3 and 4 only)
Levels 3 and 4 serve as crucial support and resistance levels, acting as the final line of defense against strong trends. These levels are expected to generate reversals, where price often changes direction.
CPR ( Central Pivot Points)
The Daily Central Pivot Point Indicator is a popular tool used in technical analysis. It calculates several levels based on the previous day's high, low, and closing prices.
Strong Volume
The user has the ability to set the average volume for Nifty and BankNifty indices to calculate strong volume.
Elder Impulse System
The Impulse System, developed by Alexander Elder and discussed in his book "New Trading for a Living," is a censorship trading system designed to determine whether a trade should be allowed or prohibited. Additionally, it can be used to identify when a trend is starting to weaken. The Impulse System relies on the following factors:
1. Slope of a Fast Exponential Moving Average (EMA): The fast EMA's slope reflects the price's inertia or momentum.
2. Slope of the Moving Average Convergence Divergence (MACD): The MACD's slope indicates the strength or power of the price movement.
Based on these factors, the Impulse System categorizes candles or price bars into three colors:
* Green Candle: When both the fast EMA and MACD are rising, indicating upward momentum.
* Red Candle: When both the fast EMA and MACD are declining, suggesting downward momentum.
* Blue Candle: In all other cases where the conditions for green or red candles are not met, representing a neutral or uncertain market condition.
By applying the Impulse System, traders can gain insights into the market trend, its strength, and potential shifts in momentum, helping them make informed trading decisions.
Happy Trading

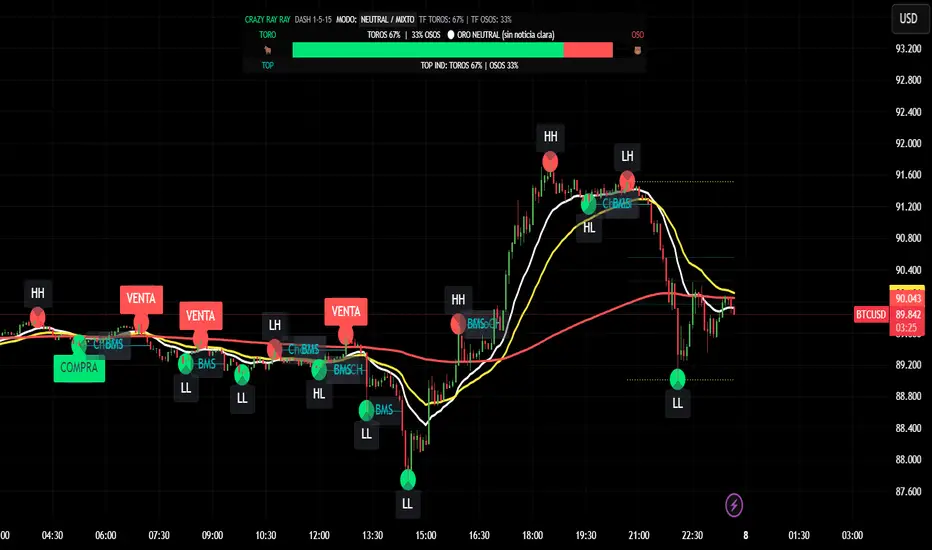
CRR - GANAEMAs on the chart (visual trend)
EMA 15 (white), 30 (yellow), 200 (red).
2️⃣ DASH Engine 1m–5m–15m (+ 1H and 1D)
For each TF (1m, 5m, 15m) it calculates a bull/bear score using:
EMA structure (15, 30, 50, 100, 200).
MACD.
RSI.
Relationship with EMA 30 and VWAP.
FVG in favor.
ATR change (volatility **increasing**).
From this it derives:
t1 (1m), t2 (5m), t3 (15m),
t4 (1H) and t5 (1D) (only for EMA200).
It detects:
ALL BULL → “BULLISH - BUYS ONLY”.
ALL BEAR → “BEARISH - SELLS ONLY”.
Otherwise → “NEUTRAL / MIXED”.
In addition:
Calculates BULL TF vs BEAR TF (%) between 1m–5m–15m.
Displays a visual bar 🐂🟩 vs 🐻🟥.
3️⃣ GOLD News (manual)
Special bar that says:
Neutral
BUY (positive)
SELL (negative)
Paints the HUD with color according to the news you select.
4️⃣ NO RETRACEMENT Alerts (beast mode 💣)
Very strict conditions using the 5 TFs:
BUY NO RETRACEMENT if:
4 or more TFs in bull mode (bullTF_all >= 4),
1m ultra bull (EMA bull, RSI>60, MACD bull, high volume, price above EMA15 and VWAP, FVG ≥ 0).
SELL NO RETRACEMENT is the same but bearish.
Creates alerts:
CRR BUY NO RETRACEMENT
CRR SELL NO RETRACEMENT
5️⃣ PRO LITE Patterns: Double Top / Double Bottom
Detects double tops and double bottoms with:
Minimum bar distance.
Tolerance in %. Optional filters:
MACD, RSI, ATR (volatility), volume, FVG.
If everything aligns:
Plots SELL at double top.
Plots BUY at double bottom.
6️⃣ TOP Indicators Block (SMI + WaveTrend + Supertrend)
SMI (momentum), WaveTrend, and Supertrend:
Counts which are in bull mode and which are in bear mode.
Displays:
TOP IND: BULLS XX% | BEARS YY%.
7️⃣ Integrated Internal SMC Module
Structure HH, LH, HL, LL.
BMS (break of structure) and ChoCH (change of character).
Filter with ATR + volume + MACD + gaps.
Internal Fibonacci of the last range (38.2, 50, 61.8).
Dotted yellow lines of the current range (swing high/low).
🧠 In short:
It's your command center for XAUUSD:
Global mode (buy only / sell only / mixed),
% of timeframes favoring bulls/bears,
gold news,
no-lag alerts,
filtered double top/bottom,
TOP indicators,
and complete SMC (structure + BMS/ChoCH + Fibonacci + range)...
all integrated into a single CRAZY RAY RAY HUD
Ultimate Trend System — FINAL MASTER EDITIONUltimate Trend System — FINAL MASTER EDITION
A complete, multi‑layered trend‑detection engine designed for precision execution and clarity.
This final edition fuses trend, momentum, volatility, and filtering into one symmetrical logic system — enabling traders to instantly visualize directional strength and avoid false signals during choppy markets.
🔹 System Overview
The Ultimate Trend System consolidates several classic trading frameworks into a unified model.
It dynamically generates BUY, SELL, and STOP tags directly on the chart — each derived from clean, interlinked conditions that measure both momentum and structure.
In addition, a built‑in information panel summarizes live indicator states for quick decision‑making without checking multiple indicators.
⚙️ Core Logic Components
SMA (20‑period): Identifies trend slope; rising → bullish bias, falling → bearish bias.
VWAP: Defines fair‑value position — Above, Below, or Inside volume‑weighted average price.
QQE‑Lite (RSI): Tracks internal momentum shifts by comparing RSI to its EMA smoothing.
ATR Strength: Classifies current volatility regime as Turbo, Strong, or Weak.
SuperTrend: Confirms structural trend direction using an ATR‑based trailing model.
Choppiness Filter: Suppresses signals when short‑term volatility contracts or range noise dominates.
Fakeout Detection: Prevents false triggers after deceptive breakouts or reversals.
🧩 Execution Logic
BUY Signal: All major trend engines align bullishly, with clean structure and momentum.
SELL Signal: All major engines align bearishly, with clean structure and momentum.
STOP Phase: Appears once per cycle to mark neutral or transition zones; automatically locks further stops until a new entry signal is confirmed.
🟩🟥 Visual Elements
Green Labels: Confirmed bullish entry (BUY).
Red Labels: Confirmed bearish entry (SELL).
Yellow Labels: STOP state (trend exhaustion or consolidation).
Panel: Displays live readings for VWAP, SMA, QQE, ATR regime, and SuperTrend direction.
🧠 Design Philosophy
Built for simplicity, speed, and precision — the Final Master Edition strips away noise without losing analytical depth.
It can serve as a standalone trend system or foundation layer for more advanced frameworks like auto‑execution or multi‑engine HUDs.

Indicator Overview主力籌碼預判買賣力道 (JUMBO)Pro+ 2.0主力預判買賣力道 Pro+ 是一個先進的多維度交易分析系統,專為台灣股市投資者設計。本指標整合了趨勢、成交量、動量、價格位置和波動率五大維度,通過加權評分系統生成綜合的「Power指標」,精準預判主力資金動向。
🔧 核心技術架構
1. 多維度評分系統
趨勢維度 (30%):雙EMA系統 + MACD + ADX趨勢強度
成交量維度 (25%):OBV能量潮 + 成交量比率分析
動量維度 (20%):RSI + MFI資金流量指標
價格位置維度 (20%):VWAP + 布林通道位置分析
波動率維度 (5%):ATR波動率調整
2. 多重確認機制
趨勢確認:EMA金叉/死叉 + 超級趨勢方向
成交量確認:成交量脈衝檢測 + OBV趨勢確認
動量確認:RSI超買超賣 + MFI資金流向
位置確認:布林通道位置 + VWAP相對位置
📊 主要功能特色
訊號系統
主力佈局訊號 🟥
趨勢多頭確認 + Power > 35
成交量放大 + 動量指標多頭
RSI未超買 + 價格突破基準
主力出貨訊號 🟩
趨勢空頭確認 + Power < -35
成交量異常 + 動量指標空頭
RSI未超賣 + 價格跌破基準
Power交叉訊號 🟠🔵
黃金交叉:Power線向上穿越Power MA線
死亡交叉:Power線向下穿越Power MA線
視覺化系統
台灣股市顏色標準:紅色上漲/多頭,綠色下跌/空頭
多層級K線著色:強力訊號→普通訊號→偏多偏空→盤整
智能資訊面板:實時顯示8大關鍵指標狀態
⚙️ 參數設定說明
主要參數
EMA週期:13/55(短期/長期)
Power閾值:35(靈敏度調整)
成交量濾波:1.2倍(異常成交量檢測)
超級趨勢:10週期/3倍數(趨勢過濾)
進階參數
布林通道:20週期/2倍標準差
波動率設定:14週期ATR
動量指標:14週期RSI/MFI
🎯 交易應用策略
進場時機
強力買入:🔥標記 + Power黃金交叉
常規買入:紅色向上箭頭 + Power > 35
確認買入:多重條件同時滿足
出場時機
強力賣出:💧標記 + Power死亡交叉
常規賣出:綠色向下箭頭 + Power < -35
風險控制:趨勢反轉 + 動量減弱
風險管理
止損設定:ATR波動率參考
倉位控制:Power數值強度分級
訊號過濾:ADX趨勢強度確認
📈 指標優勢
高準確率:多重條件過濾,減少假訊號
及時性:領先指標預判主力動向
完整性:涵蓋技術分析主要維度
用戶友好:直觀的視覺化設計
自定義:參數可調適應不同交易風格
🎯 Indicator Overview
Main Force Prediction Buying/Selling Strength Pro+ is an advanced multi-dimensional trading analysis system specifically designed for Taiwan stock market investors. This indicator integrates five key dimensions: trend, volume, momentum, price position, and volatility, generating a comprehensive "Power Indicator" through a weighted scoring system to accurately predict institutional fund movements.
🔧 Core Technical Architecture
1. Multi-Dimensional Scoring System
Trend Dimension (30%): Dual EMA system + MACD + ADX trend strength
Volume Dimension (25%): OBV accumulation + Volume ratio analysis
Momentum Dimension (20%): RSI + MFI money flow index
Price Position Dimension (20%): VWAP + Bollinger Bands position analysis
Volatility Dimension (5%): ATR volatility adjustment
2. Multi-Confirmation Mechanism
Trend Confirmation: EMA golden/death cross + SuperTrend direction
Volume Confirmation: Volume spike detection + OBV trend confirmation
Momentum Confirmation: RSI overbought/oversold + MFI money flow
Position Confirmation: Bollinger Bands position + VWAP relative position
📊 Key Features
Signal System
Institutional Accumulation Signals 🟥
Bullish trend confirmation + Power > 35
Volume expansion + Momentum indicators bullish
RSI not overbought + Price breakthrough baseline
Institutional Distribution Signals 🟩
Bearish trend confirmation + Power < -35
Abnormal volume + Momentum indicators bearish
RSI not oversold + Price breakdown below baseline
Power Cross Signals 🟠🔵
Golden Cross: Power line crosses above Power MA line
Death Cross: Power line crosses below Power MA line
Visualization System
Taiwan Market Color Standard: Red for uptrend/bullish, Green for downtrend/bearish
Multi-level Candlestick Coloring: Strong signals → Regular signals → Bias signals → Consolidation
Smart Info Panel: Real-time display of 8 key indicator statuses
⚙️ Parameter Settings
Main Parameters
EMA Periods: 13/55 (Short-term/Long-term)
Power Threshold: 35 (Sensitivity adjustment)
Volume Filter: 1.2x (Abnormal volume detection)
SuperTrend: 10 period/3 multiplier (Trend filtering)
Advanced Parameters
Bollinger Bands: 20 period/2 standard deviations
Volatility Settings: 14 period ATR
Momentum Indicators: 14 period RSI/MFI
🎯 Trading Application Strategies
Entry Timing
Strong Buy: 🔥 Mark + Power Golden Cross
Regular Buy: Red upward arrow + Power > 35
Confirmed Buy: Multiple conditions simultaneously met
Exit Timing
Strong Sell: 💧 Mark + Power Death Cross
Regular Sell: Green downward arrow + Power < -35
Risk Control: Trend reversal + Momentum weakening
Risk Management
Stop Loss Setting: ATR volatility reference
Position Sizing: Power value strength grading
Signal Filtering: ADX trend strength confirmation
📈 Indicator Advantages
High Accuracy: Multiple condition filtering reduces false signals
Timeliness: Leading indicators predict institutional movements
Completeness: Covers main dimensions of technical analysis
User-Friendly: Intuitive visualization design
Customizable: Adjustable parameters adapt to different trading styles
🔍 Professional Usage Tips
Trend Confirmation: Use in conjunction with major trend direction
Volume Validation: Ensure volume confirms price movements
Risk Management: Always use appropriate position sizing
Timeframe Analysis: Apply across multiple timeframes for confirmation
Market Context: Consider overall market conditions and sector rotation
版本: Pro+ 2.0
適用市場: 台股、亞股、全球股市
最佳時間框架: 日線、4小時線、1小時線
開發者: JUMBO Trading System
更新日期: 2025版本

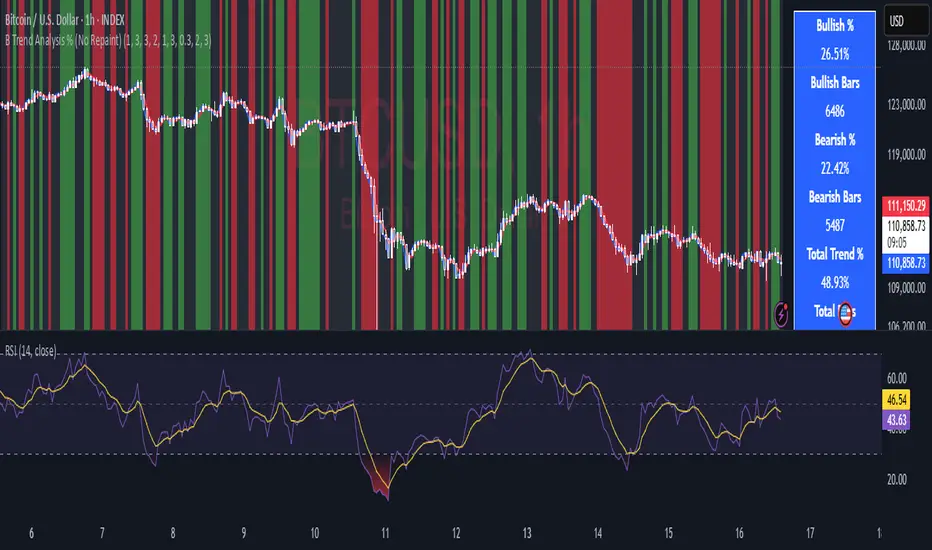
B Trend Analysis % (No Repaint)
Overview
B Trend Analysis % is a no-repaint indicator that identifies bullish, bearish, or mean-reverting market phases using confirmed (prior-bar) signals from SMA crossovers, ADX trend strength, Supertrend direction, and optional RSI filtering. It visualizes trends via background colors (green for bullish, red for bearish, gray for mean-reversion) and provides a stats table showing bullish/bearish percentages over the chart's history.
How It Works
-
SMA Crossover: Detects momentum shifts with short (default 1) vs. long (default 3) SMAs.
ADX Filter: Ensures strong trends (smoothed ADX > threshold, default 1).
Supertrend: Confirms direction using ATR-based bands (period 3, factor 0.3).
RSI (Optional): Filters extremes (oversold >30 for bull, overbought <70 for bear; period 2).
Trends require trendLookback (default 3) consecutive confirmed bars for reliability. Stats count only confirmed bars to avoid repainting.
Usage
- Apply to any timeframe/symbol for trend confirmation.
- Green background: Enter/hold longs; red: shorts; gray: Avoid trades (range-bound).
- Tune inputs: Shorten lengths for scalping; enable RSI for mean-reversion filters.
- Plots: Blue (short SMA), red (long SMA). Table shows % bullish/bearish and ADX strength.
- Best for volatile assets like crypto/forex; back test on clean price charts.
Key Features
- No repainting: Uses var state and prior-bar values ( ).
- Efficient: Lightweight calcs, no request .security() .
- Customizable: Advanced group for lookback (1-5 bars).
Protected Script Notice
This script is published as Protected to safeguard proprietary elements in the trend confirmation logic, including the custom consecutive-bar counter and smoothed ADX integration, which were developed through extensive back testing. While the core inputs and outputs are fully accessible for use, the exact implementation details are not viewable to prevent unauthorized replication. Users can still apply it to charts, customize visible parameters, and benefit from its no-repaint reliability. For collaboration or access requests, contact the author via Trading View messaging.
This is an original combination for clearer trend stats—fork and improve where possible!
AI-Powered ScalpMaster Pro [By TraderMan]🧠 AI-Powered ScalpMaster Pro How It Works
📊 What Is the Indicator and What Does It Do?
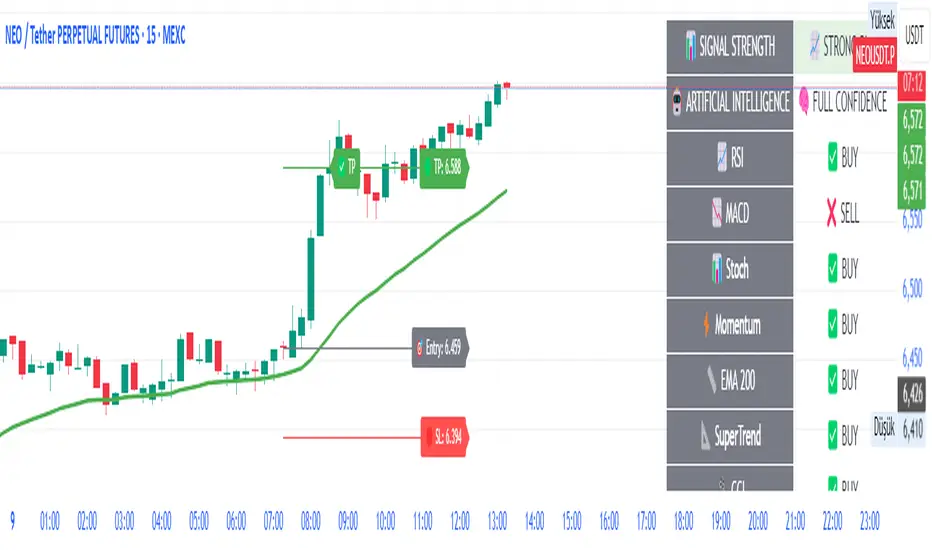
🧠 AI-Powered ScalpMaster Pro is a powerful technical analysis tool designed for scalping (short-term, fast-paced trading) in financial markets such as forex, crypto, or stocks. It combines multiple technical indicators (RSI, MACD, Stochastic, Momentum, EMA, SuperTrend, CCI, and OBV) to identify market trends and generate AI-driven buy (🟢) or sell (🔴) signals. The goal is to help traders seize profitable scalping opportunities with quick and precise decisions. 🚀
Key Features:
🧠 AI-Driven Logic: Analyzes signals from multiple indicators to produce reliable trend signals.
📈 Signal Strength: Displays buy (bull) and sell (bear) signal strength as percentages.
✅ Success Rate: Tracks the performance of the last 5 trades and calculates the success rate.
🎯 Entry, TP, and SL Levels: Automatically sets entry points, take profit (TP), and stop loss (SL) levels.
📏 EMA Zone: Analyzes price movement around the EMA 200 to confirm trend direction.
⚙️ How Does It Work?
The indicator uses a scoring system by combining the following technical indicators:
RSI (14): Evaluates whether the price is in overbought or oversold zones.
MACD (12, 26, 9): Analyzes trend direction and momentum.
Stochastic (%K): Measures the speed of price movement.
Momentum: Checks the price change over the last 10 bars.
EMA 200: Determines the long-term trend direction.
SuperTrend: Tracks trends based on volatility.
CCI (20): Measures price deviation from its normal range.
OBV ROC: Analyzes volume changes.
Each indicator generates a buy (bull) or sell (bear) signal. If 6 or more indicators align in the same direction (e.g., bullScore >= 6 for buy), the indicator produces a strong trend signal:
📈 Strong Buy Signal: bullScore >= 6 and bullScore > bearScore.
📉 Strong Sell Signal: bearScore >= 6 and bearScore > bullScore.
🔸 Neutral: No dominant direction.
Additionally, the EMA Zone feature confirms the trend based on the price’s position relative to a zone around the EMA 200:
Price above the zone and sufficiently distant → Uptrend (UP). 🟢
Price below the zone and sufficiently distant → Downtrend (DOWN). 🔴
Price within the zone → Neutral. 🔸
🖥️ Display on the Chart
Table: A table in the top-right corner shows the status of all indicators (✅ Buy / ❌ Sell), signal strength (as %), success rate, and results of the last 5 trades.
Lines and Labels:
🎯 Entry Level: A gray line at the price level when a new signal is generated.
🟢 TP (Take Profit): A green line showing the take-profit level.
🔴 SL (Stop Loss): A red line showing the stop-loss level.
EMA Zone: The EMA 200 and its surrounding colored zone visualize the trend direction (green: uptrend, red: downtrend, gray: neutral).
📝 How to Use It?
Platform Setup:
Add the indicator to the TradingView platform.
Customize settings as needed (e.g., EMA length, risk/reward ratio).
Monitoring Signals:
Check the table: Look for 📈 STRONG BUY or 📉 STRONG SELL signals to prepare for a trade.
AI Text: Trust signals more when it says "🧠 FULL CONFIDENCE" (success rate ≥ 50%). Be cautious if it says "⚠️ LOW CONFIDENCE."
Entering a Position:
🟢 Buy Signal:
Table shows "📈 STRONG BUY" and bullScore >= 6.
Price is above the EMA Zone (green zone).
Entry: Current price (🎯 entry line).
TP: 2% above the entry price (🟢 TP line).
SL: 1% below the entry price (🔴 SL line).
🔴 Sell Signal:
Table shows "📉 STRONG SELL" and bearScore >= 6.
Price is below the EMA Zone (red zone).
Entry: Current price (🎯 entry line).
TP: 2% below the entry price (🟢 TP line).
SL: 1% above the entry price (🔴 SL line).
Position Management:
If the price hits TP, the trade closes profitably (✅ Successful).
If the price hits SL, the trade closes with a loss (❌ Failed).
Results are updated in the "Last 5 Trades" section of the table.
Risk Management:
Default risk/reward ratio is 1:2 (1% risk, 2% reward).
Always adjust position size based on your capital.
Consider smaller lot sizes for "⚠️ LOW CONFIDENCE" signals.
💡 Tips
Timeframe: Use 1-minute, 5-minute, or 15-minute charts for scalping.
Market Selection: Works best in volatile markets (e.g., BTC/USD, EUR/USD).
Confirmation: Ensure the EMA Zone trend aligns with the signal.
Discipline: Stick to TP and SL levels, avoid emotional decisions.
⚠️ Warnings
No indicator is 100% accurate. Always use additional analysis (e.g., support/resistance).
Be cautious during high-volatility periods (e.g., news events).
The success rate is based on past performance and does not guarantee future results.
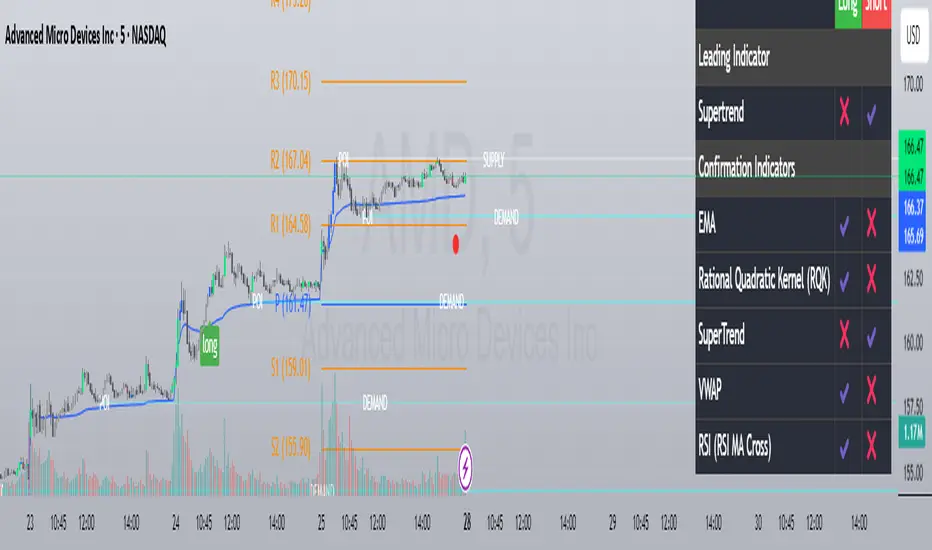
Custom Strategy Builder Raad V1This indicator is an advanced trading strategy builder that combines multiple technical indicators and analysis tools into a single script. Below is a simplified breakdown of its key components and functionalities.
Key Features & Components
1. Core Indicators
Moving Averages (EMA, SMA, WMA, HMA, VWMA) – Multiple types with customizable lengths.
Range Filter – A volatility-based trend filter.
SuperTrend – A trend-following indicator using ATR.
Half Trend – Another trend-following indicator.
Ichimoku Cloud – A comprehensive trend and support/resistance system.
2. Trend Indicators
Bollinger Bands – Volatility-based price channels.
MACD – Moving Average Convergence Divergence for momentum.
Parabolic SAR – A trailing stop indicator for trend direction.
Donchian Channel – Identifies breakout levels based on recent highs/lows.
3. Momentum Indicators
RSI (Relative Strength Index) – Measures overbought/oversold conditions.
Stochastic Oscillator – Another momentum indicator for reversals.
CCI (Commodity Channel Index) – Detects cyclical trends.
Awesome Oscillator (AO) – A histogram-based momentum tool.
4. Additional Analysis Tools
Fibonacci Retracement – Key support/resistance levels based on Fibonacci ratios.
Pivot Points – Calculates intraday support/resistance levels.
Supply/Demand Zones – Highlights key accumulation/distribution areas.
Volume Analysis – Includes VWAP and volume-based signals.
5. Dashboard & Customization
Switch Board – Enables/disables indicators on the chart.
Signal Filters – Adjusts confirmation rules for entries/exits.
Visual Customization – Change colors, line styles, and sizes.
How It Works
Leading Indicator – The primary signal generator (e.g., Range Filter, RSI, MACD).
Confirmation Indicators – Additional filters to validate signals (e.g., EMA cross, volume, trend strength).
Signal Expiry – Defines how long a signal remains valid before resetting.
Dashboard Display – Shows active signals and market conditions.
Best Use Cases
✅ Multi-Indicator Strategies – Combines multiple signals into one system.
✅ Trend & Momentum Trading – Works well for swing and intraday trading.
✅ Customizable Alerts – Can trigger buy/sell signals based on user-defined rules.
This indicator is ideal for traders who want a fully customizable and multi-strategy approach without manually overlaying multiple indicators.
هذا المؤشر هو أداة متقدمة لبناء استراتيجيات التداول تحتوي على مجموعة كبيرة من المؤشرات الفنية وأدوات التحليل. إليك شرح مبسط لمكوناته الرئيسية:
المكونات الرئيسية:
1. المؤشرات الأساسية:
المتوسطات المتحركة (EMA, SMA, WMA, HMA, VWMA): تسمح باختيار أنواع مختلفة من المتوسطات المتحركة بأطوال مختلفة.
Range Filter: مرشح يعتمد على مدى السعر لتحديد الاتجاه.
SuperTrend: مؤشر اتجاهي يعتمد على ATR.
Half Trend: مؤشر اتجاهي آخر.
Ichimoku Cloud: نظام إيشيموكو الكلاسيكي.
2. مؤشرات الاتجاه:
Bollinger Bands: نطاقات بولينجر.
MACD: مؤشر تقارب وتباعد المتوسطات المتحركة.
Parabolic SAR: مؤشر SAR القطعي المكافئ.
Donchian Channel: قناة دونشيان لتحديد القمم والقيعان.
3. مؤشرات الزخم:
RSI: مؤشر القوة النسبية.
Stochastic: مؤشر ستوكاستيك.
CCI: مؤشر قناة السلع.
Awesome Oscillator: مؤشر الزخم.
4. أدوات التحليل الأخرى:
Fibonacci Retracement: مستويات فيبوناتشي للتصحيح.
Pivot Points: نقاط محورية.
Supply/Demand Zones: مناطق العرض والطلب.
Volume Analysis: تحليل الحجم.
5. لوحة التحكم:
تسمح بتفعيل/تعطيل المؤشرات المختلفة.
تخصيص ألوان وعرض الخطوط.
ضبط معايير الإشارات.
طريقة العمل:
يحدد المؤشر إشارات شراء/بيع بناءً على تقاطعات المؤشرات المختلفة.
يمكن استخدام مؤشر رئيسي (Leading Indicator) مع مؤشرات تأكيد (Confirmation Indicators).
يوفر خيارات لتخصيص فترة انتهاء صلاحية الإشارة وطريقة العرض.
الاستخدام:
للمتداولين المتقدمين الذين يرغبون في بناء استراتيجيات معقدة.
يمكن استخدامه للتحليل الفني متعدد الأطر الزمنية.
يوفر مرونة كبيرة في تخصيص المؤشرات حسب احتياجات المستخدم.
Long Bar With ATR Multi Timframe | Amoo HassanLong Bar with ATR Multi Timeframe | Amoo Hassan
Looking for a smarter way to spot powerful moves in the market?
Long Bar with ATR Multi Timeframe is built exactly for that!
This tool helps you catch strong trend breakouts and potential reversals — in a simple, clear, and effective way.
What This Script Does:
Detects Long Bars: It looks for candles with a larger body compared to recent averages and confirms them with ATR (Average True Range). Only truly significant moves are highlighted.
Trend Filtering: Uses fast and slow moving averages (60 EMA, 34 EMA, and 200 SMA) to check if the overall market trend supports your trade.
Multi-Timeframe Supertrend: Supertrend signals are combined across different timeframes to give extra confirmation and reduce false signals.
Sharp Peaks and Valleys: Special candlestick patterns like sharp tops and bottoms are detected automatically.
Smart Trading Sessions: Trades are filtered based on the most active trading hours, avoiding dead times when price action is messy.
Important Date Control: On days with historically strange price action (like the 13th and 20th), the script stays cautious by disabling trades.
Clear Buy and Sell Labels: When all conditions are aligned, you'll see clean and clear "BUY" or "SELL" signals right on your chart.
Why You'll Like It:
It's easy to use, even if you're not a technical analysis expert.
It helps you avoid bad trades and focus on quality setups.
It fits into your existing trading system — or it can work as a standalone entry tool.
Friendly Reminder:
No indicator is 100% perfect! Always combine signals with good risk management and your own judgment.
And remember: Past results don't guarantee future performance.
Best Timeframes:
For the best results, we recommend using this script on 5-minute and 1-minute timeframes.

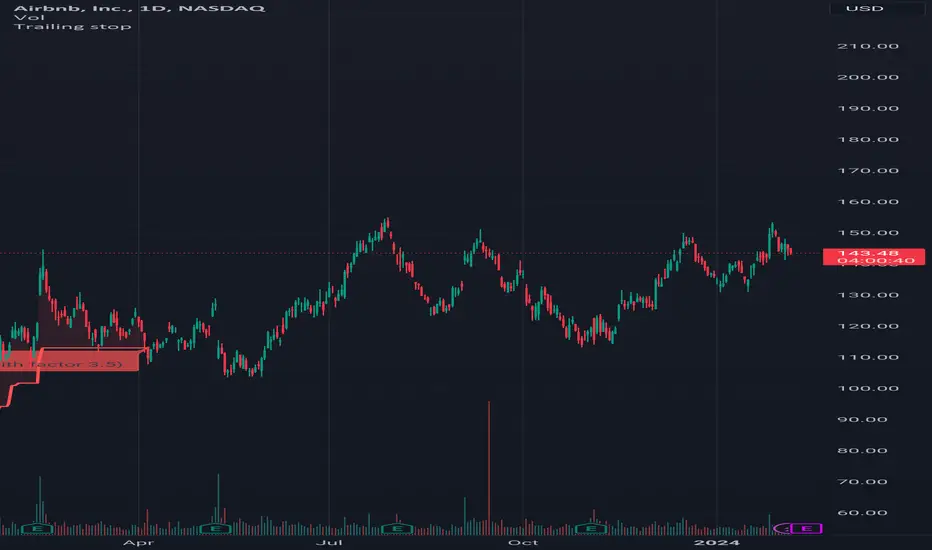
Trailing stopHi all!
This script helps to alert you when a trailing stop is hit. More specifically it alerts you when the low of the candle crosses below your trailing stop. A trailing stop follows a price positive movements. It raises your stop when price goes up, but keeps it at the same level if price goes down, so it "locks" in your profit. You define your long entry bar and choose one of the following methods for the stop:
ATR
The Average True Range (ATR) is popular to trail stops. The trailing stop is raised by the low minus the ATR (times a factor that can be set under the settings for ATR).
EMA
The Exponential Moving Average (EMA) can be used to trail your stop. When the low goes below the EMA an alert is sent about the stop. Its length can be set in the settings.
SMA
The Simple Moving Average (SMA) can be used to trail your stop. When the low goes below the SMA an alert is sent about the stop. Its length can be set in the settings.
Source
An external source can be useful as a stop signal. You can use this option that will stop you out when the signal returns anything else than "na". E.g. if you want a stop when KivancOzbilgic script "SuperTrend" () turns red, you set the source to "Supertrend: Down Trend". This option will not draw pretty things on the chart, but it will alert you!
Please note that this is for long entries only.
Best of trading luck!
Zigzag Trend/Divergence DetectorPullbacks are always hardest part of the trade and when it happen, we struggle to make decision on whether to continue the trade and wait for recovery or cut losses. Similarly, when an instrument is trending well, it is often difficult decision to make if we want to take some profit off the table. This indicator is aimed to make these decisions easier by providing a combined opinion of sentiment based on trend and possible divergence.
⬜ Process
▶ Use any indicator to find trend bias. Here we are using simple supertrend
▶ Use any oscillator. I have added few inbuilt oscillators as option. Default used is RSI.
▶ Find divergence by using zigzag to detect pivot high/low of price and observing indicator movement difference between subsequent pivots in the same direction.
▶ Combine divregence type, divergence bias and trend bias to derive overall sentiment.
Complete details of all the possible combinations are present here along with table legend
⬜Chart Legend
C - Continuation
D - Divergence
H - Hidden Divergence
I - Indeterminate
⬜ Settings
▶ Zigzag parameters : These let you chose zigzag properties. If you check "Use confirmed pivots", then unconfirmed pivot will be ignored in the table and in the chart
▶ Oscillator parameters : Lets you select different oscillators and settings. Available oscillators involve
CCI - Commodity Channel Index
CMO - Chande Momentum Oscillator
COG - Center Of Gravity
DMI - Directional Movement Index (Only ADX is used here)
MACD - Moving average convergence divergence (Can chose either histogram or MACD line)
MFI - Money Flow Index
MOM - Momentum oscillator
ROC - Rate Of Change
RSI - Relative Strength Index
TSI - Total Strength Index
WPR - William Percent R
BB - Bollinger Percent B
KC - Keltner Channel Percent K
DC - Donchian Channel Percent D
ADC - Adoptive Donchian Channel Percent D ( Adoptive-Donchian-Channel )
▶ Trend bias : Supertrend is used for trend bias. Coloring option color candles in the direction of supertrend. More option for trend bias can be added in future.
▶ Stats : Enables you to display history in tabular format.
Overview of settings present here:
⬜ Notes
Trend detection is done only with respect to previous pivot in the same direction. Hence, if chart has too many zigzags in short period, try increasing the zigzag length or chart timeframe. Similarly, if there is a steep trend, use lower timeframe charts to dig further.
Oscillators does not always make pivots at same bar as price. Due to this some the divergence calculation may not be correct. Hence visual inspection is always recommended.
⬜ Possible future enhancements
More options for trend bias
Enhance divergence calculation. Possible options include using oscillator based zigzag as primary or using close prices based zigzag instead of high/low.
Multi level zigzag option - Can be messy to include more than one zigzag. Option can be added to chose either Level1 or Level2 zigzags.
Alerts - Alerts can only be added for confirmed pivots - otherwise it will generate too many unwanted alerts. Will think about it :)
If I get time, I will try to make a video.

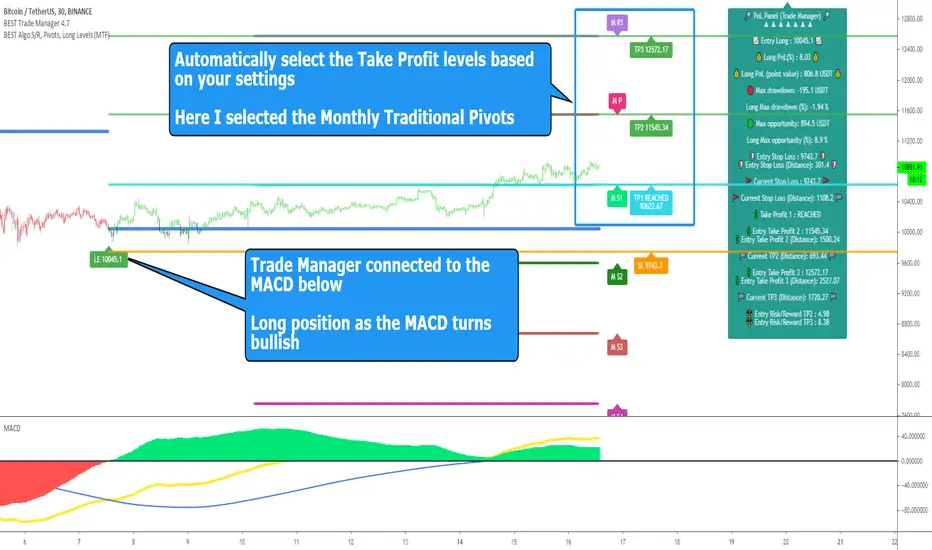
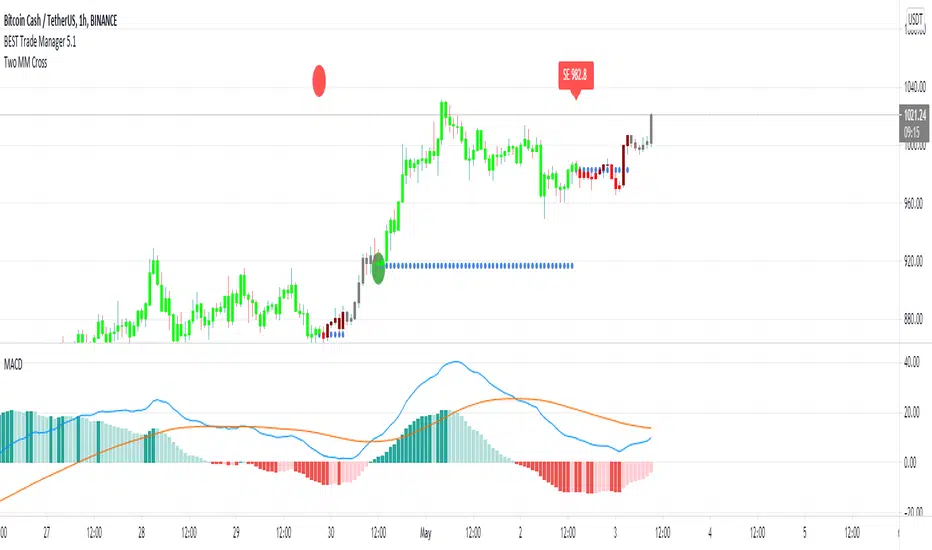
BEST Standalone Trade Manager with Automatic Take ProfitHello BEST traders
The BEST Trade Manager got upgraded with many more features
This version allows setting automatically the TP levels on either Daily/Weekly/Monthly Fibonacci/Traditional/Camarilla/Woodie pivots and Daily/Weekly/Monthly/Intraday Moving Averages
I. 💎 SCRIPTS ACCESS 💎
1. Available only with one-time payment on my website.
2. My website URL is in this script signature at the very bottom (you'll have to scroll down a bit and going past the long description) and in my profile status available here: Daveatt
3. Many video tutorials explaining clearly how all our indicators work are available on your website > guides section.
4. You may also contact me directly for more information
II. 🔎 What is the BEST Trade Manager?🔎
2.1 Concept
The BEST Trade Manager is compatible with any indicator.
Once connected, it adds another layer of good stuff with real-time user custom defined stop loss (8 available options), take profits (4 possible options) + alerts compatible for trading automation.
2.2 How hard is it to update your indicator?
We'll send to our customers, a comprehensive and easy tutorial, to make any indicator compatible.
I guarantee you, it should take no more than 2 minutes per indicator. We made it easy, fun, and awesome. #bolder #statement
III. The amazing benefits of our Plug&Play system
I hope you're ready to be impressed. Because, what I'm about to introduce, is my best-seller feature - and available across many of my indicators.
The BEST Trade manager can be connected to any external indicator
Let's assume you want to connect your RSI divergence to your Trade Manager.
I mentioned an RSI divergence but you may connect any oscillator ( MACD, On balance volume, stochastic RSI, True Strenght index, and many more..) or non-oscillatory (divergence, trendline break, higher highs/lower lows, candlesticks pattern, price action, harmonic patterns, ...) indicators.
THE SKY IS (or more likely your imagination) is the limit :)
Of course, this tool is compatible with my other indicators
We go in-depth on our website why the Plug&Play is an untapped opportunity for many traders out there - URL available on my profile status and signature
IV. 🧰 Features 🧰
Candles can be colored to highlight the trend direction better [/b [
4.1 Stop-Loss Management
For what's following, let's assume that 2 is the stop-loss value you inserted in the indicator, and the Algorithm Builder gives a BUY signal.
This is NOT a recommendation at all, only an example to explain how this feature works.
- %Trailing: The Stop-Loss starts 2% away from the entry price - and will move up (because we're on a BUY trade as per our example) every time your trade will gain 2% profit
- Pips Trailing: Same as above but using a distance in pips/USD value
- Percentage: The Stop-Loss stays static 2% away from the entry price. There is no trailing here
- TP Trailing: Trail your stop-loss every time a Take Profit level is hit
- Supertrend: embedded supertrend use as a trailing stop
- Fixed: Set the Stop-Loss at a fixed position (value should be in currency/units)
- ATR multiple: Set the Stop-loss at a multiple of ATR
- External connector: Let's say your indicator already contains embedded stop-loss levels, you can add them in the Trade Manager
4.2 Take Profits Management
You can manage up to 3 take profit levels defined as a percentage or price value or ATR multiple.
The expected input is in percentage value (for instance, setting the % target of TP1 to 2% will set the TP1 level 2% away from the entry price
This version allows setting automatically the TP levels on either Daily/Weekly/Monthly Fibonacci/Traditional/Camarilla/Woodie pivots and Daily/Weekly/Monthly/Intraday Moving Averages
4.3 Built-in Risk-to-Reward Panel with real-time analytics
The good stuff doesn't stop here.
You'll notice that this sometimes green (when in a LONG), sometimes red (when in a SHORT) panel at the right of your chart.
- Entry Price: the price when the Algorithm Builder will give a signal.
- The Trade PnL in percentage.
- Entry Stop Loss: Distance (in currency/units) between the selected stop-loss algorithm (percent, trailing, TP trailing, etc.) and the entry price.
- Entry TP1/TP2/TP3: Distance (in currency/units) between the entry price and the first take profit
- Risk/Reward TP1/TP2/TP3: Using the Stop-loss distance at entry, and Take Profit 1/2/3 at the entry to compute the risk-to-reward ratio.
- Max drawdown and Max opportunity (value and percentage): respectively the maximum loss and maximum win per trade
For more details, please check the guides section of my website. Links are in my signature and profile status.
V. 🔔 Alerts 🔔
We enabled the alerts on the:
1. Stop-Loss hit
2. Take Profit 1/2/3 hit
3. custom hard exits based on either MACD / RSI divergence/ MM cross
5.1 🤖 Compatible with trading bots? 🤖
It's compatible with all third-parties out there capturing alerts and forwarding them to the brokers.
We enabled TradingConnector and ProfitView alert templates so far.
If you have any doubts or questions, please hit me up directly or ask in the comments section of this script.
BEST regards,
Dave
[Daveatt] BEST Trade Manager Pivots 1.0Hello BEST traders
The BEST Trade Manager got upgraded with many more features
This version allows setting automatically the TP levels on either Fibonacci/Traditional/Camarilla/Woodie pivots
I. 💎 SCRIPTS ACCESS 💎
1. Available only with one-time payment on my website.
2. My website URL is in this script signature at the very bottom (you'll have to scroll down a bit and going past the long description) and in my profile status available here: Daveatt
3. Many video tutorials explaining clearly how all our indicators work are available on your website > guides section.
4. You may also contact me directly for more information
II. 🔎 What is the BEST Trade Manager?🔎
2.1 Concept
The BEST Trade Manager is compatible with any indicator.
Once connected, it adds another layer of good stuff with real-time user custom defined stop loss (8 available options), take profits (4 possible options) + alerts compatible for trading automation.
2.2 How hard is it to update your indicator?
We'll send to our customers, a comprehensive and easy tutorial, to make any indicator compatible.
I guarantee you, it should take no more than 2 minutes per indicator. We made it easy, fun, and awesome. #bolder #statement
III. The amazing benefits of our Plug&Play system
I hope you're ready to be impressed. Because, what I'm about to introduce, is my best-seller feature - and available across many of my indicators.
The BEST Trade manager can be connected to any external indicator
Let's assume you want to connect your RSI divergence to your Trade Manager.
I mentioned an RSI divergence but you may connect any oscillator ( MACD, On balance volume, stochastic RSI, True Strenght index, and many more..) or non-oscillator (divergence, trendline break, higher highs/lower lows, candlesticks pattern, price action, harmonic patterns, ...) indicators.
THE SKY IS (or more likely your imagination) is the limit :)
We go in-depth on our website why the Plug&Play is an untapped opportunity for many traders out there - URL available on my profile status and signature
IV. 🧰 Features 🧰
Candles can be colored to highlight the trend direction better [/b [
4.1 Stop-Loss Management
For what's following, let's assume that 2 is the stop-loss value you inserted in the indicator, and the Algorithm Builder gives a BUY signal.
This is NOT a recommendation at all, only an example to explain how this feature works.
- %Trailing: The Stop-Loss starts 2% away from the entry price - and will move up (because we're on a BUY trade as per our example) every time your trade will gain 2% profit
- Pips Trailing: Same as above but using a distance in pips/USD value
- Percentage: The Stop-Loss stays static 2% away from the entry price. There is no trailing here
- TP Trailing: Trail your stop-loss every time a Take Profit level is hit
- Supertrend: embedded supertrend use as a trailing stop
- Fixed: Set the Stop-Loss at a fixed position (value should be in currency/units)
- ATR multiple: Set the Stop-loss at a multiple of ATR
- External connector: Let's say your indicator already contains embedded stop-loss levels, you can add them in the Trade Manager
4.2 Take Profits Management
You can manage up to 3 take profit levels defined as a percentage or price value or ATR multiple.
The expected input is in percentage value (for instance, setting the % target of TP1 to 2% will set the TP1 level 2% away from the entry price
This version allows setting automatically the TP levels on either Fibonacci/Traditional/Camarilla/Woodie pivots
4.3 Built-in Risk-to-Reward Panel with real-time analytics
The good stuff doesn't stop here.
You'll notice that this sometimes green (when in a LONG), sometimes red (when in a SHORT) panel at the right of your chart.
- Entry Price: the price when the Algorithm Builder will give a signal.
- The Trade PnL in percentage.
- Entry Stop Loss: Distance (in currency/units) between the selected stop-loss algorithm (percent, trailing, TP trailing, etc.) and the entry price.
- Entry TP1/TP2/TP3: Distance (in currency/units) between the entry price and the first take profit
- Risk/Reward TP1/TP2/TP3: Using the Stop-loss distance at entry, and Take Profit 1/2/3 at the entry to compute the risk-to-reward ratio.
- Max drawdown and Max opportunity (value and percentage): respectively the maximum loss and maximum win per trade
For more details, please check the guides section of my website. Links are in my signature and profile status.
V. 🔔 Alerts 🔔
We enabled the alerts on the:
1. Stop-Loss hit
2. Take Profit 1/2/3 hit
3. custom hard exits based on either MACD / RSI divergence/ MM cross
5.1 🤖 Compatible with trading bots? 🤖
It's compatible with all third-parties out there capturing alerts and forwarding them to the brokers.
We enabled TradingConnector and ProfitView alert templates so far.
If you have any doubts or questions, please hit me up directly or ask in the comments section of this script.
BEST regards,
Dave

BEST Trade ManagerHello traders
The BEST Trade Manager got upgraded with many more features
I. 💎 SCRIPTS ACCESS 💎
1. Available only with one-time payment on my website.
2. My website URL is in this script signature at the very bottom (you'll have to scroll down a bit and going past the long description) and in my profile status available here: Daveatt
3. Many video tutorials explaining clearly how all our indicators work are available on your website > guides section.
4. You may also contact me directly for more information
II. 🔎 What is the BEST Trade Manager?🔎
2.1 Concept
The BEST Trade Manager is compatible with any indicator.
Once connected, it adds another layer of good stuff with real-time user custom defined stop loss (8 available options), take profits (4 possible options) + alerts compatible for trading automation.
2.2 How hard is it to update your indicator?
We'll send to our customers, a comprehensive and easy tutorial, to make any indicator compatible.
I guarantee you, it should take no more than 2 minutes per indicator. We made it easy, fun, and awesome. #bolder #statement
III. The amazing benefits of our Plug&Play system
I hope you're ready to be impressed. Because, what I'm about to introduce, is my best-seller feature - and available across many of my indicators.
The BEST Trade manager can be connected to any external indicator
Let's assume you want to connect your RSI divergence to your Trade Manager.
I mentioned an RSI divergence but you may connect any oscillator ( MACD, On balance volume, stochastic RSI, True Strenght index, and many more..) or non-oscillator (divergence, trendline break, higher highs/lower lows, candlesticks pattern, price action, harmonic patterns, ...) indicators.
THE SKY IS (or more likely your imagination) is the limit :)
We go in-depth on our website why the Plug&Play is an untapped opportunity for many traders out there - URL available on my profile status and signature
IV. 🧰 Features 🧰
Candles can be colored to highlight the trend direction better [/b[
4.1 Stop-Loss Management
For what's following, let's assume that 2 is the stop-loss value you inserted in the indicator, and the Algorithm Builder gives a BUY signal.
This is NOT a recommendation at all, only an example to explain how this feature works.
- %Trailing: The Stop-Loss starts 2% away from the entry price - and will move up (because we're on a BUY trade as per our example) every time your trade will gain 2% profit
- Pips Trailing: Same as above but using a distance in pips/USD value
- Percentage: The Stop-Loss stays static 2% away from the entry price. There is no trailing here
- TP Trailing
- Supertrend: embedded supertrend use as a trailing stop
- Fixed: Set the Stop-Loss at a fixed position (value should be in currency/units)
- ATR multiple: Set the Stop-loss at a multiple of ATR
- External connector: Let's say your indicator already contains embedded stop-loss levels, you can add them in the Trade Manager
4.2 Take Profits Management
You can manage up to 3 take profit levels defined as a percentage or price value or ATR multiple.
The expected input is in percentage value (for instance, setting the % target of TP1 to 2% will set the TP1 level 2% away from the entry price
4.3 Built-in Risk-to-Reward Panel with real-time analytics
The good stuff doesn't stop here.
You'll notice that this sometimes green (when in a LONG), sometimes red (when in a SHORT) panel at the right of your chart.
- Entry Price: the price when the Algorithm Builder will give a signal.
- The Trade PnL in percentage.
- Entry Stop Loss: Distance (in currency/units) between the selected stop-loss algorithm (percent, trailing, TP trailing, etc.) and the entry price.
- Entry TP1/TP2/TP3: Distance (in currency/units) between the entry price and the first take profit
- Risk/Reward TP1/TP2/TP3: Using the Stop-loss distance at entry, and Take Profit 1/2/3 at the entry to compute the risk-to-reward ratio.
- Max drawdown and Max opportunity (value and percentage): respectively the maximum loss and maximum win per trade
For more details, please check the guides section of my website. Links are in my signature and profile status.
V. 🔔 Alerts 🔔
We enabled the alerts on the:
1. Stop-Loss hit
2. Take Profit 1/2/3 hit
3. custom hard exits based on either MACD/RSI divergence/MM cross
5.2. 🤖 Compatible with trading bots? 🤖
Should be compatible with all third-parties out there capturing alerts and forwarding them to the brokers.
We enabled TradingConnector alert templates so far and we'll add the ProfitView ones shortly
If you have any doubts or questions, please hit me up directly or ask in the comments section of this script.
Kind regards,
Dave
RSI Div + Hybrid + IchimokuClouds (Red/Green Area): This is the Ichimoku Cloud. Do not trade if the price is inside the cloud. If we are above the cloud, we are in "BUY" mode; if we are below, we are in "SELL" mode.
Thin Line (Red/Green): This is the Supertrend. You can set your stop-loss based on this line.
Thick White Line: This is the EMA 200. Never open a "BUY" position when the price is below this line.
Yellow "Div" Triangles: These are RSI Divergences. These are not trade signals, but "Get Ready" warnings. They signal that a reversal is approaching.
BIG "STRONG BUY" LABEL: This is the moment you have been waiting for.
Price is above the EMA.
Price is above the Cloud.
Supertrend is Green.
And the trigger has been pulled (Stoch or Ichimoku Crossover).

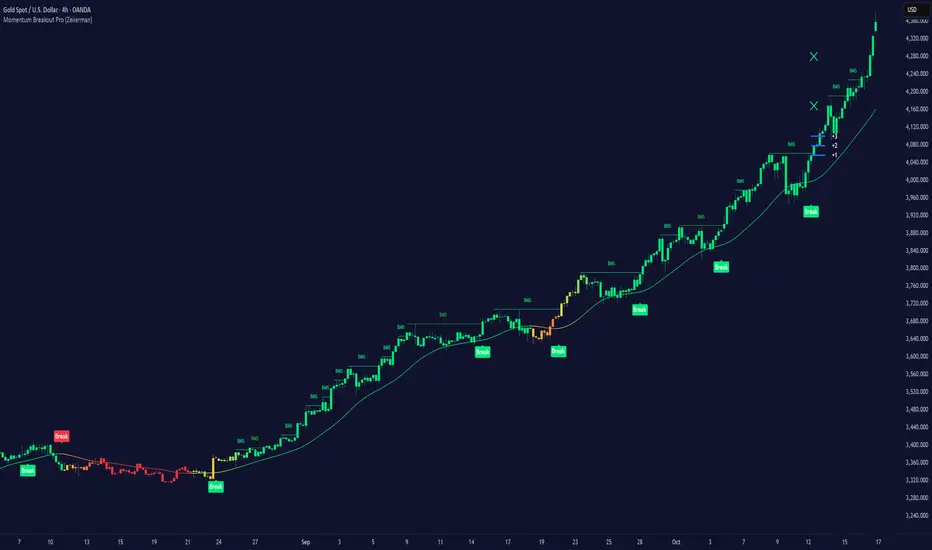
Momentum Breakout Pro (Zeiierman)█ Overview
Momentum Breakout Pro (Zeiierman) is a breakout-focused quantitative system engineered to identify only the strongest momentum expansions in the market. Instead of reacting to price movement, it reconstructs a refined momentum signal, evaluates its strength and persistence, and validates each breakout against the broader market context. Only when momentum pressure aligns with structural direction, trend state, candle behavior, and spacing requirements will a breakout be considered qualified.
The result is a clean and context-aware signal flow that removes noise and highlights only the breakouts with the highest probability of continuation. Traders receive precise Break signals at qualified points, adaptive trend lines, candle-based trend visualization, structure levels, and volatility-driven confirmation markers. Internally, the system operates as a layered confirmation model designed to enforce directional consensus and filter out the shallow or unreliable moves that typically weaken breakout strategies.
In short, Momentum Breakout Pro offers a refined breakout selection system that focuses on quality over quantity, designed for traders who want clean and well-supported breakout signals backed by structured technical logic.
⚪ Why This One Is Unique
Momentum Breakout Pro’s uniqueness comes from its multi-layered confirmation process. The internal momentum reconstruction ensures that only sustained directional pressure is considered meaningful. Optional filters such as Dynamic Trend, SuperTrend, Average Trend, VWAP, and Market Structure provide an adjustable decision stack, allowing traders to decide how strict or flexible the validation should be. Breakouts are released only when the enabled components agree.
█ Main Features
⚪ Breakout Signals
The Breakout Signals are the core feature of the indicator. They help traders identify high probability breakouts that are more likely to follow through. With built-in confirmation levels, it becomes much easier to judge whether a breakout is strong or likely to fail. Combined with the suggested take profit points, traders can quickly find confirmed breakout opportunities with realistic first profit targets.
⚪ Breakout Filters
The indicator includes multiple filters that align each breakout with the current trend, structure, and momentum. This is essential for identifying only the strongest and most reliable breakout setups.
⚪ Dynamic Trend
The Dynamic Trend is a volatility-aware long-term trend filter. It removes noise and adapts to sharp volatility swings, staying focused on the true underlying trend direction. This helps traders avoid false signals and remain aligned with the broader market drift.
⚪ Moving Average
A standard moving average with a user-defined length. Simple, effective, and easy to understand. It acts as a clean trend filter for both beginners and advanced traders.
⚪ Super Trend
A Super Trend filter that restricts breakout signals to appear only in the direction of the active SuperTrend. This adds an additional layer of directional confirmation.
⚪ VWAP
VWAP (Volume Weighted Average Price) is a powerful anchor, especially on lower timeframes. It serves as a dynamic support or resistance level and a highly reliable trend filter.
⚪ Candle Coloring
The candle coloring engine tracks how long the price has moved in one direction and translates that persistence into a graded bull, mid, or bear color spectrum. This helps traders quickly understand trend strength, confirm momentum, and allow the market enough space to move before a larger breakout occurs.
⚪ Momentum
The momentum filter identifies bursts of momentum and highlights the strongest correlations between price and movement strength. It filters out weak breakouts that are not backed by real momentum, improving accuracy significantly.
⚪ Market Structure
Trading with the current market structure is crucial. This filter ensures that breakout signals appear only when they align with the existing structure, helping traders stay on the right side of the market.
█ How to Use
⚪ Breakouts
Use this tool to identify high-quality breakouts. To increase accuracy, combine the breakout signals with the trend, structure, and momentum filters. When these elements align, the probability of a successful breakout increases significantly.
⚪ Confirmation Levels
The indicator includes three confirmation levels that adapt based on current market volatility.
These levels help you judge the strength of the breakout:
When the three levels are tight and close to the price, it indicates strong conditions. Price is more likely to break through all levels quickly and confirm the breakout.
When the levels are spread out and far from the price, the breakout becomes weaker. Price must travel too far to confirm the move, which lowers the probability of a clean follow-through.
What you want to see is a breakout where all three confirmation levels are penetrated within the next few candles. That is the ideal scenario, indicating a confirmed breakout with a higher chance of continuation in that direction.
⚪ Take Profit Strategy
The indicator includes built-in take profit levels, which act as your first two targets after a confirmed breakout:
Once Take Profit 1 is hit, move your stop loss to break even.
When Take Profit 2 is hit, move your stop loss to the first take profit level.
From there, allow the position to run until the candle coloring shifts, signaling that momentum may be slowing or reversing.
This approach helps you secure profits early, reduce risk, and stay in the trade for larger moves when the trend is strong.
█ Setting Realistic Expectations: Win-Rate and Risk–Reward
Research on breakout systems, trend-following strategies, and directional volatility all show the same behavioral pattern. Win rates tend to be moderate, while risk and reward are positively skewed. Most breakout attempts are tested quickly by the market and may result in small losses or breakeven trades. The real edge comes from the smaller group of breakouts that expand into multi-stage moves and generate significantly larger gains. This is a well-established characteristic of momentum-driven price dynamics.
Momentum Breakout Pro is designed to work within this framework. It is not built to win on every signal, but to highlight conditions that historically align with stronger follow-through. The tool provides structure levels, confirmation lines, and initial target markers to help traders measure extension and manage risk objectively. Actual results will vary depending on the filters enabled, the markets traded, and how stops and exits are managed. However, the overall expectation remains consistent with established breakout research: frequent smaller outcomes combined with fewer but more impactful winners.
█ How It Works
⚪ Breakout System
The breakout system detects emerging directional expansions by transforming price movement into a stabilized signal curve. It evaluates localized impulse strength, directional bias, and short-term acceleration to determine when the price is exerting statistically meaningful pressure in one direction. When this pressure breaches the system’s internal thresholds, a breakout candidate is registered.
Calculation: Price is processed through a multi-stage smoothing pipeline to construct a normalized signal curve. The script analyzes the curve’s gradient and micro-momentum characteristics within a compact evaluation window. A breakout event is triggered when these combined directional metrics exceed the system’s momentum-pressure threshold.
⚪ Momentum Confirmation
To prevent weak or premature breakouts, the system verifies that momentum behavior aligns with the directional expansion. This ensures that only breakouts supported by sustained impulse strength are considered.
Calculation: The script evaluates the strength, stability, and directional consistency of momentum over the developing move. Instead of reacting to isolated shifts, it assesses whether momentum maintains a coherent and persistent trajectory that reinforces the breakout direction. A breakout is confirmed only when momentum structure and directional pressure are synchronized.
⚪ Confirmation Levels
Once a breakout is detected, three confirmation levels indicate how far the price must travel to confirm the breakout's strength.
Calculation: The levels are spaced using a volatility-adjusted distance formula. A breakout is considered strong when the price clears all three levels within a short time window.
⚪ Targets
Targets provide simple reference points for early take profits and risk management.
Calculation: The distance to a nearby structural or volatility-based reference is measured, then projected outward as proportional 1R / 2R style levels.
-----------------
Disclaimer
The content provided in my scripts, indicators, ideas, algorithms, and systems is for educational and informational purposes only. It does not constitute financial advice, investment recommendations, or a solicitation to buy or sell any financial instruments. I will not accept liability for any loss or damage, including without limitation any loss of profit, which may arise directly or indirectly from the use of or reliance on such information.
All investments involve risk, and the past performance of a security, industry, sector, market, financial product, trading strategy, backtest, or individual's trading does not guarantee future results or returns. Investors are fully responsible for any investment decisions they make. Such decisions should be based solely on an evaluation of their financial circumstances, investment objectives, risk tolerance, and liquidity needs.
SuperTwinSuperTwin Indicator
About
SuperTwin is an advanced fusion of the SuperTrend and Twin Range Filter indicators, developed by Kıvanç Özbilgiç. This innovative indicator aims to combine the strengths of two popular technical analysis tools to provide more accurate and reliable trading signals.
Usage Advantages
Noise Filtering: Minimizes false signals with the Twin Range Filter.
Trend Confirmation: Confirms the primary trend direction with SuperTrend.
Early Signals: Provides earlier and more reliable signals through the combination of the two indicators.
Visual Clarity: The color-coded system makes it easy to track the trend direction.
Alert System: Instant signal notifications with automatic alarms.
Stocks
Forex Markets
Futures Markets
Cryptocurrency Markets
You can use it on all timeframes (minute, hourly, daily, weekly).
SuperTwin stands out as an ideal tool for traders by filtering out market noise while capturing genuine trend reversals.
////////////////////////////////////////////////////////////////////////////////

Triple Threat v1.15This is a work in progress that uses machine learning to improve supertrend. When price breaks supertrend line, it will turn orange signaling a potential reversal. It then confirms or fails on the next candle which would trigger a trade and the corresponding indicator visuals. It also dynamically changes settings for different timeframes to remain accurate. The number in the flag is the predicted move size from 1-10 from machine learning analyses, with low numbers being more likely a retracement and higher numbers being explosive potential moves.

POSITION SIZER v8.0 🎯 PROFESSIONAL RISK MANAGEMENT TOOL
Automatically calculates the optimal position size for trading with SuperTrend.
Compatible with Forex, Stocks, Futures, and Cryptocurrencies.
✅ KEY FEATURES:
💰 Automatic SuperTrend — Detects market direction (LONG/SHORT)
📊 Precise Calculations — Shows position size, SL, TP and potential profit
🚨 Visual Alerts — Warns if you use excessive leverage
🔄 Multi-Market — Works on any instrument
⚡ Optimized — No errors, no crashes
🎓 HOW TO USE:
1 — Configure your Total Capital and Risk % (0.5-1% recommended)
2 — The indicator automatically detects your market type
3 — Panel shows exactly what to trade (size, entry, SL, TP)
4 — You execute manually on your broker
⚠️ IMPORTANT:
• This indicator does NOT place orders automatically
• It is a PLANNING tool
• ALWAYS test on demo account first
📋 VERSION 8.0 — IMPROVEMENTS:
✅ Corrected calculations (accurate P&L)
✅ Improved speed (no freezing)
✅ Automatic symbol change detection
✅ Smart alerts (🚨 emoji for high risk)
✅ Precise tick rounding
💡 RECOMMENDED SETTINGS:
Forex: Risk 0.5-1%, Method: Structural Min
Acciones: Risk 1-2%, Method: ATR
Futures: Risk 0.5-1%, Method: Structural Min
Crypto: Risk 1-2%, Method: ATR
If you have questions, leave a comment. I respond regularly.
⭐ If this indicator helps your trading, boost it and share it.

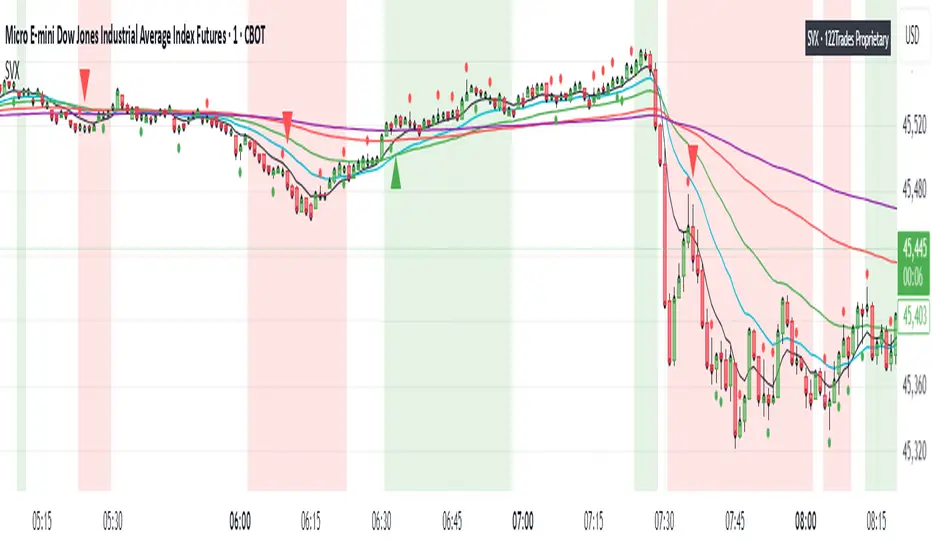
SVX (Sentiment Velocity Index) EMA & Slope StructureThe SVX Momentum Framework is designed as a momentum and slope visualization tool. Designed to identify momentum shifts and pre-move conditions within price action.
What it draws:
- Plots five EMAs (8, 20, 40, 100, 200) To visualize short/medium trend structure. You can pick which ones to see.
- Calculates an EMA-based slope (rate of change) from actual closing-price movement and colors a neutral/positive/negative background for context. This is not ATR or Supertrend.
- Shows optional triangle context markers on bars that meet wick/body conditions that often precede momentum transitions (off by default / user-controlled).
- Shows Reference close (optional): Use when you need to verify price relative to standard closes for easier zone and level marking.
How the components work together:
- The EMA stack provides directional alignment (compression/expansion and relative order of 8/20/40/100/200).
- The slope quantifies whether recent movement is neutral, building (Green), or fading (Red); the background simply reflects that state.
- The triangle context markers flag a bar-shape condition (wick/body relationship) that can precede changes in behavior.
- The reference close is a visual aid for clarity when users compare candle closes and trading zones or levels .
How to read it:
- Structure: Look for EMA ordering (at least 8/20/100 recommended) and spacing to understand the underlying bias and compression/expansion.
- Slope state: Neutral (no bias, white), positive (building, green), or negative (fading, red). Use it as context, not as entries/exits.
- Context markers (optional): Treat them as visual highlights.
- Reference close (optional): Use when you need to verify price relative to candle close for easier zone and level marking.
How to use it (general guidance):
- Read structure first (EMA order/spread), then consider the slope state to understand whether conditions are neutral or possibly momentum-driven in the indicated direction.
- Combine with your own entry rules and/or engulfing candle patterns for timing, risk, and apply your preferred management.
What’s original here:
- The slope visualization is derived from actual closing-price movement, not Supertrend or ATR overlays.
- The wick/body context markers focus on bars that often precede transitions, presented as optional visuals.
- The reference close overlay is included purely to aid interpretation when comparing views to the native close and for more clear zone and level marking.
Access & intent:
- Educational visualization of structure and slope, providing a framework traders can build upon.
- The author does not provide financial advice. Use at your own discretion.
Disclaimer
This script is provided for educational and informational purposes only. It does not constitute financial advice, investment recommendations, or a solicitation to trade. Past performance is not indicative of future results. The author assumes no responsibility for losses incurred from the use of this tool. TradingView, Inc. has no liability related to this script or its use.