Liquidity Trend Horizon [Pineify]Pineify - Liquidity Trend Horizon
The Liquidity Trend Horizon is a sophisticated trend-following indicator designed to identify potential liquidity sweep zones while providing clear visual trend direction. It combines adaptive volatility bands with smart liquidity detection to help traders spot high-probability reversal points where institutional activity may be occurring.
Key Features
Dynamic trend baseline using WMA and EMA smoothing
ATR-based volatility bands that adapt to market conditions
Automatic liquidity sweep detection with visual alerts
Gradient-filled channels for intuitive trend visualization
Real-time candle coloring based on trend direction
How It Works
The indicator calculates a weighted moving average (WMA) of the closing price, then applies exponential smoothing (EMA) to create a responsive yet stable baseline. This dual-smoothing approach filters out market noise while maintaining sensitivity to genuine trend changes.
Volatility bands are constructed using a 200-period Average True Range (ATR) multiplied by a user-defined factor. This creates dynamic support and resistance zones that automatically widen during volatile periods and contract during consolidation.
How Multiple Indicators Work Together
The synergy between WMA, EMA, and ATR creates a comprehensive trend analysis system:
The WMA provides the initial trend estimation with emphasis on recent price action
The EMA layer adds smoothness to reduce false signals
The ATR bands define probabilistic boundaries where price is likely to find support or resistance
Trading Ideas and Insights
Liquidity sweeps occur when price wicks beyond the volatility bands but closes back within the channel. These events often indicate:
Stop-loss hunting by larger market participants
False breakouts that may lead to reversals
Areas of accumulated liquidity being absorbed
A bullish sweep (wick below lower band, close above) suggests potential buying opportunity. A bearish sweep (wick above upper band, close below) may signal selling pressure.
Unique Aspects
Unlike traditional channel indicators, the Liquidity Trend Horizon specifically identifies sweep events where price temporarily breaks boundaries before reverting. This behavior is commonly associated with institutional order flow and smart money concepts.
How to Use
Observe the baseline color for overall trend direction (cyan for bullish, purple for bearish)
Watch for sweep markers (🚀 BULL / 📉 BEAR) at band extremes
Use background flashes as immediate alerts for sweep events
Consider entries when sweeps align with the prevailing trend direction
Customization
Trend Period - Adjust baseline sensitivity (default: 24)
Channel Width Multiplier - Control band distance from baseline (default: 2.0)
Smoothness - Fine-tune signal responsiveness (default: 5)
Color Settings - Personalize bullish/bearish colors and transparency
Conclusion
The Liquidity Trend Horizon bridges technical analysis with liquidity concepts, offering traders a unique perspective on market structure. By highlighting potential sweep zones within an adaptive trend framework, it helps identify areas where reversals are statistically more likely to occur.
Recherche dans les scripts pour "sweep"

PA SystemPA System
短简介 Short Description(放在最上面)
中文:
PA System 是一套以 AL Brooks 价格行为为核心的策略(Strategy),将 结构(HH/HL/LH/LL)→ 回调(H1/L1)→ 二次入场(H2/L2 微平台突破) 串成完整可回测流程,并可选叠加 BoS/CHoCH 结构突破过滤 与 Liquidity Sweep(扫流动性)确认。内置风险管理:定风险仓位、部分止盈、保本、移动止损、时间止损、冷却期。
English:
PA System is an AL Brooks–inspired Price Action strategy that chains Market Structure (HH/HL/LH/LL) → Pullback (H1/L1) → Second Entry (H2/L2 via Micro Range Breakout) into a complete backtestable workflow, with optional BoS/CHoCH structure-break filtering and Liquidity Sweep confirmation. Built-in risk management includes risk-based sizing, partial exits, breakeven, trailing stops, time stop, and cooldown.
⸻
1) 核心理念 Core Idea
中文:
这不是“指标堆叠”,而是一条清晰的价格行为决策链:
结构确认 → 回调出现 → 小平台突破(二次入场)→ 风控出场。
策略把 Brooks 常见的“二次入场”思路程序化,同时用可选的结构突破与扫流动性模块提升信号质量、减少震荡误入。
English:
This is not an “indicator soup.” It’s a clear price-action decision chain:
Confirmed structure → Pullback → Micro-range breakout (second entry) → Risk-managed exits.
The system programmatically implements the Brooks-style “second entry” concept, and optionally adds structure-break and liquidity-sweep context to reduce chop and improve trade quality.
⸻
2) 主要模块 Main Modules
A. 结构识别 Market Structure (HH/HL/LH/LL)
中文:
使用 pivot 摆动点确认结构,标记 HH/HL/LH/LL,并可显示最近一组摆动水平线,方便对照结构位置。
English:
Uses confirmed pivot swings to label HH/HL/LH/LL and optionally plots the most recent swing levels for clean structure context.
B. 状态机 Market Regime (State Machine + “Always In”)
中文:
基于趋势K强度、EMA关系与波动范围,识别市场环境(Breakout/Channel/Range)以及 Always-In 方向,用于过滤不合适的交易环境。
English:
A lightweight regime engine detects Breakout/Channel/Range and an “Always In” directional bias using momentum and EMA/range context to avoid low-quality conditions.
C. 二次入场 Second Entry Engine (H1→H2 / L1→L2)
中文:
• H1/L1:回调到结构附近并出现反转迹象
• H2/L2:在 H1/L1 后等待最小 bars,然后触发 Micro Range Breakout(小平台突破)并要求信号K收盘强度达标
这一段是策略的“主发动机”。
English:
• H1/L1: Pullback into structure with reversal intent
• H2/L2: After a minimum wait, triggers on Micro Range Breakout plus a configurable close-strength filter
This is the main “entry engine.”
D. 可选过滤器 Optional Filters (Quality Boost)
BoS/CHoCH(结构突破过滤)
中文: 可识别 BoS / CHoCH,并可要求“入场前最近 N bars 必须有同向 break”。
English: Detects BoS/CHoCH and can require a recent same-direction break within N bars.
Liquidity Sweeps(扫流动性确认)
中文: 画出 pivot 高/低的流动性水平线,检测“刺破后收回”的 sweep,并可要求入场前出现同向 sweep。
English: Tracks pivot-based liquidity levels, confirms sweeps (pierce-and-reclaim), and can require a recent sweep before entry.
E. FVG 可视化 FVG Visualization
中文: 提供 FVG 区域盒子与管理模式(仅保留未回补 / 仅保留最近N),主要用于区域理解与复盘,不作为强制入场条件(可自行扩展)。
English: Displays FVG boxes with retention modes (unfilled-only or last-N). Primarily for context/analysis; not required for entries (you can extend it as a filter/target).
⸻
3) 风险管理 Risk Management (Built-In)
中文:
• 定风险仓位:按账户权益百分比计算仓位
• SL/TP:基于结构 + ATR 缓冲,且限制最大止损 ATR 倍
• 部分止盈:到达指定 R 后减仓
• 保本:到达指定 R 后推到 BE
• 移动止损:到达指定 R 后开始跟随
• 时间止损:持仓太久不动则退出
• 冷却期:出场后等待 N bars 再允许新单
English:
• Risk-based sizing: position size from equity risk %
• SL/TP: structure + ATR buffer with max ATR risk cap
• Partial exits at an R threshold
• Breakeven at an R threshold
• Trailing stop activation at an R threshold
• Time stop to reduce chop damage
• Cooldown after exit to avoid rapid re-entries
⸻
4) 推荐使用方式 Recommended Usage
中文:
• 推荐从 5m / 15m / 1H 开始测试
• 想更稳:开启 EMA Filter + Break Filter + Sweep Filter,并提高 Close Strength
• 想更多信号:关闭 Break/Sweep 过滤或降低 Swing Length / Close Strength
• 回测时务必设置合理的手续费与滑点,尤其是期货/指数
English:
• Start testing on 5m / 15m / 1H
• For higher quality: enable EMA Filter + Break Filter + Sweep Filter and increase Close Strength
• For more signals: disable Break/Sweep filters or reduce Swing Length / Close Strength
• Use realistic commissions/slippage in backtests (especially for futures/indices)
⸻
5) 重要说明 Notes
中文:
结构 pivot 需要右侧确认 bars,因此结构点存在天然滞后(确认后不会再变)。策略逻辑尽量避免不必要的对象堆叠,并对数组/对象做了稳定管理,适合长期运行与复盘。
English:
Pivot-based structure requires right-side confirmation (inherent lag; once confirmed it won’t change). The script is designed for stability and resource-safe object management, suitable for long sessions and review.
⸻
免责声明 Disclaimer(建议原样保留)
中文:
本脚本仅用于教育与研究目的,不构成任何投资建议。策略回测结果受市场条件、手续费、滑点、交易时段、数据质量等影响显著。使用者需自行验证并承担全部风险。过往表现不代表未来结果。
English:
This script is for educational and research purposes only and does not constitute financial advice. Backtest results are highly sensitive to market conditions, fees, slippage, session settings, and data quality. Use at your own risk. Past performance is not indicative of future results.

Liquidity Entry Triggers (4-Model System) | WarRoomXYZLiquidity Entry Triggers is an open-source, price-action-based analytical framework designed to highlight recurring institutional liquidity behaviors that appear across all liquid markets.
The script focuses on how and where liquidity is taken, rather than attempting to predict direction using oscillators or lagging indicators.
It is optimized for XAUUSD, FX pairs, indices, and crypto , particularly on 1m–15m timeframes where session behavior and liquidity reactions are most visible.
This tool is not a buy/sell signal generator .
It provides contextual entry zones based on structural liquidity logic, allowing traders to apply their own execution rules.
Core Philosophy
Markets move because of:
•Trapped traders
•Forced liquidations
•Session-based liquidity cycles
•Reactions at prior institutional participation zones
This script visualizes four repeatable entry triggers that emerge from those mechanisms.
🔹 1. Failed Breakout / Trapped Trader Model
When price breaks a clearly defined range high or low, breakout traders often enter expecting continuation.
If price fails to hold outside the range and closes back inside, those traders become trapped.
The script detects:
•Breaks beyond recent highs/lows
•Immediate rejection back into the range
•Structural failure of momentum
These conditions frequently lead to mean reversion or reversal moves as trapped traders exit and fuel movement in the opposite direction.
Markers are plotted at the point of failure to highlight potential trap zones.
🔹 2. Liquidation Flush Detection
Sharp impulsive candles with abnormally large wicks often represent liquidation cascades rather than healthy trend continuation.
The script identifies liquidation behavior by measuring:
•Wick-to-body imbalance
•Sudden expansion followed by rejection
•Temporary price inefficiencies
These flushes commonly occur near:
•Session highs/lows
•Range extremes
•Trend exhaustion points
Such events often lead to rebalance moves , where price partially or fully fills the wick.
🔹 3. Orderblock Reaction Zones
Orderblocks represent areas where heavy participation occurred before a strong displacement move.
The script highlights:
•Clean bullish and bearish orderblock structures
•Zones formed during consolidation prior to expansion
•Areas likely to be defended when revisited
Orderblocks with minimal noise and clean departure are prioritized, as they often reflect institutional positioning rather than retail activity.
These zones are intended as reaction areas , not automatic entry signals.
🔹 4. London Session Liquidity Sweep Model
The London session frequently establishes the initial daily high or low.
Later in the session or during New York, price often:
•Sweeps internal liquidity around that level
•Rejects after the sweep
•Continues with the higher-timeframe bias
The script monitors London session behavior and marks:
•Liquidity runs above/below London highs and lows
•Rejections back inside the prior structure
This model is especially effective when combined with broader daily context.
🔹4. How the Components Work Together
The framework is designed as a context stack , not a checklist of signals:
Liquidity Event → Location → Timing → Trader Execution
Each model reinforces the others:
•Failed breakouts often occur after liquidity sweeps
•Liquidation wicks frequently form near orderblocks
•London sweeps often trigger failed momentum moves
•Confluence increases probability, not certainty
🔹 Practical Usage Guide
✔ Identify context
Determine whether price is approaching a range extreme, session level, or prior participation zone.
✔ Wait for a liquidity event
Look for a sweep, failed breakout, or liquidation wick.
✔ Observe reaction
Rejection, displacement, or reclaim behavior provides confirmation.
✔ Execute manually
Stops are commonly placed beyond the liquidity extreme.
Targets are typically internal liquidity, prior highs/lows, or imbalance zones.
The indicator does not manage trades or enforce rules.
Execution and risk management remain the trader’s responsibility.
🔹 5. Originality & Design Notes
This script does not replicate or bundle existing indicators.
It introduces:
•A multi-model liquidity entry framework
•Structural failed breakout detection
•Wick-based liquidation imbalance logic
•Session-aware liquidity sweep visualization
•A unified, minimal, non-lagging design
All concepts are based on observable market behavior and integrated into a single analytical tool.
🔹 6. Suitable Markets & Timeframes
Works best on:
•XAUUSD
•Major FX pairs
•Indices
•Liquid crypto markets
Recommended timeframes:
•1m
•5m
•15m
•30m
🔹7. Limitations & Notes
•This is an analytical framework , not a trading system
•All markings are confirmed at candle close (non-repainting)
•No open interest or order flow data is used
•Results depend on user interpretation and execution
•Best used alongside session bias and higher-timeframe structure
Disclaimer
This script is provided for educational and informational purposes only.
It does not constitute financial advice, investment advice, or a recommendation to buy or sell any instrument.
Trading involves risk, and losses can exceed initial deposits.
The author assumes no responsibility for trading decisions made using this tool.
Users are strongly encouraged to test this script in demo or simulation environments and to apply proper risk management, position sizing, and personal discretion at all times.
By using this script, you acknowledge and accept all associated risks.

Bästa Bob Multi-RSI 😎👊✅ RSI 7 → Fast impulse indicator
• Shows micro-movements
• Reacts instantly to liquidity sweeps
• Perfect for entry timing
✅ RSI 14 → Macro momentum indicator
• Captures the real trend
• Filters out noise
• Confirms larger market movements
When both are in sync → you get true market direction plus perfect timing.
👉 How to Use RSI 7 + RSI 14
1️⃣ Entry Signals (the best method)
BUY when:
• RSI 7 turns up from oversold
• RSI 14 is also sloping upward or gets crossed by RSI 7 from below
→ Extremely accurate right after a liquidity sweep.
SELL when:
• RSI 7 turns down from overbought
• RSI 14 is sloping downward or gets crossed by RSI 7 from above
→ Works insanely well for fakeouts and FVG entries.
2️⃣ Trend Filter
• When RSI 14 stays above 50 → market is bullish
• When RSI 14 stays below 50 → bearish
RSI 7 is then used only for timing entries.
3️⃣ A++ Setups (your favorite ones 😉🔥)
The best signals appear when:
✔ RSI 7 crosses RSI 14 at the same time as:
• a liquidity sweep happens
• price taps into an FVG or Order Block
• volume reacts
• your trend filter (EMA, HTF) supports the move
This combo is criminally effective when scalping BTC, NAS100, and XAUUSD.

Liquidity Hunter Pro v11.9 — TQI EditionLiquidity Hunter Pro v12 is built for intraday traders who want structure, clarity, and precision without unnecessary clutter. The tool blends market structure, momentum, trend alignment, volatility regime analysis, and liquidity mapping into a single unified model.
This version focuses on three core goals:
1. Identify only high-quality, directional market conditions.
The engine filters through HTF bias, short-term structure shifts, RSI momentum, and volatility compression/expansion. The idea is simple: wait for the market to become clean, aligned, and directional before considering an entry.
2. Map liquidity and detect sweeps in real time.
Major highs and lows are tracked using extended pivots, and the system highlights key areas where stop hunts or sweeps may occur. Sweeps and pressure zones are evaluated and factored directly into the quality score.
3. Grade every potential setup with a single, objective metric (TQI).
The Trade Quality Index (0–5⭐) compresses all signals into one reading so the trader can quickly judge whether a setup has enough quality to act on.
The script includes:
• Trend + Momentum + Structure detection
• HTF bias (optional)
• Volatility regime analysis
• Liquidity sweeps + pressure zones
• Micro-confirmation engine
• PQI (0–100%)
• TQI (0–5⭐)
• Clean HUD and Driver’s Guide
• Auto-cleaning labels and signal management
• Optional session filtering (London/NY)
This tool is designed for traders who value confirmation over noise.
It will not fire constantly.
It will wait patiently for clean, directional, aligned markets — and only then issue a signal.
How to Use Liquidity Hunter Pro v12
1. Check the HUD (top-right by default)
The HUD is your dashboard. Before doing anything:
A. HTF Bias
This is your map. Only trade in the direction of the bias.
B. Trend / Momentum / Structure
These should ideally all match the direction of the bias.
If they don’t line up → wait. No alignment = low probability.
C. Liquidity + Volatility Regime
“Sweep ↑→↓” or “Sweep ↓→↑” = potential reversal points
“Expansion” = clean conditions
“Compression” = choppy, avoid
You don’t need to overthink any of this — just think:
“Are the ingredients lined up?”
2. Wait for a valid signal
The indicator will only trigger a BUY or SELL when:
✓ HTF bias aligns
✓ Trend & momentum align
✓ Structure supports the move
✓ Micro-confirmation kicks in
✓ PQI ≥ 75
✓ Sessions are open (optional)
Signals are rare on purpose.
When one prints, you know the market conditions are stacked.
3. Read the label
Each signal prints a small block next to the candle containing:
• Entry price
• SL (based on structure)
• TP(2R) suggestion
• Liquidity context (e.g., sweep or pressure)
• Volatility regime
• TQI ⭐ rating (0–5)
This helps you judge the setup instantly.
A simple rule for beginners:
Trade only if TQI ≥ ⭐⭐⭐
Lower than that = more noise, less edge.
4. Use the liquidity zones
The script plots subtle boxes at recent liquidity highs/lows.
These mark:
• Where the market may hunt stops
• Where reversals often start
• Where signals are more meaningful
When a signal happens near liquidity → higher quality.
5. Follow the session filter (optional but recommended)
By default the tool focuses on:
• London session
• New York session
That removes 70% of low-volatility garbage.
You can turn this off if you trade crypto or indices overnight, but beginners usually benefit from keeping it on.
Recommended Settings
These are the settings used by most testers and early users.
Everything is configurable, but start with this:
Core Settings
• Fast EMA: 21
• Slow EMA: 55
• RSI Length: 14
• Pivot Lookback: 2
These settings create balanced structure detection and smooth trend signals.
HTF Bias
• Use HTF Bias: ON
• HTF Timeframe: 240 (H4)
H4 bias keeps you out of counter-trend traps.
Sessions
• Use London/NY Filter: ON
• London: 08:00–17:00
• New York: 13:30–21:00
Perfect for FX, indices, and metals.
Crypto traders: turn sessions OFF.
HUD + Guide
• HUD: ON
• Guide: ON
• Linger Bars: 12
This keeps things readable and prevents clutter.
Trading Tips for Beginners
These help keep you out of trouble:
1. Don’t fade the bias.
If HTF says bearish → avoid buys.
2. Don’t trade in compression regimes.
It saves you from chop.
3. Don’t chase signals that fire far from structure.
If the signal candle is huge, let it go.
4. Don’t trade without at least ⭐⭐⭐.
You’ll thank yourself later.
Final Thoughts
Liquidity Hunter Pro v12 isn’t meant to spam signals.
It’s meant to filter hard, highlight clean conditions, and help new traders avoid the traps the market throws every day.
Treat it as a trading assistant that tells you:
“The environment is right. Now you decide.”

ICT Directional FVG Indicator (Buffered SL)This is the first indicator I have ever made, and I am very new to Pine Script. I’ve tried my best to create this as a strategy, but I’m still learning, so please be kind and constructive with your feedback!
ICT Directional FVG Indicator (Buffered SL)
This indicator is designed for traders who follow ICT (Inner Circle Trader) concepts, focusing on Fair Value Gaps (FVGs), liquidity sweeps, and session-based trading. It automatically detects bullish and bearish FVGs, highlights them on the chart, and identifies liquidity sweep events. The indicator features three customizable Kill Zones (London, New York, and Asia sessions), each with independent toggles and color-coded backgrounds for clear visual separation.
Key features:
Fair Value Gap Detection: Highlights bullish and bearish FVGs in real time.
Liquidity Sweep Alerts: Marks potential liquidity sweep events for both highs and lows.
Session Kill Zones: Toggle each Kill Zone (London, New York, Asia) independently; background color changes only in enabled zones.
Trade Signal Visualization: Plots entry, stop loss, and take profit levels based on FVG and sweep logic, with a user-defined stop loss buffer.
Customizable Display: Easily enable or disable FVGs, sweeps, trade levels, and each Kill Zone to suit your strategy.
This tool is ideal for ICT-based traders who want a clear, automated view of FVGs, sweeps, and session activity, with full control over which sessions and signals are displayed.

Daily CRTDaily CRT Indicator
The Daily CRT Indicator is a custom technical analysis tool designed to help traders identify and visualize key price patterns on the daily timeframe. Specifically, it detects and marks the "Sweep and Close Inside" pattern, which is a price action pattern that can signal potential trading opportunities.
Key Features:
Pattern Detection:
The indicator detects two specific price action patterns:
Sweep and Close Above: When the current price sweeps above the previous day’s high and closes inside the range, indicating a potential bullish breakout or continuation.
Sweep and Close Below: When the current price sweeps below the previous day’s low and closes inside the range, signaling a potential bearish move.
Horizontal Lines:
The indicator automatically draws horizontal lines at the previous day’s high and low levels whenever a pattern is detected, providing a visual reference for key support and resistance zones.
These lines are displayed in real-time on the chart and adjust dynamically as new patterns form.
Customizable Line Appearance:
Choose the color, thickness, and style (solid, dashed, or dotted) of the lines to fit your preferred chart aesthetic.
Alert System:
The indicator comes with built-in alerts. Set an alert to notify you when the Sweep and Close Inside pattern is detected, helping you stay on top of potential trade setups.
History Management:
Show History: Optionally display the detected patterns on previous bars (past patterns).
Customizable History Duration: Control how far back you want to view the patterns, allowing you to adjust for a cleaner chart and focus on the most recent setups.
Visual Labels:
When the pattern is detected, the indicator can display a label under the bar (customizable) to highlight the occurrence of the pattern, making it easier for traders to spot potential trade signals.
Built for the Daily Timeframe:
This indicator is specifically designed to work on the daily timeframe and is ideal for swing traders and longer-term traders who are focused on the daily price action and want to capture patterns that indicate potential market reversals or breakouts.
How It Works:
The indicator monitors the previous day's price action and looks for situations where the current price action either sweeps the previous day's high or low and then closes inside the range of the previous day's bar. This type of price movement can often signal that a reversal or continuation is about to occur. The indicator marks these setups by drawing horizontal lines and optionally displays labels for quick identification.
Settings & Customization:
Line Color: Customize the color of the lines marking the previous day’s high and low.
Line Thickness: Choose from different thickness levels for better visibility.
Line Style: Pick from solid, dashed, or dotted styles.
Show History: Toggle the display of historical patterns, with the option to control how many days back to show.
Show Labels: Option to toggle the display of labels when the pattern is detected.
Alert Condition: Receive alerts when a pattern is detected, ensuring you never miss a trade opportunity.
Ideal For:
Swing Traders: This indicator is perfect for traders looking to capture swings in the market based on daily price action.
Pattern Traders: Those who trade based on specific chart patterns will benefit from this tool, as it identifies important reversal and breakout signals.
Technical Analysts: Anyone who incorporates price action patterns into their strategy can use this tool as a supplemental analysis tool to improve their trading decisions.
By using the Daily CRT Indicator, you’ll have a powerful tool to help you spot important price action patterns that may indicate key market moves. Whether you're looking to catch breakouts, reversals, or simply track significant support and resistance levels, this indicator is a versatile addition to your trading toolkit.
This description provides a clear understanding of how the Daily CRT Indicator works and what value it offers, making it easy for traders to know if it fits their trading style. Feel free to tweak the description further depending on the details you’d like to emphasize.
iFVG Strategie by Futures.RobbyiFVG Strategy Checklist by Futures.Robby
Updated: October 27, 2025
Description
This script is a manual checklist designed to help traders evaluate their setups based on the iFVG (Fair Value Gap) strategy. It serves solely as a visual aid and does not perform automatic analysis, signal generation, or trade execution.
How It Works
The script creates an interactive checklist directly on the chart. Traders manually select which criteria are met, and the script calculates a percentage score, displaying it with color coding:
Green (≥ 60%): Good fulfillment of criteria
Orange (40–59%): Partial fulfillment
Red (< 40%): Poor fulfillment
Checklist Criteria
The checklist is divided into two main sections:
1. Trade Criteria (8 Points)
Eight manually selectable criteria to assess setup quality:
Trade im Bias → Trade in Bias: Trade follows the higher timeframe trend (H1/H4/Daily).
BE Level → BE Level: Swing point between entry and target.
Sweep → Sweep: Price hits a key swing before reversing.
Displacement → Displacement: iFVG broken by strong candles.
Leg FVG geschlossen → Leg FVG Closed: No open m1 to m5 FVGs to target.
FVG Reaktion → FVG Reaction: Reaction at FVG during sweep (HTF).
FVG Größe → FVG Size: 6 to 10 points.
Anzahl Kerzen → Number of Candles: Maximum of 6 candles.
2. Goals (1 Point)
Six optional goal conditions, counted together as 1 point:
Equal H / L → Equal High/Low
Session H / L → Session High/Low
News H / L → News High/Low
HTF Swing Point → HTF Swing Point
HTF OB → HTF Order Block
HTF FVG → HTF FVG
Settings and Customization
The script’s settings are translated as follows:
Group: Trade Criteria
Trade im Bias → Trade in Bias
Tooltip: Trendrichtung folgt HTF (H1/H4/Täglich) – Trend follows HTF direction
BE Level → BE Level
Tooltip: Swingpunkt zwischen Einstieg und Ziel – Swing point between entry and target
Sweep → Sweep
Tooltip: Kurs erreicht markanten Swing – Price hits key swing before inverse
Displacement → Displacement
Tooltip: iFVG durch starke Kerzen gebrochen – iFVG broken by strong candles
Leg FVG geschlossen → Leg FVG Closed
Tooltip: Keine offenen m1 bis m5 FVGs bis Ziel – No open m1 to m5 FVGs to target
FVG Reaktion → FVG Reaction
Tooltip: Reaktion an FVG beim Sweep (HTF) – Reaction at FVG during sweep (HTF)
FVG Größe → FVG Size
Tooltip: 6 bis 10 Punkte – 6 to 10 points
Anzahl Kerzen → Number of Candles
Tooltip: Maximal 6 Kerzen – Maximum of 6 candles
Group: Goals
Equal H / L → Equal High/Low
Session H / L → Session High/Low
News H / L → News High/Low
HTF Swing Point → HTF Swing Point
HTF OB → HTF Order Block
HTF FVG → HTF FVG
ℹ️ Ziele zählen gemeinsam als 1 Punkt → ℹ️ Goals count together as 1 point
Window Position & Size
Fensterposition → Window Position
oben rechts → top right
oben links → top left
unten rechts → bottom right
unten links → bottom left
Tabellengröße → Table Size
normal → normal
small → small
tiny → tiny
Translation of Chart Table Contents
The table headers and entries on the chart are translated as follows:
Table Headers:
Trade Checkliste → Trade Checklist
Ziele → Goals
Status Symbols:
✅ → ✅ (Fulfilled)
❌ → ❌ (Not fulfilled)
Individual Criteria (Trade Criteria):
Trade im Bias → Trade in Bias
BE Level → BE Level
Sweep → Sweep
Displacement → Displacement
Leg FVG geschlossen → Leg FVG Closed
FVG Reaktion → FVG Reaction
FVG Größe → FVG Size
Anzahl Kerzen → Number of Candles
Individual Criteria (Goals):
Equal H / L → Equal High/Low
Session H / L → Session High/Low
News H / L → News High/Low
HTF Swing Point → HTF Swing Point
HTF OB → HTF Order Block
HTF FVG → HTF FVG
Note Line:
Ziele zählen gemeinsam als 1 Punkt → Goals count together as 1 point
Important Note
This tool is not an automated indicator, but a visual decision aid for traders who want to apply their strategy in a structured and conscious way.

Price Action Smart Money Concepts [BigBeluga]THE SMART MONEY CONCEPTS Toolkit
The Smart Money Concepts [ BigBeluga ] is a comprehensive toolkit built around the principles of "smart money" behavior, which refers to the actions and strategies of institutional investors.
The Smart Money Concepts Toolkit brings together a suite of advanced indicators that are all interconnected and built around a unified concept: understanding and trading like institutional investors, or "smart money." These indicators are not just randomly chosen tools; they are features of a single overarching framework, which is why having them all in one place creates such a powerful system.
This all-in-one toolkit provides the user with a unique experience by automating most of the basic and advanced concepts on the chart, saving them time and improving their trading ideas.
Real-time market structure analysis simplifies complex trends by pinpointing key support, resistance, and breakout levels.
Advanced order block analysis leverages detailed volume data to pinpoint high-demand zones, revealing internal market sentiment and predicting potential reversals. This analysis utilizes bid/ask zones to provide supply/demand insights, empowering informed trading decisions.
Imbalance Concepts (FVG and Breakers) allows traders to identify potential market weaknesses and areas where price might be attracted to fill the gap, creating opportunities for entry and exit.
Swing failure patterns help traders identify potential entry points and rejection zones based on price swings.
Liquidity Concepts, our advanced liquidity algorithm, pinpoints high-impact events, allowing you to predict market shifts, strong price reactions, and potential stop-loss hunting zones. This gives traders an edge to make informed trading decisions based on liquidity dynamics.
🔵 FEATURES
The indicator has quite a lot of features that are provided below:
Swing market structure
Internal market structure
Mapping structure
Adjustable market structure
Strong/Weak H&L
Sweep
Volumetric Order block / Breakers
Fair Value Gaps / Breakers (multi-timeframe)
Swing Failure Patterns (multi-timeframe)
Deviation area
Equal H&L
Liquidity Prints
Buyside & Sellside
Sweep Area
Highs and Lows (multi-timeframe)
🔵 BASIC DEMONSTRATION OF ALL FEATURES
1. MARKET STRUCTURE
The preceding image illustrates the market structure functionality within the Smart Money Concepts indicator.
➤ Solid lines: These represent the core indicator's internal structure, forming the foundation for most other components. They visually depict the overall market direction and identify major reversal points marked by significant price movements (denoted as 'x').
➤ Internal Structure: These represent an alternative internal structure with the potential to drive more rapid market shifts. This is particularly relevant when a significant gap exists in the established swing structure, specifically between the Break of Structure (BOS) and the most recent Change of High/Low (CHoCH). Identifying these formations can offer opportunities for quicker entries and potential short-term reversals.
➤ Sweeps (x): These signify potential turning points in the market where liquidity is removed from the structure. This suggests a possible trend reversal and presents crucial entry opportunities. Sweeps are identified within both swing and internal structures, providing valuable insights for informed trading decisions.
➤ Mapping structure: A tool that automatically identifies and connects significant price highs and lows, creating a zig-zag pattern. It visualizes market structure, highlights trends, support/resistance levels, and potential breakouts. Helps traders quickly grasp price action patterns and make informed decisions.
➤ Color-coded candles based on market structure: These colors visually represent the underlying market structure, making it easier for traders to quickly identify trends.
➤ Extreme H&L: It visualizes market structure with extreme high and lows, which gives perspective for macro Market Structure.
2. VOLUMETRIC ORDER BLOCKS
Order blocks are specific areas on a financial chart where significant buying or selling activity has occurred. These are not just simple zones; they contain valuable information about market dynamics. Within each of these order blocks, volume bars represent the actual buying and selling activity that took place. These volume bars offer deeper insights into the strength of the order block by showing how much buying or selling power is concentrated in that specific zone.
Additionally, these order blocks can be transformed into Breaker Blocks. When an order block fails—meaning the price breaks through this zone without reversing—it becomes a breaker block. Breaker blocks are particularly useful for trading breakouts, as they signal that the market has shifted beyond a previously established zone, offering opportunities for traders to enter in the direction of the breakout.
Here's a breakdown:
➤ Bear Order Blocks (Red): These are zones where a lot of selling happened. Traders see these areas as places where sellers were strong, pushing the price down. When the price returns to these zones, it might face resistance and drop again.
➤ Bull Order Blocks (Green): These are zones where a lot of buying happened. Traders see these areas as places where buyers were strong, pushing the price up. When the price returns to these zones, it might find support and rise again.
These Order Blocks help traders identify potential areas for entering or exiting trades based on past market activity. The volume bars inside blocks show the amount of trading activity that occurred in these blocks, giving an idea of the strength of buying or selling pressure.
➤ Breaker Block: When an order block fails, meaning the price breaks through this zone without reversing, it becomes a breaker block. This indicates a significant shift in market liquidity and structure.
➤ A bearish breaker block occurs after a bullish order block fails. This typically happens when there's an upward trend, and a certain level that was expected to support the market's rise instead gives way, leading to a sharp decline. This decline indicates that sellers have overcome the buyers, absorbing liquidity and shifting the sentiment from bullish to bearish.
Conversely, a bullish breaker block is formed from the failure of a bearish order block. In a downtrend, when a level that was expected to act as resistance is breached, and the price shoots up, it signifies that buyers have taken control, overpowering the sellers.
3. FAIR VALUE GAPS:
A fair value gap (FVG), also referred to as an imbalance, is an essential concept in Smart Money trading. It highlights the supply and demand dynamics. This gap arises when there's a notable difference between the volume of buy and sell orders. FVGs can be found across various asset classes, including forex, commodities, stocks, and cryptocurrencies.
FVGs in this toolkit have the ability to detect raids of FVG which helps to identify potential price reversals.
Mitigation option helps to change from what source FVGs will be identified: Close, Wicks or AVG.
4. SWING FAILURE PATTERN (SFP):
The Swing Failure Pattern is a liquidity engineering pattern, generally used to fill large orders. This means, the SFP generally occurs when larger players push the price into liquidity pockets with the sole objective of filling their own positions.
SFP is a technical analysis tool designed to identify potential market reversals. It works by detecting instances where the price briefly breaks a previous high or low but fails to maintain that breakout, quickly reversing direction.
How it works:
Pattern Detection: The indicator scans for price movements that breach recent highs or lows.
Reversal Confirmation: If the price quickly reverses after breaching these levels, it's identified as an SFP.
➤ SFP Display:
Bullish SFP: Marked with a green symbol when price drops below a recent low before reversing upwards.
Bearish SFP: Marked with a red symbol when price rises above a recent high before reversing downwards.
➤ Deviation Levels: After detecting an SFP, the indicator projects white lines showing potential price deviation:
For bullish SFPs, the deviation line appears above the current price.
For bearish SFPs, the deviation line appears below the current price.
These deviation levels can serve as a potential trading opportunity or areas where the reversal might lose momentum.
With Volume Threshold and Filtering of SFP traders can adjust their trading style:
Volume Threshold: This setting allows traders to filter SFPs based on the volume of the reversal candle. By setting a higher volume threshold, traders can focus on potentially more significant reversals that are backed by higher trading activity.
SFP Filtering: This feature enables traders to filter SFP detection. It includes parameters such as:
5. LIQUIDITY CONCEPTS:
➤ Equal Lows (EQL) and Equal Highs (EQH) are important concepts in liquidity-based trading.
EQL: A series of two or more swing lows that occur at approximately the same price level.
EQH: A series of two or more swing highs that occur at approximately the same price level.
EQLs and EQHs are seen as potential liquidity pools where a large number of stop loss orders or limit orders may be clustered. They can be used as potential reverse points for trades.
This multi-period feature allows traders to select less and more significant EQL and EQH:
➤ Liquidity wicks:
Liquidity wicks are a minor representation of a stop-loss hunt during the retracement of a pivot point:
➤ Buy and Sell side liquidity:
The buy side liquidity represents a concentration of potential buy orders below the current price level. When price moves into this area, it can lead to increased buying pressure due to the execution of these orders.
The sell side liquidity indicates a pool of potential sell orders below the current price level. Price movement into this area can result in increased selling pressure as these orders are executed.
➤ Sweep Liquidation Zones:
Sweep Liquidation Zones are crucial for understanding market structure and potential future price movements. They provide insights into areas where significant market participants have been forced out of their positions, potentially setting up new trading opportunities.
🔵 USAGE & EXAMPLES
The core principle behind the success of this toolkit lies in identifying "confluence." This refers to the convergence of multiple trading indicators all signaling the same information at a specific point or area. By seeking such alignment, traders can significantly enhance the likelihood of successful trades.
MS + OBs
The chart illustrates a highly bullish setup where the price is rejecting from a bullish order block (POC), while simultaneously forming a bullish Swing Failure Pattern (SFP). This occurs after an internal structure change, marked by a bullish Change of Character (CHoCH). The price broke through a bearish order block, transforming it into a breaker block, further confirming the bullish momentum.
The combination of these elements—bullish order blocks, SFP, and CHoCH—creates a powerful bullish signal, reinforcing the potential for upward movement in the market.
SFP + Bear OB
This chart above displays a bearish setup with a high probability of a price move lower. The price is currently rejecting from a bear order block, which represents a key resistance area where significant selling pressure has previously occurred. A Swing Failure Pattern (SFP) has also formed near this bear order block, indicating that the price briefly attempted to break above a recent high but failed to sustain that upward movement. This failure suggests that buyers are losing momentum, and the market could be preparing for a move to the downside.
Additionally, we can toggle on the Deviation Area in the SFP section to highlight potential levels where price deviation might occur. These deviation areas represent zones where the price is likely to react after the Swing Failure Pattern:
BUY – SELL sides + EQL
The chart showcases a bullish setup with a high probability of price breaking out of the current sell-side resistance level. The market structure indicates a formation of Equal Lows (EQL), which often suggests a build-up of liquidity that could drive the price higher.
The presence of strong buy-side pressure (69%), indicated by the green zone at the bottom, reinforces this bullish outlook. This area represents a key support zone where buyers are outpacing sellers, providing the foundation for a potential upward breakout.
EQL + Bull ChoCh
This chart illustrates a potential bullish setup, driven by the formation of Equal Lows (EQL) followed by a bullish Change of Character (CHoCH). The presence of Equal Lows often signals a liquidity build-up, which can lead to a reversal when combined with additional bullish signals.
Liquidity grab + Bull ChoCh + FVGs
This chart demonstrates a strong bullish scenario, where several important market dynamics are at play. The price begins its upward momentum from Liquidity grab following a bullish Change of Character (CHoCH), signaling the transition from a bearish phase to a bullish one.
As the price progresses, it performs liquidity grabs, which serve to gather the necessary fuel for further movement. These liquidity grabs often occur before significant price surges, as large market participants exploit these areas to accumulate positions before pushing the price higher.
The chart also highlights a market imbalance area, showing strong momentum as the price moves swiftly through this zone.
In this examples, we see how the combination of multiple “smart money” tools helps identify a potential trade opportunities. This is just one of the many scenarios that traders can spot using this toolkit. Other combinations—such as order blocks, liquidity grabs, fair value gaps, and Swing Failure Patterns (SFPs)—can also be layered on top of these concepts to further refine your trading strategy.
🔵 SETTINGS
Window: limit calculation period
Swing: limit drawing function
Mapping structure: show structural points
Algorithmic Logic: (Extreme-Adjusted) Use max high/low or pivot point calculation
Algorithmic loopback: pivot point look back
Show Last: Amount of Order block to display
Hide Overlap: hide overlapping order blocks
Construction: Size of the order blocks
Fair value gaps: Choose between normal FVG or Breaker FVG
Mitigation: (close - wick - avg) point to mitigate the order block/imbalance
SFP lookback: find a higher / lower point to improve accuracy
Threshold: remove less relevant SFP
Equal H&L: (short-mid-long term) display longer term
Liquidity Prints: Shows wicks of candles where liquidity was grabbed
Sweep Area: Identify Sweep Liquidation areas
By combining these indicators in one toolkit, traders are equipped with a comprehensive suite of tools that address every angle of the Smart Money Concept. Instead of relying on disparate tools spread across various platforms, having them integrated into a single, cohesive system allows traders to easily see confluence and make more informed trading decisions.

PHEN ATLAS - Market Map & Playbook [PhenLabs]📊 PHEN ATLAS 🎂 #50 🎂
Version: PineScript™ v6
📌 Description
The PHEN ATLAS marks a historic milestone as the 50th official release from PhenLabs . This is a critical release you do not want to miss, serving as a comprehensive Market Map and Playbook designed to provide traders with a complete structural overview of price action. By synthesizing Market Structure, Liquidity concepts, and Regime detection, this script solves the problem of "analysis paralysis" by grading price action in real-time. It moves beyond simple indicators by offering a quantified "Playbook" that scores trade setups from 0 to 100, helping traders focus exclusively on high-probability opportunities while automating the complex math of position sizing and risk management.
🚀 Points of Innovation
Proprietary Scoring Engine: Unlike standard indicators, this script assigns a quantitative score (0-100) to every potential trade based on confluence factors like HTF alignment and displacement.
Dynamic Regime Detection: Features an integrated dashboard that classifies the market into specific phases (Expansion, Trend, Range) using ADX and EMA alignment logic.
Smart Liquidity Pools: Automatically identifies and visualizes resting liquidity, tracking when these pools are "swept" to generate high-probability reversal signals.
Integrated Trade Manager: Automates the calculation of Stop Loss, Take Profit (1:2 and 1:3), and Position Size based on account balance and risk percentage directly on the chart.
Multi-Mode Interface: Offers three distinct visual modes—Clean, Pro, and Sniper—allowing users to toggle between deep analysis and clutter-free execution instantly.
🔧 Core Components
Structure Module: Identifies Pivots, Break of Structure (BOS), and Change of Character (CHoCH) to define the current market bias.
Liquidity Engine: Plots liquidity pools at key swing points and detects "Sweeps" where price grabs liquidity before reversing.
Regime Filter: Uses a combination of EMAs (21/50) and ADX to determine if the market is trending or ranging, filtering out low-quality signals.
Setup Validator: Monitors for three specific setup types (Sweep, Snapback, FVG Retest) and triggers alerts only when specific scoring thresholds are met.
🔥 Key Features
Automated detection of High Timeframe (HTF) structure without repainting issues.
Real-time grading of price displacement to validate institutional intent.
Visual Risk/Reward boxes that automatically adjust to the volatility (ATR) of the asset.
Fair Value Gap (FVG) detection with auto-mitigation tracking to clean up the chart.
Customizable alerts for A+ setups, regime changes, and trade invalidations.
Detailed dashboard displaying current Trend, Phase, Bias, and the score of the last setup.
🎨 Visualization
Structure Points: Triangles for BOS and Diamonds for CHoCH events clearly mark trend shifts.
Liquidity Lines: Dotted lines extending from pivots indicate un-swept liquidity pools; these dim automatically when swept.
Setup Signals: Prominent "A+" labels appear on the chart when a setup meets the minimum score threshold defined by the user.
Risk Boxes: Color-coded boxes (Green for Long, Red for Short) show Entry, Stop Loss, and Take Profit levels visually.
Dashboard: A compact table in the bottom right corner provides a "Heads Up Display" of the market state.
📖 Usage Guidelines
Display Mode: Select between 'Clean' for signals only, 'Pro' for full analysis including FVGs and Structure, or 'Sniper' for only high-score setups.
HTF Timeframe: Sets the higher timeframe for structural analysis (Default: 240/4-Hour) to ensure you trade with the dominant trend.
Min Score for A+ Setup: Threshold (0-100) required to trigger a signal (Default: 83); increase this to filter for only the absolute best trades.
Risk %: Defines the percentage of your account you are willing to risk per trade (Default: 1.0%), used for the position size calculation.
Account Balance: Input your current capital (Default: 10,000) to receive accurate unit sizing for every trade setup.
ADX Threshold: Adjusts the sensitivity of the Regime detection filter (Default: 20) to determine when the market is trending versus ranging.
✅ Best Use Cases
Confluence Trading: Use the scoring system to filter discretionary entries, taking trades only when the system scores them above 80.
Prop Firm Trading: Utilize the built-in position size calculator to strictly adhere to risk management rules during evaluations.
Trend Following: Wait for the Regime Dashboard to show "Bullish Expansion" before taking Long "Snapback" entries.
Reversal Trading: Focus on "Sweep Reclaim" setups where price sweeps a liquidity pool and immediately closes back within range.
⚠️ Limitations
This tool is a trend-following and reversal system; it may produce lower scores during undefined, low-volatility chop.
The position size calculator is an estimation based on the entry candle; actual execution slippage is not accounted for.
HTF data relies on closed candles to prevent repainting, which may result in a slight lag during rapid volatility spikes.
💡 What Makes This Unique
Playbook Scoring: Most indicators just give a signal; PHEN ATLAS gives you a "Grade" (e.g., 85/100), allowing you to make informed decisions based on quality, not just frequency.
Context Awareness: The script understands "Market Regime" and creates a context-aware bias, rather than blindly firing signals in a range.
🔬 How It Works
Step 1 - Regime Definition: The script analyzes the 21/50 EMA relationship and ADX to define if the market is in a Trend or Range.
Step 2 - Structure & Liquidity: It maps key pivots and liquidity pools, waiting for a "Sweep" event or a structural break.
Step 3 - Setup Trigger: When a specific pattern occurs (like a Sweep Reclaim), the engine calculates a score based on displacement, volume, and key level alignment.
Step 4 - Execution Logic: If the score > Threshold, the Trade Manager calculates the invalidation point (SL) and projects 2R/3R targets automatically.
🎉 Message From The Team 🎉
2025 was an amazing year. 12 months of building, shipping, and improving together with you. Hitting our 50th indicator release marks one full year of weekly drops , and we couldn't have done it without this community, and of course, BIG thank you to TradingView and it's team.
Thank you for all the feedback, charts, and support. Let's make 2026 even bigger. We can't wait to show you what we've been working on. 🚀
💡 Note
For best results, we recommend using the "Pro" mode during analysis to understand the narrative, and switching to "Sniper" or "Clean" during execution to maintain focus. Always ensure your "Account Balance" input matches your broker balance for accurate risk calculations.

[ST] Killzones - Minimal Killzones — Minimal
User Manual
1. Purpose of the Indicator
Killzones — Minimal is a session-based market structure tool designed to highlight the highest-liquidity time windows of the trading day.
Instead of generating signals, this indicator provides context by visually marking the ICT Killzones, allowing the trader to:
Identify where liquidity is built
See which session created the range
Anticipate where liquidity is likely to be taken
Align SMC / Wyckoff / Order Flow analysis with time-based institutional behavior
This tool is especially effective for Crypto, Forex, and Indices, where markets run continuously and liquidity cycles matter more than exchange open times.
2. Killzones Covered (São Paulo Time – UTC-3)
The indicator draws one minimal, dotted box per session:
Session Time (SP) Role in Market Structure
ASIA 21:00 – 03:00 Range formation & liquidity buildup
LONDON 04:00 – 07:00 First liquidity raid & manipulation
NEW YORK (Killzone) 10:00 – 13:00 True displacement & delivery
These are ICT Killzones, not official stock exchange open times.
3. Visual Design Philosophy
The indicator is intentionally minimalist:
Dotted borders → no visual clutter
Optional fill → focus on structure, not noise
No signals or arrows → forces contextual reading
One box per session → clean session boundaries
The goal is to let price action and liquidity tell the story, not indicators.
4. How the Boxes Behave
Each session box:
Starts on the first candle of the session
Expands dynamically to include the session High and Low
Stops updating once the session ends
Remains fixed on the chart as historical context
This allows you to instantly see:
Which session created the current range
Where stop-loss clusters are likely resting
Which session was manipulated or delivered price
5. How to Use the Indicator (Practical Workflow)
Step 1 — Identify the Current Session
Ask:
Are we inside Asia, London, or New York?
Your expectations should change depending on the session.
Step 2 — Read Session Intent
ASIA
Expect compression and balance
Focus on identifying Asia High / Asia Low
Avoid aggressive trades inside the range
LONDON
Look for liquidity raids on Asia High/Low
Many London moves are manipulative
A failed raid is often a setup for NY
NEW YORK
Look for true displacement
High probability of:
Continuation
Reversal after a sweep
Best session to execute trades
Step 3 — Trade Liquidity, Not Candles
Use the boxes as liquidity maps, not entries.
High-probability ideas come from:
Asia range being swept during London
London manipulation being reversed during NY
NY taking remaining liquidity and delivering direction
6. Example Use Cases
Setup 1 — Asia Range Sweep
Asia forms a tight range
London sweeps Asia High or Low
Price fails to continue
Market shifts structure
Entry on OB / FVG toward the opposite side
Setup 2 — London Manipulation → NY Delivery
London sweeps liquidity but stalls
New York opens
NY takes the opposite side liquidity
Strong displacement occurs
Entry on NY pullback
Setup 3 — Session Breakout
No sweep
Immediate strong displacement
Clean continuation
Trade only after confirmation
7. What NOT to Do
Do not trade inside the middle of session boxes
Do not assume every sweep means reversal
Do not force trades without structure shift
Do not treat sessions as signals
The indicator shows where to pay attention, not when to click Buy or Sell.
8. Best Confluence Tools
This indicator works best when combined with:
Market Structure (BOS / CHoCH)
Order Blocks
Fair Value Gaps
Liquidity pools
Volume-based candle analysis (e.g. CandleFlow)
9. Final Notes
Killzones — Minimal is a contextual framework, not a strategy.
If you wait for:
Liquidity to be taken
Structure to shift
Price to confirm intent
You will trade with the market narrative, not against it.
Time reveals intent. Liquidity confirms it.

Simple Liquidity Zones [Supertrade]🔎 What this indicator does
This indicator is designed to highlight liquidity sweep zones on the chart.
• A liquidity sweep occurs when price briefly breaks above a recent swing high or below a recent swing low, but fails to close beyond it.
• Such behavior often indicates that price has taken liquidity (stop orders resting above highs or below lows) and may reverse.
The indicator marks these events as bullish or bearish liquidity zones:
• Bullish Zone (green) → Price swept a swing low and closed back above it (possible bullish reversal area).
• Bearish Zone (red) → Price swept a swing high and closed back below it (possible bearish reversal area).
These zones are drawn as shaded horizontal bands that extend forward in time, providing visual areas where liquidity grabs occurred.
________________________________________
⚙️ How calculations are made
The indicator does not use moving averages or smoothing.
Instead, it works with raw price action:
1. Swing Detection → It checks the highest high and lowest low of the past N bars (swing length).
2. Sweep Logic →
o A bearish sweep happens if the high breaks above the previous swing high, but the close returns below that level.
o A bullish sweep happens if the low breaks below the previous swing low, but the close returns above that level.
3. Zone Creation → When a sweep is detected, a shaded zone is drawn just above/below the swing level.
4. Persistence → Zones extend into the future until replaced by new ones (or optionally until price fully trades through them).
This makes the calculations simple, transparent, and responsive to actual market structure without lag.
________________________________________
📈 How it helps traders
This tool helps traders by:
• Visualizing liquidity areas → Shows where price previously swept liquidity and may act as support/resistance.
• Identifying reversals → Helps spot potential turning points after liquidity grabs.
• Risk management → Zones highlight areas where stops may be targeted, useful for positioning stop-loss orders.
• Confluence tool → Works best when combined with other strategies such as order blocks, trendlines, or volume analysis.
⚠️ Note: Like all indicators, this should not be used in isolation. It provides context, not guaranteed trade signals.
________________________________________
🏦 Markets & Timeframes
• Works across all markets (crypto, forex, stocks, indices, commodities).
• Particularly effective in high-liquidity environments where stop-hunting is common (e.g., forex majors, BTC/ETH, S&P500).
• Timeframes:
o Lower timeframes (1m–15m) → Scalpers can spot intraday liquidity sweeps.
o Higher timeframes (1H–1D) → Swing traders can identify major liquidity pools.
________________________________________

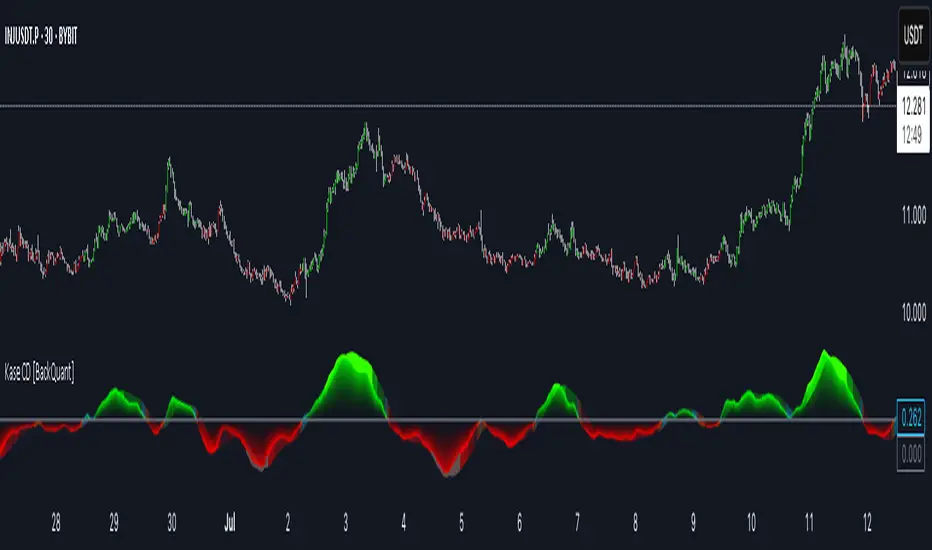
Kase Convergence Divergence [BackQuant]Kase Convergence Divergence
The Kase Convergence Divergence is a sophisticated oscillator designed to measure directional market strength through the lens of volatility-adjusted log return structures. Inspired by Cynthia Kase’s work on statistical momentum and price projection ranges, this unique indicator offers a hybrid framework that merges signal processing, multi-length sweep logic, and adaptive smoothing techniques.
Unlike traditional momentum oscillators like MACD or RSI, which rely on static moving average differences, KCD introduces a dual-process system combining:
Kase-style statistical range projection (via log returns and volatility),
A sweeping loop of lookback lengths for robustness,
First and second derivative modes to capture both velocity and acceleration of price movement.
Core Logic & Computation
The KCD calculation is centered on two volatility-normalized transforms:
KSDI Up: Measures how far the current high has moved relative to a past low, normalized by return volatility.
KSDI Down: Measures how far the current low has moved relative to a past high, also normalized.
For every length in a user-defined sweep range (e.g., 25–35), both KSDI_up and KSDI_dn are computed, and their maximum values across the loop are retained. The difference between these two max values produces the raw signal:
KPO (Kase Projection Oscillator): Measures directional skew.
KCD (Kase Convergence Divergence): Defined as KPO – MA(KPO) — similar in spirit to MACD but structurally different.
Users can choose to visualize either the first derivative (KPO) , or the second derivative (KCD) , depending on market conditions or strategy style.
Key Features
✅ Multi-Length Sweep Logic: Improves signal reliability by aggregating statistical range projections across a set of lookbacks.
✅ Advanced Smoothing Modes: Supports DEMA, HMA, TEMA, LINREG, WMA and more for dynamic adaptation.
✅ Dual Derivative Modes: Choose between speed (first derivative) or smoothness (second derivative) to fit your trading regime.
✅ Color-Encoded Signal Bands: Heatmap-style oscillator coloring enhances visual feedback on trend strength.
✅ Candlestick Painting: Optional bar coloring makes it easy to spot trend shifts on the main chart.
✅ Adaptive Fill Zones: Green and red fills between the oscillator and zero line help distinguish bullish and bearish regimes at a glance.
Practical Applications
📈 Trend Confirmation: Use KCD as a secondary confirmation layer after breakout or pullback entries.
📉 Momentum Shifts: Crossover and crossunder of the zero line highlight potential regime changes.
📊 Strategy Filters: Incorporate into algos to avoid trendless or mean-reverting environments.
🧪 Derivative Switching: Flip between KPO and KCD modes depending on whether you want to measure acceleration or deceleration of price flow.
Alerts & Signals
Two built-in alerts help you catch regime shifts in real time:
Long Signal: Triggered when the selected oscillator crosses above zero.
Short Signal: Triggered when it crosses below zero.
These events can be used to generate entries, exits, or trend validation cues in multi-layer systems.
Conclusion
The Kase Convergence Divergence goes beyond traditional oscillators by offering a volatility-normalized, derivative-aware signal engine with enhanced visual dynamics. Its sweeping architecture and dynamic fill logic make it especially powerful for identifying trending environments, filtering chop, and adding statistical rigor to your trading toolkit.
Whether you’re a discretionary trader seeking precision, or a quant looking to model more robust return structures, KCD offers a creative yet analytically grounded solution.
Ahmed Gold Signals - 5M LIVE (Frequent)📈 Gold (XAUUSD) Trading Signals – Precision-Based Strategy
Our Gold signals are built on pure price action, not random indicators or guesswork.
🔍 How our signals are generated
We focus on:
🧲 Liquidity Sweeps
Identifying when price grabs stop-losses above highs or below lows and then reverses
📊 Clear trend direction using EMA 50 & EMA 200
✅ Strong confirmation candles after the sweep
🎯 Entries only in the direction of the trend to increase accuracy
🔵 BUY Signals
Bullish market structure
Price sweeps liquidity below recent lows
Strong bullish confirmation candle closes
➡️ High-probability BUY setup
🔴 SELL Signals
Bearish market structure
Price sweeps liquidity above recent highs
Strong bearish confirmation candle closes
➡️ High-probability SELL setup
⏱️ Timeframe
5-minute chart (5M)
Fast, precise signals ideal for scalping Gold
🛡️ Risk Management
Stop loss placed beyond the liquidity sweep
Clear take-profit targets
Risk-to-reward typically 1:2 or better
⚠️ Important Notes
We do not trade every move
We wait for confirmation
Quality over quantity — always

FVG HTF# FVG HTF — Higher‑Timeframe Fair Value Gaps
## Summary
- Plots higher‑timeframe Fair Value Gap (FVG) zones directly on your current chart.
- Tracks fill progress using four methods: Any Touch, Midpoint Reached, Wick Sweep, Body Beyond.
- Shows optional labels with timeframe source and live fill percentage; label text color is configurable.
- Designed for clean overlays and efficient rendering with limits on graphics and bars processed.
## What It Does
- Detects bullish and bearish FVGs from a chosen timeframe (or the chart timeframe) and renders:
- Zone Top/Bottom lines and a dotted midpoint line
- Semi‑transparent area fill between the edges
- Optional label at the midpoint with a tooltip showing zone prices
- Continuously updates zones forward and removes them when the selected fill condition is met.
## Inputs
- `Enable FVG` (`fvgSH2`): Toggle detection/plotting on/off.
- `Timeframe` (`fvgTF2`): Choose `Chart` or HTFs (`5 Minutes`, `15 Minutes`, `1 Hour`, `4 Hours`, `1 Day`, `1 Week`, `1 Month`).
- `Fill Method` (`fvgFill2`):
- Any Touch — wick or body touches any part of the zone
- Midpoint Reached — price reaches at least the 50% of the zone
- Wick Sweep — wick fully travels past the far edge and back inside (conceptually stricter than touch)
- Body Beyond — candle body closes beyond the opposite edge (strong confirmation)
- `Zones` colors (`fvgCb2`, `fvgCs2`): Bullish/Bearish zone colors.
- `Labels` (`fvgLB2`): Show/Hide on‑chart labels.
- `Label Color` (`fvgLBc2`): Color picker for label text (default: white).
- `Max Bars Back` (`maxBars2`): Limits processing to recent bars for performance.
## Timeframe Rules
- The helper `htfTF` prevents selecting a timeframe lower than the chart. If an invalid lower TF is chosen, it falls back to `timeframe.period`.
- Supports minute, daily, weekly, and monthly aggregations that are safe for intraday/daily/weekly charts.
## Detection Logic
- Uses rolling higher‑timeframe bars constructed on the fly and checks 3‑bar displacement patterns:
- Bullish FVG: current HTF low above the high two bars ago AND previous HTF close above that high, with no direct gap condition.
- Bearish FVG: current HTF high below the low two bars ago AND previous HTF close below that low, with no direct gap condition.
- On detection, the script creates an FVG object with:
- Top/Bottom lines (`lnTop`, `lnBtm`) and midpoint line (`lnAvg`)
- Midpoint label (`lbTxt`) showing source timeframe and updating fill percentage
- Semi‑transparent fill (`linefill`) for visual clarity
## Fill Tracking
- Fill threshold depends on selected method:
- Any Touch: opposite edge
- Midpoint Reached: zone’s midpoint
- Wick Sweep: stricter condition conceptually (implemented as an opposite‑edge threshold)
- Body Beyond: requires close beyond the opposite edge
- Each bar updates label x‑position and line endpoints forward; the label text shows the best fill ratio achieved.
- When the threshold is reached, the FVG (label, lines, fill) is removed from the chart.
## Best Practices
- Start with `Any Touch` to visualize broad repairs; switch to `Body Beyond` for conservative confirmations.
- Use `1 Hour` or `4 Hours` overlays on 5m–15m charts for context; `1 Day` on 1H charts; `1 Week` on daily charts.
- Keep labels on when monitoring fills intraday; hide labels for clean higher‑level context.
- Adjust `Max Bars Back` if performance is impacted by many zones.
## Repainting Notes
- HTF zones are computed on `timeframe.change(tf)` and therefore confirm on HTF bar closes.
- Label endpoints extend each bar; detection itself avoids lookahead bias. For strict confirmation, align entries with HTF closes.
## Limitations
- “Wick Sweep” is treated as a stricter touch to the far edge; it does not enforce a separate “return inside” bar state.
- Label text color applies uniformly to bull/bear labels. If you need separate colors per side, contact the author.
## Credits & Version
- Pine Script v6; © rithsilanew2020
## Quick Start
1. Enable FVG and choose your HTF (e.g., `1 Hour`).
2. Pick a Fill Method (start with `Any Touch`).
3. Select zone colors and label text color.
4. Set `Max Bars Back` as needed for performance.
5. Use labels/tooltip values (Top/Mid/Bottom) to plan entries and manage risk.

Smart Money Setup 08 [TradingFinder] Binary Options Gold Scalper🔵 Introduction
In the Smart Money methodology, the market is understood as a structure driven by liquidity flow. This structure forms through the movement of large orders, the accumulation of liquidity, and the reactions that occur around key price zones. The logic of Smart Money is based on the idea that price movement is not random and usually evolves with the intention of collecting liquidity and creating price inefficiencies known as imbalances.
Within this framework, several important stages including the liquidity sweep, the formation of a point of interest, the appearance of an imbalance and the transition of market structure play major roles and collectively define the broader direction of price.
In many bullish scenarios, the market begins by sweeping sell side liquidity and targeting important lows in order to collect the liquidity resting below them. This liquidity collection often becomes the starting point for creating a point of interest which usually marks the area where Smart Money begins to enter the market.
After price moves away from this point, it breaks a structural high and forms a change of character. This shift marks a transition in the balance of power between buyers and sellers and is considered the first clear signal that the market structure is changing.
After the change of character, new institutional order flow often creates a strong and rapid movement that leaves behind an imbalance. This imbalance is one of the most important elements in Smart Money analysis because price tends to return to this area in order to complete structure and restore balance.
The return into the imbalance becomes meaningful when it occurs together with the liquidity sweep, the presence of a validated point of interest and a confirmed structural transition. These conditions frequently mark the beginning of powerful movements within the Smart Money cycle.
Understanding the sequence of liquidity, point of interest, imbalance, change of character and market structure builds the foundation of Smart Money analysis and provides a clear view of the true direction of institutional strength.
Bullish Setup :
Bearish Setup :
🔵 How to Use
To use this framework effectively, the trader must analyze the market through the principles of Smart Money and observe how liquidity drives price. A trade becomes valid only when several essential components appear together in a clear and consistent order.
These components include the liquidity sweep, the formation of a point of interest, the confirmation of a change of character, the transition of market structure and the return of price into an imbalance. The method is built on the understanding that the market first collects liquidity, then shifts order flow and finally provides an entry opportunity inside an inefficient area or inside a point of interest.
For this reason, the trader must follow the path of liquidity from the moment the sweep occurs, through the point of interest and the change of character and finally into the return of price toward the imbalance. When applied correctly, this approach creates entries that are more precise, more structural and more aligned with the real behavior of the market rather than with superficial signals.
🟣 Long Position
A bullish setup in Smart Money structure begins with a liquidity sweep on the sell side. The market first targets the areas where sell side liquidity is located and collects the stops and resting liquidity under previous lows. This collection is the condition that Smart Money requires to begin creating a new order flow. After this liquidity has been taken, a point of interest forms which is usually the last bearish candle or the effective demand zone that initiated the upward movement.
Price then moves away from the point of interest and breaks a structural high which creates a change of character. This event confirms that the market structure has moved from a bearish state to a bullish one and that buying pressure has taken control of the order flow. Following this shift, a strong upward movement often occurs and creates an imbalance between candles. This imbalance reflects the entrance of strong Smart Money orders and is seen as an important confirmation of bullish strength.
When price returns to this imbalance after the displacement, the market enters a phase where Smart Money aims to complete the corrective movement and continue the upward direction. The reaction inside the imbalance when combined with the liquidity sweep, the confirmed point of interest and the change of character completes the bullish setup and forms a structure that often leads to a continuation of the bullish trend.
🟣 Short Position
A bearish setup follows the same Smart Money logic but in the opposite direction. The market begins by collecting buy side liquidity and targets the highs where buy side liquidity and resting stops are located. This liquidity sweep on the buy side becomes the starting phase for Smart Money to initiate a downward order flow. After the liquidity is collected, a bearish point of interest forms which is usually the last bullish candle or the supply zone that created the initial drop.
Price then moves away from this point and breaks the first structural low. This creates a change of character to the downside which confirms that the market structure has transitioned from bullish to bearish and that selling pressure has gained control. After this shift, a strong downward displacement appears and leaves behind a bearish imbalance that clearly shows the dominance of sellers.
As price returns to this imbalance and corrects the inefficient movement, the bearish setup becomes complete as long as the market structure remains bearish. The combination of the buy side liquidity sweep, the bearish point of interest, the change of character, the imbalance and the corrective return creates the ideal structure that Smart Money uses to continue the downward movement and develop a reliable selling opportunity.
🔵 Settings
🟣 Logic Settings
Pivot Period : Defines how many bars are analyzed to identify swing highs and lows. Higher values detect larger, slower structures, while lower values respond to faster patterns. The default value of 5 offers a balanced sensitivity.
🟣 Alert Settings
Alert : Enables alerts for SMS08.
Message Frequency : Determines the frequency of alerts. Options include 'All' (every function call), 'Once Per Bar' (first call within the bar), and 'Once Per Bar Close' (final script execution of the real-time bar). Default is 'Once per Bar'.
Show Alert Time by Time Zone : Configures the time zone for alert messages. Default is 'UTC'.
🔵 Conclusion
The Smart Money approach demonstrates that price movement is not random or based on surface level patterns. Instead, it develops through a clear cycle of liquidity collection, structural transition and corrective movement toward key price zones. By recognizing events such as the liquidity sweep, the formation of the point of interest, the change of character and the return into the imbalance, the trader gains the ability to understand order flow more accurately and identify the true direction of market structure.
Both bullish and bearish setups show that the alignment of these elements creates a transparent view of institutional behavior and reveals the source of strong movements in the market. When the trader correctly identifies this sequence, entry points become more reliable and more aligned with liquidity flow. The combination of liquidity, structure and imbalance provides a consistent framework that removes guesswork and guides decisions through the real logic of the market.

Smart Money Decoded [GOLD]Title: Smart Money Decoded
Description:
Introduction
Smart Money Decoded is a comprehensive, institutional-grade visualization suite designed to simplify the complex world of Smart Money Concepts (SMC). While many indicators flood the chart with noise, this tool focuses on clarity, precision, and high-probability structure.
This script is built for traders who follow the "Inner Circle Trader" (ICT) methodologies but struggle to identify valid Zones, Displacement, and Liquidity Sweeps in real-time.
💎 Key Features & Logic
1. Refined Market Structure (BOS & CHoCH)
Instead of marking every minor pivot, this script uses a filtered Swing High/Low detection system.
HH/LL/LH/HL Labels: Only significant structure points are mapped.
BOS (Break of Structure): Marks trend continuations in the direction of the bias.
CHoCH (Change of Character): Marks potential trend reversals.
2. Advanced Order Blocks (with "Strict Mode")
Not all down-candles before an up-move are Order Blocks. This script separates the weak from the strong.
Standard OBs: Visualized with standard transparency.
⚡ SWEEP OBs (High Probability): Order Blocks that explicitly swept liquidity (Stop Hunt) before the reversal are highlighted with a thicker border, brighter color, and a ⚡ symbol. These are your high-probability "Turtle Soup" entries.
Strict Mode Toggle: In the settings, you can choose to hide all weak OBs and only see the ones that swept liquidity.
3. Dynamic Breaker Blocks
A true ICT Breaker is a failed Order Block that trapped liquidity.
This script automatically detects when a valid OB is mitigated (broken through) and projects it forward as a Breaker Block.
This ensures you are trading off valid flipped zones (Support becomes Resistance, Resistance becomes Support).
4. Fair Value Gaps (FVG)
Automatically detects Imbalances (Imbalance/Inefficiency).
Includes an ATR Filter to ignore tiny, insignificant gaps, keeping your chart clean.
Option to show the Consequent Encroachment (50% CE) level for precision entries.
5. Liquidity Zones (BSL / SSL)
Automatically plots Buy Side Liquidity (BSL) and Sell Side Liquidity (SSL) at key swing points.
Once price sweeps these levels, the zone is removed or marked as "Swept," helping you identify when the draw on liquidity has been met.
6. Institutional Data Panel
A dashboard in the top right corner displays:
Market Bias: Bullish/Bearish/Neutral based on structure.
Premium/Discount: Tells you if price is in the expensive (Premium) or cheap (Discount) part of the current dealing range.
Active Zones: Counts of current open arrays.
⚙️ How To Use This Indicator
Identify Bias: Look at the Structure Labels (HH/LL) and the Panel. Are we making Higher Highs?
Wait for the Trap: Look for a Liquidity Sweep (BSL/SSL taken) or a ⚡ Sweep OB.
Entry Confirmation: Watch for a return to a Fair Value Gap (FVG) or a retest of a Breaker Block (BRK).
Manage Risk: Use the visuals to place stops above/below invalidation points.
Customization:
Go to the settings to toggle "Strict Mode" for Order Blocks, change colors to match your theme, or adjust the lookback periods to fit your specific asset (Forex, Crypto, or Indices).
📚 Credits & Acknowledgments
This script is an educational tool based on the public teachings of Michael J. Huddleston (The Inner Circle Trader - ICT).
Concepts used: Order Blocks, Breakers, FVGs, Market Structure, Liquidity Pools.
Credit is fully given to ICT for originating these concepts and sharing them with the world.
⚠️ Disclaimer
This script is NOT affiliated with, endorsed by, or connected to Michael J. Huddleston (ICT) in any way. It is an independent coding project intended for educational purposes and visual assistance.
Trading involves substantial risk. This indicator does not guarantee profits. Always use proper risk management. Trust your analysis first, and use indicators as confluence.
#Smart Money Concepts, #SMC, #ICT,#Liquidity, #Market Structure, #Trend, #Price Action.

cd_sfp_CxGeneral:
This indicator is designed to assist users who trade the Swing Failure Pattern ( SFP ).
In technical literature (various definitions exist), an SFP is a situation where the price violates a previous swing level but fails to close beyond that level.
• (Liquidity Sweep)
• (Buyer or seller dominance)
• (Stop hunt)
• (Turtle Soup)
The general strategy is built upon seeking trade opportunities after an SFP is formed and conviction is established that the market direction has changed.
Components used to gather confirmation:
• Determining Bias: Periodic SAR
• Obtaining Breakout/Reversal Confirmation: Change in State Delivery (CISD)
• Defining the Buyer/Seller Block (Supply/Demand Zones): Mitg Blocks (Mitigation Blocks), FVG (Fair Value Gaps), and Standard Deviation Projection
• Key Levels: Previous HTF (Higher Time Frame) levels
• Setting Targets: Standard Deviation Projection
• Trade Management: Anchored VWAP and opposing blocks
• Time-Based Context: Session Killzone times
• Notifications: An alarm/alert system will be utilized to stay informed.
________________________________________
Details:
Swing and Swing Failure Pattern:
Swing Sweep Types (Liquidity Sweep):
1. Single
2. Consecutive (The liquidity of the entity that swept the liquidity is being swept)
Bias Determination
We need to filter out the numerous SFPs that occur across all time frames. Our first strong filter will be the Bias. We will only look for trades aligned with our bias.
We will use Periodic SAR (Stop and Reverse) to determine the bias. We compare the price with the SAR value from a Higher Time Frame than the one we are trading on.
• Price > SAR => Bullish Bias
• Price < SAR => Bearish Bias
Depending on the pair, H1 SAR may be chosen for scalp trades, and Daily/Weekly SAR for intraday and swing trades.
Key Levels
Strategies looking for trades after a liquidity grab generally state that the sweep / stop hunt movement should occur at a significant price level.
The most fundamental Key Level levels are (User can customize):
• Previous Week High & Low
• Previous Day High & Low
• Previous H4 High & Low
• Previous H1 High & Low
• Asia Killzone High & Low
• London Killzone High & Low
• New York Killzone High & Low
• Monday Range High & Low values
We will prefer SFP formations that occur when these levels are swept. When Key Levels are violated, an information label appears on the screen.
Blocks / Zones
To strengthen our hand, we will use three types of blocks/zones, either with Key Levels or separately. When an SFP structure is formed in these areas (along with bias and breakout confirmation), our expectation is for the price to continue in our desired direction. These regions are:
1. Mitigation Blocks (Mtg)
o (Details can be found in the cd_VWAP_mtg_Cx indicator)
o In short: A second candle, following a bullish candle, crosses its high but fails to close above it. We call this a sweep / SFP. When the price, which was expected to go to the low, instead makes a new high/close, an Mtg block is formed. (Buyers are dominant)
2. FVGs (Fair Value Gaps)
o We use classic FVG structures.
3. Standard Deviation Projection Boxes
o When we get an SFP structure + breakout confirmation (CISD), we use the Standard Deviation Projection to determine our profit-taking and take-profit levels.
o Based on the idea that the price often respects the range between -2 and -2.5 of the projection values, we box this range and use it as our area of interest. (Our expectation is for the price to reverse after reaching this target).
o Let's mark it on the chart.
Confirmation
To summarize what has been explained so far: we look for the price to form an SFP structure in levels/zones we deem important, aligned with our bias, and for the breakout to be confirmed with a CISD.
No single component is strong on its own, but the success rate increases when they occur together.
We observe the following as additional confirmation along with the CISD: a new Mtg block forming in the direction of the breakout, high-volume movement (with FVG and a large body), and respect for VWAPs, the resistance/support line, and the defense block.
Additional Confirmations with Breakouts:
• Defence block, new mtg and VWAP
• Resistance / Support Line:
Indicator Signals
The indicator marks all formed sweeps, selected key levels, blocks, the projection, and CISD confirmations on the screen. The candle where the CISD confirmation occurs is indicated by an arrow.
• Arrows with double short lines signify a CISD that follows an SFP occurring at a Key Level.
• All other CISD candle indications are shown with single-line arrows.
Trade Management
When selecting profit targets in trades (preferably), the projection, opposing blocks, and structures that have formed are taken into account. Do not neglect to look at the structures that have formed against you when entering a trade.
Menu Settings:
• For Mtg blocks, the trading timeframe or a higher timeframe can be selected.
• FVGs formed in the current timeframe are displayed when the price creates an SFP (in "Fvg" option).
• Deviation boxes are displayed when the price creates an SFP (in box).
• The SAR HTF setting (H1) for scalp trades may vary depending on the pair. Users trying trades on higher timeframes should increase the HTF setting.
o Example: If you are looking for a trade with an SFP structure on H1, the SAR HTF setting should be H4 or higher.
• VWAP lines are refreshed starting from the candle that executed the sweep when the price forms an SFP. The only setting to adjust is the source selection setting (hlc3 is selected).
• Time frames and Killzone / Special Zone settings for Key Levels can be changed/should be checked.
Alarms / Alerts:
The conditions that will trigger an alert can be selected from the menu.
• To receive an alert aligned with the bias, the "Alignment with bias" checkbox must be selected.
• The alert should be set on the timeframe where you plan to enter the trade.
• The display options do not affect the alarm conditions. (Example: FVGs are monitored even when the menu selection is "off").
• If the necessary conditions are met, the alarm is triggered on the new candle that opens after the CISD confirmation.
• The alarm will not be triggered more than once at the same Key Level.
The user can preferably select alerts:
• Bias-aligned or Bias-independent
• Sweep (without waiting for CISD)
• Sweep + CISD (without looking for other conditions)
• Sweep + Key Level + CISD (the swept level is a Key Level)
• Sweep + Mtg / Fvg / Dev. + CISD (SFP formed in any of the blocks)
• Sweep + Mtg + CISD (SFP formed in the Mtg block)
• Sweep + Fvg + CISD (SFP formed inside the FVG)
• Sweep + Deviation Box + CISD (SFP formed inside the Dev. Box)
• Sweep + Key Level + Mtg / Fvg / Dev. + CISD (SFP formed simultaneously at a Key Level and any of the blocks)
Trade Example:
• Conditions: Bias-aligned + Sweep + Mtg/Fvg/Dev (at least one) + CISD
• Extra Confirmations: Respect for the Defense Block + Respect for VWAP
• Target (TP): Projection between -2 and -2.5
I welcome your thoughts and suggestions regarding my indicator, which I believe will be successful in the long run by adhering to uncompromising risk management and a strict trading plan.
Happy Trading!

Rage of UltronRage of Ultron - Multi-Timeframe Smart Money Trading System
Advanced Confluence-Based Trading Indicator
Rage of Ultron is a comprehensive multi-timeframe trading system that combines Smart Money Concepts (SMC) with macro market context, RSI divergences, liquidity sweeps, and volume analysis to identify high-probability setups across all markets.
Key Features
Multi-Timeframe Alignment
* Weekly Bias - Directional trend context
* Daily Structure - Order Blocks and Fair Value Gaps
* 4H Confirmation - Entry timing and execution
* Real-time MTF alignment scoring (🟢 Bull Aligned / 🔴 Bear Aligned / 🟡 Mixed)
Smart Money Concepts
* Order Blocks (OB) - Institutional entry zones with visual clarity
* Fair Value Gaps (FVG) - Price imbalances and retracement magnets
* Change of Character (CHoCH) - Market structure breaks (▲▼)
* Liquidity Sweeps - Stop hunt detection before reversals (💧)
Technical Analysis
* RSI Divergences - Regular and hidden divergences with zones (◆)
* RSI Swing Failure Patterns - Grade-A reversal setups (★)
* Automatic Fibonacci - Dynamic retracements and extensions
* Volume Impulse Detection - Weighted confirmation signals
Macro Market Radar
* DXY - Dollar strength assessment
* BTC Dominance - Crypto market risk gauge
* USDT Dominance - Stablecoin flow analysis
* Combined risk environment scoring
Confluence Scoring System (0-7)
Quantified setup quality with three alert tiers:
* Tier 1 (Score 6-7): Full confluence + sweep + volume + MTF alignment
* Tier 2 (Score 5): High confluence + volume or sweep
* Tier 3 (Score 4): Standard confluence setups
"Rage" Volume State
* 🟢 RAGE PULSE - Explosive volume spike (score 6+ trigger)
* ⚡ Active - Strong volume with good confluence
* 🟡 Stable - Moderate volume conditions
* 🔴 Dormant - Low volume, wait for confirmation
Visual Design
* Clean Zone Rendering - Persistent OB/FVG boxes with limited extension
* Signal Bar Highlighting - Colored fills and contrasting borders for instant recognition
* Dynamic Symbol Placement - ATR-based offset prevents overlap
* Comprehensive Panel - Real-time macro + trade metrics in one view
* Toggleable Legend - Learn signals, hide once familiar
How to Use
1. Set Your Timeframes - Default 1W/1D/4H works for swing trading
2. Monitor Macro Environment - Check risk-on/off context
3. Wait for Confluence ≥4 - Let multiple signals align
4. Enter on Tier 1/2 Alerts - Best probability setups
5. Use Fib Extensions for Targets - Systematic profit taking
Customizable Settings
* Multi-timeframe periods
* RSI length and divergence sensitivity
* Liquidity sweep parameters
* Fibonacci swing lookback
* Volume thresholds
* Shape offset multiplier
* Visual toggles (Fibs, extensions, legend)
Built-in Alert System
Three-tier alert structure lets you filter by setup quality. Set alerts for Tier 1 only for highest conviction trades, or include Tier 2 for more opportunities.
Best Practices
* Use on clean timeframes - 1H+ for less noise
* Combine with support/resistance - Zones near key levels = highest probability
* Respect the macro - Don't fight extreme risk-off environments
* Wait for the full stack - Best trades have 4+ aligned signals
* Practice on demo first - Learn signal behavior in your market
Works On
* Cryptocurrency (spot & futures)
* Forex pairs
* Stock indices
* Individual stocks
* Commodities
Note: This indicator identifies potential setups but does not guarantee profits. Always use proper risk management, position sizing, and stops. Past performance does not predict future results.
Created by cdotgnz | For educational purposes

Supply & Demand Sniper369Indicator Philosophy: The Convergence of Structure and Liquidity
The Supply & Demand Sniper369 is not just another signal generator; it is a professional-grade execution framework built on the principles of Institutional Order Flow and Liquidity Engineering. While standard indicators often lag or provide signals in "no-man's land," this script is designed to identify high-probability reversal points by combining macro-structural zones with micro-execution triggers.
What Makes This Script Original?
Most scripts treat Supply/Demand and Entry Triggers as separate entities. The originality of the Sniper369 lies in its Strict Hierarchical Logic. It employs a "Two-Factor Authentication" system for trades:
1. Structural Validation: Identifying where "Smart Money" has historically left unfilled orders.
2. Liquidity Sweep Confirmation: Using the Enigma 369 logic to detect a specific manipulation pattern (a stop-run or "sweep") that occurs exclusively within those structural zones.
By using Pine Script v6 Object-Oriented Programming, the script manages dynamic arrays of boxes and lines that auto-delete upon mitigation, ensuring your chart remains a clean, actionable workspace.
Underlying Concepts & Calculations
1. Macro: Structural Supply & Demand
The indicator calculates zones based on Pivot Strength and Volatility Scaling.
Calculations: It scans for major structural pivots ( and ). Once a pivot is confirmed, it doesn't just draw a line; it calculates a zone width based on the Average True Range (ATR).
Why it works: Institutions do not enter at a single price; they enter in "pockets" of liquidity. Using ATR-based zones ensures that on high-volatility pairs (like Gold or GBP/JPY), your zones are appropriately wide, while on lower-volatility pairs, they remain tight and precise.
2. Micro: The Enigma 369 Sniper Logic
Once price enters a zone, the "Sniper" logic activates. This is based on the Institutional Wick-Liquidity concept.
The Sweep: The script looks for a candle that breaks the high/low of the previous candle (trapping "breakout" traders) but fails to hold that level.
The Mean Threshold (50% Wick): A core calculation of the Enigma logic is the midpoint of the rejection wick.
Calculation: for Sells.
Logic: Institutions often re-test the 50% level of a long wick to fill the remaining orders before the real move starts.
How to Use the Indicator
Step 1: Wait for Structural Alignment
Observe the Teal (Demand) and Red (Supply) boxes. These are your "Points of Interest" (POI). Do not take any trades until the price is physically touching or inside these boxes.
Step 2: Monitor for the Sniper Trigger
When the price is inside a zone, look for the appearance of the Solid and Dotted lines.
The Solid Line: This is the extreme of the manipulation candle. It serves as your structural invalidation level (Stop Loss).
The Dotted Line: This is the 50% Wick level. It is your "Sniper Entry" target.
Step 3: Execution & Alerts
The script features a built-in alert system that notifies you the moment a Sniper activation occurs inside a zone.
Conservative Entry: Place a Limit Order at the Dotted Line.
Aggressive Entry: Market enter on the close of the Sniper candle if the price has already reacted strongly.
Exit: Target the opposing Supply or Demand zone for a high Risk-to-Reward ratio.
Technical Summary for Traders
Trend Detection: Uses an EMA-50 Filter to ensure Snipers only fire in the direction of the dominant trend (optional).
Scalping/Day Trading: Optimized for the 1m, 5m, and 15m timeframes, but functions perfectly on 4H/Daily for swing traders.
Dynamic Cleanup: The script automatically deletes lines if the price closes past them, signaling that the "Liquidity Grab" was actually a breakout, thus preventing you from entering a losing trade.

PRO SMC DASHBOARDPRO SMC DASHBOARD - PRO LEVEL
Advanced Supply & Demand / SMC dashboard for scalping and intraday:
Multi-Timeframe Trend: Visualizes trend direction for M1, M5, M15, H1, H4.
HTF Supply/Demand: Shows closest high time frame (HTF) supply/demand zone and distance (in pips).
Smart “Flip” & Liquidity Signals: Flip and Liquidity Sweep arrows/signals are shown only when truly significant:
Near HTF Supply/Demand zone
And confirmed by volume spike or high confluence score
Momentum & Bias: Real-time momentum (RSI M1), H1 bias and fakeout detection.
Confluence Score: Objective score (out of 7) for trade confidence.
Volume Spike, Divergence, BOS: Includes volume spikes, RSI divergence (M1), and Break of Structure (BOS) for both M15 & H1.
Ultra-clean chart: Only valid signals/alerts shown; no spam or visual clutter.
Full dashboard with all signals and context, always visible bottom-right.
Best used for:
Forex, Gold/Silver, US indices, and crypto
Scalping/intraday with fast, clear decisions based on multi-factor SMC logic
Usage:
Add to your chart, monitor the dashboard for valid setups, and trade only when multiple factors align for high-probability entries.
How to Use the PRO SMC DASHBOARD
1. Add the Script to Your Chart:
Apply the indicator to your favorite Forex, Gold, crypto, or indices chart (best on M1, M5, or M15 for entries).
2. Read the Dashboard (Bottom Right):
The dashboard shows real-time information from multiple timeframes and key SMC filters, including:
Trend (M1, M5, M15, H1, H4):
Arrows show up (↑) or down (↓) trend for each timeframe, based on EMA.
Momentum (RSI M1):
Shows “Strong Up,” “Strong Down,” or “Neutral” plus the current RSI value.
RSI (H1):
Higher timeframe momentum confirmation.
ATR State:
Indicates current volatility (High, Normal, Low).
Session:
Detects if the market is in London, NY, or Asia session (based on UTC).
HTF S/D Zone:
Shows the nearest high timeframe Supply or Demand zone, its timeframe (M15, H1, H4), and exact pip distance.
Fakeout (last 3):
Detects recent false breakouts—if there are multiple fakeouts, potential for reversal is higher.
FVG (Fair Value Gap):
Indicates direction and distance to the nearest FVG (Above/Below).
Bias:
“Strong Buy,” “Strong Sell,” or “Neutral”—multi-timeframe, momentum, and volatility filtered.
Inducement:
Alerts for possible “stop hunt” or liquidity grab before reversal.
BOS (Break of Structure):
Recent or live breaks of market structure (for both M15 & H1).
Liquidity Sweep:
Shows if price just swept a key high/low and then reversed (often key reversal point).
Confluence Score (0-7):
Higher score means more factors align—look for 5+ for strong setups.
Volume Spike:
“YES” appears if the current volume is significantly above average—big players are active!
RSI Divergence:
Bullish or bearish divergence on M1—signals early reversal risk.
Momentum Flip:
“UP” or “DN” appears if RSI M1 crosses the 50 line, confirmed by location and other filters.
Chart Signals (Arrows & Markers):
Flip arrows (up/down) and Liquidity markers only appear when price is at/near a key Supply/Demand zone and confirmed by either a volume spike or strong confluence.
No signal spam:
If you see an arrow or LIQ tag, it’s a truly significant moment!
Suggested Trading Workflow:
Scan the Dashboard:
Is the multi-timeframe trend aligned?
Are you near a major Supply or Demand zone?
Is the Confluence Score high (5 or more)?
Check for Signals:
Is there a Flip or LIQ marker near a Supply/Demand zone?
Is volume spiking or a fakeout just occurred?
Look for Reversal or Continuation:
If there’s a Flip at Demand (with high confluence), consider a long setup.
If there’s a LIQ sweep + flip + volume at Supply, consider a short.
Manage Risk:
Don’t chase every signal.
Confirm with your entry criteria and preferred session timing.
Pro Tips:
Highest confidence trades:
When dashboard signals and chart arrows/markers agree, especially with high confluence and volume spike.
Adapt pip distance filter:
Dashboard is tuned for FX and gold; for other assets, adjust pip-size filter if needed.
Use alerts (if enabled):
Set up custom TradingView alerts for “Flip” or “Liquidity” signals for auto-notifications.
Designed to help you make professional, objective decisions—without chart clutter or second-guessing!

Liquidity Levels (Smart Swing Lows)Liquidity Levels — Smart Swing Low Detection
Efficient Liquidity Sweep Visualization for Smart Money Traders
This script automatically identifies and plots liquidity-rich swing lows based on pivot logic, filters them to remove redundant levels, and overlays daily highs/lows for added context — giving Smart Money Concept (SMC) traders a clean, actionable map of liquidity.
It’s designed to be minimal yet powerful: perfect for spotting potential liquidity grabs, mitigation zones, and sweep targets with zero chart clutter.
🔍 What This Script Does:
Detects Smart Swing Lows
Uses fixed pivot detection (left = 3, right = customizable) to identify structurally significant swing lows.
Filters out swing lows that are too close together using a percentage-based spacing threshold to reduce noise.
Mitigation Cleanup Logic
Tracks whether recent price action breaches past swing lows.
If breached, the swing level is automatically removed, keeping only relevant, unmitigated liquidity levels on your chart.
Plots Daily Highs and Lows
Each new trading day, horizontal rays mark the prior day’s high and low — useful for identifying resting liquidity and possible sweep zones.
Labeling and Style Customization
Optional labels for swing lows.
Full control over label size, color, and visibility to match any chart aesthetic.
Timeframe Filtering
Runs exclusively on 5m, 10m, and 15m charts to ensure optimal reliability and signal clarity.
⚙️ Customization Features:
Pivot sensitivity (Right side control)
Minimum distance between swing lows (in %)
Label visibility, size, and color
Line width and colors for both swing levels and daily highs/lows
Mitigation cleanup lookback length
💡 How to Use:
Add the script to a qualifying intraday chart (5–15m).
Use the swing low levels to monitor liquidity-rich zones.
Combine with your personal strategy to identify liquidity grabs, potential reversal zones, or entry points following a sweep.
Let the built-in cleanup logic remove any already-mitigated levels so you can focus on active targets.
🚀 What Makes It Unique:
This isn’t just another pivot plotter — it’s a smart, self-cleaning SMC tool designed for modern liquidity-based trading strategies.
A must-have for traders using concepts like liquidity grabs, mitigation blocks, or sweep-to-reverse trade models.
🔗 Best used in combination with:
✅ First FVG — Opening Range Fair Value Gap Detector: Pinpoint the day’s first imbalance zone for intraday setups.
✅ ICT SMC Liquidity Grabs + OB + Fibonacci OTE Levels: Confluence-based entries powered by liquidity logic, order blocks, and premium/discount zones.
Used together, these scripts form a complete Smart Money toolkit — helping you build high-probability setups with confidence, clarity, and clean charts.

Institutional Confluence Mapper [JOAT]Institutional Confluence Mapper (ICM)
Introduction
The Institutional Confluence Mapper is an open-source multi-factor analysis tool that combines five analytical modules into a unified confluence scoring system. It synthesizes institutional trading concepts including Relative Rotation analysis, Smart Money flow detection, Liquidity zone mapping, Session-based timing, and Volatility regime classification.
Rather than relying on a single indicator, ICM evaluates market conditions through multiple lenses simultaneously, presenting a clear confluence score (0-100%) that reflects the alignment of various market factors.
This script is fully open-source under the Mozilla Public License 2.0.
Originality and Purpose
This indicator is NOT a random mashup of existing indicators. It is an original implementation that creates a unified institutional analysis framework:
Why Multiple Modules? Most retail traders struggle because they rely on single indicators that provide conflicting signals. Institutional traders evaluate markets through multiple frameworks simultaneously. ICM bridges this gap by providing a unified view of complementary analysis methods.
The Confluence Scoring System: Each module contributes to a weighted confluence score (0-100%). Scores above 65% indicate bullish confluence; below 35% indicates bearish confluence.
How Components Work Together:
RRG (Relative Rotation) determines macro bias - is this asset outperforming or underperforming its benchmark?
Institutional Flow confirms smart money activity - are institutions accumulating or distributing?
Volatility Regime determines strategy selection - trend-follow or mean-revert?
Liquidity Detection identifies key levels - where are the stop hunts happening?
Session Analysis optimizes timing - when should you trade?
The Five Core Modules
1. Relative Rotation Momentum Matrix (RRG)
Compares the current symbol against a benchmark (default: SPY) using the JdK RS-Ratio methodology with double-smoothed EMA. Assets rotate through four quadrants:
LEADING: Outperforming with positive momentum (strongest bullish)
WEAKENING: Outperforming but losing momentum
LAGGING: Underperforming with negative momentum (strongest bearish)
IMPROVING: Underperforming but gaining momentum
2. Institutional Flow Analysis
Analyzes volume patterns to detect smart money activity:
Volume Z-Score measures how unusual current volume is
Buy/Sell pressure estimation based on candle structure
Unusual volume detection highlights institutional activity
3. Volatility Regime System
Uses ATR percentile ranking to classify market conditions:
COMPRESSION: Low volatility (ATR < 20th percentile) - potential breakout
EXPANSION: High volatility (ATR > 80th percentile) - trending
TRENDING_BULL/BEAR: Directional trends based on EMA alignment
RANGING: Sideways consolidation
4. Liquidity Detection
Identifies institutional liquidity targets using swing point analysis:
Swing highs/lows are tracked and displayed as dashed lines
Purple dashed lines mark resistance/sell-side liquidity
Teal dashed lines mark support/buy-side liquidity
Gold diamonds appear when liquidity sweeps are detected (potential reversals)
5. Session Momentum Profiler
Tracks trading sessions based on your selected timezone:
Asian Session: 7PM - 4AM EST
London Session: 3AM - 12PM EST
New York Session: 9:30AM - 4PM EST
London/NY Overlap: 8AM - 12PM EST (peak liquidity)
Visual Elements
Main Dashboard (Top-Right):
BIAS: Overall direction with confluence percentage
RRG: Current quadrant and momentum
FLOW: Smart money bias and volume status
REGIME: Market condition and volatility percentile
SESSION: Active trading session and current time
LIQUIDITY: Active zones and grab signals
SIGNAL: Actionable recommendation
Chart Elements:
Gold Diamond: Liquidity grab (potential reversal point)
Teal Dashed Line: Support / Buy-side liquidity zone
Purple Dashed Line: Resistance / Sell-side liquidity zone
EMA 21/55/200: Trend structure with cloud fill
Volatility Bands: ATR-based channels
How to Use
Step 1: Check the BIAS row for overall market direction
Step 2: Check REGIME to understand market conditions
Step 3: Identify key levels using liquidity zones and EMAs
Step 4: Wait for confluence above 65% (bullish) or below 35% (bearish)
Step 5: Look for gold diamond signals at key levels
Best Setups
Bullish: Confluence >65%, RRG in LEADING/IMPROVING, bullish flow, price near teal support zone.
Bearish: Confluence <35%, RRG in LAGGING/WEAKENING, bearish flow, price near purple resistance zone.
Reversal: Gold diamond appears after price sweeps a liquidity zone.
Key Input Parameters
Benchmark Symbol: Compare against (default: SPY)
RS-Ratio/Momentum Lookback: RRG calculation periods
Volume Analysis Period: Flow detection lookback
Swing Length: Liquidity zone detection
ATR Period/Rank Period: Regime classification
Timezone: Session detection timezone
Alerts
Liquidity Grab Bull: Bullish sweep detected
Liquidity Grab Bear: Bearish sweep detected
High Confluence Bull: Confluence above 70%
High Confluence Bear: Confluence below 30%
Best Practices
Use on 1H, 4H, or Daily timeframes for reliable signals
Combine with price action for confirmation
Respect the regime - don't fight strong trends
Trade during London/NY overlap for best liquidity
Wait for high confluence scores before entering
Always use proper risk management
Limitations
Works best on liquid markets with sufficient volume
Session features optimized for forex/crypto markets
RRG requires a valid benchmark symbol
No indicator predicts the future - use proper risk management
Disclaimer
This indicator is for educational and informational purposes only. It is not financial advice. Trading involves substantial risk of loss. Past performance does not guarantee future results.
-Made with passion by officialjackofalltrades
