Quarterly Theory ICT 05 [TradingFinder] Doubling Theory Signals🔵 Introduction
Doubling Theory is an advanced approach to price action and market structure analysis that uniquely combines time-based analysis with key Smart Money concepts such as SMT (Smart Money Technique), SSMT (Sequential SMT), Liquidity Sweep, and the Quarterly Theory ICT.
By leveraging fractal time structures and precisely identifying liquidity zones, this method aims to reveal institutional activity specifically smart money entry and exit points hidden within price movements.
At its core, the market is divided into two structural phases: Doubling 1 and Doubling 2. Each phase contains four quarters (Q1 through Q4), which follow the logic of the Quarterly Theory: Accumulation, Manipulation (Judas Swing), Distribution, and Continuation/Reversal.
These segments are anchored by the True Open, allowing for precise alignment with cyclical market behavior and providing a deeper structural interpretation of price action.
During Doubling 1, a Sequential SMT (SSMT) Divergence typically forms between two correlated assets. This time-structured divergence occurs between two swing points positioned in separate quarters (e.g., Q1 and Q2), where one asset breaks a significant low or high, while the second asset fails to confirm it. This lack of confirmation—especially when aligned with the Manipulation and Accumulation phases—often signals early smart money involvement.
Following this, the highest and lowest price points from Doubling 1 are designated as liquidity zones. As the market transitions into Doubling 2, it commonly returns to these zones in a calculated move known as a Liquidity Sweep—a sharp, engineered spike intended to trigger stop orders and pending positions. This sweep, often orchestrated by institutional players, facilitates entry into large positions with minimal slippage.
Bullish :
Bearish :
🔵 How to Use
Applying Doubling Theory requires a simultaneous understanding of temporal structure and inter-asset behavioral divergence. The method unfolds over two main phases—Doubling 1 and Doubling 2—each divided into four quarters (Q1 to Q4).
The first phase focuses on identifying a Sequential SMT (SSMT) divergence, which forms when two correlated assets (e.g., EURUSD and GBPUSD, or NQ and ES) react differently to key price levels across distinct quarters. For example, one asset may break a previous low while the other maintains structure. This misalignment—especially in Q2, the Manipulation phase—often indicates early smart money accumulation or distribution.
Once this divergence is observed, the extreme highs and lows of Doubling 1 are marked as liquidity zones. In Doubling 2, the market gravitates back toward these zones, executing a Liquidity Sweep.
This move is deliberate—designed to activate clustered stop-loss and pending orders and to exploit pockets of resting liquidity. These sweeps are typically driven by institutional forces looking to absorb liquidity and position themselves ahead of the next major price move.
The key to execution lies in the fact that, during the sweep in Doubling 2, a classic SMT divergence should also appear between the two assets. This indicates a weakening of the previous trend and adds an extra layer of confirmation.
🟣 Bullish Doubling Theory
In the bullish scenario, Doubling 1 begins with a bullish SSMT divergence, where one asset forms a lower low while the other maintains its structure. This divergence signals weakening bearish momentum and possible smart money accumulation. In Doubling 2, the market returns to the previous low and sweeps the liquidity zone—breaking below it on one asset, while the second fails to confirm, forming a bullish SMT divergence.
f this move is followed by a bullish PSP and a clear market structure break (MSB), a long entry is triggered. The stop-loss is placed just below the swept liquidity zone, while the target is set in the premium zone, anticipating a move driven by institutional buyers.
🟣 Bearish Doubling Theory
The bearish scenario follows the same structure in reverse. In Doubling 1, a bearish SSMT divergence occurs when one asset prints a higher high while the other fails to do so. This suggests distribution and weakening buying pressure. Then, in Doubling 2, the market returns to the previous high and executes a liquidity sweep, targeting trapped buyers.
A bearish SMT divergence appears, confirming the move, followed by a bearish PSP on the lower timeframe. A short position is initiated after a confirmed MSB, with the stop-loss placed
🔵 Settings
⚙️ Logical Settings
Quarterly Cycles Type : Select the time segmentation method for SMT analysis.
Available modes include : Yearly, Monthly, Weekly, Daily, 90 Minute, and Micro.
These define how the indicator divides market time into Q1–Q4 cycles.
Symbol : Choose the secondary asset to compare with the main chart asset (e.g., XAUUSD, US100, GBPUSD).
Pivot Period : Sets the sensitivity of the pivot detection algorithm. A smaller value increases responsiveness to price swings.
Pivot Sync Threshold : The maximum allowed difference (in bars) between pivots of the two assets for them to be compared.
Validity Pivot Length : Defines the time window (in bars) during which a divergence remains valid before it's considered outdated.
🎨 Display Settings
Show Cycle :Toggles the visual display of the current Quarter (Q1 to Q4) based on the selected time segmentation
Show Cycle Label : Shows the name (e.g., "Q2") of each detected Quarter on the chart.
Show Labels : Displays dynamic labels (e.g., “Q2”, “Bullish SMT”, “Sweep”) at relevant points.
Show Lines : Draws connection lines between key pivot or divergence points.
Color Settings : Allows customization of colors for bullish and bearish elements (lines, labels, and shapes)
🔔 Alert Settings
Alert Name : Custom name for the alert messages (used in TradingView’s alert system).
Message Frequenc y:
All : Every signal triggers an alert.
Once Per Bar : Alerts once per bar regardless of how many signals occur.
Per Bar Close : Only triggers when the bar closes and the signal still exists.
Time Zone Display : Choose the time zone in which alert timestamps are displayed (e.g., UTC).
Bullish SMT Divergence Alert : Enable/disable alerts specifically for bullish signals.
Bearish SMT Divergence Alert : Enable/disable alerts specifically for bearish signals
🔵 Conclusion
Doubling Theory is a powerful and structured framework within the realm of Smart Money Concepts and ICT methodology, enabling traders to detect high-probability reversal points with precision. By integrating SSMT, SMT, Liquidity Sweeps, and the Quarterly Theory into a unified system, this approach shifts the focus from reactive trading to anticipatory analysis—anchored in time, structure, and liquidity.
What makes Doubling Theory stand out is its logical synergy of time cycles, behavioral divergence, liquidity targeting, and institutional confirmation. In both bullish and bearish scenarios, it provides clearly defined entry and exit strategies, allowing traders to engage the market with confidence, controlled risk, and deeper insight into the mechanics of price manipulation and smart money footprints.
Recherche dans les scripts pour "sweep"

Trapped Traders Order BlocksHow It Works
The Trapped Traders Order Blocks indicator identifies specific price action patterns that suggest large market participants ("big money") have been trapped in losing positions after significant price sweeps, creating potential opportunities for reversals. The indicator detects both "bullish trap blocks" (where bearish traders are trapped) and "bearish trap blocks" (where bullish traders are trapped). Here’s the step-by-step process for each:
Bullish Trap Block (Bears Trapped):
A bearish candle (Candle A) must sweep the high of the previous candle (Candle B), meaning its high exceeds the high of the prior candle.
This bearish candle must have a longer upper wick than its lower wick, indicating rejection of higher prices.
The candle must not be a doji (i.e., it must have a significant body, defined as the body being at least 10% of the candle's range).
The next candle (Candle C) must close above the body of the bearish candle (Candle A), suggesting that price has immediately moved against the bearish sweep, potentially trapping bearish traders who entered short positions expecting a downward move.
The body of the bearish candle (Candle A) is marked as a "bullish trap block." A box is drawn around this candle's body, and a label ("Bullish Trap") is placed below it.
Bearish Trap Block (Bulls Trapped):
A bullish candle (Candle A) must sweep the low of the previous candle (Candle B), meaning its low is below the low of the prior candle.
This bullish candle must have a longer lower wick than its upper wick, indicating rejection of lower prices.
The candle must not be a doji.
The next candle (Candle C) must close below the body of the bullish candle (Candle A), suggesting that price has immediately moved against the bullish sweep, potentially trapping bullish traders who entered long positions expecting an upward move.
The body of the bullish candle (Candle A) is marked as a "bearish trap block." A box is drawn around this candle's body, and a label ("Bearish Trap") is placed above it.
Dynamic Box Extension:
For both bullish and bearish trap blocks, the box extends dynamically to the current bar unless it exceeds a user-defined age (default is 52 bars), at which point it stops at the maximum age.
Sweep Detection:
Bullish Sweep (of any trap block, bullish or bearish):
The current candle's open is above the top of the box.
The low is below the top of the box.
The close is above the top of the box.
The lower wick is longer than the upper wick (indicating rejection of lower prices).
The close is above 50% of the candle's range (ensuring a strong bullish bias).
When a bullish sweep occurs, a label ("Bullish Sweep") is placed at the low of the candle, pointing upward, and an alert is triggered.
Bearish Sweep (of any trap block, bullish or bearish):
The current candle's open is below the bottom of the box.
The high is above the bottom of the box.
The close is below the bottom of the box.
The upper wick is longer than the lower wick (indicating rejection of higher prices).
The close is below 50% of the candle's range (ensuring a strong bearish bias).
When a bearish sweep occurs, a label ("Bearish Sweep") is placed at the high of the candle, pointing downward, and an alert is triggered.
When to Be Used
The Trapped Traders Order Blocks indicator is best used in the following scenarios:
Reversal Trading:
Use this indicator to identify potential reversal points in the market. Bullish trap blocks suggest that trapped bears may unwind their short positions, leading to a potential bullish move. Bearish trap blocks suggest that trapped bulls may unwind their long positions, leading to a potential bearish move.
Look for sweeps of these blocks as confirmation of a directional move. A bullish sweep indicates a potential upward move, while a bearish sweep indicates a potential downward move.
Range-Bound Markets:
In sideways or ranging markets, trapped blocks can highlight key levels where large players have been caught off-guard. These levels often act as support or resistance, and a sweep of the block can signal a breakout or continuation in the direction of the sweep.
Confluence with Other Indicators:
Combine the trapped blocks with other technical analysis tools, such as support/resistance levels, Fibonacci retracements, or volume analysis, to increase the probability of a successful trade. For example, a bullish trap block near a strong support level with a bullish sweep can provide a high-probability setup for a long position, while a bearish trap block near a strong resistance level with a bearish sweep can signal a short opportunity.
Timeframes:
The indicator is most effective on higher timeframes such as 1-day (1D), 1-week (1W), and 1-month (1M) charts. These timeframes are more likely to capture significant moves involving large market participants, reducing noise and false signals compared to lower timeframes. While it can be used on lower timeframes (e.g., 1-hour or 4-hour), the signals may be less reliable due to increased market noise.
Logic Behind It
The logic behind the Trapped Traders Order Blocks indicator is rooted in market psychology and the behavior of large market participants ("big money"). When a large sweep candle occurs where price spikes in one direction but then quickly reverses it often indicates that traders have entered positions in the direction of the sweep, expecting a continuation. However, if the price immediately moves against them, these traders are now trapped in losing positions.
Bullish Trap Block (Bears Trapped):
A large bearish sweep candle (spiking upward but closing lower) suggests that bearish traders (bears) have entered short positions at the top of the move, expecting a downward continuation. If the next candle closes above the bearish candle's body, these bears are trapped in losing positions.
The body of the bearish candle becomes a "bullish trap block" because the trapped bears are likely to have placed their stop-loss orders or break-even exit orders just above the high of the sweep candle or within the body of the candle. As price revisits this level in the future, these trapped traders may attempt to unwind their positions by buying back their shorts, which can drive the price higher. This unwinding process often attracts new buyers, leading to a potential bullish reversal or continuation.
The bullish sweep conditions (e.g., close > box top, longer lower wick, and close above 50% of the range) ensure that the price action at the block level shows strong bullish momentum and rejection of lower prices, confirming the potential for a move higher.
Bearish Trap Block (Bulls Trapped):
A large bullish sweep candle (spiking downward but closing higher) suggests that bullish traders (bulls) have entered long positions at the bottom of the move, expecting an upward continuation. If the next candle closes below the bullish candle's body, these bulls are trapped in losing positions.
The body of the bullish candle becomes a "bearish trap block" because the trapped bulls are likely to have placed their stop-loss orders or break-even exit orders just below the low of the sweep candle or within the body of the candle. As price revisits this level in the future, these trapped traders may attempt to unwind their positions by selling their longs, which can drive the price lower. This unwinding process often attracts new sellers, leading to a potential bearish reversal or continuation.
The bearish sweep conditions (e.g., close < box bottom, longer upper wick, and close below 50% of the range) ensure that the price action at the block level shows strong bearish momentum and rejection of higher prices, confirming the potential for a move lower.
Summary
Bullish Trap Block: Occurs when bears get trapped after a bearish sweep candle is immediately followed by a bullish candle, indicating a potential reversal as trapped bears may unwind their positions.
Bearish Trap Block: Occurs when bulls get trapped after a bullish sweep candle is immediately followed by a bearish candle, indicating a potential bearish reversal.
Use Case: Ideal for identifying reversal opportunities, especially in range-bound markets or at key support/resistance levels on higher timeframes like 1D, 1W, and 1M, and can be combined with other indicators for confluence.
Logic: Large sweep candles followed by an immediate reversal suggest that big money has been trapped, and these traders may unwind their positions at break-even in the near future, driving price in the opposite direction of their initial trade.
This indicator provides a visual and actionable way to identify these trapped trader scenarios, with customizable settings for box display, sweep visuals, and alerts to help traders capitalize on these opportunities, particularly on higher timeframes where the signals are most reliable.

Trend Heuristics (+Signals)Trend Heuristics - Enhanced Rolling VWAP with Smart Signals
This indicator is an enhanced version of the Rolling VWAP (RVWAP) concept, originally based on PineCoders' ConditionalAverages library. It combines volume-weighted average price analysis with advanced signal detection for both sweeps and breakouts.
Core Features
1. Rolling VWAP System
- Implements a dynamic rolling VWAP that adapts to different timeframes
- Includes standard deviation bands for volatility measurement
- Offers flexible time period settings (fixed or auto-adjusting)
- Provides customizable visual elements including bands and fills
2. Dual Signal System
Sweep Signals
Detects high-probability reversal points with these conditions:
- Bullish Sweep:
- Opens above upper band
- Tests below upper band (low)
- Closes above upper band
- Shows stronger lower wick
- Closes above previous high
- Has favorable close position (upper 50% of candle)
- Bearish Sweep:
- Opens below lower band
- Tests above lower band (high)
- Closes below lower band
- Shows stronger upper wick
- Closes below previous low
- Has favorable close position (lower 50% of candle)
Breakout Signals
Identifies potential trend changes with these conditions:
- Bullish Breakout:
- Opens below VWAP
- Closes above upper band
- Indicates strong momentum shift upward
- Bearish Breakout:
- Opens above VWAP
- Closes below lower band
- Indicates strong momentum shift downward
Technical Details
Base Components
- Built upon PineCoders' ConditionalAverages library
- Incorporates custom alert system via CustomAlertLib
- Uses standard deviation for band calculations
Customization Options
- Adjustable standard deviation multiplier
- Flexible time period settings
- Independent controls for sweep and breakout signals
- Customizable visual elements (colors, sizes, positions)
- Custom alert message formatting
Use Cases
1. Trend Following:
- Use VWAP as dynamic support/resistance
- Monitor breakout signals for trend changes
2. Mean Reversion:
- Use sweep signals for counter-trend opportunities
- Standard deviation bands for range identification
3. Volume Analysis:
- VWAP provides volume-weighted price levels
- Helps identify significant price levels
Notes
- Best performed on liquid instruments with consistent volume
- Most effective on timeframes from 1hours to 4 hours and 1D, anything greater isn't very good
- Recommended to use in conjunction with other technical analysis tools
- Signals can be filtered based on higher timeframe trends
Credits
- Original Rolling VWAP concept by PineCoders
Market Structure & Session Alerts### Market Structure & Session Alerts Indicator
#### Overview
The "Market Structure & Session Alerts" indicator is a comprehensive tool designed to assist traders in identifying key market structure levels, detecting liquidity sweeps, and receiving alerts for specific trading sessions. This indicator is particularly useful for traders who want to keep an eye on previous high and low levels and be alerted during pre-London and pre-New York sessions.
#### Features
1. **Previous High/Low Levels:**
- **Daily, Weekly, and Monthly Highs and Lows:** The indicator plots the previous day, week, and month high and low levels on the chart. These levels can be crucial for identifying support and resistance zones.
- **Toggle Display:** Users can choose to show or hide these levels using the "Show Previous Day/Week/Month High/Low" option.
2. **Liquidity Sweep Detection:**
- **Liquidity Sweep Identification:** The indicator detects liquidity sweeps when the current price closes above the previous day's high. This can signal potential reversals or continuations in the market.
- **Visual Alerts:** When a liquidity sweep is detected, a green triangle is plotted below the bar.
3. **Session Alerts:**
- **Session Timings:** Users can set specific start and end times for the pre-London and pre-New York sessions to match their timezone.
- **Visual Background Highlight:** The background of the chart is highlighted in yellow during the defined session times to provide a visual cue.
- **Alert Messages:** The indicator can generate alerts to notify traders when the market enters the pre-London or pre-New York session.
4. **Current Price Line:**
- The current price is plotted as a black line, providing a clear visual reference for the current market price.
#### How to Use
1. **Input Parameters:**
- `Show Previous Day/Week/Month High/Low`: Enable or disable the display of previous high/low levels.
- `Show Liquidity Sweep`: Enable or disable the detection and display of liquidity sweeps.
- `Show Session Alerts`: Enable or disable session alerts and background highlights.
2. **Session Timing Adjustments:**
- Set the `Pre-London Start`, `Pre-London End`, `Pre-New York Start`, and `Pre-New York End` times according to your timezone to ensure accurate session alerts.
3. **Alerts:**
- Make sure alerts are enabled in your TradingView settings to receive notifications when the market enters the pre-London or pre-New York sessions.
#### Example Use Cases
- **Day Traders:** Identify potential support and resistance levels using the previous day's high and low.
- **Swing Traders:** Use weekly and monthly high and low levels to determine significant market structure points.
- **Scalpers:** Detect liquidity sweeps to identify potential quick trades.
- **Session Traders:** Be alerted when the market enters key trading sessions to align your trading strategy with major market activities.
This indicator combines multiple market analysis tools into one, providing a robust system for traders to enhance their trading decisions and market awareness.

CRT Finder (WanHakimFX)📈 Liquidity Grab Indicator with MTF Confluence & Alerts
🔍 Overview:
The Liquidity Grab Indicator is designed to detect precise moments when price sweeps liquidity — either by wicking below recent lows (bullish LQH) or above recent highs (bearish LQL) — followed by a clear rejection. It combines this logic with multi-timeframe confirmation and trend filters, making it a powerful tool for identifying high-probability reversal setups.
⚙️ How It Works:
✅ Liquidity Sweep Logic (LQH / LQL)
Bullish (LQH):
Current candle wicks below the previous low
Closes above the previous candle body
Confirms potential bullish reversal
Bearish (LQL):
Current candle wicks above the previous high
Closes below the previous candle body
Confirms potential bearish reversal
✅ Additional Conditions:
Must occur during London or New York sessions.
Requires trend confluence:
LQH = Price must be above SMMA 60/100/200
LQL = Price must be below SMMA 60/100/200
🧠 Multi-Timeframe Confluence:
The indicator scans for LQH/LQL sweeps across:
Daily
4H
1H
30M
15M
If a sweep occurs on any of these timeframes, an alert is triggered and a triangle marker appears on the chart for real-time visual confluence.
📊 Visual Features:
Green/Red labels for active timeframe sweeps.
Dotted wick lines to show liquidity zones from the previous candle.
Colored triangle markers for MTF sweep alerts.
🛠 Strategy Usage:
This indicator is best used as a trigger tool in a confluence-based strategy:
Use higher-timeframe MTF LQH/LQL markers for directional bias.
Wait for matching sweep on your entry timeframe (e.g., M1/M5).
Enter on confirmation candle or break of structure.
Target imbalances, FVGs, or previous highs/lows.
Risk-managed entries using sweep candle's high/low as stop.
📢 Alerts:
✅ Bullish Sweep (LQH) on any timeframe
✅ Bearish Sweep (LQL) on any timeframe

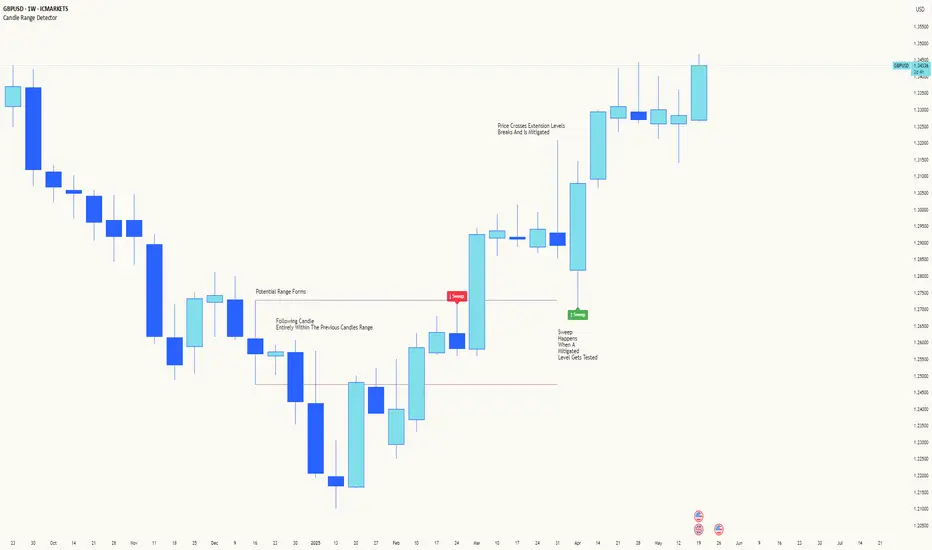
Candle Range DetectorCandle Range Detector
// Pine Script v6
// Detects candle-based ranges, mitigations, and sweeps with advanced logic
Overview
This indicator automatically detects price ranges based on candle containment, then tracks when those ranges are mitigated (broken) and when a sweep occurs. It is designed for traders who want to identify liquidity events and range breaks with precision.
How It Works
- Range Detection: A range is formed when a candle is fully contained within the previous candle (its high is lower and its low is higher). This marks a potential area of price balance or liquidity.
- Mitigation: A range is considered mitigated when price closes beyond its extension levels (configurable by normal or Fibonacci logic). This signals that the range has been invalidated or "taken out" by price action.
- Sweep Detection: After mitigation, the script watches for a sweep event: a candle that both trades through the range extreme and closes decisively beyond the log-mid of the candle itself. This is a strong sign of a liquidity grab or stop run.
- Alerts & Visuals: You can enable alerts and on-chart labels for sweeps. Only the most recent mitigated range can be swept, and each range can only be swept once.
- Timeframe Sensitivity: On weekly or monthly charts, a candle can both mitigate and sweep a range on the same bar. On lower timeframes, only one event can occur per bar.
Why It Works
- Candle containment is a robust way to identify natural price ranges and liquidity pools, as it reflects where price is consolidating or being absorbed.
- Mitigation marks the moment when a range is no longer defended, often leading to new directional moves.
- Sweeps are powerful signals of stop hunts or liquidity grabs, especially when confirmed by a close beyond the log-mid of the candle, indicating strong intent.
Visual Explanation
Tip: Use this tool to spot high-probability reversal or continuation zones, and to get alerted to key liquidity events in real time.
F & W SMC Alerthis script is a custom TradingView indicator designed to combine elements of a trend‑following VWAP approach (inspired by the “Fabio” strategy) with a smart‑money‑concepts framework (inspired by Waqar Asim). Here’s what it does:
* **Directional bias:** It calculates a 15‑minute VWAP and compares the current 15‑minute close to it. When price is above the 15‑minute VWAP, the script assumes a long bias; when below, a short bias. This reflects the trend‑following aspect of the Fabio strategy.
* **Liquidity sweeps:** Using recent pivot highs and lows on the current timeframe, it identifies when price takes out a recent high (for potential longs) or low (for potential shorts). This represents a “liquidity sweep” — a fake breakout that collects stops and signals a possible reversal or continuation.
* **Break of structure (BOS):** After a sweep, the script confirms that price is breaking away from the swept level (i.e., higher than recent highs for longs or lower than recent lows for shorts). This BOS confirmation helps avoid false signals.
* **Entry filters:** For a long setup, the bias must be long, there must be a liquidity sweep followed by a BOS, and price must reclaim the current‑timeframe VWAP. For a short setup, the opposite conditions apply (short bias, sweep + BOS to the downside, and price rejecting the VWAP).
* **Alerts and plot:** It provides two alert conditions (“Fabio‑Waqar Long Setup” and “Fabio‑Waqar Short Setup”) that you can attach to notifications. It also plots the intraday VWAP on your chart for visual reference.
In short, this script watches for a confluence of trend direction, liquidity sweeps, structural shifts, and VWAP reclaim/rejection, and then notifies you when those conditions align. You can use it as an alerting tool to identify high‑probability setups based on these combined strategies.

Fabio + Waqar SMC AlertThis script is a custom TradingView indicator designed to combine elements of a trend‑following VWAP approach (inspired by the “Fabio” strategy) with a smart‑money‑concepts framework (inspired by Waqar Asim). Here’s what it does:
* **Directional bias:** It calculates a 15‑minute VWAP and compares the current 15‑minute close to it. When price is above the 15‑minute VWAP, the script assumes a long bias; when below, a short bias. This reflects the trend‑following aspect of the Fabio strategy.
* **Liquidity sweeps:** Using recent pivot highs and lows on the current timeframe, it identifies when price takes out a recent high (for potential longs) or low (for potential shorts). This represents a “liquidity sweep” — a fake breakout that collects stops and signals a possible reversal or continuation.
* **Break of structure (BOS):** After a sweep, the script confirms that price is breaking away from the swept level (i.e., higher than recent highs for longs or lower than recent lows for shorts). This BOS confirmation helps avoid false signals.
* **Entry filters:** For a long setup, the bias must be long, there must be a liquidity sweep followed by a BOS, and price must reclaim the current‑timeframe VWAP. For a short setup, the opposite conditions apply (short bias, sweep + BOS to the downside, and price rejecting the VWAP).
* **Alerts and plot:** It provides two alert conditions (“Fabio‑Waqar Long Setup” and “Fabio‑Waqar Short Setup”) that you can attach to notifications. It also plots the intraday VWAP on your chart for visual reference.
In short, this script watches for a confluence of trend direction, liquidity sweeps, structural shifts, and VWAP reclaim/rejection, and then notifies you when those conditions align. You can use it as an alerting tool to identify high‑probability setups based on these combined strategies.
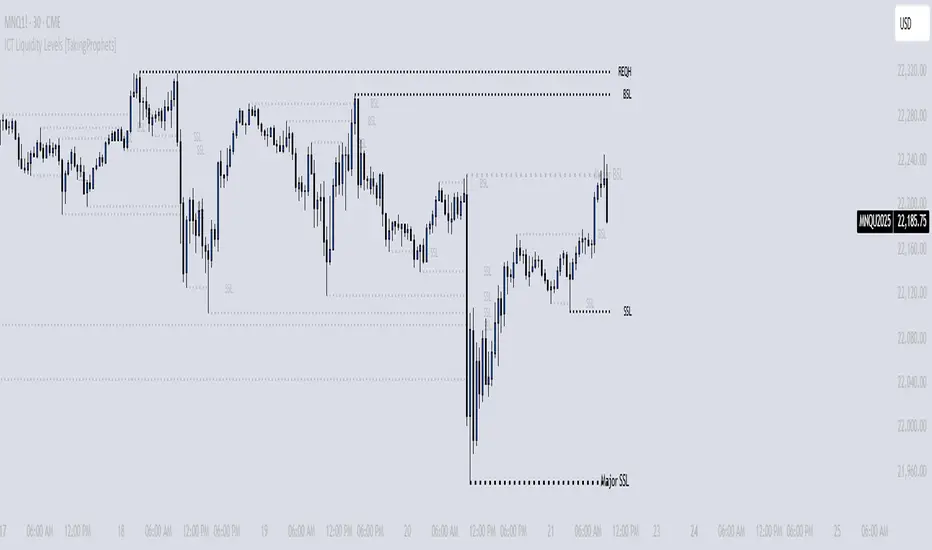
ICT Liquidity Levels [TakingProphets]Overview
This indicator is designed to dynamically identify and display key liquidity levels—areas where market participants are likely to engage. By analyzing price swing points, it highlights potential support and resistance zones that can signal reversals or breakouts. The script distinguishes between buyside and sellside liquidity levels, presenting them with customizable visual cues and labels for immediate clarity.
How It Works
Swing Point Detection:
The indicator uses a pivot-based method (with a configurable “Base Swing Strength”) to detect swing highs and lows. Each detected swing is evaluated for its “swing size” (percentage price movement), and if it exceeds a user-defined threshold, the level is classified as major.
Level Creation and Classification:
Overview
Built on core ICT principles, this indicator identifies key liquidity zones—areas where market imbalances can lead to liquidity sweeps. By dynamically analyzing swing points, it offers traders a real-time view of where liquidity is clustering, allowing for a deeper understanding of market structure. 🚀
How It Works
Swing Point Detection 🔍
• Uses a pivot-based method with a configurable “Base Swing Strength” to detect significant price swings.
• Calculates the swing size (percentage change) to flag zones that exceed the “Major Level Threshold” as major liquidity zones.
Level Creation & Classification 🛠️
• Buyside Liquidity Levels (BSL):
Identified from swing highs, marking zones where buying liquidity clusters.
• Sellside Liquidity Levels (SSL):
Identified from swing lows, highlighting zones of concentrated selling liquidity.
• Each zone is stored with its price, bar index, and classification (major or standard) before being drawn as a horizontal line on the chart.
Dynamic Level Management 🔄
• Extension: Liquidity lines automatically extend from their detection point to the current bar.
• Consolidation: When levels are close in price, the script merges them—updating labels (e.g., “REQH” or “REQL”) to denote unified liquidity zones.
• Traded-Through Detection: Adjusts or removes levels if the market moves beyond them, based on your settings.
• Age-Based Cleanup: Inactive zones are automatically removed after a set number of bars to maintain clarity.
Customization Options ⚙️
Visual Settings:
• Choose from solid, dashed, or dotted line styles and adjust line width.
• Option to display labels with customizable placement (left or right) for optimal clarity.
Color & Opacity:
• Set distinct colors for buyside and sellside liquidity zones.
• Configure opacity for zones that have been traded through, keeping them visible yet de-emphasized.
Detection & Cleanup Parameters:
• Adjust “Base Swing Strength” to control pivot detection sensitivity.
• Set the “Major Level Threshold %” to filter for significant liquidity zones.
• Decide whether to retain or remove zones once price moves through them.
• Define how many bars should pass before inactive zones are automatically deleted.
How to Use 🚀
Apply the Indicator:
Simply add the script to your chart—it automatically detects and marks key liquidity zones based on recent price action.
Adjust Inputs:
Fine-tune parameters like swing strength, threshold percentages, and visual settings to match the asset’s characteristics and your trading strategy.
Interpret the Visuals:
• Major Liquidity Zones:
Highlighted with thicker lines and distinct labels (e.g., “Major BSL/SSL”), indicating areas of heightened liquidity concentration.
• Consolidated Zones:
Merged labels (e.g., “REQH/REQL”) denote unified liquidity zones where clustering is significant.
• Traded-Through Zones:
Changes in opacity signal that the market has moved beyond a previously identified liquidity zone.
Underlying ICT Concepts 💡
Liquidity Pools & Sweeps:
Focused on identifying where liquidity is concentrated, the indicator aligns with ICT methodologies that highlight zones crucial for liquidity sweeps.
Pivot Analysis for Liquidity:
Enhances traditional pivot detection to spotlight liquidity clusters, providing a deeper insight into market structure.
Real-Time Adaptation:
With continuous updates and built-in cleanup, the indicator ensures that liquidity zones accurately reflect current market conditions.
ICT Master Suite [Trading IQ]Hello Traders!
We’re excited to introduce the ICT Master Suite by TradingIQ, a new tool designed to bring together several ICT concepts and strategies in one place.
The Purpose Behind the ICT Master Suite
There are a few challenges traders often face when using ICT-related indicators:
Many available indicators focus on one or two ICT methods, which can limit traders who apply a broader range of ICT related techniques on their charts.
There aren't many indicators for ICT strategy models, and we couldn't find ICT indicators that allow for testing the strategy models and setting alerts.
Many ICT related concepts exist in the public domain as indicators, not strategies! This makes it difficult to verify that the ICT concept has some utility in the market you're trading and if it's worth trading - it's difficult to know if it's working!
Some users might not have enough chart space to apply numerous ICT related indicators, which can be restrictive for those wanting to use multiple ICT techniques simultaneously.
The ICT Master Suite is designed to offer a comprehensive option for traders who want to apply a variety of ICT methods. By combining several ICT techniques and strategy models into one indicator, it helps users maximize their chart space while accessing multiple tools in a single slot.
Additionally, the ICT Master Suite was developed as a strategy . This means users can backtest various ICT strategy models - including deep backtesting. A primary goal of this indicator is to let traders decide for themselves what markets to trade ICT concepts in and give them the capability to figure out if the strategy models are worth trading!
What Makes the ICT Master Suite Different
There are many ICT-related indicators available on TradingView, each offering valuable insights. What the ICT Master Suite aims to do is bring together a wider selection of these techniques into one tool. This includes both key ICT methods and strategy models, allowing traders to test and activate strategies all within one indicator.
Features
The ICT Master Suite offers:
Multiple ICT strategy models, including the 2022 Strategy Model and Unicorn Model, which can be built, tested, and used for live trading.
Calculation and display of key price areas like Breaker Blocks, Rejection Blocks, Order Blocks, Fair Value Gaps, Equal Levels, and more.
The ability to set alerts based on these ICT strategies and key price areas.
A comprehensive, yet practical, all-inclusive ICT indicator for traders.
Customizable Timeframe - Calculate ICT concepts on off-chart timeframes
Unicorn Strategy Model
2022 Strategy Model
Liquidity Raid Strategy Model
OTE (Optimal Trade Entry) Strategy Model
Silver Bullet Strategy Model
Order blocks
Breaker blocks
Rejection blocks
FVG
Strong highs and lows
Displacements
Liquidity sweeps
Power of 3
ICT Macros
HTF previous bar high and low
Break of Structure indications
Market Structure Shift indications
Equal highs and lows
Swings highs and swing lows
Fibonacci TPs and SLs
Swing level TPs and SLs
Previous day high and low TPs and SLs
And much more! An ongoing project!
How To Use
Many traders will already be familiar with the ICT related concepts listed above, and will find using the ICT Master Suite quite intuitive!
Despite this, let's go over the features of the tool in-depth and how to use the tool!
The image above shows the ICT Master Suite with almost all techniques activated.
ICT 2022 Strategy Model
The ICT Master suite provides the ability to test, set alerts for, and live trade the ICT 2022 Strategy Model.
The image above shows an example of a long position being entered following a complete setup for the 2022 ICT model.
A liquidity sweep occurs prior to an upside breakout. During the upside breakout the model looks for the FVG that is nearest 50% of the setup range. A limit order is placed at this FVG for entry.
The target entry percentage for the range is customizable in the settings. For instance, you can select to enter at an FVG nearest 33% of the range, 20%, 66%, etc.
The profit target for the model generally uses the highest high of the range (100%) for longs and the lowest low of the range (100%) for shorts. Stop losses are generally set at 0% of the range.
The image above shows the short model in action!
Whether you decide to follow the 2022 model diligently or not, you can still set alerts when the entry condition is met.
ICT Unicorn Model
The image above shows an example of a long position being entered following a complete setup for the ICT Unicorn model.
A lower swing low followed by a higher swing high precedes the overlap of an FVG and breaker block formed during the sequence.
During the upside breakout the model looks for an FVG and breaker block that formed during the sequence and overlap each other. A limit order is placed at the nearest overlap point to current price.
The profit target for this example trade is set at the swing high and the stop loss at the swing low. However, both the profit target and stop loss for this model are configurable in the settings.
For Longs, the selectable profit targets are:
Swing High
Fib -0.5
Fib -1
Fib -2
For Longs, the selectable stop losses are:
Swing Low
Bottom of FVG or breaker block
The image above shows the short version of the Unicorn Model in action!
For Shorts, the selectable profit targets are:
Swing Low
Fib -0.5
Fib -1
Fib -2
For Shorts, the selectable stop losses are:
Swing High
Top of FVG or breaker block
The image above shows the profit target and stop loss options in the settings for the Unicorn Model.
Optimal Trade Entry (OTE) Model
The image above shows an example of a long position being entered following a complete setup for the OTE model.
Price retraces either 0.62, 0.705, or 0.79 of an upside move and a trade is entered.
The profit target for this example trade is set at the -0.5 fib level. This is also adjustable in the settings.
For Longs, the selectable profit targets are:
Swing High
Fib -0.5
Fib -1
Fib -2
The image above shows the short version of the OTE Model in action!
For Shorts, the selectable profit targets are:
Swing Low
Fib -0.5
Fib -1
Fib -2
Liquidity Raid Model
The image above shows an example of a long position being entered following a complete setup for the Liquidity Raid Modell.
The user must define the session in the settings (for this example it is 13:30-16:00 NY time).
During the session, the indicator will calculate the session high and session low. Following a “raid” of either the session high or session low (after the session has completed) the script will look for an entry at a recently formed breaker block.
If the session high is raided the script will look for short entries at a bearish breaker block. If the session low is raided the script will look for long entries at a bullish breaker block.
For Longs, the profit target options are:
Swing high
User inputted Lib level
For Longs, the stop loss options are:
Swing low
User inputted Lib level
Breaker block bottom
The image above shows the short version of the Liquidity Raid Model in action!
For Shorts, the profit target options are:
Swing Low
User inputted Lib level
For Shorts, the stop loss options are:
Swing High
User inputted Lib level
Breaker block top
Silver Bullet Model
The image above shows an example of a long position being entered following a complete setup for the Silver Bullet Modell.
During the session, the indicator will determine the higher timeframe bias. If the higher timeframe bias is bullish the strategy will look to enter long at an FVG that forms during the session. If the higher timeframe bias is bearish the indicator will look to enter short at an FVG that forms during the session.
For Longs, the profit target options are:
Nearest Swing High Above Entry
Previous Day High
For Longs, the stop loss options are:
Nearest Swing Low
Previous Day Low
The image above shows the short version of the Silver Bullet Model in action!
For Shorts, the profit target options are:
Nearest Swing Low Below Entry
Previous Day Low
For Shorts, the stop loss options are:
Nearest Swing High
Previous Day High
Order blocks
The image above shows indicator identifying and labeling order blocks.
The color of the order blocks, and how many should be shown, are configurable in the settings!
Breaker Blocks
The image above shows indicator identifying and labeling order blocks.
The color of the breaker blocks, and how many should be shown, are configurable in the settings!
Rejection Blocks
The image above shows indicator identifying and labeling rejection blocks.
The color of the rejection blocks, and how many should be shown, are configurable in the settings!
Fair Value Gaps
The image above shows indicator identifying and labeling fair value gaps.
The color of the fair value gaps, and how many should be shown, are configurable in the settings!
Additionally, you can select to only show fair values gaps that form after a liquidity sweep. Doing so reduces "noisy" FVGs and focuses on identifying FVGs that form after a significant trading event.
The image above shows the feature enabled. A fair value gap that occurred after a liquidity sweep is shown.
Market Structure
The image above shows the ICT Master Suite calculating market structure shots and break of structures!
The color of MSS and BoS, and whether they should be displayed, are configurable in the settings.
Displacements
The images above show indicator identifying and labeling displacements.
The color of the displacements, and how many should be shown, are configurable in the settings!
Equal Price Points
The image above shows the indicator identifying and labeling equal highs and equal lows.
The color of the equal levels, and how many should be shown, are configurable in the settings!
Previous Custom TF High/Low
The image above shows the ICT Master Suite calculating the high and low price for a user-defined timeframe. In this case the previous day’s high and low are calculated.
To illustrate the customizable timeframe function, the image above shows the indicator calculating the previous 4 hour high and low.
Liquidity Sweeps
The image above shows the indicator identifying a liquidity sweep prior to an upside breakout.
The image above shows the indicator identifying a liquidity sweep prior to a downside breakout.
The color and aggressiveness of liquidity sweep identification are adjustable in the settings!
Power Of Three
The image above shows the indicator calculating Po3 for two user-defined higher timeframes!
Macros
The image above shows the ICT Master Suite identifying the ICT macros!
ICT Macros are only displayable on the 5 minute timeframe or less.
Strategy Performance Table
In addition to a full-fledged TradingView backtest for any of the ICT strategy models the indicator offers, a quick-and-easy strategy table exists for the indicator!
The image above shows the strategy performance table in action.
Keep in mind that, because the ICT Master Suite is a strategy script, you can perform fully automatic backtests, deep backtests, easily add commission and portfolio balance and look at pertinent metrics for the ICT strategies you are testing!
Lite Mode
Traders who want the cleanest chart possible can toggle on “Lite Mode”!
In Lite Mode, any neon or “glow” like effects are removed and key levels are marked as strict border boxes. You can also select to remove box borders if that’s what you prefer!
Settings Used For Backtest
For the displayed backtest, a starting balance of $1000 USD was used. A commission of 0.02%, slippage of 2 ticks, a verify price for limit orders of 2 ticks, and 5% of capital investment per order.
A commission of 0.02% was used due to the backtested asset being a perpetual future contract for a crypto currency. The highest commission (lowest-tier VIP) for maker orders on many exchanges is 0.02%. All entered positions take place as maker orders and so do profit target exits. Stop orders exist as stop-market orders.
A slippage of 2 ticks was used to simulate more realistic stop-market orders. A verify limit order settings of 2 ticks was also used. Even though BTCUSDT.P on Binance is liquid, we just want the backtest to be on the safe side. Additionally, the backtest traded 100+ trades over the period. The higher the sample size the better; however, this example test can serve as a starting point for traders interested in ICT concepts.
Community Assistance And Feedback
Given the complexity and idiosyncratic applications of ICT concepts amongst its proponents, the ICT Master Suite’s built-in strategies and level identification methods might not align with everyone's interpretation.
That said, the best we can do is precisely define ICT strategy rules and concepts to a repeatable process, test, and apply them! Whether or not an ICT strategy is trading precisely how you would trade it, seeing the model in action, taking trades, and with performance statistics is immensely helpful in assessing predictive utility.
If you think we missed something, you notice a bug, have an idea for strategy model improvement, please let us know! The ICT Master Suite is an ongoing project that will, ideally, be shaped by the community.
A big thank you to the @PineCoders for their Time Library!
Thank you!

ILM & IFVG StrategyPlease feel free to adjust in any way possible. Let me know if you can create something better from this initial coding.
//═══════════════════════════════════════════════════════════════════════
// Inverted Liquidity Model (ILM) – Strategy
//═══════════════════════════════════════════════════════════════════════
//
// The **Inverted Liquidity Model (ILM)** is a liquidity-based algorithm
// built to capture high-probability reversals after:
//
// • A liquidity sweep (SSL/BSL taken)
// • Rejection back inside the range
// • A Fair Value Gap (FVG) forms
// • That FVG becomes invalidated → becomes an IFVG entry zone
//
// ILM combines:
// • LTF BOS / CHOCH structure confirmation
// • HTF structure (expansion) filtering
// • Premium / Discount filter (17:00 CST session midline)
// • Optional ATR volatility filter
// • Optional trading session restrictions
// • Optional partial profit-taking + runners
//
// When all conditions align, the strategy enters:
// ✔ Long after sweep of SSL + valid long IFVG + trend confirmation
// ✔ Short after sweep of BSL + valid short IFVG + trend confirmation
//
// Stops are placed at the sweep wick.
// Full target is set at the next structural high/low.
// Optional partial TP sends a runner to full target.
//
// Visual tools (labels, sweep lines, IFVG boxes, midline) assist
// with review and forward testing.
//
//───────────────────────────────────────────────────────────────────────
// USER CONFIGURABLE FEATURES
//───────────────────────────────────────────────────────────────────────
//
// • **Liquidity & Structure**
// - pivotLen → swing length for pivots / liquidity
// - htfOn → toggle higher-timeframe pivots
// - htfTF → timeframe for HTF structure/liquidity
// - useStructureFilter → enforce LTF BOS/CHOCH trend
// - useHtfExpansionFilter → enforce HTF trend
// - showStructureLabels → show BOS/CHOCH labels
// - showHtfStructureLabels → show HTF BOS/CHOCH labels
//
// • **Premium / Discount Midline**
// - usePremiumDiscountFilter → only long in discount / short in premium
// - pdSession → session used for midline (default 17:00 CST)
// - showPdMidLine → show 50% midline
//
// • **FVG / IFVG Detection**
// - useBodyGapFVG → FVG uses candle bodies instead of wicks
// - useDisplacementFVG → require displacement bar
// - dispAtrMult → minimum ATR threshold for displacement
// - showIFVG → draw IFVG boxes
//
// • **ATR / Volatility / Sessions**
// - useRangeFilter → require minimum ATR%
// - atrLen → ATR period
// - minAtrPerc → minimum ATR% of price
// - useSessionFilter → restrict trading hours
// - sessionTimes → allowed trading session
//
// • **Sweep Visualization**
// - showSweepLines → draw sweep lines at SSL/BSL sweeps
// - sweepLineWidth → thickness of sweep lines
//
// • **Exits: Partial Targets & Runners**
// - usePartialTargets → enable partial TP logic
// - tp1QtyPercent → percent closed at TP1
// - tp1FractionOfPath → TP1 relative to path to full target
//
// • **Formatting / Visibility**
// - labelFontSizeInput → tiny / small / normal / large / huge
// - showEntries → entry markers
// - showTargets → target lines
//
//═══════════════════════════════════════════════════════════════════════
// END OF STRATEGY DESCRIPTION
//═══════════════════════════════════════════════════════════════════════

First-Move-Wrong Toolkit [CHE] First-Move-Wrong Toolkit — Session-bound sweep rejection with structure confirmation
Summary
This indicator marks potential “first move wrong” reversals during a defined trading session. It looks for a quick sweep beyond the prior day high or low, or the opening range high or low, followed by rejection and a basic structure confirmation. Optional rules require a retest and a VWAP reclaim in the direction of the trade idea. The script renders session levels as right-extended lines, signals as labels, optional SL/TP guide lines for visualization, and background tints during sweep events. Pivots are confirmed using swing width, which reduces repaint risk compared to live swings.
Motivation: Why this design?
Intraday reversals often start with a liquidity sweep around obvious highs or lows. Acting on the sweep alone can be noisy, while waiting for structure break and a retest can be slow. This tool balances both by checking a sweep and rejection at session-relevant levels, then requiring a simple structure cue and, optionally, a retest and a VWAP filter. The goal is a clear, rule-based signal layer that is easy to audit on chart without hidden state.
What’s different vs. standard approaches?
Baseline reference: Simple sweep detectors or basic CHOCH markers that ignore session context and liquidity anchors.
Architecture differences:
Session-aware opening range tracking that finalizes after the chosen minutes from session start.
Daily previous high and low pulled without lookahead, then extended forward as visual anchors.
Confirmed pivot highs and lows to avoid repaint from live, unconfirmed swings.
Optional retest rule using crossover or crossunder at the trigger level.
Optional VWAP filter to demand reclaim in the intended direction.
Global label cooldown to prevent clusters of signals.
Practical effect: Fewer one-off flips around noisy levels, clearer alignment with session structure, and compact visual feedback through lines, labels, and tints.
How it works (technical)
Levels: During the defined session, the script builds an opening range high and low until the configured minute mark after session start, then freezes those levels for the day. It also fetches the previous day high and low from the daily timeframe without lookahead and extends them forward.
Sweep and rejection: A sweep is defined as price moving beyond a target level and then rejecting back inside on the same bar. The script checks this condition separately for highs and lows against opening range and previous-day levels.
Structure validation: Confirmed pivot highs and lows are computed using a symmetric swing width. A bearish idea requires a prior sweep of a high plus a break through the last confirmed swing low. A bullish idea requires a prior sweep of a low plus a break through the last confirmed swing high.
Optional retest: If enabled, a bearish signal needs a cross under the bearish trigger level; a bullish signal needs a cross over the bullish trigger level.
VWAP filter (optional): The script requires a reclaim of VWAP in the intended direction when enabled.
State handling: Opening range values, previous-day lines, and the label cooldown timestamp are stored in persistent variables. Lines are created once and updated each bar to extend forward.
Repaint considerations: Pivots confirm only after the specified swing width, reducing repaint. The daily level request is performed without lookahead. Signals use closed-bar checks implied by crossover and crossunder logic.
Parameter Guide
Session (local) — Defines the active trading window. Default nine to seventeen. Narrower windows focus on the main session drive.
Opening Range (min) — Minutes from session start to finalize OR levels. Default fifteen. Shorter values react faster; longer values stabilize levels.
Use PrevDay H/L levels — Toggle previous-day anchors. On by default.
Use OR H/L levels — Toggle opening range anchors. On by default.
Equal H/L tolerance (ticks) — Intended tolerance for equal highs or lows. Default one. (Unknown/Optional) in current signals.
Swing width — Bars on both sides for confirmed pivots. Default two. Larger values reduce noise but confirm later.
Require CHOCH after sweep — Enforces structure break after a sweep. On by default.
Prefer retest entries — Requires crossover or crossunder of the trigger level. On by default.
VWAP filter — Demands a reclaim of VWAP in signal direction. Off by default.
TP in R (guide) — Multiplier for visual TP guides. Default one. Visualization only.
Show levels / Show signals / Show R-guides — Rendering toggles. R-guides are visual aids, not orders.
Label cooldown (bars) — Minimum bars between labels. Default five. Higher values reduce clusters.
Palette inputs — Colors and transparencies for levels, labels, VWAP, and tints.
Reading & Interpretation
Lines: Dotted lines represent opening range high and low after the OR window completes. Dashed lines represent previous-day high and low.
Signals: “Long” labels appear after a low-side sweep with rejection and structure confirmation, subject to optional retest and VWAP rules. “Short” labels mirror this on the high side.
Background tints: Red-tinted bars indicate a high-side sweep and rejection. Green-tinted bars indicate a low-side sweep and rejection.
R-guides: Circles display a visual stop level at the bar extreme and a target guide based on the selected multiple. They are informational only.
Practical Workflows & Combinations
Session reversal scans: During the first hour, watch for sweeps around previous-day or opening range levels, then wait for structure confirmation and optional retest.
Trend following with filters: Combine signals with higher-timeframe structure or a moving average regime check. Ignore signals against the dominant regime.
Exits and stops: Use the visual stop as a reference near the sweep extreme; adapt the target guide to volatility and market conditions.
Multi-asset / Multi-TF: Works on intraday timeframes for liquid futures, indices, forex, and large-cap equities. Start with default settings and adjust swing width and OR minutes to instrument volatility.
Behavior, Constraints & Performance
Repaint/confirmation: Pivots confirm after the swing window completes. Signals occur only when conditions are met on closed bars.
security()/HTF: Daily previous-day levels are requested without lookahead to reduce repaint.
Resources: Uses persistent variables and line updates per bar; no heavy loops or arrays.
Known limits: Signals can arrive later when swing width is large. Gaps around session boundaries may distort OR levels. VWAP behavior may vary with partial sessions or illiquid assets.
Sensible Defaults & Quick Tuning
Starting point: Session nine to seventeen, opening range fifteen minutes, swing width two, CHOCH required, retest on, VWAP off, cooldown five bars.
Too many flips: Increase swing width, enable VWAP filter, or raise label cooldown.
Too sluggish: Reduce swing width or shorten the opening range window.
Too many session-level hits: Disable either previous-day levels or opening range levels to simplify context.
What this indicator is—and isn’t
This is a session-aware visualization and signal layer focused on sweep-plus-structure behavior. It is not a complete trading system and does not manage orders, risk, or portfolio exposure. Use it with market structure, risk limits, and execution rules that fit your process.
Disclaimer
The content provided, including all code and materials, is strictly for educational and informational purposes only. It is not intended as, and should not be interpreted as, financial advice, a recommendation to buy or sell any financial instrument, or an offer of any financial product or service. All strategies, tools, and examples discussed are provided for illustrative purposes to demonstrate coding techniques and the functionality of Pine Script within a trading context.
Any results from strategies or tools provided are hypothetical, and past performance is not indicative of future results. Trading and investing involve high risk, including the potential loss of principal, and may not be suitable for all individuals. Before making any trading decisions, please consult with a qualified financial professional to understand the risks involved.
By using this script, you acknowledge and agree that any trading decisions are made solely at your discretion and risk.
Do not use this indicator on Heikin-Ashi, Renko, Kagi, Point-and-Figure, or Range charts, as these chart types can produce unrealistic results for signal markers and alerts.
Best regards and happy trading
Chervolino

Liquidity Retest Strategy (Apicode) - TP/SL Lines FixedTechnical Documentation:
1. Purpose and underlying concept
This strategy targets a common behavior in liquid markets: liquidity sweeps around meaningful support/resistance levels, followed by a retest and rejection (reversal) with confirmation.
The core thesis is that many initial “breaks” are not continuation moves, but rather stop-runs and order harvesting. After the sweep, price reclaims the level and closes back on the opposite side, offering a structured entry with defined risk.
The strategy includes:
Support/Resistance detection via pivots
Dynamic selection of the “working” level using an ATR-based proximity window
Rejection validation via candle structure (wick + close)
Optional filters: volume, VWAP-like bias, and EMA trend
Risk management with static TP/SL (ATR-based or %), plus trailing stop (ATR-based or %), with per-trade lines plotted
2. Main components
2.1. Volatility metric: ATR
atr = ta.atr(atrLength) is used in two essential places:
Level selection (proximity to S/R): prevents trading levels that are too far from current price.
Sweep validation (minimum wick size): requires the wick to extend beyond the level by a volatility-relative amount.
Optionally, ATR can also be used for:
Static TP/SL (when usePercent = false)
Trailing stop (when useTrailPercent = false)
2.2. Building S/R levels with pivots
Pivots are detected using:
pivotHigh = ta.pivothigh(pivotLookback, rightBars)
pivotLow = ta.pivotlow(pivotLookback, rightBars)
Each confirmed pivot is stored in arrays:
resistanceLevels for resistance
supportLevels for support
The array size is capped by maxLevels, which reduces noise and manages chart resource usage (lines).
2.3. Selecting the “best” level each bar
On each bar, a single support S and/or resistance R candidate is chosen:
Support: nearest level below price (L < price)
Resistance: nearest level above price (L > price)
Only levels within atr * maxDistATR are considered
This produces dynamic “working levels” that adapt to price location and volatility.
2.4. Rejection pattern (retest + sweep)
After selecting the working level:
Support rejection (long setup)
Conditions:
Low touches/crosses support: low <= S
Close reclaims above: close > S
Bullish candle: close > open
Sufficient wick below the level (liquidity sweep): (S - low) >= atr * minWickATR
This aims to capture a stop sweep below support followed by immediate recovery.
Resistance rejection (short setup)
Symmetric conditions:
High touches/crosses resistance: high >= R
Close rejects back below: close < R
Bearish candle: close < open
Sufficient wick above the level: (high - R) >= atr * minWickATR
2.5. Optional filters
Final signals are the rejection pattern AND enabled filters:
1.- Volume filter
High volume is defined as: volume > SMA(volume, 20) * volMult
When useVolFilter = true, setups require relatively elevated participation
2.- VWAP-like bias filter
A VWAP-like series is computed over vwapLength (typical price weighted by volume)
When useVWAPFilter = true:
- Longs only if close > vwap
- Shorts only if close < vwap
3.- EMA trend filter
Uptrend if EMA(fast) > EMA(slow)
When useTrendFilter = true:
- Longs only in uptrend
- Shorts only in downtrend
2.6. Backtest time window (time filter)
To keep testing focused and reduce long-history noise:
useMaxLookbackDays enables the filter
maxLookbackDays defines how many days back from timenow entries are allowed
Entries are permitted only when time >= startTime.
3. Entry rules and position control
3.1. Entries
strategy.entry('Long', strategy.long) when longSetup and no long position is open
strategy.entry('Short', strategy.short) when shortSetup and no short position is open
No pyramiding is allowed (pyramiding = 0). Position gating is handled by:
Long allowed if strategy.position_size <= 0
Short allowed if strategy.position_size >= 0
4. Risk management: TP/SL and trailing (with plotted lines)
4.1. Detecting entry/exit events
Events are identified via changes in strategy.position_size:
LongEntry: transition into a long
shortEntry: transition into a short
flatExit: transition back to flat
This drives per-trade line creation, updates, and cleanup of state variables.
4.2. Static TP/SL
On entry, entryPrice := strategy.position_avg_price is stored.
Percent mode (usePercent = true)
Long:
staticSL = entryPrice*(1 - slPerc/100)
staticTP = entryPrice*(1 + tpPerc/100)
Short:
staticSL = entryPrice*(1 + slPerc/100)
staticTP = entryPrice*(1 - tpPerc/100)
ATR mode (usePercent = false)
Long:
staticSL = entryPrice - atrAtEntry*slATR
staticTP = entryPrice + atrAtEntry*tpATR
Short:
staticSL = entryPrice + atrAtEntry*slATR
staticTP = entryPrice - atrAtEntry*tpATR
4.3. Trailing stop (custom)
While a position is open, the script tracks the most favorable excursion:
Long: hhSinceEntry = highest high since entry
Short: llSinceEntry = lowest low since entry
A trailing candidate is computed:
Percent trailing (useTrailPercent = true)
Long: trailCandidate = hhSinceEntry*(1 - trailPerc/100)
Short: trailCandidate = llSinceEntry*(1 + trailPerc/100)
ATR trailing (useTrailPercent = false)
Long: trailCandidate = hhSinceEntry - atr*trailATR
Short: trailCandidate = llSinceEntry + atr*trailATR
Then the effective stop is selected:
Long: slUsed = max(staticSL, trailCandidate) when useTrail is enabled
Short: slUsed = min(staticSL, trailCandidate) when useTrail is enabled
If useTrail is disabled, slUsed remains the static stop.
Take profit remains static:
tpUsed = staticTP
Exit orders are issued via:
strategy.exit(..., stop=slUsed, limit=tpUsed)
4.4. Per-trade TP/SL lines
On each entry, two lines are created (SL and TP) via f_createLines().
During the trade, the SL line updates when trailing moves the stop; TP remains fixed.
On exit (flatExit), both lines are finalized on the exit bar and left on the chart as historical references.
This makes it straightforward to visually audit each trade: entry context, intended TP, and trailing evolution until exit.
5. Visualization and debugging
BUY/SELL labels with configurable size (xsize)
Debug mode (showDebug) plots the chosen working support/resistance level each bar
Stored pivot levels are drawn using reusable line slots, projected a fixed 20 bars to the right to keep the chart readable and efficient
6. Parameter guidance and practical notes
pivotLookback / rightBars: controls pivot significance vs responsiveness. Lower rightBars confirms pivots earlier but can increase noise.
maxDistATR: too low may reject valid levels; too high may select distant, less relevant levels.
minWickATR: key quality gate for “real” sweeps. Higher values reduce frequency but often improve signal quality.
Filters:
Volume filter tends to help in ranges and active sessions.
VWAP bias is useful intraday to align trades with session positioning.
EMA trend filter is helpful in directional markets but may remove good mean-reversion setups.
Percent TP/SL: provides consistent behavior across assets with variable volatility, but is less adaptive to sudden regime shifts.
Percent trailing: can capture extensions well; calibrate trailPerc per asset/timeframe (too tight = premature exits).
7. Known limitations
Pivot-derived levels are a heuristic; in strong trends, valid retests may be limited.
The time filter uses timenow; behavior may vary depending on historical context and how the platform evaluates “current time.”
TP/SL and trailing are computed from bar OHLC; in live trading, intrabar sequencing and fills may differ from bar-close simulation.

US30 Smart Money 5M/4H Strategy🧠 How It Works
✅ 1. 4H Trend Bias Detection
Uses the 4-hour chart (internally) to determine if the market is in an uptrend or downtrend.
Background turns green for bullish trend, red for bearish trend.
This helps filter trades — only take longs during uptrend, shorts during downtrend.
✅ 2. Liquidity Sweeps (Stop Hunts) on 5M
Highlights candles that break previous highs/lows and then reverse (typical of institutional stop raids).
Draws a shaded red box above sweep-high candles and green box under sweep-lows.
These indicate key reversal zones.
✅ 3. Order Block Zones
Detects bullish/bearish engulfing patterns after liquidity sweeps.
Draws a supply or demand zone box extending forward.
These zones show where institutions likely placed large orders.
✅ 4. FVG Midpoint from 30-Min Chart
Detects Fair Value Gaps (imbalances) on the 30-minute chart.
Plots a line at the midpoint of the gap (EQ level), which is often revisited for entries or rejections.
✅ 5. Buy/Sell Signals (Non-Repainting)
Buy = 4H uptrend + 5M liquidity sweep low + bullish engulfing candle.
Sell = 4H downtrend + 5M liquidity sweep high + bearish engulfing.
Prints green “BUY” or red “SELL” label on the chart — these do not repaint.
📈 How to Use It
Wait for trend bias — only take trades in the direction of the 4H trend.
Watch for liquidity sweep boxes — these hint a stop hunt just occurred.
Look for a signal label (BUY/SELL) — confirms entry criteria.
Use FVG EQ lines & Order Block zones as confluence or targets.
Take trades after NY open (9:30 AM EST) for best momentum.

Apex Edge - MTF Confluence PanelApex Edge – MTF Confluence Panel
Description:
The Apex Edge – MTF Confluence Panel is a powerful multi-timeframe analysis tool built to streamline trade decision-making by aggregating key confluences across three user-defined timeframes. The panel visually presents the state of five core market signals—Trend, Momentum, Sweep, Structure, and Trap—alongside a unified Score column that summarizes directional bias with clarity.
Traders can customize the number of bullish/bearish conditions required to trigger a score signal, allowing the tool to be tailored for both conservative and aggressive trading styles. This script is designed for those who value a clean, structured, and objective approach to identifying market alignment—whether scalping or swing trading.
How it Works:
Across each of the three selected timeframes, the panel evaluates:
Trend: Based on a user-configurable Hull Moving Average (HMA), the script compares price relative to trend to determine bullish, bearish, or neutral bias.
Momentum: Uses OBV (On-Balance Volume) with volume spike detection to identify bursts of strong buying or selling pressure.
Sweep: Detects potential liquidity grabs by identifying price rejections beyond prior swing highs/lows. A break below a previous low with reversal signals bullish intent (and vice versa for bearish).
Structure: Uses dynamic pivot-based logic to identify market structure breaks (BOS) beyond recent confirmed swing levels.
Trap: Flags potential false moves by measuring RSI overbought/oversold signal clusters combined with minimal price movement—highlighting exhaustion or deceptive breaks.
Score: A weighted consensus of the above components. The number of required confluences to trigger a score (default: 3) can be set by the user via input, offering flexibility in signal sensitivity.
Why It’s Useful for Traders:
Quick Decision-Making: The color-coded panel provides instant visual feedback on whether confluences align across timeframes—ideal for fast-paced environments like scalping or high-volatility news sessions.
Multi-Timeframe Confidence: Helps eliminate guesswork by confirming whether higher and lower timeframe conditions support your trade idea.
Customizability: Adjustable confluence threshold means traders can fine-tune how sensitive the system is—more signals for faster entries, stricter confluence for higher conviction trades.
Built-In Alerts: Automated alerts for score alignment, trap detection, and liquidity sweeps allow traders to stay informed even when away from the screen.
Strategic Edge: Supports directional bias confirmation and trade filtering with logic designed to mimic professional decision-making workflows.
Features:
Clean, real-time confluence table across three user-selected timeframes
Configurable score sensitivity via “Minimum Confluences for Score” input
Cell-based colour coding for at-a-glance trade direction
Built-in alerts for score alignment, traps, and sweep triggers
Note - This Indicator works great in sync with Apex Edge - Session Sweep Pro
Useful levels for TP = previous session high/low boxes or fib levels.
⚠️ Disclaimer:
This script is for informational and educational purposes only and should not be considered financial advice. Always perform your own due diligence and practice proper risk management when trading.

Supply & Demand ZonesThis indicator detects high-probability supply and demand zones using a multi-step smart money concept approach:
Liquidity Sweep Detection: Identifies when price sweeps above a pivot high (supply setup) or below a pivot low (demand setup), capturing liquidity grabs by institutional traders.
Displacement Confirmation: Requires a strong displacement candle (measured by ATR and body percentage) or fair value gap (FVG/imbalance) in the opposite direction after the sweep.
Volume Confirmation: Optional filter ensures zones form only when volume exceeds the user-defined threshold, indicating institutional participation.
Smart Filtering: Built-in logic prevents overlapping zones, enforces minimum spacing between signals, and requires confirmation bars to eliminate false signals.
Zone Lifecycle Management: Zones are automatically removed when price closes through them with momentum. Breached zones can optionally "flip" to the opposite type when re-tested with strong displacement.
✨ Key Features
Clean Visual Display: Small "D" (Demand) and "S" (Supply) labels with shaded zone boxes
Non-Repainting: All signals use confirmed historical data—no lookahead or repainting
Volume Filter: Optional confirmation using volume spike detection
Zone Flip Logic: Breached demand zones can become supply (and vice versa) when violated
Overlap Prevention: Smart algorithm prevents clustered or duplicate zones
Confirmation Delay: Configurable wait period after sweep to confirm genuine setups
Customizable Inputs: Adjust pivot sensitivity, displacement thresholds, volume filters, and more
Alert Ready: Built-in alert conditions for new supply and demand zone formations
🎯 How to Add to Your Chart
Favorite the Indicator: Click the star icon to add this script to your favorites
Open Your Chart: Navigate to the asset and timeframe you want to trade (works best on 5m-1H intraday charts)
Add Indicator: Click "Indicators" at the top, search for "Supply & Demand Zones (Smart Filtered)", and add to chart
Customize Settings: Click the gear icon ⚙️ to adjust inputs based on your trading style and instrument volatility
Set Alerts: Right-click the indicator name → "Add alert" → Select "Supply Zone" or "Demand Zone" conditions
📖 How to Use
Demand Zones (Green "D" Labels):
Price swept below a swing low (liquidity grab)
Strong bullish displacement or imbalance followed
Trading Action: Look for LONG entries when price returns to the zone or on immediate continuation
Stop Loss: Place just below the zone or sweep low
Target: Next resistance level, supply zone, or risk-reward ratio target
Supply Zones (Red "S" Labels):
Price swept above a swing high (liquidity grab)
Strong bearish displacement or imbalance followed
Trading Action: Look for SHORT entries when price returns to the zone or on immediate continuation
Stop Loss: Place just above the zone or sweep high
Target: Next support level, demand zone, or risk-reward ratio target
Flipped Zones (Orange Labels):
Previous demand/supply zone was broken with strong momentum
Zone has flipped polarity and may now act as the opposite type
Trading Action: Exercise caution—wait for additional confirmation before trading flipped zones
🔍 What to Look For
High-Quality Setups:
Zone forms with above-average volume (check volume filter is enabled)
Clear liquidity sweep visible on the chart
Strong displacement candle with large body percentage
Zone aligns with overall market trend or key structure levels
Multiple timeframe confirmation (check higher timeframe for context)
Avoid These Setups:
Zones forming in choppy, low-volume conditions
Multiple overlapping zones in the same area (indicator filters these automatically)
Zones that appear immediately after news events (set confirmation bars higher)
Counter-trend zones without additional confluence
⚙️ Recommended Settings by Timeframe
5-Minute Charts (Scalping):
Pivot Lookback: 3/3
Min Displacement ATR: 0.9
Confirmation Bars: 1
Min Zone Spacing: 3-5 bars
Volume Threshold: 1.2x
15-Minute Charts (Intraday):
Pivot Lookback: 4/4 (default)
Min Displacement ATR: 1.0 (default)
Confirmation Bars: 2 (default)
Min Zone Spacing: 5-8 bars
Volume Threshold: 1.2x
1-Hour Charts (Swing Trading):
Pivot Lookback: 5/5
Min Displacement ATR: 1.2-1.5
Confirmation Bars: 3
Min Zone Spacing: 8-12 bars
Volume Threshold: 1.3x
💡 Trading Tips & Best Practices
Combine with Price Action: Use this indicator alongside candlestick patterns, support/resistance, and trendlines for confirmation
Multiple Timeframe Analysis: Check higher timeframes for overall bias and major zones
Volume is Key: Enable volume filter to focus on institutional-backed moves
Risk Management: Always use stop losses and proper position sizing
Backtesting: Test settings on your preferred instruments and timeframes before live trading
Context Matters: Consider market conditions, news events, and session times
Wait for Confirmation: Don't rush entries—wait for price reaction at the zone
⚠️ Important Disclaimers
Educational Purpose Only: This indicator is provided for educational and informational purposes. It does not constitute financial advice, investment recommendations, or trading signals.
No Guarantees: Past performance and backtested results do not guarantee future results. Trading involves substantial risk of loss.

Ayman – Full Smart Suite Auto/Manual Presets + PanelIndicator Name
Ayman – Full Smart Suite (OB/BoS/Liq/FVG/Pin/ADX/HTF) + Auto/Manual Presets + Panel
This is a multi-condition trading tool for TradingView that combines advanced Smart Money Concepts (SMC) with classic technical filters.
It generates BUY/SELL signals, draws Stop Loss (SL) and Take Profit (TP1, TP2) levels, and displays a control panel with all active settings and conditions.
1. Main Features
Smart Money Concepts Filters:
Order Block (OB) Zones
Break of Structure (BoS)
Liquidity Sweeps
Fair Value Gaps (FVG)
Pin Bar patterns
ADX filter
Higher Timeframe EMA filter (HTF EMA)
Two Operating Modes:
Auto Presets: Automatically adjusts all settings (buffers, ATR multipliers, RR, etc.) based on your chart timeframe (M1/M5/M15).
Manual Mode: Fully customize all parameters yourself.
Trade Management Levels:
Stop Loss (SL)
TP1 – partial profit
TP2 – full profit
Visual Panel showing:
Current settings
Filter status
Trend direction
Last swing levels
SL/TP status
Alerts for BUY/SELL conditions
2. Entry Conditions
A BUY signal is generated when all these are true:
Trend: Price above EMA (bullish)
HTF EMA: Higher timeframe trend also bullish
ADX: Trend strength above threshold
OB: Price in a valid bullish Order Block zone
BoS: Structure break to the upside
Liquidity Sweep: Sweep of recent lows in bullish context
FVG: A bullish Fair Value Gap is present
Pin Bar: Bullish Pin Bar pattern detected (if enabled)
A SELL signal is generated when the opposite conditions are met.
3. Stop Loss & Take Profits
SL: Placed just beyond the last swing low (BUY) or swing high (SELL), with a small ATR buffer.
TP1: Partial profit target, defined as a ratio of the SL distance.
TP2: Full profit target, based on Reward:Risk ratio.
4. How to Use
Step 1 – Apply Indicator
Open TradingView
Go to your chart (recommended: XAUUSD, M1/M5 for scalping)
Add the indicator script
Step 2 – Choose Mode
AUTO Mode: Leave “Use Auto Presets” ON – parameters adapt to your timeframe.
MANUAL Mode: Turn Auto OFF and adjust all lengths, buffers, RR, and filters.
Step 3 – Filters
In the Filters On/Off section, enable/disable specific conditions (OB, BoS, Liq, FVG, Pin Bar, ADX, HTF EMA).
Step 4 – Trading the Signals
Wait for a BUY or SELL arrow to appear.
SL and TP levels will be plotted automatically.
TP1 can be used for partial close and TP2 for full exit.
Step 5 – Alerts
Set alerts via BUY Signal or SELL Signal to receive notifications.
5. Best Practices
Scalping: Use M1 or M5 with AUTO mode for gold or forex pairs.
Swing Trading: Use M15+ and adjust buffers/ATR manually.
Combine with price action confirmation before entering trades.
For higher accuracy, wait for multiple filter confirmations rather than acting on the first arrow.
6. Summary Table
Feature Purpose Can Disable?
Order Block Finds key supply/demand zones ✅
Break of Structure Detects trend continuation ✅
Liquidity Sweep Finds stop-hunt moves ✅
Fair Value Gap Confirms imbalance entries ✅
Pin Bar Price action reversal filter ✅
ADX Trend strength filter ✅
HTF EMA Higher timeframe confirmation ✅

Schmit Trading LiquidityDescription
Schmit Trading Liquidity Marker automatically spots and labels open liquidity sweep levels by detecting classic stop-run patterns (Bull→Bear for highs, Bear→Bull for lows) across multiple timeframes. Lines are drawn exactly at the wick of the triggering candle and removed as soon as price “sweeps” through them, keeping your chart clean and focused on live levels only.
How It Works
1. Pattern Detection
• Liquidity High: When a bullish candle is immediately followed by a bearish candle (Bull→Bear), the script records the higher of the two wicks.
• Liquidity Low: When a bearish candle is immediately followed by a bullish candle (Bear→Bull), the script records the lower of the two wicks.
2. Multi-Timeframe Support
• Choose up to six timeframes (5 min, 15 min, 30 min, 1 h, 4 h, daily) via checkboxes.
• Each timeframe is evaluated independently, and liquidity levels are drawn on your current chart.
3. Precision Wick Placement
• Lines start at bar_index – 1 so they align exactly with the wick of the signal candle, regardless of your chart’s timeframe.
4. Automatic Cleanup
• As soon as price closes beyond a drawn line (sweep), that line is deleted automatically.
Inputs
Input Name Description
Show 5 min. Enable liquidity detection on the 5-minute timeframe.
Show 15 min. Enable liquidity detection on the 15-minute timeframe.
Show 30 min. Enable liquidity detection on the 30-minute timeframe.
Show 1 h. Enable liquidity detection on the 1-hour timeframe.
Show 4 h. Enable liquidity detection on the 4-hour timeframe.
Show 1 D. Enable liquidity detection on the daily timeframe.
High Line Color. Color of Bull→Bear (liquidity high) lines (default: red).
Low Line Color. Color of Bear→Bull (liquidity low) lines (default: blue).
Line Length. How many bars each liquidity line extends to the right.
Usage Tips
• Focus on Live Zones: Combine with volume or order-flow tools to confirm genuine
liquidity sweeps.
• Multiple TFs: Enable higher timeframes for major liquidity clusters; lower timeframes
for fine‐tuning entries.
• Chart Cleanliness: Lines self‐delete on sweep, ensuring no manual cleanup is needed.
⸻
Disclosure & License
This indicator is Open-Source under the Mozilla Public License 2.0. Feel free to review, adapt, and improve the code. No performance guarantees—use responsibly and backtest any strategy before trading live.

SuperTrend Optimizer Remastered[CHE] SuperTrend Optimizer Remastered — Grid-ranked SuperTrend with additive or multiplicative scoring
Summary
This indicator evaluates a fixed grid of one hundred and two SuperTrend parameter pairs and ranks them by a simple flip-to-flip return model. It auto-selects the currently best-scoring combination and renders its SuperTrend in real time, with optional gradient coloring for faster visual parsing. The original concept is by KioseffTrading Thanks a lot for it.
For years I wanted to shorten the roughly two thousand three hundred seventy-one lines; I have now reduced the core to about three hundred eighty lines without triggering script errors. The simplification is generalizable to other indicators. A multiplicative return mode was added alongside the existing additive aggregation, enabling different rankings and often more realistic compounding behavior.
Motivation: Why this design?
SuperTrend is sensitive to its factor and period. Picking a single pair statically can underperform across regimes. This design sweeps a compact parameter grid around user-defined lower bounds, measures flip-to-flip outcomes, and promotes the combination with the strongest cumulative return. The approach keeps the visual footprint familiar while removing manual trial-and-error. The multiplicative mode captures compounding effects; the additive mode remains available for linear aggregation.
Originally (by KioseffTrading)
Very long script (~2,371 lines), monolithic structure.
SuperTrend optimization with additive (cumulative percentage-sum) scoring only.
Heavier use of repetitive code; limited modularity and fewer UI conveniences.
No explicit multiplicative compounding option; rankings did not reflect sequence-sensitive equity growth.
Now (remastered by CHE)
Compact core (~380 lines) with the same functional intent, no compile errors.
Adds multiplicative (compounding) scoring alongside additive, changing rankings to reflect real equity paths and penalize drawdown sequences.
Fixed 34×3 grid sweep, live ranking, gradient-based bar/wick/line visuals, top-table display, and an optional override plot.
Cleaner arrays/state handling, last-bar table updates, and reusable simplification pattern that can be applied to other indicators.
What’s different vs. standard approaches?
Baseline: A single SuperTrend with hand-picked inputs.
Architecture differences:
Fixed grid of thirty-four factor offsets across three ATR offsets.
Per-combination flip-to-flip backtest with additive or multiplicative aggregation.
Live ranking with optional “Best” or “Worst” table output.
Gradient bar, wick, and line coloring driven by consecutive trend counts.
Optional override plot to force a specific SuperTrend independent of ranking.
Practical effect: Charts show the currently best-scoring SuperTrend, not a static choice, plus an on-chart table of top performers for transparency.
How it works (technical)
For each parameter pair, the script computes SuperTrend value and direction. It monitors direction transitions and treats a change from up to down as a long entry and the reverse as an exit, measuring the move between entry and exit using close prices. Results are aggregated per pair either by summing percentage changes or by compounding return factors and then converting to percent for comparison. On the last bar, open trades are included as unrealized contributions to ranking. The best combination’s line is plotted, with separate styling for up and down regimes. Consecutive regime counts are normalized within a rolling window and mapped to gradients for bars, wicks, and lines. A two-column table reports the best or worst performers, with an optional row describing the parameter sweep.
Parameter Guide
Factor (Lower Bound) — Starting SuperTrend factor; the grid adds offsets between zero and three point three. Default three point zero. Higher raises distance to price and reduces flips.
ATR Period (Lower Bound) — Starting ATR length; the grid adds zero, one, and two. Default ten. Longer reduces noise at the cost of responsiveness.
Best vs Worst — Ranks by top or bottom cumulative return. Default Best. Use Worst for stress tests.
Calculation Mode — Additive sums percents; Multiplicative compounds returns. Multiplicative is closer to equity growth and can change the leaderboard.
Show in Table — “Top Three” or “All”. Fewer rows keep charts clean.
Show “Parameters Tested” Label — Displays the effective sweep ranges for auditability.
Plot Override SuperTrend — If enabled, the override factor and ATR are plotted instead of the ranked winner.
Override Factor / ATR Period — Values used when override is on.
Light Mode (for Table) — Adjusts table colors for bright charts.
Gradient/Coloring controls — Toggles for gradient bars and wick coloring, window length for normalization, gamma for contrast, and transparency settings. Use these to emphasize or tone down visual intensity.
Table Position and Text Size — Places the table and sets typography.
Reading & Interpretation
The auto SuperTrend plots one line for up regimes and one for down regimes. Color intensity reflects consecutive trend persistence within the chosen window. A small square at the bottom encodes the same gradient as a compact status channel. Optional wick coloring uses the same gradient for maximum contrast. The performance table lists parameter pairs and their cumulative return under the chosen aggregation; positive values are tinted with the up color, negative with the down color. “Long” labels mark flips that open a long in the simplified model.
Practical Workflows & Combinations
Trend following: Use the auto line as your primary bias. Enter on flips aligned with structure such as higher highs and higher lows. Filter with higher-timeframe trend or volatility contraction.
Exits/Stops: Consider conservative exits when color intensity fades or when the opposite line is approached. Aggressive traders can trail near the plotted line.
Override mode: When you want stability across instruments, enable override and standardize factor and ATR; keep the table visible for sanity checks.
Multi-asset/Multi-TF: Defaults travel well on liquid instruments and intraday to daily timeframes. Heavier assets may prefer larger lower bounds or multiplicative mode.
Behavior, Constraints & Performance
Repaint/confirmation: Signals are based on SuperTrend direction; confirmation is best assessed on closed bars to avoid mid-bar oscillation. No higher-timeframe requests are used.
Resources: One hundred and two SuperTrend evaluations per bar, arrays for state, and a last-bar table render. This is efficient for the grid size but avoid stacking many instances.
Known limits: The flip model ignores costs, slippage, and short exposure. Rapid whipsaws can degrade both aggregation modes. Gradients are cosmetic and do not change logic.
Sensible Defaults & Quick Tuning
Start with the provided lower bounds and “Top Three” table.
Too many flips → raise the lower bound factor or period.
Too sluggish → lower the bounds or switch to additive mode.
Rankings feel unstable → prefer multiplicative mode and extend the normalization window.
Visuals too strong → increase gradient transparency or disable wick coloring.
What this indicator is—and isn’t
This is a parameter-sweep and visualization layer for SuperTrend selection. It is not a complete trading system, not predictive, and does not include position sizing, transaction costs, or risk management. Combine with market structure, higher-timeframe context, and explicit risk controls.
Attribution and refactor note: The original work is by KioseffTrading. The script has been refactored from approximately two thousand three hundred seventy-one lines to about three hundred eighty core lines, retaining behavior without compiler errors. The general simplification pattern is reusable for other indicators.
Metadata
Name/Tag: SuperTrend Optimizer Remastered
Pine version: v6
Overlay or separate pane: true (overlay)
Core idea/principle: Grid-based SuperTrend selection by cumulative flip returns with additive or multiplicative aggregation.
Primary outputs/signals: Auto-selected SuperTrend up and down lines, optional override lines, gradient bar and wick colors, “Long” labels, performance table.
Inputs with defaults: See Parameter Guide above.
Metrics/functions used: SuperTrend, ATR, arrays, barstate checks, windowed normalization, gamma-based contrast adjustment, table API, gradient utilities.
Special techniques: Fixed grid sweep, compounding vs linear aggregation, last-bar UI updates, gradient encoding of persistence.
Performance/constraints: One hundred and two SuperTrend calls, arrays of length one hundred and two, label budget, last-bar table updates, no higher-timeframe requests.
Recommended use-cases/workflows: Trend bias selection, quick parameter audits, override standardization across assets.
Compatibility/assets/timeframes: Standard OHLC charts across intraday to daily; liquid instruments recommended.
Limitations/risks: Costs and slippage omitted; mid-bar instability possible; not suitable for synthetic chart types.
Debug/diagnostics: Ranking table, optional tested-range label; internal counters for consecutive trends.
Disclaimer
The content provided, including all code and materials, is strictly for educational and informational purposes only. It is not intended as, and should not be interpreted as, financial advice, a recommendation to buy or sell any financial instrument, or an offer of any financial product or service. All strategies, tools, and examples discussed are provided for illustrative purposes to demonstrate coding techniques and the functionality of Pine Script within a trading context.
Any results from strategies or tools provided are hypothetical, and past performance is not indicative of future results. Trading and investing involve high risk, including the potential loss of principal, and may not be suitable for all individuals. Before making any trading decisions, please consult with a qualified financial professional to understand the risks involved.
By using this script, you acknowledge and agree that any trading decisions are made solely at your discretion and risk.
Do not use this indicator on Heikin-Ashi, Renko, Kagi, Point-and-Figure, or Range charts, as these chart types can produce unrealistic results for signal markers and alerts.
Best regards and happy trading
Chervolino

ronismc333 דור בן שימול: //+------------------------------------------------------------------+
//| SMC GBP PRO EA – FTMO Ready 30M עם חצים |
//+------------------------------------------------------------------+
#property strict
input double RiskPercent = 1.0;
input int RSIPeriod = 14;
input int StopLossPoints = 200;
input int TakeProfitPoints = 400;
input int MagicNumber = 202630;
input bool EnableAlerts = true;
int rsiHandle;
//+------------------------------------------------------------------+
int OnInit()
{
rsiHandle = iRSI(_Symbol, PERIOD_M30, RSIPeriod, PRICE_CLOSE);
Comment("SMC GBP PRO EA\nStatus: CONNECTED\nAccount: ", AccountNumber());
return(INIT_SUCCEEDED);
}
//+------------------------------------------------------------------+
void OnTick()
{
if(PositionsTotal() > 0)
{
UpdateStatus();
return;
}
double rsi ;
CopyBuffer(rsiHandle,0,0,1,rsi);
double high1 = iHigh(_Symbol, PERIOD_M30,1);
double low1 = iLow(_Symbol, PERIOD_M30,1);
double close1= iClose(_Symbol, PERIOD_M30,1);
double high2 = iHigh(_Symbol, PERIOD_M30,2);
double low2 = iLow(_Symbol, PERIOD_M30,2);
//==== HTF TREND (1H EMA50) ====
double emaHTF = iMA(_Symbol, PERIOD_H1, 50, 0, MODE_EMA, PRICE_CLOSE, 0);
double closeHTF = iClose(_Symbol, PERIOD_H1, 0);
bool htfBull = closeHTF > emaHTF;
bool htfBear = closeHTF < emaHTF;
//==== LIQUIDITY SWEEP ====
bool sweepBuy = low1 < low2 && close1 > low2;
bool sweepSell = high1 > high2 && close1 < high2;
//==== BOS ====
bool bosBuy = sweepBuy && close1 > high2;
bool bosSell = sweepSell && close1 < low2;
//==== BUY/SELL CONDITIONS ====
bool buy = bosBuy && rsi > 50 && htfBull;
bool sell = bosSell && rsi < 50 && htfBear;
double lot = CalculateLot(StopLossPoints, RiskPercent);
if(buy)
{
OpenTrade(ORDER_TYPE_BUY, lot, StopLossPoints, TakeProfitPoints, "BUY GBP");
DrawArrow("BUY", 0, low1 - 10*_Point, clrLime, "BUY GBP");
}
if(sell)
{
OpenTrade(ORDER_TYPE_SELL, lot, StopLossPoints, TakeProfitPoints, "SELL GBP");
DrawArrow("SELL", 0, high1 + 10*_Point, clrRed, "SELL GBP");
}
UpdateStatus();
}
//+------------------------------------------------------------------+
double CalculateLot(int slPoints, double riskPercent)
{
double riskMoney = AccountBalance() * riskPercent / 100.0;
double lot = riskMoney / (slPoints * _Point * 10);
lot = MathMax(lot,0.01);
return(NormalizeDouble(lot,2));
}
//+------------------------------------------------------------------+
void OpenTrade(ENUM_ORDER_TYPE type,double lot,int sl,int tp,string comment)
{
double price = (type==ORDER_TYPE_BUY) ? SymbolInfoDouble(_Symbol,SYMBOL_ASK)
: SymbolInfoDouble(_Symbol,SYMBOL_BID);
double slPrice = (type==ORDER_TYPE_BUY) ? price - sl*_Point
: price + sl*_Point;
double tpPrice = (type==ORDER_TYPE_BUY) ? price + tp*_Point
: price - tp*_Point;
MqlTradeRequest req;
MqlTradeResult res;
ZeroMemory(req);
req.action = TRADE_ACTION_DEAL;
req.symbol = _Symbol;
req.volume = lot;
req.type = type;
req.price = price;
req.sl = slPrice;
req.tp = tpPrice;
req.deviation= 20;
req.magic = MagicNumber;
req.comment = comment;
if(!OrderSend(req,res))
{
Print("Trade failed: ",res.retcode);
if(EnableAlerts) Alert("Trade failed: ",res.retcode);
}
else
{
if(EnableAlerts) Alert(comment," opened at ",price);
Print(comment," opened at ",price);
}
}
//+------------------------------------------------------------------+
void UpdateStatus()
{
string text = "SMC GBP PRO EA\nStatus: CONNECTED\nAccount: "+IntegerToString(AccountNumber());
if(PositionsTotal()>0) text += "\nTrade Open!";
Comment(text);
}
//+------------------------------------------------------------------+
void DrawArrow(string name, int shift, double price, color clr, string text)
{
string objName = name + IntegerToString(TimeCurrent());
if(ObjectFind(0,objName) >=0) ObjectDelete(0,objName);
ObjectCreate(0,objName,OBJ_ARROW,0,Time ,price);
ObjectSetInteger(0,objName,OBJPROP_COLOR,clr);
ObjectSetInteger(0,objName,OBJPROP_WIDTH,2);
ObjectSetInteger(0,objName,OBJPROP_ARROWCODE,233); // חץ
ObjectSetString(0,objName,OBJPROP_TEXT,text);
}
------------------------------------------------------------------+
//| SMC GBP PRO EA – FTMO 30M + TP/SL + Trailing Stop |
//+------------------------------------------------------------------+
#property strict
input double RiskPercent = 1.0;
input int RSIPeriod = 14;
input int StopLossPoints = 200;
input int TakeProfitPoints = 400;
input int MagicNumber = 202630;
input bool EnableAlerts = true;
int rsiHandle;
//+------------------------------------------------------------------+
int OnInit()
{
rsiHandle = iRSI(_Symbol, PERIOD_M30, RSIPeriod, PRICE_CLOSE);
Comment("SMC GBP PRO EA\nStatus: CONNECTED\nAccount: ", AccountNumber());
return(INIT_SUCCEEDED);
}
//+------------------------------------------------------------------+
void OnTick()
{
//
UpdateStatus();
// Trailing Stop
ManageTrailing();
if(PositionsTotal() > 0) return;
double rsi ;
CopyBuffer(rsiHandle,0,0,1,rsi);
double high1 = iHigh(_Symbol, PERIOD_M30,1);
double low1 = iLow(_Symbol, PERIOD_M30,1);
double close1= iClose(_Symbol, PERIOD_M30,1);
double high2 = iHigh(_Symbol, PERIOD_M30,2);
double low2 = iLow(_Symbol, PERIOD_M30,2);
//==== HTF TREND (1H EMA50) ====
double emaHTF = iMA(_Symbol, PERIOD_H1, 50, 0, MODE_EMA, PRICE_CLOSE, 0);
double closeHTF = iClose(_Symbol, PERIOD_H1, 0);
bool htfBull = closeHTF > emaHTF;
bool htfBear = closeHTF < emaHTF;
//==== LIQUIDITY SWEEP ====
bool sweepBuy = low1 < low2 && close1 > low2;
bool sweepSell = high1 > high2 && close1 < high2;
//==== BOS ====
bool bosBuy = sweepBuy && close1 > high2;
bool bosSell = sweepSell && close1 < low2;
//==== BUY/SELL CONDITIONS ====
bool buy = bosBuy && rsi > 50 && htfBull;
bool sell = bosSell && rsi < 50 && htfBear;
double lot = CalculateLot(StopLossPoints, RiskPercent);
if(buy)
{
OpenTrade(ORDER_TYPE_BUY, lot, StopLossPoints, TakeProfitPoints, "BUY GBP");
DrawArrow("BUY", 0, low1 - 10*_Point, clrLime, "BUY GBP");
}
if(sell)
{
OpenTrade(ORDER_TYPE_SELL, lot, StopLossPoints, TakeProfitPoints, "SELL GBP");
DrawArrow("SELL", 0, high1 + 10*_Point, clrRed, "SELL GBP");
}
}
//+------------------------------------------------------------------+
double CalculateLot(int slPoints, double riskPercent)
{
double riskMoney = AccountBalance() * riskPercent / 100.0;
double lot = riskMoney / (slPoints * _Point * 10);
lot = MathMax(lot,0.01);
return(NormalizeDouble(lot,2));
}
//+------------------------------------------------------------------+
void OpenTrade(ENUM_ORDER_TYPE type,double lot,int sl,int tp,string comment)
{
double price = (type==ORDER_TYPE_BUY) ? SymbolInfoDouble(_Symbol,SYMBOL_ASK)
: SymbolInfoDouble(_Symbol,SYMBOL_BID);
double slPrice = (type==ORDER_TYPE_BUY) ? price - sl*_Point
: price + sl*_Point;
double tpPrice = (type==ORDER_TYPE_BUY) ? price + tp*_Point
: price - tp*_Point;
MqlTradeRequest req;
MqlTradeResult res;
ZeroMemory(req);
req.action = TRADE_ACTION_DEAL;
req.symbol = _Symbol;
req.volume = lot;
req.type = type;
req.price = price;
req.sl = slPrice;
req.tp = tpPrice;
req.deviation= 20;
req.magic = MagicNumber;
req.comment = comment;
if(!OrderSend(req,res))
{
Print("Trade failed: ",res.retcode);
if(EnableAlerts) Alert("Trade failed: ",res.retcode);
}
else
{
if(EnableAlerts) Alert(comment," opened at ",price);
Print(comment," opened at ",price);
}
}
//+------------------------------------------------------------------+
void UpdateStatus()
{
string text = "SMC GBP PRO EA\nStatus: CONNECTED\nAccount: "+IntegerToString(AccountNumber());
if(PositionsTotal()>0) text += "\nTrade Open!";
Comment(text);
}
//+------------------------------------------------------------------+
void DrawArrow(string name, int shift, double price, color clr, string text)
{
string objName = name + IntegerToString(TimeCurrent());
if(ObjectFind(0,objName) >=0) ObjectDelete(0,objName);
ObjectCreate(0,objName,OBJ_ARROW,0,Time ,price);
ObjectSetInteger(0,objName,OBJPROP_COLOR,clr);
ObjectSetInteger(0,objName,OBJPROP_WIDTH,2);
ObjectSetInteger(0,objName,OBJPROP_ARROWCODE,233); // חץ
ObjectSetString(0,objName,OBJPROP_TEXT,text);
}
//+------------------------------------------------------------------+
void ManageTrailing()
{
for(int i=PositionsTotal()-1;i>=0;i--)
{
ulong ticket = PositionGetTicket(i);
if(PositionSelectByTicket(ticket))
{
double price = PositionGetDouble(POSITION_PRICE_OPEN);
double sl = PositionGetDouble(POSITION_SL);
double tp = PositionGetDouble(POSITION_TP);
ENUM_POSITION_TYPE type = (ENUM_POSITION_TYPE)PositionGetInteger(POSITION_TYPE);
double newSL = 0;
if(type == POSITION_TYPE_BUY)
{
double trail = SymbolInfoDouble(_Symbol,SYMBOL_BID) - StopLossPoints*_Point;
if(trail > sl) newSL = trail;
}
else if(type == POSITION_TYPE_SELL)
{
double trail = SymbolInfoDouble(_Symbol,SYMBOL_ASK) + StopLossPoints*_Point;
if(trail < sl) newSL = trail;
}
if(newSL != 0)
{
MqlTradeRequest req;
MqlTradeResult res;
ZeroMemory(req);
req.action = TRADE_ACTION_SLTP;
req.symbol = _Symbol;
req.position = ticket;
req.sl = newSL;
req.tp = tp;
OrderSend(req,res);
}
}
}
}

Sunmool's Silver Bullet Model FinderICT Silver Bullet Model Indicator - Complete Guide
📈 Overview
The ICT Silver Bullet Model indicator is a supplementary tool for utilizing ICT's (Inner Circle Trader) market structure analysis techniques. This indicator detects institutional liquidity hunting patterns and automatically identifies structural levels, helping traders analyze market structure more effectively.
🎯 Core Features
1. Structural Level Identification
STL (Short Term Low): Recent support levels formed in the short term
STH (Short Term High): Recent resistance levels formed in the short term
ITL (Intermediate Term Low): Stronger support levels with more significance
ITH (Intermediate Term High): Stronger resistance levels with more significance
2. Kill Zone Time Display
London Kill Zone: 02:00-05:00 (default)
New York Kill Zone: 08:30-11:00 (default)
These are the most active trading hours for institutional players where significant price movements occur
3. Smart Sweep Detection
Bear Sweep (🔻): Pattern where price sweeps below lows then recovers - Simply indicates sweep occurrence
Bull Sweep (🔺): Pattern where price sweeps above highs then declines - Simply indicates sweep occurrence
Important: Sweep labels only mark liquidity hunting locations, not directional bias.
🔧 Configuration Parameters
Basic Settings
Sweep Detection Lookback: Number of candles for sweep detection (default: 20)
Structure Point Lookback: Number of candles for structural point detection (default: 10)
Sweep Threshold: Percentage threshold for sweep validation (default: 0.1%)
Time Settings
London Kill Zone: Active hours for London session
New York Kill Zone: Active hours for New York session
Visualization Settings
Customizable colors for each level type
Enable/disable alert notifications
📊 How to Use
1. Chart Setup
Most effective on 1-minute to 1-hour timeframes
Recommended for major currency pairs (EUR/USD, GBP/USD, etc.)
Also applicable to cryptocurrencies and indices
2. Signal Interpretation
🔻 Bear Sweep / 🔺 Bull Sweep Labels
Simply indicate liquidity hunting occurrence points
Not directional bias indicators
Reference for understanding overall context on HTF
🟢 Silver Bullet Long (Huge Green Triangle)
After Bear Sweep occurrence
Within Kill Zone timeframe
Current price positioned above swept level
→ Actual BUY entry signal
🔴 Silver Bullet Short (Huge Red Triangle)
After Bull Sweep occurrence
Within Kill Zone timeframe
Current price positioned below swept level
→ Actual SELL entry signal
3. Risk Management
Use swept levels as stop-loss reference points
Approach signals outside Kill Zone hours with caution
Recommended to use alongside other technical analysis tools
💡 Trading Strategies
Silver Bullet Strategy
Preparation Phase: Monitor charts 30 minutes before Kill Zone
Sweep Observation: Identify liquidity hunting points with 🔻🔺 labels (reference only)
Entry: Enter ONLY when huge triangle Silver Bullet signal appears within Kill Zone
Take Profit: Target opposite structural level or 1:2 reward ratio
Stop Loss: Beyond the swept level
Important: Small sweep labels are NOT trading signals!
Multi-Timeframe Approach
Step 1: HTF (Higher Time Frame) Sweep Reference
Observe 🔻🔺 sweep labels on 4-hour and daily charts
Reference only sweeps occurring at major structural levels
HTF sweeps are used to identify liquidity hunting points
Reference only, not for directional bias
Step 2: Transition to LTF (Lower Time Frame)
Move to 15-minute, 5-minute, and 1-minute charts
Analyze LTF with reference to HTF sweep information
Use STL, STH, ITL, ITH for precise entry point identification
Structural levels on LTF are the core of actual trading decisions
Only huge triangle (Silver Bullet) signals are actual entry signals
Recommended Usage
Identify overall sweep occurrence points on HTF (🔻🔺 labels)
Use this indicator on LTF to identify structural levels
Reference only huge triangle signals for actual trading during Kill Zone
Small sweep labels (🔻🔺) are for reference only, not entry signals
📋 Information Table Interpretation
Real-time information in the top-right table:
Kill Zone Status: Current active session status
Level Counts: Number of each structural level type
⚠️ Important Disclaimers
Backtesting results do not guarantee future performance
Exercise caution during high market volatility periods
Always apply proper risk management
Recommend comprehensive analysis with other analytical tools
🎓 Learning Resources
Study original ICT concepts through free YouTube educational content
Research Market Structure analysis techniques
Optimize through backtesting for personal use
🔬 Technical Implementation
Algorithm Logic
Pivot Point Detection: Uses TradingView's built-in pivot functions to identify swing highs and lows
Classification System: Automatically categorizes levels based on recent price action frequency
Sweep Validation: Confirms legitimate sweeps through price action analysis
Time-Based Filtering: Prioritizes signals during institutional active hours
Performance Optimization
Efficient array management prevents memory overflow
Dynamic level cleanup maintains chart clarity
Real-time calculation ensures minimal lag
🛠️ Customization Tips
Adjust lookback periods based on market volatility
Modify kill zone times for different market sessions
Experiment with sweep threshold for different instruments
Color-code levels according to personal preference
📈 Expected Outcomes
When properly implemented, this indicator can help traders:
Identify high-probability reversal points
Time entries with institutional flow
Reduce false signals through kill zone filtering
Improve risk-to-reward ratios
This indicator automates ICT's concepts into a user-friendly tool that can be enhanced through continuous learning and practical application. Success depends on understanding the underlying market structure principles and combining them with proper risk management techniques.

Change in State of Delivery (CISD) [SB Instant]🧠 Modified by SB | Core Logic by LuxAlgo
🔗 Licensed under CC BY-NC-SA 4.0
Change in State of Delivery (CISD) is a concept rooted in observing shifts in order flow behavior, designed to detect the first signs of trend exhaustion and potential reversal. This model tracks when the current delivery (trend) structure — bullish or bearish — is violated by an opposing force, signaling a potential change in market intent.
In simple terms:
A Bullish CISD is triggered when sellers fail to maintain control, and buyers break above a delivery line.
A Bearish CISD is triggered when buyers fail, and sellers break below a delivery line.
This version uses real-time logic, triggering alerts immediately on break, rather than waiting for candle-close confirmation — giving faster, actionable signals to precision-driven traders.
⚙️ Core Features
Detection Modes
Classic: Traditional swing-based structural break detection
Liquidity Sweep: Logic incorporating wick sweeps (liquidity grabs)
Custom Parameters
Swing Length: Number of candles used to identify swing points
Minimum CISD Duration: Minimum length required for valid delivery phase
Maximum Swing Validity: How long the structure remains valid for potential breaks
Visual Options
Label and line styling options
Solid line = Initial break of delivery structure
Dashed line = Continuation break in the same trend direction
This allows you to visually differentiate a new reversal vs. a continuation of the existing trend.
🚨 Built-in Alerts
Bullish CISD Detected (Instant)
Bearish CISD Detected (Instant)
These alerts fire immediately when structure is broken, offering early confirmation for aggressive or reactive trade setups.
🔔 IMPORTANT:
If an alert triggers but the delivery line is not present, wait for the price to form the CISD label again and manually mark the price level using a horizontal ray. This ensures you are trading from a clearly defined structure.
🕒 Recommended Timeframes
✅ Use 30-Minute or 4-Hour charts to identify high-confidence CISD zones
🎯 Then drop to the 1-Minute or 5-Minute chart for precise entry execution
This top-down approach aligns higher timeframe narrative with lower timeframe entry triggers, increasing your edge in both timing and context.
🧠 How to Use CISD Effectively
Bullish Scenario:
Watch for breaks above bearish delivery structures, especially if confirmed with:
Fair Value Gaps (FVG)
The Strat 2-2 reversal
MSS (Market Structure Shift)
Bearish Scenario:
Look for breaks below bullish delivery setups in alignment with:
BOS (Break of Structure)
The Strat 3-1-2
Bearish liquidity sweeps
Key Tip:
Solid line = Initial CISD (new shift)
Dashed line = Continuation of current trend
This visual distinction helps you determine when a market is shifting vs. extending.
📎 Disclaimer
This tool is provided for educational purposes only and is not intended as financial advice. Always backtest, paper trade, and manage risk responsibly.
📚 Credits
Original CISD framework developed by LuxAlgo
Real-time execution logic, alert enhancements, and intraday utility designed by SB (SamB)

Futures Psychological Levels PROFutures Psychological Levels PRO – Professional Usage Guide
Indicator Overview
This elite psychological levels tool dynamically plots the most institutionally relevant round-number clusters across futures markets (ES, NQ, YM, CL, GC, SI, BTC, and custom instruments). It separates levels into three hierarchical tiers — Major, Tradable, and Sniper — while intelligently filtering distant levels using an ATR-based proximity engine. The result is a clean, adaptive overlay that scales perfectly from scalping precision on 1-minute charts to big-picture context on daily/weekly timeframes.
Core Philosophy
Psychological levels are where order flow clusters: stops, limits, and institutional positioning accumulate around round numbers. This indicator turns static round numbers into a dynamic decision framework by:
Prioritizing confluence zones
Reducing clutter in ranging or low-volatility environments
Highlighting only price-relevant levels in real time
Key Features
Instrument Presets – One-click optimized spacing for major futures contracts
Three-Tier Hierarchy – Major (institutional anchors), Tradable (active defense zones), Sniper (precise entry/exit triggers)
ATR Proximity Filter – Automatically hides irrelevant distant levels
Zones or Lines – Visual magnet areas or clean horizontal lines
Price Labels & Summary Table – Instant reference for next major levels above/below
Full Customization – Colors, thickness, styles, and manual overrides
How to Best Use This Indicator (Professional Workflow)
Select the Correct Instrument Preset
Start with the built-in preset matching your chart (e.g., "ES (S&P 500)" for /ES or MES). This instantly applies battle-tested increments. Use "Custom" only for non-standard assets (forex pairs, micros with different tick values, or crypto alts).
Match Settings to Your Trading Style & Timeframe
Reading the Levels – Decision Framework
Major Levels (thick red by default): Highest probability reaction zones. Expect strong reversals, breakouts with volume, or liquidity sweeps. Treat as primary support/resistance.
Tradable Levels (orange): Active trader defense zones. Excellent for limit order placement, partial profit taking, or fading weak moves.
Sniper Levels (thin gray): Precision entries/exits, stop runs, and scalping targets. Confluence with order blocks or volume profile nodes dramatically increases edge.
Trade Setup Examples
Rejection Play: Price approaches a Major level from below → long wick rejection + close back inside → enter in direction of rejection with stop beyond wick extremity.
Break & Retest: Clean breakout through Tradable/Major → retest as new support/resistance → enter on confirmation candle.
Liquidity Sweep: Price briefly breaches Sniper/Major (stop hunt) → rapid reclaim → aggressive counter-trend entry.
Confluence Boost: When a level aligns with daily/weekly open, VWAP, or prior high/low volume node → dramatically increase position size or conviction.
Risk Management Integration
Always place stops just beyond the next logical level (typically a Sniper or Tradable beyond your entry zone). Use the summary table to quickly identify invalidation points. Target the next level in the direction of your bias for minimum 1:2 risk-reward (often 1:3–1:5 achievable at Major levels).
Pro Optimization Tips
High-volatility sessions (NY open, FOMC, NFP): Increase ATR Multiplier slightly to avoid excessive clutter.
Low-volatility Asian/range sessions: Decrease ATR Multiplier for tighter precision.
Combine with Volume Profile (Fixed Range or Session) to confirm high-volume nodes at psych levels.
Pair with anchored/session VWAP for additional confluence layers.
On higher timeframes, disable Sniper levels and zones entirely for minimalist structural analysis.
Important Disclaimer
This indicator is a professional decision-support tool, not a standalone trading system. All trading involves substantial risk of loss. Past performance is not indicative of future results. Always conduct your own analysis, manage risk appropriately, and consider your financial situation before placing trades.
Mastering psychological levels is one of the highest-edge concepts in institutional trading. Used correctly, this indicator gives you the same reference framework that prop desks and market makers watch every day. Trade smart, stay disciplined, and let price action at these levels guide your executions.
