Kawabunga Swing Failure Points Candles (SFP) by RRBKawabunga Swing Failure Points Candles (SFP) by RagingRocketBull 2019
Version 1.0
This indicator shows Swing Failure Points (SFP) and Swing Confirmation Points (SCP) as candles on a chart.
SFP/SCP candles are used by traders as signals for trend confirmation/possible reversal.
The signal is stronger on a higher volume/larger candle size.
A Swing Failure Point (SFP) candle is used to spot a reversal:
- up trend SFP is a failure to close above prev high after making a new higher high => implies reversal down
- down trend SFP is a failure to close below prev low after making a new lower low => implies reversal up
A Swing Confirmation Point (SCP) candle is just the opposite and is used to confirm the current trend:
- up trend SCP is a successful close above prev high after making a new higher high => confirms the trend and implies continuation up
- down trend SCP is a successful close below prev low after making a new lower low => confirms the trend and implies continuation down
Features:
- uses fractal pivots with optional filter
- show/hide SFP/SCP candles, pivots, zigzag, last min/max pivot bands
- dim lag zones/hide false signals introduced by lagging fractals or
- use unconfirmed pivots to eliminate fractal lag/false signals. 2 modes: fractals 1,1 and highest/lowest
- filter only SFP/SCP candles confirmed with volume/candle size
- SFP/SCP candles color highlighting, dim non-important bars
Usage:
- adjust fractal settings to get pivots that best match your data (lower values => more frequent pivots. 0,0 - each candle is a pivot)
- use one of the unconfirmed pivot modes to eliminate false signals or just ignore all signals in the gray lag zones
- optionally filter only SFP/SCP candles with large volume/candle size (volume % change relative to prev bar, abs candle body size value)
- up/down trend SCP (lime/fuchsia) => continuation up/down; up/down trend SFP (orange/aqua) => possible reversal down/up. lime/aqua => up; fuchsia/orange => down.
- when in doubt use show/hide pivots/unconfirmed pivots, min/max pivot bands to see which prev pivot and min/max value were used in comparisons to generate a signal on the following candle.
- disable offset to check on which bar the signal was generated
Notes:
Fractal Pivots:
- SFP/SCP candles depend on fractal pivots, you will get different signals with different pivot settings. Usually 4,4 or 2,2 settings are used to produce fractal pivots, but you can try custom values that fit your data best.
- fractal pivots are a mixed series of highs and lows in no particular order. Pivots must be filtered to produce a proper zigzag where ideally a high is followed by a low and another high in orderly fashion.
Fractal Lag/False Signals:
- only past fractal pivots can be processed on the current bar introducing a lag, therefore, pivots and min/max pivot bands are shown with offset=-rightBars to match their target bars. For unconfirmed pivots an offset=-1 is used with a lag of just 1 bar.
- new pivot is not a confirmed fractal and "does not exist yet" while the distance between it and the current bar is < rightBars => prev old fractal pivot in the same dir is used for comparisons => gives a false signal for that dir
- to show false signals enable lag zones. SFP/SCP candles in lag zones are false. New pivots will be eventually confirmed, but meanwhile you get a false signal because prev pivot in the same dir was used instead.
- to solve this problem you can either temporary hide false signals or completely eliminate them by using unconfirmed pivots of a smaller degree/lag.
- hiding false signals only works for history and should be used only temporary (left disabled). In realtime/replay mode it disables all signals altogether due to TradingView's bug (barcolor doesn't support negative offsets)
Unconfirmed Pivots:
- you have 2 methods to check for unconfirmed pivots: highest/lowest(rightBars) or fractals(1,1) with a min possible step. The first is essentially fractals(0,0) where each candle is a pivot. Both produce more frequent pivots (weaker signals).
- an unconfirmed pivot is used in comparisons to generate a valid signal only when it is a higher high (> max high) or a lower low (< min low) in the dir of a trend. Confirmed pivots of a higher degree are not affected. Zigzag is not affected.
- you can also manually disable the offset to check on which bar the pivot was confirmed. If the pivot just before an SCP/SFP suddenly jumps ahead of it - prev pivot was used, generating a false signal.
- last max high/min low bands can be used to check which value was used in candle comparison to generate a signal: min(pivot min_low, upivot min_low) and max(pivot max_high, upivot max_high) are used
- in the unconfirmed pivots mode the max high/min low pivot bands partially break because you can't have a variable offset to match the random pos of an unconfirmed pivot (anywhere in 0..rightBars from the current bar) to its target bar.
- in the unconfirmed pivots mode h (green) and l (red) pivots become H and L, and h (lime) and l (fuchsia) are used to show unconfirmed pivots of a smaller degree. Some of them will be confirmed later as H and L pivots of a higher degree.
Pivot Filter:
- pivot filter is used to produce a better looking zigzag. Essentially it keeps only higher highs/lower lows in the trend direction until it changes, skipping:
- after a new high: all subsequent lower highs until a new low
- after a new low: all subsequent higher lows until a new high
- you can't filter out all prev highs/lows to keep just the last min/max pivots of the current swing because they were already confirmed as pivots and you can't delete/change history
- alternatively you could just pick the first high following a low and the first low following a high in a sequence and ignore the rest of the pivots in the same dir, producing a crude looking zigzag where obvious max high/min lows are ignored.
- pivot filter affects SCP/SFP signals because it skips some pivots
- pivot filter is not applied to/not affected by the unconfirmed pivots
- zigzag is affected by pivot filter, but not by the unconfirmed pivots. You can't have both high/low on the same bar in a zigzag. High has priority over Low.
- keep same bar pivots option lets you choose which pivots to keep when there are both high/low pivots on the same bar (both kept by default)
SCP/SFP Filters:
- you can confirm/filter only SCP/SFP signals with volume % change/candle size larger than delta. Higher volume/larger candle means stronger signal.
- technically SCP/SFP is always the first matching candle, but it can be invalidated by the following signal in the opposite dir which in turn can be negated by the next signal.
- show first matching SCP/SFP = true - shows only the first signal candle (and any invalidations that follow) and hides further duplicate signals in the same dir, does not highlight the trend.
- show first matching SCP/SFP = false - produces a sequence of candles with duplicate signals, highlights the whole trend until its dir changes (new pivot).
Good Luck! Feel free to learn from/reuse the code to build your own indicators!
Recherche dans les scripts pour "swing"

HMA Swing Levels [BigBeluga]An advanced swing structure and trend-following tool built on Hull Moving Average logic, designed to detect major reversals and track dynamic support/resistance zones.
This indicator analyzes price swings using pivot highs/lows and a smoothed HMA trend baseline. It highlights key reversal levels and keeps them active until breached, giving traders a clear visual framework for price structure and trend alignment. The pivots are calculated in real-time using non-lagging logic, making them highly responsive to market conditions.
🔵 CONCEPTS
Combines a fast-reacting Hull Moving Average (HMA) with pivot logic to capture precise directional changes.
Detects non-lagging reversal highs and lows when pivot points form and the HMA direction flips.
Projects these reversal levels forward as horizontal support/resistance lines until broken by price.
Active trend is shown with a step-style trail line that reflects HMA bias over time.
🔵 FEATURES
Swing Level Detection:
Identifies high/low reversals when trend direction changes and plots horizontal zones.
Non-lagging logic of swing points detection:
if h == high and high < h and change > 0
// Detected Swing High
if l == low and low > l and change < 0
// Detected Swing Low
Persistent Support & Resistance Lines:
Each detected swing high or low is extended forward until price invalidates the level. Dotted style is applied once breached.
Color-Coded Trend Trail:
Displays a stepped trend trail using HMA slope: lime = uptrend, blue = downtrend.
Automatic Labeling:
Each reversal level is labeled with its price for clear reference.
Age-Based Line Thickness:
Every level increases in thickness every 250 bars. The longer the level lasts, the stronger it is.
🔵 HOW TO USE
Use green (support) and blue (resistance) levels to frame key reaction zones.
Trade with the trend defined by the trail color: lime for bullish bias, blue for bearish.
Explore where buy or sell orders are stacked
Look for breaks of swing lines to anticipate trend shifts or breakout setups.
Adjust the "Trend Change" input to tune the sensitivity of swing detection.
Adjust the "SwingLevels" input to define how far back to search for valid pivots.
🔵 CONCLUSION
HMA Swing Levels offers a hybrid approach to structural and trend-based trading. With automated non-lagging swing detection, persistent support/resistance tracking, and intuitive HMA-based trend coloring, it provides a powerful visual system for discretionary and systematic traders alike.

Smallest Swing [Truth Indie]This indicator is designed to test the smallest swing draw using the swing capture concept of the Pivot Points High Low indicator, setting the length to 1 for all periods, and combining it with price action that I think makes sense.
Example of a valid swing high.
Example of a valid swing low.

[blackcat] L2 Swing Oscillator Swing MeterLevel: 2
Background
Swing trading is a type of trading aimed at making short to medium term profits from a trading pair over a period of a few days to several weeks. Swing traders mainly use technical analysis to look for trading opportunities. In addition to analyzing price trends and patterns, these traders can also use fundamental analysis.
Function
L2 Swing Oscillator Swing Meter is an oscillator based on breakouts. Another important feature of it is the swing meter, which confirms the top or bottom's confidence level with different color candles. The higher of the candles stack up, the higher confidence level is indicated.
Key Signal
absolutebot ---> absolute bottom with very high confidence level
ltbot ---> long term bottom with high confidence level
mtbot ---> middle term bottom with moderate confidence level
stbot ---> short term bottom with low confidence level
absolutetop ---> absolute top with very high confidence level
lttop ---> long term top with high confidence level
mttop ---> middle term top with moderate confidence level
sttop ---> short term top with low confidence level
fastline ---> oscillator fast line
slowline ---> oscillator slow line
Pros and Cons
Pros:
1. reconfigurable swing oscillator based on breakouts
2. swing meter can confirm/validate the bottom and top signal
Cons:
1. not appliable with trading pairs without volume information
2. small time frame may not trigger swing meter function
Remarks
This is a simple but very comprehensive technical indicator
Readme
In real life, I am a prolific inventor. I have successfully applied for more than 60 international and regional patents in the past 12 years. But in the past two years or so, I have tried to transfer my creativity to the development of trading strategies. Tradingview is the ideal platform for me. I am selecting and contributing some of the hundreds of scripts to publish in Tradingview community. Welcome everyone to interact with me to discuss these interesting pine scripts.
The scripts posted are categorized into 5 levels according to my efforts or manhours put into these works.
Level 1 : interesting script snippets or distinctive improvement from classic indicators or strategy. Level 1 scripts can usually appear in more complex indicators as a function module or element.
Level 2 : composite indicator/strategy. By selecting or combining several independent or dependent functions or sub indicators in proper way, the composite script exhibits a resonance phenomenon which can filter out noise or fake trading signal to enhance trading confidence level.
Level 3 : comprehensive indicator/strategy. They are simple trading systems based on my strategies. They are commonly containing several or all of entry signal, close signal, stop loss, take profit, re-entry, risk management, and position sizing techniques. Even some interesting fundamental and mass psychological aspects are incorporated.
Level 4 : script snippets or functions that do not disclose source code. Interesting element that can reveal market laws and work as raw material for indicators and strategies. If you find Level 1~2 scripts are helpful, Level 4 is a private version that took me far more efforts to develop.
Level 5 : indicator/strategy that do not disclose source code. private version of Level 3 script with my accumulated script processing skills or a large number of custom functions. I had a private function library built in past two years. Level 5 scripts use many of them to achieve private trading strategy.

RSI true swingsRelative Strength Index (RSI) is being used by majority of the traders to get benefitted based on the swings. But these swings are hard to Identify.
This Indicator uses 4 major factors for finding the potential reversal points:
RSI Crossover or crossunder
Relative volume
Overall volume against the moving average volume
Relative closing of the candles
Size of the bars
Please read Instructions carefully before using this indicator
Recommended entry is the OHLC4 of the signal bars.
If signal bar is too large, try to enter in the retracement when another signal comes either through indicator or through types of bars
when signals comes opposite to the trend, then try to wait for the next signal of same type. This creates a RSI-price divergence in confirmation by volume price action
Timeframe can be of your choice
Recommended stoploss should be swing highs or lows

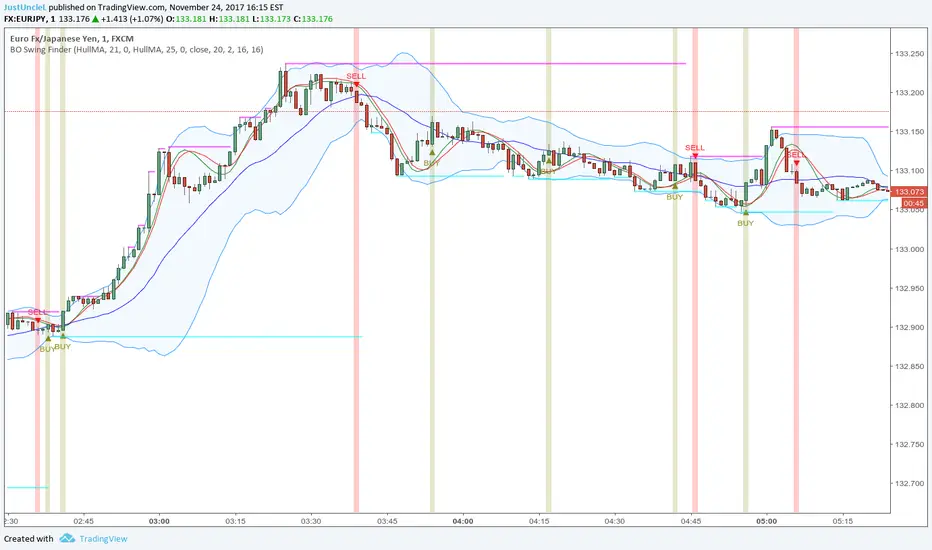
BO Swing Finder R0.6 by JustUncleLThis indicator alert study attempts to detect confirmed Swing points. It uses Bollinger Band centre line crosses as the main signal. The main detection occurs by looking for the first BB centre line cross that was initiated from outside the Bollinger Channel (alternatively KC channel can be used).
The optional HullMA (any any other MA pair) are used to confirm the swing direction. The indicator also plots the two KitKat Support and Resistance lines with optional High/Low labelling on KitKat1 lines.
This indicator tool is suitable for any time frame and can be traded with Binary Option (even 1min) orders (2-3 candle expiry) or as Forex trade orders. It is suitable for Currencies, Cryptocurrencies and Metals. May also be useful on other markets as well.
The MA filtering options, each MA line can be a different type, with an optional offset:
SMA = Simple Moving Average.
EMA = Exponential Moving Average.
WMA = Weighted Moving Average
VWMA = Volume Weighted Moving Average
SMMA = Smoothed Simple Moving Average.
DEMA = Double Exponential Moving Average
TEMA = Triple Exponential Moving Average.
HullMA = Hull Moving Average, fast moving MA.
SSMA = Ehlers Super Smoother Moving average, similar results to HullMA.
ZEMA = Near Zero Lag Exponential Moving Average.
TMA = Triangular (smoothed) Simple Moving Average.
NOTE: The signal calculations do occur on the current candle, so the state of the signal may re-build until the current candle is closed. I have designed the script to behave this way on purpose. This gives traders the option of
preparing their trade early or even taking the trade early if they want. Otherwise the trader can be more conservative and wait for signal candle to close, to give them a confirmed signal. (This is NOT re-painting as the historical signal states are fixed and will not change, unless you change some setup options.)
Hints:
1) As with all indicator and alerting tools, not all signals will yield a tradable successful swing. You need to apply you own analysis on each signal to determine the probability of success.
2) When using the MA to filter the signals you should use it for two types of filtering:
Supportive that confirm swing like fast moving MAs with fairly short lengths, eg HullMA(21,25).
Long Term Direction with smoother longer length MAs like SMMA(180,220) to show up swings back into direction of the longer term trends.
Inspiration: @Lyiness
References:
Momentum VMA KITKAT CROSS v2.1 by vdubus (- Vdubus_Channel www.vdubus.co.uk)
FVG + Swings + ConfigurableOverview
This Pine Script v5 indicator highlights Fair Value Gaps (FVGs), plots swing‑high and swing‑low pivots, and marks single breakouts above the last swing‑high or below the last swing‑low by recoloring the breakout candle. Every aspect—gap size, count limits, colors, and feature toggles—is exposed as an input so you can tailor it to your own workflow.
Key Features
Fair Value Gaps
Detects bullish gaps when the high of bar i-2 is below the low of the current bar.
Detects bearish gaps when the low of bar i-2 is above the high of the current bar.
Draws a semi‑transparent rectangle spanning from bar i-2 to bar i + extension.
Automatically deletes oldest boxes when exceeding the user’s “Max FVG Boxes” limit.
Swing‑High / Swing‑Low Pivots
Identifies a swing‑high when the middle candle of a three‑bar sequence has the highest high.
Identifies a swing‑low when the middle candle has the lowest low.
Marks each pivot with a tiny dot above (high) or below (low) the bar.
Single Breakouts
Tracks the most recent swing‑high and swing‑low levels.
On the first close above the last swing‑high (or below the last swing‑low), recolors that single candle.
Prevents repeated coloring until a new swing pivot forms.
Full Customization
Show/Hide toggles for FVGs, swing pivots, breakouts.
Numeric inputs for FVG extension length and maximum retained boxes.
Color pickers for bullish/bearish gaps, swing pivots, and breakout candles.

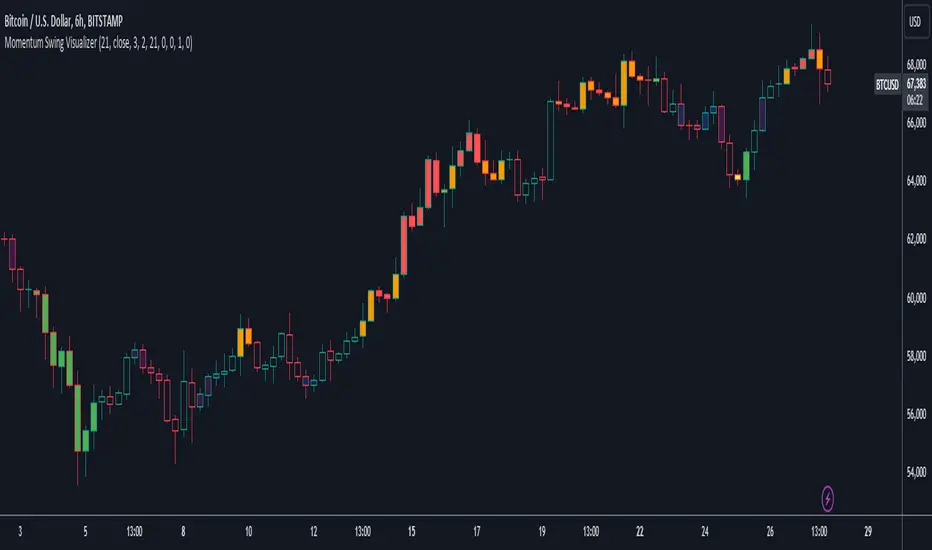
User Defined Momentum Change with Swing VisualsThis script is a groundbreaking, math-centric technical analysis tool that blends two well-established indicators, the Stochastic Oscillator and the Exponential Moving Average (EMA), to deliver a unique and visually engaging way of identifying momentum swings and stochastic indicators. Unlike mashups, this script is tailored to accommodate a wide range of trading strategies, providing traders with a distinctive perspective on market trends.
The innovation in this script lies in its mathematically-driven ability to effectively combine the Stochastic Oscillator and EMA, setting it apart from other available tools that simply offer a rehash of old ideas or slight modifications to popular indicators. The EMA is employed instead of a Simple Moving Average (SMA), enhancing the uniqueness of the calculations. This novel approach creates a new dimension for traders to evaluate potential momentum swings and visualize them on the chart, proving it to be more than just a mere mashup of existing indicators.
Central to the script's utility is its extensive customization options, which allow traders to adjust various inputs to suit their preferences and trading strategies. Users can modify the EMA length, swing range signal offsets, and smoothing factors for both the fast and slow components of the Stochastic Oscillator. Additionally, the script offers the ability to personalize the color thresholds, transparency, and line properties for the Stochastic Oscillator and swing range signal.
This script's visually dynamic representation of momentum swings empowers traders to make more informed trading decisions, particularly on the 6-hour timeframe. The swing range signal, represented by vertical lines on the chart, acts as a valuable visual aid for identifying potential entry or exit points. Furthermore, the Stochastic Oscillator provides insights into the strength and direction of momentum, which is beneficial for confirming potential trade signals.
To conclude, this script is not just another combination of MAs or a slightly modified version of a popular indicator. Instead, it offers traders a comprehensive, visually appealing, and customizable tool for technical analysis, which is both original and useful. By uniquely combining the EMA and the Stochastic Oscillator with a strong mathematical foundation, and allowing traders to adjust a variety of settings, this script adds value to the TradingView community and enhances the body of knowledge available for traders. It is designed to support traders in tailoring their analysis based on their own strategies and preferences, enabling them to make well-informed decisions in the financial markets.
[Tutorial] RSIwings (swings) for find pyramiding entries ->hh,llThis indicator show higher high + higher low and lower high + lower low -> based on RSI modification.
HOW I USE
On a longsetup I set a buyorder on the high, if the RSI swings show red the first time. My stoploss I choose on the lowest price from the red swing before.
After every ending bar without tradeentry I move the buyorder step by step on the last high till the price move up and the longtrade start.
The same game I use for sellorder with the green swings, if I want a shortsetup. Best times for this are retracements from a trendchannel i.e.
HOW I PYRAMIDING
From swing to swing with the same color I move my stoploss. If my risk are 100 USD and with the next moving stoploss are only 60 USD in risk, then I have 40 USD for my next pyramiding trade in the same trendsetup.
WHEN I MOVE MY STOPLOSS
If I have choose a stoploss, than this is fixed till the last highest/lowest price from the other swing is broken.
Any questions? Ask me!

Intermarket Swing Projection [LuxAlgo]The Intermarket Swing Projection allows traders to plot price movement swings from any user-selected asset directly onto the chart in the form of zigzags and/or horizontal support and resistance levels.
This tool rescale the external asset price on the user chart, enabling traders to make direct comparisons.
It answers the question of how different the price behavior is between two assets, accounting for each asset's volatility.
🔶 USAGE
This tool is based on swing detection of two different assets: the chart and a user-selected asset. It allows traders to compare two assets on an equal footing while accounting for volatility and price behavior.
Traders can customize the detection by selecting a custom ticker, timeframe, the number of swings and length for swing detection. This makes the tool a Swiss army knife for asset comparison.
As we can see in the image below, the Show Last, Pivot Length, and Spread parameters are key to defining the final output of the tool.
"Show Last" defines how many pivots are displayed. "Pivot Length" is used for pivot detection; a larger value will detect larger market structures. "Spread" defines how far apart the horizontal levels will be from their original location in terms of volatility.
🔹 Comparing different assets
This image shows the Nasdaq 100 futures contract compared to four other futures contracts: S&P 500, gold, bitcoin, and euro/U.S. dollar.
Plotting all of these assets in Nasdaq 100 terms makes it easy to compare and analyze price behaviors and identify key levels.
In the top left chart, we have NQ vs. ES. It's no surprise that they are practically an exact match; a large portion of the S&P 500 is technology.
In the top right chart, NQ vs. GC, we see totally different behaviors. We can clearly see the summer consolidation in gold and the resumption of the uptrend, which took gold above 29,200 NQ points, up from 21,200.
In the bottom right chart, we see bitcoin making new highs, way above the Nasdaq in May, July, and October. However, the last high was way below the Nasdaq prices on October 27—the first lower high in a while. Sellers are pushing down.
Finally, the bottom left chart is NQ vs. 6E. We can see large volatility in the uptrend since February, with NQ unable to catch up until now. The last swing low was almost a match, and 6E is in a range.
As we can see, this tool allows us to perform intermarket analysis properly by accounting for each asset's volatility and price behavior. Then, we plot them on the same scale on equal terms, which makes performing this kind of analysis easy.
As we can see in the chart above, the assets are the same as in the previous image, but the timeframe is 1H with different settings.
Note the horizontal levels acting as support and resistance, as well as how NQ prices react to the zones marked with white circles. These levels are derived from custom assets selected by the user.
🔹 Displaying Elements
Zig-zag allows traders to clearly see the path that the selected asset's price took, as well as its turning points.
Horizontal levels are displayed from those turning points to the present and can be used as support or resistance. Traders can adjust the spread parameter in the settings panel to expand or contract those levels' volatility.
There are two color modes for the levels: average and pivots. In the first mode, green is used for levels below the average and red for levels above the average. The second uses green for swing lows and red for swing highs.
The backpaint feature is enabled by default and allows the swings to be displayed in the correct location. With this feature disabled, the swings will be displayed in the current location when a new swing is detected.
🔶 DETAILS
On a more technical note, the rescaling is formed by calculating three main elements from all the swings detected on the custom and chart assets:
The chart asset's average of all swing points
The chart asset's standard deviation of all swing points
The custom asset's z-score for each swing point
Then, the re-scaled swing point is calculated as the average plus the z-score multiplied by the standard deviation. This makes it possible to plot AAPL swings on an NQ chart, for example.
Thanks to re-scaling, we can directly compare the price behavior of two assets with different price ranges and volatility on the same chart.
🔶 SETTINGS
🔹 Trendlines
Ticker: Select the custom ticker.
Timeframe: Select a custom timeframe.
Show Last: Select how many swing points to display.
Pivot Length: Select the size for swing point detection.
Spread: Volatility multiplier for horizontal levels. Larger values mean the levels are farther apart.
Backpaint: Enable or disable the backpaint feature. When enabled, the drawings will be displayed where they were detected. When disabled, the drawings will be displayed at the moment of detection.
🔹 Style
Show ZigZag: Enable or disable the ZigZag display and choose a line style.
Show Levels: Enable or disable the levels display and choose a line style.
Color Mode: Choose between Average Mode, which colors all levels below the average bullish and all levels above bearish, and Pivot Mode, which colors swing highs bearish and swing lows bullish.
Bullish: Select a bullish color.
Bearish: Select a bearish color.
ZigZag: Select the ZigZag color.

High Time Frame (HTF) Swing PointsIdentify and display swing highs and lows across multiple higher timeframes on a chart, overlaying horizontal lines and customizable labels at these swing points.
Timeframes
Five user-defined higher timeframes (default settings: 5-minute, 15-minute, 1-hour, 4-hour, and daily)
Manually show/hide individual timeframes
When chart’s timeframe is set higher than one of the five configured, the indicator will automatically hide it. This helps to prevent clutter when navigating between timeframes on the chart
Swing Levels
Configure the line color, opacity, width and weather it’s solid/dotted/dashed
Once swing levels are identified, the indicator will look for the chart candle where the line starts
When price crosses the swing level, the line will be terminated
Tags
Customize the tag text for each individual timeframe, using blank if a tag is not desired for that timeframe
A tag text color can be set for all tags or base it on the line color
Set tag text size based on: Auto, Tiny, Small, Normal, Large
Choose how far to the right of the line the tag text should appear, as an integer representing the size of a candle
Choose to clear the tag or leave it in place after price crosses a swing level
Use Cases
Visualize key swing points from higher timeframes to identify potential reversal or breakout zones
Identify possible low resistance liquidity run (LRLR) areas
Use swing points for stop placement or as targets or draws on liquidity

Correct Fractal Swings by CRYPTOFORThis indicator adjusts and enhances the normal 3-fractal swing. The author of this definition, uncle_travis, takes into account swings with the absorption of 3 candles and uses them as structure points.


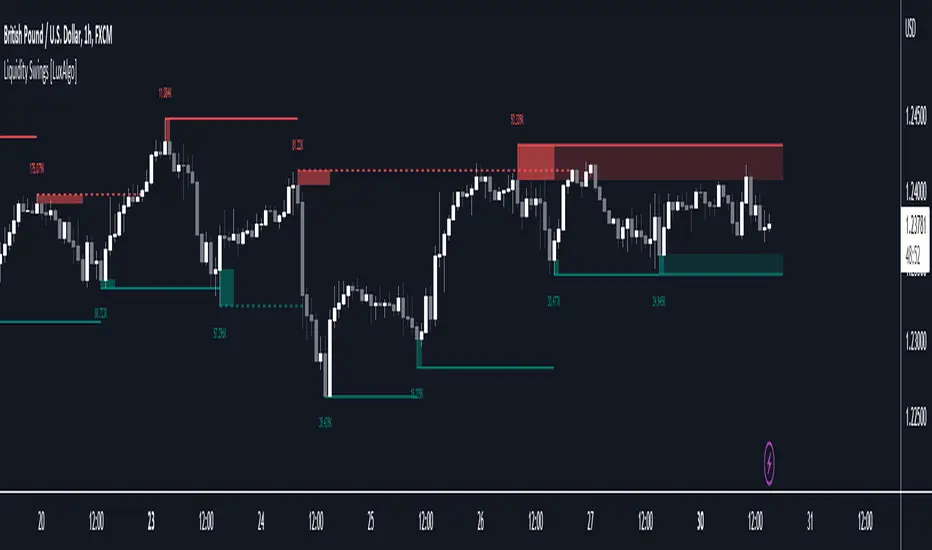
Liquidity Swings [LuxAlgo]The liquidity swings indicator highlights swing areas with existent trading activity. The number of times price revisited a swing area is highlighted by a zone delimiting the swing areas. Additionally, the accumulated volume within swing areas is highlighted by labels on the chart. An option to filter out swing areas with volume/counts not reaching a user-set threshold is also included.
This indicator by its very nature is not real-time and is meant for descriptive analysis alongside other components of the script. This is normal behavior for scripts detecting pivots as a part of a system and it is important you are aware the pivot labels are not designed to be traded in real-time themselves.
🔶 USAGE
The indicator can be used to highlight significant swing areas, these can be accumulation/distribution zones on lower timeframes and might play a role as future support or resistance.
Swing levels are also highlighted, when a swing level is broken it is displayed as a dashed line. A broken swing high is a bullish indication, while a broken swing low is a bearish indication.
Filtering swing areas by volume allows to only show significant swing areas with an higher degree of liquidity. These swing areas can be wider, highlighting higher volatility, or might have been visited by the price more frequently.
🔶 SETTINGS
Pivot Lookback : Lookback period used for the calculation of pivot points.
Swing Area : Determine how the swing area is calculated, "Wick Extremity" will use the range from price high to the maximum between price close/open in case of a swing high, and the range from price low to the minimum between price close/open in case of a swing low. "Full Range" will use the full candle range as swing area.
Intrabar Precision : Use intrabar data to calculate the accumulated volume within a swing area, this allows obtaining more precise results.
Filter Areas By : Determine how swing areas are filtered out, "Count" will filter out swing areas where price visited the area a number of time inferior to the user set threshold. "Volume" will filter out swing areas where the accumulated volume within the area is inferior to the user set threshold.
🔹 Style
Swing High : Show swing highs.
Swing Low : Show swing lows.
Label Size : Size of the labels on the chart.
Note that swing points are confirmed after Pivot Lookback bars, as such all elements are displayed retrospectively.
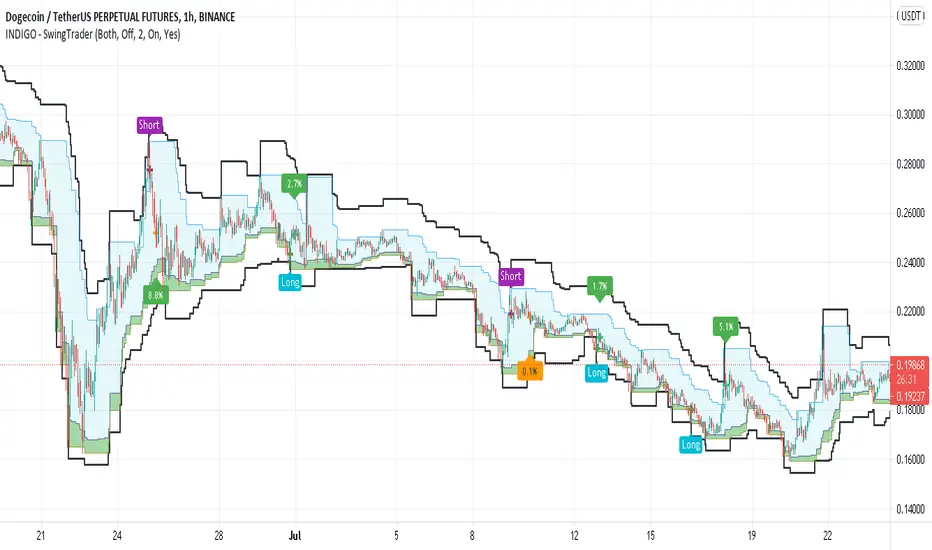
INDIGO - SwingTraderThis is a script that uses a couple of other indicators to find good swing trade entry's and exit's. You can choose which signals the script uses to calculate the position of the signals.
It uses the following:
- Stoch RSI
- MACD
- POC
- INDIGO Cloud
Also added are volume candles, acceleration of momentum indicators (triangle) and MACD candles. This way you can see more info to decide if the entry is valid.
I have used a couple of public scripts and tried to give credit to the original creators. If there is any script that hasn't been credited, please contact me.
Feedback is very much appreciated, positive and negative. Also If you have any question, feel free to ask me. I'll try to answer asap.
Enjoy the script :)
Swing Wicks + Bodies; Stolen from LeviathanSwing Wicks + Bodies — Stolen from Leviathan
This indicator automatically detects swing highs and lows by separating wick swings from body swings, providing a precise view of liquidity zones on the chart.
It draws:
• wick-based swing levels
• body-based swing levels
• dynamic liquidity boxes showing unfilled price zones
• touch counters (T1, T2, T3…)
• optional HTF levels (H1/H4…) for multi-timeframe context
Included features:
• hide filled levels
• keep only the most recent unfilled levels
• full customization (colors, line styles, text size, minimum box height)
• optional “extend until filled” mode
• volume threshold filter
• lookback limitation (history in days)

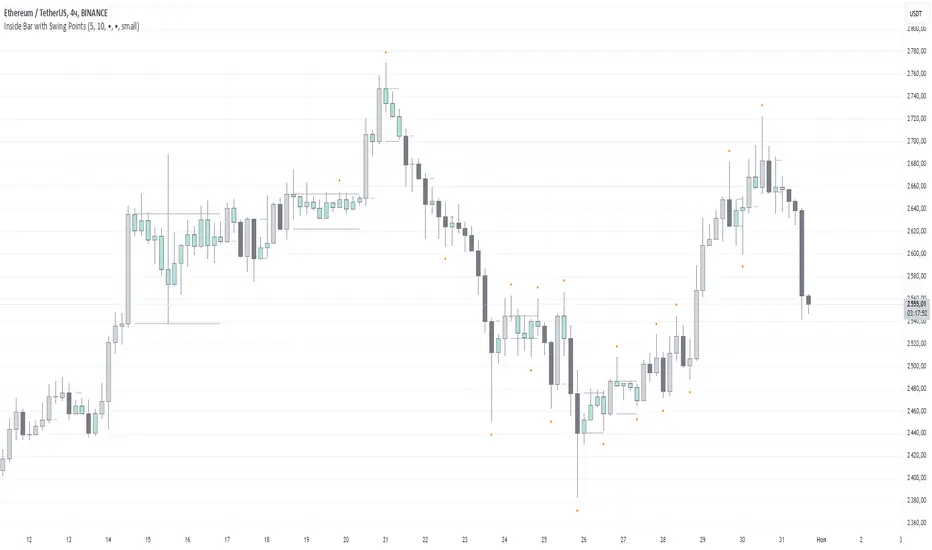
Inside Bar with Swing PointsSwing Points with Inside Bar
This script combines swing point analysis with an inside bar pattern visualization, merging essential concepts to identify and visualize key price levels and potential trend reversals. This is especially useful for traders looking to understand price action through swing levels and reactions within inside bar boundaries, making it effective for short-term trend analysis and reversal zone identification.
Script Features:
Swing Point Analysis:
The script identifies swing points based on fractals with a configurable number of bars, allowing for a choice between three and five bars, helping traders fine-tune sensitivity to price movements.
Swing points are visualized as labels, highlighting potential reversal or continuation zones in the price chart.
Inside Bar Visualization:
Inside bars are defined as bars where both the high and low are contained within the previous bar. These often signal consolidation before a potential breakout.
The script displays boundaries of the mother bar (the initial bar encompassing inside bars) and colors candles accordingly, highlighting those within these boundaries.
This feature helps traders focus on price areas where a breakout or trend shift may occur.
Utility and Application:
The script enables traders to visualize inside bars and swing points, which is particularly useful for short-term traders focused on reversal or trend continuation strategies.
Combining swing point analysis with inside bar identification offers a unique approach, helping traders locate key consolidation zones that may precede significant price moves.
This provides not only strong support and resistance levels but also insights into probable breakout points.
How to Use the Script:
Set the number of bars for swing point analysis (3 or 5) to adjust fractal sensitivity.
Enable mother bar boundary visualization and color indication for inside bars to easily spot consolidation patterns.
Pay attention to areas with multiple swing points and inside bars, as these often signal potential reversal or breakout zones.
This script offers flexible tools for analyzing price movements through both swing analysis and consolidation zone identification, aiding decision-making under uncertainty and enhancing market structure understanding.
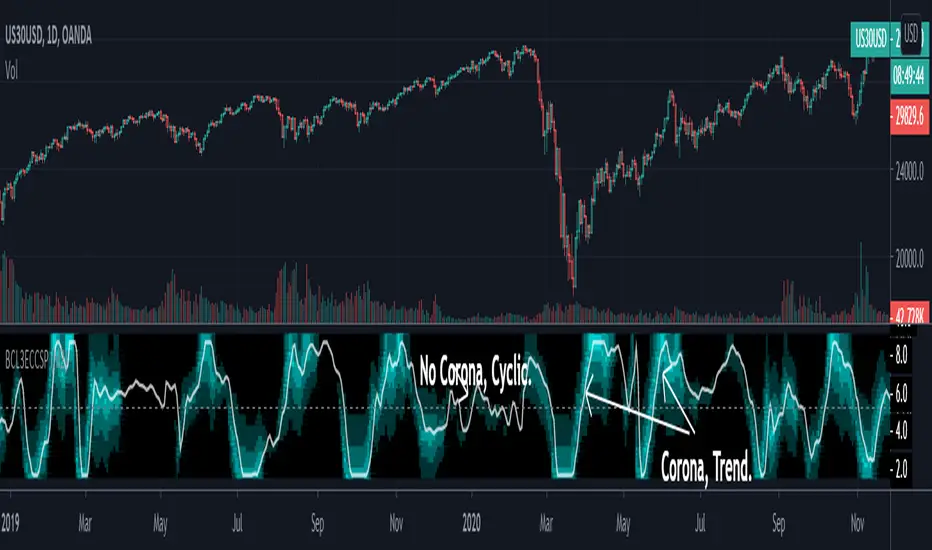
[blackcat] L3 Ehlers Enhanced Corona Swing PositionLevel: 3
Background
John F. Ehlers introuced Enhaced Corona Swing Position Indicator in April, 2012.
Function
John Ehlers's corona indicators, "Corona Charts," provide a "multidimensional" view of market activity. In the article "Corona Charts" in Nov, 2008, John Ehlers further developed his earlier work on market cycles. A new kind of indicator was presented that uses a glow-like effect to present another dimension of data. Implementation of corona charts in pine v4 helps detect dominant cycles in data. It provides a corona chart for swing positions indicator. He made an enhanced version of corona chart after 4 years, which could be used as a range filter to detect sideways and trends. Dr . Ehlers claims that a corona is displayed when the market is in a trend and there is little cyclic component. The swing position indicator shows the phasing of the data within the dominant cycle. In a pure cycle the Swing Position will trace out the shape of a sine wave.
Key Signal
DomCyc ---> Dominant Cycle
Raster ---> Corona Raster Array
Pros and Cons
100% John F. Ehlers definition translation, even variable names are the same. This help readers who would like to use pine to read his book.
Remarks
The 79th script for Blackcat1402 John F. Ehlers Week publication.
Readme
In real life, I am a prolific inventor. I have successfully applied for more than 60 international and regional patents in the past 12 years. But in the past two years or so, I have tried to transfer my creativity to the development of trading strategies. Tradingview is the ideal platform for me. I am selecting and contributing some of the hundreds of scripts to publish in Tradingview community. Welcome everyone to interact with me to discuss these interesting pine scripts.
The scripts posted are categorized into 5 levels according to my efforts or manhours put into these works.
Level 1 : interesting script snippets or distinctive improvement from classic indicators or strategy. Level 1 scripts can usually appear in more complex indicators as a function module or element.
Level 2 : composite indicator/strategy. By selecting or combining several independent or dependent functions or sub indicators in proper way, the composite script exhibits a resonance phenomenon which can filter out noise or fake trading signal to enhance trading confidence level.
Level 3 : comprehensive indicator/strategy. They are simple trading systems based on my strategies. They are commonly containing several or all of entry signal, close signal, stop loss, take profit, re-entry, risk management, and position sizing techniques. Even some interesting fundamental and mass psychological aspects are incorporated.
Level 4 : script snippets or functions that do not disclose source code. Interesting element that can reveal market laws and work as raw material for indicators and strategies. If you find Level 1~2 scripts are helpful, Level 4 is a private version that took me far more efforts to develop.
Level 5 : indicator/strategy that do not disclose source code. private version of Level 3 script with my accumulated script processing skills or a large number of custom functions. I had a private function library built in past two years. Level 5 scripts use many of them to achieve private trading strategy.
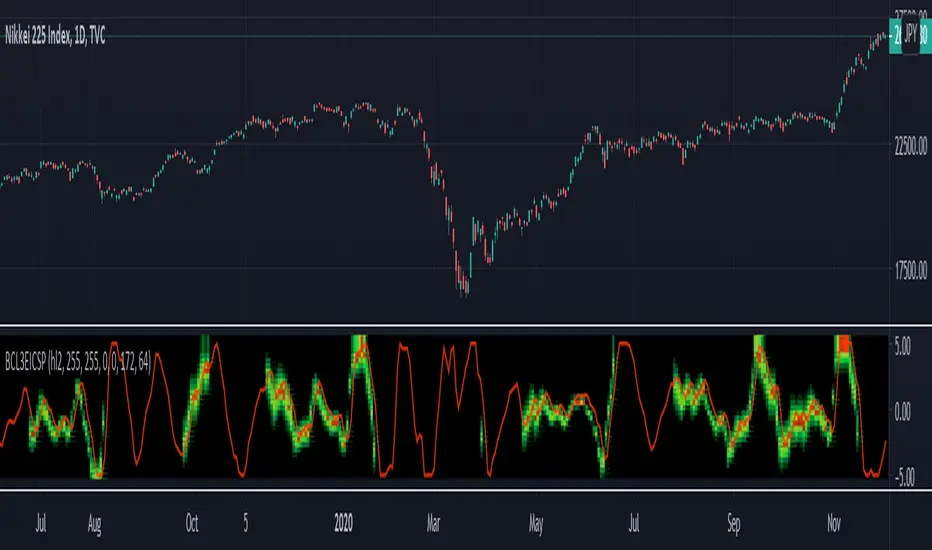
[blackcat] L3 Ehlers Corona Charts Swing PositionLevel: 3
Background
John F. Ehlers introuced Corona Charts Swing Position Indicator in Nov, 2008.
Function
John Ehlers's corona indicators, "Corona Charts," provide a "multidimensional" view of market activity. In the article "Corona Charts" in Nov, 2008, John Ehlers further developed his earlier work on market cycles. A new kind of indicator was presented that uses a glow-like effect to present another dimension of data. Implementation of corona charts in pine v4 helps detect dominant cycles in data. It provides a corona chart for swing positions indicator.
Dr. Ehlers claims that a corona is displayed when the market is in a trend and there is little cyclic component. The swing position indicator shows the phasing of the data within the dominant cycle. A value of -5 means the cycle is at its valley. A value of +5 means the cycle is at its peak. In a pure cycle the Swing Position will trace out the shape of a sine wave. However, I normalized it to overlay it together with Corona Chart heat maps.
Key Signal
DomCycle--> Ehlers Dominant Cycle
Plot2~Plot50--> Ehlers Corona Charts Swing Position Heat Map
Pros and Cons
100% John F. Ehlers definition translation, even variable names are the same. This help readers who would like to use pine to read his book.
Remarks
The 74th script for Blackcat1402 John F. Ehlers Week publication.
Readme
In real life, I am a prolific inventor. I have successfully applied for more than 60 international and regional patents in the past 12 years. But in the past two years or so, I have tried to transfer my creativity to the development of trading strategies. Tradingview is the ideal platform for me. I am selecting and contributing some of the hundreds of scripts to publish in Tradingview community. Welcome everyone to interact with me to discuss these interesting pine scripts.
The scripts posted are categorized into 5 levels according to my efforts or manhours put into these works.
Level 1 : interesting script snippets or distinctive improvement from classic indicators or strategy. Level 1 scripts can usually appear in more complex indicators as a function module or element.
Level 2 : composite indicator/strategy. By selecting or combining several independent or dependent functions or sub indicators in proper way, the composite script exhibits a resonance phenomenon which can filter out noise or fake trading signal to enhance trading confidence level.
Level 3 : comprehensive indicator/strategy. They are simple trading systems based on my strategies. They are commonly containing several or all of entry signal, close signal, stop loss, take profit, re-entry, risk management, and position sizing techniques. Even some interesting fundamental and mass psychological aspects are incorporated.
Level 4 : script snippets or functions that do not disclose source code. Interesting element that can reveal market laws and work as raw material for indicators and strategies. If you find Level 1~2 scripts are helpful, Level 4 is a private version that took me far more efforts to develop.
Level 5 : indicator/strategy that do not disclose source code. private version of Level 3 script with my accumulated script processing skills or a large number of custom functions. I had a private function library built in past two years. Level 5 scripts use many of them to achieve private trading strategy.
Fractals | Swing Points | Highs & Lows | Custom PeriodsSimple script which marks out key swing highs & lows.
One of the only indicators I have on the chart most days
- perfect for naked charting
- quickly helps you to visually identify key areas of interest
An extension of Bill Williams fractals
- aka short term swing points
Allows you to filter for only the most prominent swing points
- you can even overlay multiple swingpoint filters in different colours (as per example chart)
The number ( Fractal Periods) is simply:
- the number of less prominent points either side of your swing high/low
- example shown on the chart
Otherwise make a fist
- look at your 5 knuckles
- swing high is your middle knuckle
- 2 lower points either side
Bill Williams Original Fractal:
Fractal Periods = 2
Your Fractal Period for Filtering:
3, 4, 5, 30, 365, etc
Allows you to find swing points down to:
Fractal Periods = 1
Simple, easy, shared to enjoy =)

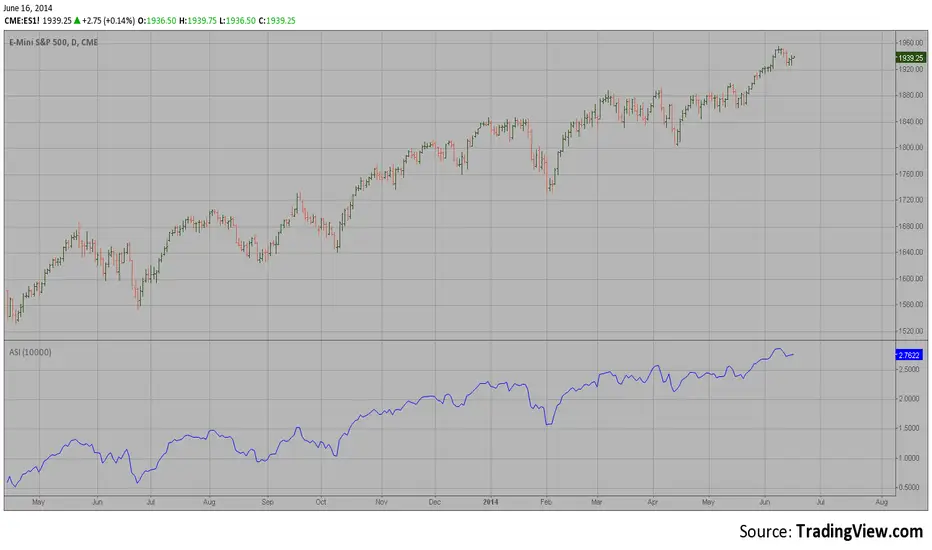
Accumulation Swing Index The Accumulation Swing Index is a cumulative total of the Swing Index.
The Accumulation Swing Index was developed by Welles Wilder.
The SwingIndex function was developed to help cut through the maze of
Open, High, Low and Close prices to indicate the real strength and direction
of the market. The Swing Index function looks at the Open, High, Low and
Close values for a two-bar period. The theory is that there are four cross-bar
and one intra-bar comparisons that are strong indicators of an up or down day.
The Swing Index returns a number between -100 and 100. If the factors point toward
an up day, then the function value will be positive and vice versa. In this way,
the Swing Index gives us definite short-term swing points, and it can be used to
supplement other methods as a breakout indicator. A breakout is indicated when the
value of the Accumulation Swing Index (ASI) exceeds the ASI value on the day when a
previous significant High Swing Point was made. A downside breakout is indicated when
the value of the ASI drops below the ASI value on a day when a previous significant
low swing point was made.
Since only futures have a relative daily limit value, this function only makes sense
when applied to a futures contract. If you use this function and it only plots a zero
flat line, check the Daily Limit value.
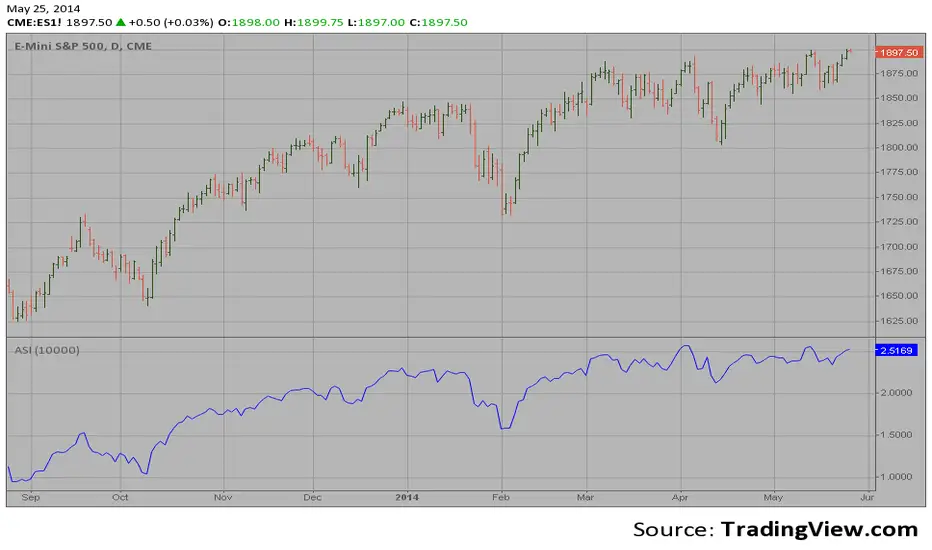
Accumulation Swing Index (ASI) The Accumulation Swing Index is a cumulative total of the Swing Index.
The Accumulation Swing Index was developed by Welles Wilder.
The SwingIndex function was developed to help cut through the maze of
Open, High, Low and Close prices to indicate the real strength and direction
of the market. The Swing Index function looks at the Open, High, Low and
Close values for a two-bar period. The theory is that there are four cross-bar
and one intra-bar comparisons that are strong indicators of an up or down day.
The Swing Index returns a number between -100 and 100. If the factors point toward
an up day, then the function value will be positive and vice versa. In this way,
the Swing Index gives us definite short-term swing points, and it can be used to
supplement other methods as a breakout indicator. A breakout is indicated when the
value of the Accumulation Swing Index (ASI) exceeds the ASI value on the day when a
previous significant High Swing Point was made. A downside breakout is indicated when
the value of the ASI drops below the ASI value on a day when a previous significant
low swing point was made.
Since only futures have a relative daily limit value, this function only makes sense
when applied to a futures contract. If you use this function and it only plots a zero
flat line, check the Daily Limit value.
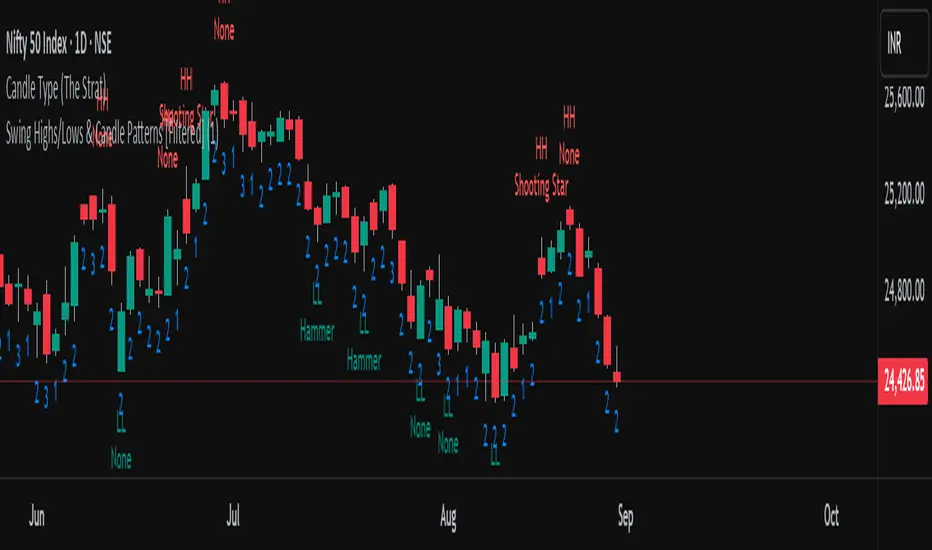
Swing Highs/Lows & Candle Patterns[LuxAlgo] [Filtered]Swing Highs/Lows & Candle Patterns - Tweaked Version
This indicator is a customized and enhanced version of LuxAlgo’s original Swing Highs/Lows & Candle Patterns indicator. It identifies and labels critical swing high and swing low points to help visualize market structure, alongside detecting key reversal candlestick patterns such as Hammer, Inverted Hammer, Bullish Engulfing, Hanging Man, Shooting Star, and Bearish Engulfing.
With added options to selectively display only Lower Highs (LH) and Higher Lows (HL), this tweaked version offers greater flexibility for traders focusing on specific market dynamics. Users can also customize the lookback length and label styling to fit their preferences.
Credit to LuxAlgo for the original concept and foundation of this powerful tool, which this script builds upon to support more tailored technical analysis. Ideal for swing traders and technical analysts seeking improved entry and exit signals through a combination of price swings and candlestick pattern recognition.