profit_trailer_backtesting v2As a result of I can't update my previous post,https://www.tradingview.com/script/2SdFFndn/,I just post new one,change the visibility to protected.
Features:
Backtesting in profit trailer's strategy.
Support profit trailer's buy strategy :
HIGHBB,LOWBB,EMAGAIN,EMASPREAD,EMACROSS,SMAGAIN,SMASPREAD,SMACROSS
Sell strategy:
GAIN,HIGHBB
DCA_buy strategy:
LOWBB,EMAGAIN,EMASPREAD,SMAGAIN,SMASPREAD,SMACROSS
DCA_sell strategy:
GAIN,HIGHBB
SOM(Sell only mode),Use BTCUSD data in specific time range, because of the limit of tradingview,you will need to change the data resolution by BTC_data_source_resolution to backtest further date from now,but the result will be inaccurate.
trailing buy > This method may not be in the same way as PT itself,because we can't truly get the bid and ask in order book by tradingview. set it to 0 if you don't want to use it.
Indicators of those strategy.
PLEASE READ THE NOTE BELOW IF YOU WANT TO USE DCA STRATEGY
DCA_enabled_value (negative number) should be ALWAYS > ALL_stop_limit_trigger or the script will just do stop loss,this follow the setting of PT.
And it means the value of net loss you want to let the trade to be DCA. if second trade (DCA trade) be made, all setting prefix by ALL_ will be ignored exclude ALL_BTC_XXX prefix for sell only mode.
CA_buy_contracts will overwrite the value you set in script option > properties > order size to number of contract,default is 100% in qty_percent.
DCA_buy_value work like same thing ALL_buy_value does.
DCA_buy_trigger is the net loss value (negative number) of open trades,if statement of strategy reach and net loss < DCA_buy_trigger,the DCA will buy.
DCA_sell_trigger will only work when DCA sell strategy is HIGHBB,it work like ALL_min_profit.
DCA_sell_value means % profit in GAIN, % of BB in HIGHBB.
DCA_stop_loss_trigger will only work when ALL BUYS have be completed,that means if you set DCA_max_buy_times = 10 ,the script will buy 11 times include the first buy(not DCA buy).
The indicators of DCA may looks terrible,you can turn them off in option.
comment if you got bug or anything suggestion.
ToDo:
rebuy_time,stop_loss_timeout
Feel free to buy me some redbull.
ETH:
0xd793607CBA1d07fE5A94884076AE94C36B6e7D8d
Recherche dans les scripts pour "the script"

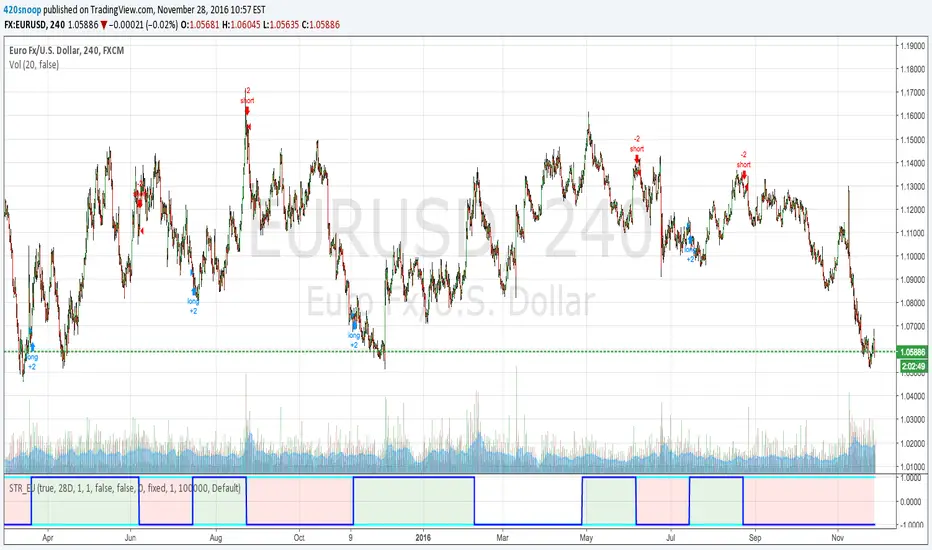
Euro/Dollar StrengthHey all,
I have been using this strategy for a while, just like my last script (XAG/USD Spread) this utilizes my 'holy grail' method of basket weighting (aka why the script is protected).
This script just looks for periods of time when the euro is gaining against a basket of currencies and the USD is losing vs the basket (and vice versa)
I use this script on the 4H time frame; although I can make this script work for almost any currency pair and time frame I have the most success with EURUSD 4H.
I personally use 3 of these 'strength meters' in triangular arbitrage for EU UJ and EJ
if I get good feedback and support I may publish the other 2 of the 'triangle' or even make a version that automatically detects the currency pair and adjusts settings accordingly.
Thanks for the feedback and support, hope this helps!
Snoop
Market Solver Pro [Eˣ]Market Solver Pro is a multi-layer trend-and-structure based strategy designed to help traders study how price behaves around higher-timeframe support, resistance, and momentum shifts. It combines three core concepts into a single framework:
1. Multi-Timeframe Structure Zones (Support/Resistance Gradient)
The script identifies swing-based higher-timeframe pivot highs (PH) and pivot lows (PL).
These levels form dynamic zones where price frequently reacts. A gradient is displayed between the PH and PL to help traders visually understand where price sits within the broader structure.
This zone system is built using:
A structure timeframe (W/D/60 depending on chart TF)
Multi-step pivot validation
Real-time plot adjustments for consistency
The purpose of this component is to highlight context—whether the market is pressing into resistance, approaching support, or moving through the middle of the structure range.
2. Adaptive Ichimoku-Based Trend Model (Three-Layer Confirmation)
The strategy uses an expanded Ichimoku-style calculation applied across three timeframe multipliers.
Each layer evaluates:
Tenkan-sen slope
Kijun-sen slope
Cloud alignment
Momentum confirmation relative to recent highs/lows
Based on the user’s Risk Appetite (Low/Moderate/High), the strategy selects which layer to prioritize:
Low → Long-term trend consistency
Moderate → Mid-term sensitivity
High → Short-term responsiveness
The result is a trend-state signal (Up or Down) derived from structural and directional agreement across multiple layers.
3. Market Structure Filter (Directional Bias Control)
A price-action-based structure engine classifies swing highs/lows into:
HH (Higher High)
LH (Lower High)
HL (Higher Low)
LL (Lower Low)
The Market Structure Filter uses this information to determine whether higher-timeframe price action supports trend continuation or is compressing into a squeeze condition.
Filters include:
None
Standard
Strict
This prevents trades from triggering during conflicting structural environments unless intentionally allowed.
4. Entry Logic (Long / Short Conditions)
A signal appears only when all active components agree:
Valid chart timeframe
Date-range filter permitting backtest inclusion
HTF structure filter aligned
Trend-state confirmation
Price breaking beyond the current structure zone
Exclusion of opposite pin-bar signatures
When these conditions align, the strategy issues a long or short entry.
5. Stop-Loss Engine (S1/R1 Dynamic Management)
Stop-loss placement is derived from the pivot-timeframe’s S1/R1 levels and the bar of entry.
Two modes are available:
Standard trail: Stop updates with improving S1/R1 levels
2R → Break-Even: Moves stop to break-even on a 2R move, then trails using the stricter of BE or S1/R1
This helps users study how momentum-based trailing behaviour affects risk exposure under different market conditions.
6. Performance Table (Optional Display)
The script can display a performance summary including:
Win/Loss count
Profit factor
Average win/loss
Compounded result
Largest win/loss
Current risk percentage
These statistics reflect the parameters chosen inside the script and can assist in evaluating how different configurations behave when backtesting historical data.
They are not predictive and do not imply future results.
7. Auto vs Manual Settings
Auto Mode: Automatically selects trend multipliers, structure timeframe, and risk mode according to the chart’s timeframe.
Manual Mode: Gives users full control over all parameters and is used by alert conditions.
This allows flexible experimentation across intraday and swing environments.
8. Intended Use
This strategy is designed for educational and analytical purposes—specifically to help traders explore how multi-timeframe trend alignment, market structure, and dynamic support/resistance interact.
It does not guarantee performance and should be used alongside independent analysis, risk management, and market awareness.

Session Opening Range Breakout (ORBO)This strategy automates a classic Opening Range Breakout (ORBO) approach: it builds a price range for the first minutes after the market opens, then looks for strong breakouts above or below that range to catch early directional moves.
Concept
The idea behind ORBO is simple:
The first minutes after the session open are often highly informative.
Price forms an “opening range” that acts as a mini support/resistance zone.
A clean breakout beyond this zone can lead to high-momentum moves.
This script turns that logic into a fully backtestable strategy in TradingView.
How the strategy works
Opening Range Session
Default session: 09:30–09:50 (exchange time)
During this window, the script tracks:
orHigh → highest high within the session
orLow → lowest low within the session
This forms your Opening Range for the day.
Breakout Logic (after the window ends)
Once the defined session ends:
Long Entry:
If the close crosses above the Opening Range High (orHigh),
→ strategy.entry("OR Long", strategy.long) is triggered.
Short Entry:
If the close crosses below the Opening Range Low (orLow),
→ strategy.entry("OR Short", strategy.short) is triggered.
Only one opening range per day is considered, which keeps the logic clean and easy to interpret.
Daily Reset
At the start of a new trading day, the script resets:
orHigh := na
orLow := na
A fresh Opening Range is then built using the next session’s 09:30–09:50 candles.
This ensures entries are always based on today’s structure, not yesterday’s.
Visuals & Inputs
Inputs:
Opening range session → default: "0930-0950"
Show OR levels → toggle visibility of OR High / Low lines
Fill range body → optional shaded zone between OR High and OR Low
Chart visuals:
A green line marks the Opening Range High.
A red line marks the Opening Range Low.
Optional yellow fill highlights the entire OR zone.
Background shading during the session shows when the range is currently being built.
These visuals make it easy to see:
Where the OR sits relative to current price
How clean / noisy the breakout was
How often price respects or rejects the opening zone
Backtesting & Optimization
Because this is written as a strategy():
You can use TradingView’s Strategy Tester to view:
Win rate
Net profit
Drawdown
Profit factor
Equity curve
Ideas to experiment with:
Change the session window (e.g., 09:15–09:45, 10:00–10:30)
Apply to different:
Markets: indices, FX, crypto, stocks
Timeframes: 1m / 5m / 15m
Add your own:
Stop Loss & Take Profit levels
Time filters (only trade certain days / times)
Volatility filters (e.g., ATR, range size thresholds)
Higher-timeframe trend filter (e.g., only take longs above 200 EMA)

AliceTears GridAliceTears Grid is a customizable Mean Reversion system designed to capitalize on market volatility during specific trading sessions. Unlike standard grid bots that place blind limit orders, this strategy establishes a daily or session-based "Baseline" and looks for price over-extensions to fade the move back to the mean.
This strategy is best suited for ranging markets (sideways accumulation) or specific forex sessions (e.g., Asian Session or NY/London overlap) where price tends to revert to the opening price.
🛠 How It Works
1. The Baseline & Grid Generation At the start of every session (or the daily open), the script records the Open price. It then projects visual grid lines above and below this price based on your Step % input.
Example: If the Open is $100 and Step is 1%, lines are drawn at $101, $102, $99, $98, etc.
2. Entry Logic: Reversal Mode This script features a "Reversal Mode" (enabled by default) to filter out "falling knives."
Standard Grid: Buys immediately when price touches the line.
AliceTears Logic: Waits for the price to breach a grid level and then close back inside towards the mean. This confirms a potential rejection of that level before entering.
3. Exit Logic
Target Profit: The primary target is the previous grid level (Mean Reversion).
Trailing Stop: If the price continues moving in your favor, a trailing stop activates to maximize the run.
Stop Loss: A manual percentage-based stop loss is available to prevent deep drawdowns in trending markets.
⚙️ Key Features
Visual Grid: Automatically draws entry levels on the chart for the current session, helping you visualize where the "math" is waiting for price.
Timezone & Session Control: Includes a custom Timezone Offset tool. You can trade specific hours (e.g., 09:30–16:00) regardless of your chart's UTC setting.
Grid Management: Independent logic for Long and Short grids with pyramiding capabilities.
Safety Filters: Options to force-close trades at the end of the session to avoid overnight gaps.
⚠️ Risk Warning
Please Read Before Using: This is a Counter-Trend / Grid Strategy.
Pros: High win rate in sideways/ranging markets.
Cons: In strong trending markets (parabolic pumps or crashes), this strategy will add to losing positions ("catch a falling knife").
Recommendation: Always use the Stop Loss and Date Filter inputs. Do not run this on highly volatile assets without strict risk management parameters.
Settings Guide
Entry Reversal Mode: Keep checked for safer entries. Uncheck for aggressive limit-order style execution.
Grid Step (%): The distance between lines. For Forex, use lower values (0.1% - 0.5%). For Crypto, use higher values (1.0% - 3.0%).
UTC Offset: Adjust this to align the Session Hours with your target market (e.g., -5 for New York).
This script is open source. Feel free to use it for educational purposes or modify it to fit your trading style.

Dynamic SMA Trend System [Multi-Stage Risk Engine]Description:
This script implements a robust Trend Following strategy based on a multiple Simple Moving Average (SMA) crossover logic (25, 50, 100, 200). What sets this strategy apart is its advanced "4-Stage Risk Engine" and a smart "High-Water Mark" Re-Entry system, designed to protect profits during parabolic moves while filtering out chop during sideways markets.
How it works:
The strategy operates on three core pillars: Trend Identification, Dynamic Risk Management, and Momentum Re-Entry.
1. Entry Logic (Trend Identification) The script looks for crossovers at different trend stages to capture early reversals as well as established trends:
Short-Term: SMA 25 crosses over SMA 50.
Mid-Term: SMA 50 crosses over SMA 100.
Macro-Trend: SMA 100 crosses over SMA 200.
2. The 4-Stage Risk Engine (Dynamic Stop Loss) Instead of a static Stop Loss, this strategy uses a progressive system that adapts as the price increases:
Stage 1 (Protection): Starts with a fixed Stop Loss (default -10%) to give the trade room to breathe.
Stage 2 (Break-Even): Once the price rises by 12%, the Stop is moved to trailing mode (10% distance), effectively securing a near break-even state.
Stage 3 (Profit Locking): At 25% profit, the trailing stop tightens to 8% to lock in gains.
Stage 4 (Parabolic Mode): At 40% profit, the trailing stop tightens further to 5% to capture the peak of parabolic moves.
3. Dual Exit Mechanism The strategy exits a position if EITHER of the following happens:
Stop Loss Hit: Price falls below the dynamic red line (Risk Engine).
Dead Cross: The trend structure breaks (e.g., SMA 25 crosses under SMA 50), signaling a momentum loss even if the Stop Loss wasn't hit.
4. "High-Water Mark" Re-Entry To avoid "whipsaws" in choppy markets, the script does not re-enter immediately after a stop-out.
It marks the highest price of the previous trade (Green Dotted Line).
A Re-Entry only occurs if the price breaks above this previous high (showing renewed strength) AND the long-term trend is bullish (Price > SMA 200).
Visuals:
SMAs: 25 (Yellow), 50 (Orange), 100 (Blue), 200 (White).
Red Line: Visualizes the dynamic Stop Loss level.
Green Dots: Visualizes the target price needed for a valid re-entry.
Settings: All parameters (SMA lengths, Stop Loss percentages, Staging triggers) are fully customizable in the settings menu to fit different assets (Crypto, Stocks, Forex) and timeframes.

Trendshift [CHE] StrategyTrendshift Strategy — First-Shift Structural Regime Trading
Profitfactor 2,603
Summary
Trendshift Strategy implements a structural regime-shift trading model built around the earliest confirmed change in directional structure. It identifies major swing highs and lows, validates breakouts through optional ATR-based conviction, and reacts only to the first confirmed shift in each direction. After a regime reversal, the strategy constructs a premium and discount band between the breakout candle and the previous opposite swing. This band is used as contextual bias and may optionally inform stop placement and position sizing.
The strategy focuses on clear, interpretable structural events rather than continuous signal generation. By limiting entries to the first valid shift, it reduces false recycles and allows the structural state to stabilize before a new trade occurs. All signals operate on closed-bar logic, and the strategy avoids higher-timeframe calls to stabilize execution behavior.
Motivation: Why this design?
Many structure-based systems repeatedly trigger as price fluctuates around prior highs and lows. This often leads to multiple flips during volatile or choppy conditions. Trendshift Strategy addresses this problem by restricting execution to the first confirmed structural event in each direction. ATR-based filters help differentiate genuine structural breaks from noise, while the contextual band ensures that the breakout is meaningful in relation to recent volatility.
The design aims to represent a minimalistic structural trading framework focused on regime turns rather than continuous trend signaling. This reduces chart noise and clarifies where the market transitions from one regime to another.
What’s different vs. standard approaches?
Baseline reference
Typical swing-based structure indicators report every break above or below recent swing points.
Architecture differences
First-shift-only regime logic that blocks repeated signals until direction reverses
ATR-filtered validation to avoid weak or momentum-less breaks
Premium and discount bands derived from breakout structure
Optional band-driven stop placement
Optional band-dependent position-sizing factor
Regime timeout system to neutralize structure after extended inactivity
Persistent-state architecture to prevent re-triggering
Practical effect
Only the earliest actionable structure change is traded
Fewer but higher-quality signals
Premium/discount tint assists contextual evaluation
Stops and sizing can be aligned with structural context rather than arbitrary volatility measures
Improved chart interpretability due to reduced marker frequency
How it works (technical)
The algorithm evaluates symmetric swing points using a fixed bar window. When a swing forms, its value and bar index are stored as persistent state. A structural shift occurs when price closes beyond the most recent major swing on the opposite side. If ATR filtering is enabled, the breakout must exceed a volatility-scaled distance to prevent micro-breaks from firing.
Once a valid shift is confirmed, the regime is updated to bullish or bearish. The script records the breakout level, the opposite swing, and derives a band between them. This band is checked for minimum size relative to ATR to avoid unrealistic contexts.
The first shift in a new direction generates both the strategy entry and a visual marker. Additional shifts in the same direction are suppressed until a reversal occurs. If a timeout is enabled, the regime resets after a specified number of bars without structural change, optionally clearing the band.
Stop placement, if enabled, uses either the opposite or same band edge depending on configuration. Position size is computed from account percentage and may optionally scale with the price-span-to-ATR relationship.
Parameter Guide
Market Structure
Swing length (default 5): Controls swing sensitivity. Lower values increase responsiveness.
Use ATR filter (default true): Requires breakouts to show momentum relative to ATR. Reduces false shifts.
ATR length (default 14): Volatility estimation for breakout and band validation.
Break ATR multiplier (default 1.0): Required breakout strength relative to ATR.
Premium/Discount Framework
Enable framework (default true): Activates premium/discount evaluation.
Persist band on timeout (default true): Keeps structural band after timeout.
Min band ATR mult (default 0.5): Rejects narrow bands.
Regime timeout bars (default 500): Neutralizes regime after inactivity.
Invert colors (default false): Color scheme toggle.
Visuals
Show zone tint (default true): Background shade in premium or discount region.
Show shift markers (default true): Display first-shift markers.
Execution and Risk
Risk per trade percent (default 1.0): Determines position size as account percentage.
Use band for size (default false): Scales size relative to band width behavior.
Flat on opposite shift (default true): Forces reversal behavior.
Use stop at band (default false): Stop anchored to band edges.
Stop band side: Chooses which band edge is used for stop generation.
Reading & Interpretation
A green background indicates discount conditions within the structural band; red indicates premium conditions. A green triangle below price marks the first bullish structural shift after a bearish regime. A red triangle above price marks the first bearish structural shift after a bullish regime.
When stops are active, the opposite band edge typically defines the protective level. Band width relative to ATR indicates how significant a structural change is: wider bands imply stronger volatility structure, while narrow bands may be suppressed by the minimum-size filter.
Practical Workflows & Combinations
Trend following: Use first-shift entries as initial regime confirmation. Add higher-timeframe trend filters for additional context.
Swing trading: Combine with simple liquidity or fair-value-gap concepts to refine entries.
Bias mapping: Use higher timeframes for structural regime and lower timeframes for execution within the premium/discount context.
Exit management: When using stops, consider ATR-scaling or multi-stage profit targets. When not using stops, reversals become the primary exit.
Behavior, Constraints & Performance
The strategy uses only confirmed swings and closed-bar logic, avoiding intrabar repaint. Pivot-based swings inherently appear after the pivot window completes, which is standard behavior. No higher-timeframe calls are used, preventing HTF-related repaint issues.
Persistent variables track regime and structural levels, minimizing recomputation. The maximum bars back setting is five-thousand. The design avoids loops and arrays, keeping performance stable.
Known limitations include limited signal density during consolidations, delayed swing confirmation, and sensitivity to extreme gaps that stretch band logic. ATR filtering mitigates some of these effects but does not eliminate them entirely.
Sensible Defaults & Quick Tuning
Fewer but stronger entries: Increase swing length or ATR breakout multiplier.
More responsive entries: Reduce swing length to capture earlier shifts.
More active band behavior: Lower the minimum band ATR threshold.
Stricter stop logic: Use the opposite band edge for stop placement.
Volatile markets: Increase ATR length slightly to stabilize behavior.
What this indicator is—and isn’t
Trendshift Strategy is a structural-regime trading engine that evaluates major directional shifts. It is not a complete trading system and does not include take-profit logic or prediction features. It does not attempt to forecast future price movement and should be used alongside broader market structure, volatility context, and disciplined risk management.
Disclaimer
The content provided, including all code and materials, is strictly for educational and informational purposes only. It is not intended as, and should not be interpreted as, financial advice, a recommendation to buy or sell any financial instrument, or an offer of any financial product or service. All strategies, tools, and examples discussed are provided for illustrative purposes to demonstrate coding techniques and the functionality of Pine Script within a trading context.
Any results from strategies or tools provided are hypothetical, and past performance is not indicative of future results. Trading and investing involve high risk, including the potential loss of principal, and may not be suitable for all individuals. Before making any trading decisions, please consult with a qualified financial professional to understand the risks involved.
By using this script, you acknowledge and agree that any trading decisions are made solely at your discretion and risk.
Do not use this indicator on Heikin-Ashi, Renko, Kagi, Point-and-Figure, or Range charts, as these chart types can produce unrealistic results for signal markers and alerts.
Best regards and happy trading
Chervolino

EMA Trend Pro [Hedging & Fixed Risk]
This strategy is a comprehensive trend-following system designed to capture significant market movements while strictly managing risk. It combines multiple Exponential Moving Averages (EMAs) for trend identification, ADX for trend strength filtering, and Volume confirmation to reduce false signals.
Key Features:
Hedging Mode Compatible: The script is designed to handle Long and Short positions independently. This is ideal for markets where trends can reverse quickly or for traders who prefer hedging logic (requires hedging=true in strategy settings).
Professional Risk Management: Unlike standard strategies that use fixed contract sizes, this script calculates Position Size based on Risk. You can define a fixed risk per trade (e.g., 1% of equity or $100 fixed risk). The script automatically adjusts the lot size based on the Stop Loss distance (ATR).
Multi-Stage Take Profit: The strategy scales out positions at 3 different levels (TP1, TP2, TP3) to lock in profits while letting the remaining position ride the trend.
Strategy Logic:
Trend Identification:
Long Entry: EMA 7 > EMA 14 > EMA 21 > EMA 144 (Bullish Alignment).
Short Entry: EMA 7 < EMA 14 < EMA 21 < EMA 144 (Bearish Alignment).
Filters:
ADX Filter: Entries are only taken if ADX (14) > Threshold (default 20) to ensure the market is trending, avoiding chopping ranging markets.
Volume Filter: Current volume must exceed the 20-period SMA volume by 10% to confirm momentum.
Exits & Trade Management:
Stop Loss: Dynamic SL based on ATR (e.g., 1.8x ATR).
Breakeven: Once TP1 is hit, the Stop Loss is automatically moved to Breakeven to protect capital.
Take Profits:
TP1: 1x Risk Distance (30% pos)
TP2: 2x Risk Distance (50% pos)
TP3: 3x Risk Distance (Remaining pos)
Settings Guide:
Risk Type: Choose between "Percent" (of equity) or "Fixed Amount" (USD).
Risk Value: Input your desired risk (e.g., 1.0 for 1% risk).
Fee %: Set your exchange's Taker fee (e.g., 0.05 or 0.06) for accurate backtesting.
ADX Threshold: Adjust to filter out noise (Higher = Stricter trend requirement).
Disclaimer: This script is for educational and backtesting purposes only. Past performance does not guarantee future results. Please use proper risk management.

15m ORB + FVG Strategy (ChadAnt)Core Logic
The indicator's logic revolves around three main phases:
1. Defining the 15-Minute Opening Range (ORB)
The script calculates the highest high (rangeHigh) and lowest low (rangeLow) that occurred during the first 15 minutes of the trading day.
This time window is defined by the sessionStr input, which defaults to 0930-0945 (exchange time).
The high and low of this range are plotted as small gray dots once the session ends (rangeSet = true).
2. Identifying a Fair Value Gap (FVG) Setup
After the 15-minute range is set, the indicator waits for a breakout of either the range high or range low.
A "Strict FVG breakout" requires two conditions on the first candle that closes beyond the range:
The candle before the breakout candle ( bars ago) must have been inside the range.
The breakout candle ( bar ago) must have closed outside the range.
A Fair Value Gap (FVG) must form on the most recent three candles (the current bar and the two previous bars).
Bullish FVG (Long Setup): The low of the current bar (low) is greater than the high of the bar two periods prior (high ). This FVG represents a price inefficiency that the trade expects to fill.
Bearish FVG (Short Setup): The high of the current bar (high) is less than the low of the bar two periods prior (low ).
If a valid FVG setup occurs, the indicator marks a pending setup and draws a colored box to highlight the FVG area (Green for Bullish FVG, Red for Bearish FVG).
3. Trade Entry and Management
If a pending setup is identified, the trade is structured as a re-entry trade into the FVG zone:
Entry Price: Set at the outer boundary of the FVG, which is the low of the current bar for a Long setup, or the high of the current bar for a Short setup.
Stop Loss (SL): Set at the opposite boundary of the FVG, which is the low for a Long setup, or the high for a Short setup.
The trade is triggered (tradeActive = true) once the price retraces to the pendingEntry level.
Risk/Reward (RR) Targets: Three Take Profit (TP) levels are calculated based on the distance between the Entry and Stop Loss:
$$\text{Risk} = | \text{Entry} - \text{SL} |$$
$$\text{TP}n = \text{Entry} \pm (\text{Risk} \times \text{RR}n)$$
where $n$ is 1, 2, or 3, corresponding to the input $\text{RR}1$, $\text{RR}2$, and $\text{RR}3$ values (defaults: 1.0, 1.5, and 2.0).
Trade Lines: Upon triggering, lines for the Entry, Stop Loss, and three Take Profit levels are drawn on the chart for a specified length (lineLength).
A crucial feature is the directional lock (highBroken / lowBroken):
If the price breaks a range level (e.g., simpleBrokeHigh) but without a valid FVG setup, the corresponding directional flag (e.g., highBroken) is set to true permanently for the day.
This prevents the indicator from looking for any subsequent trade setups in that direction for the rest of the day, suggesting that the initial move, without an FVG, exhausted the opportunity.
Open-source script
In true TradingView spirit, the creator of this script has made it open-source, so that traders can review and verify its functionality. Kudos to the author! While you can use it for free, remember that republishing the code is subject to our House Rules.
ChadAnt
Disclaimer
The information and publications are not meant to be, and do not constitute, financial, investment, trading, or other types of advice or recommendations supplied

LiquiBreak — Semi-Automatic Breakout, Gap & Trend-Filter StrategLiquiBreak is a semi-automatic breakout + gap detection strategy that combines pivots, a volatility filter and an optional Supertrend direction check to generate entry signals. It can optionally place take-profit and stop-loss orders in points. Use it to highlight high-probability breakout/gap setups and to automate exits when you want — otherwise treat its signals as trade alerts that require your confirmation.
📌 LiquiBreak — Semi-Automatic Breakout, Gap & Trend Strategy
1. Overview
1. LiquiBreak is a semi-automatic breakout + gap strategy designed to catch high-quality moves with volatility confirmation.
2. Uses pivot-based support/resistance , gap detection , Supertrend filtering , and optional automatic TP/SL in points .
3. Works on all assets and timeframes, especially effective on XAUUSD, Indices, Crypto and FX pairs .
---
2. What This Script Detects
1. Breakouts above resistance and below support during strong volatility.
2. Bullish & bearish gap patterns confirmed with momentum sequences.
3. Dynamic volatility zones based on normalized ATR ranges.
4. Optional Supertrend trend direction for filtering bad signals.
5. Automatic TP/SL orders when enabled.
---
3. Recommended Indicators to Combine With
To increase accuracy and reduce false breakouts:
1. Supertrend (included) – best for trend direction.
2. EMA 9/21 or EMA 20/50 – confirms trend strength & pullbacks.
3. RSI or Stoch RSI – avoid overbought/oversold breakouts.
4. VWAP – institutional bias & fair value zones.
5. CPR / Pivot Points – confluence with breakout levels.
6. MACD – trend confirmation on higher timeframe.
7. Volume Profile (optional) – find breakout liquidity zones.
These indicators help filter low-quality signals without affecting the script’s core logic.
---
4. Key Features
1. Volatility-based pivot support & resistance .
2. Reliable breakout confirmation using real-time volatility strength.
3. Strong gap pattern detection with ATR threshold.
4. Optional Supertrend confirmation for safer entries.
5. Point-based Take Profit / Stop Loss .
6. Toggle on/off: Longs, Shorts, TP, SL .
7. Semi-automatic execution — not fully automated.
8. Clean, optimized structure for stability and speed.
---
5. Inputs / Settings
1. Pivot / Levels Period – defines structural S/R levels.
2. Volatility Filter (%) – prevents low-quality signals.
3. TP Points – automatic take-profit target.
4. SL Points – automatic stop-loss.
5. Enable TP / Enable SL – full exit control.
6. Allow Long / Allow Short – direction control.
7. Supertrend Filter – filter weak counter-trend trades.
---
6. How to Use the Strategy
1. Select timeframe & tune pivot/volatility settings.
2. Enable/disable automatic TP/SL based on your style.
3. Turn ON Supertrend for safer trend-based trades.
4. Confirm signals using EMA, RSI, VWAP, Volume or CPR.
5. Watch for high-volatility breakouts near key levels.
6. Use multiple timeframe analysis for stronger confirmation.
---
7. Important Warning (User Must Monitor Trades)
⚠ This script is NOT a fully automatic bot.
1. You MUST monitor the chart while using this strategy.
2. You MUST manually close trades if market conditions change.
3. Auto TP/SL helps, but during news events or fast markets, slippage may occur.
4. Treat this script as a signal + entry assistant , not a fire-and-forget system.
---
8. Best Practices
1. Works best on XAUUSD, NAS100, BTC, ETH, EURUSD .
2. Avoid major news unless experienced.
3. Increase volatility filter during choppy markets.
4. Use M15–H1 for clean breakouts; M5 for scalping.
5. For beginners: keep TP/SL enabled for safety.
6. Backtest first → then paper trade → then live trade.
---
9. Disclaimer
1. For educational and research purposes only .
2. Not financial advice.
3. User is fully responsible for their trades and risk.
4. Past performance does not guarantee future results.

RastaRasta — Educational Strategy (Pine v5)
Momentum · Smoothing · Trend Study
Overview
The Rasta Strategy is a visual and educational framework designed to help traders study momentum transitions using the interaction between a fast-reacting EMA line and a slower smoothed reference line.
It is not a signal generator or profit system; it’s a learning tool for understanding how smoothing, crossovers, and filters interact under different market conditions.
The script displays:
A primary EMA line (the fast reactive wave).
A Smoothed line (using your chosen smoothing method).
Optional fog zones between them for quick visual context.
Optional DNA rungs connecting both lines to illustrate volatility compression and expansion.
Optional EMA 8 / EMA 21 trend filter to observe higher-time-frame alignment.
Core Idea
The Rasta model focuses on wave interaction. When the fast EMA crosses above the smoothed line, it reflects a shift in short-term momentum relative to background trend pressure. Cross-unders suggest weakening or reversal.
Rather than treating this as a trading “signal,” use it to observe structure, study trend alignment, and test how smoothing type affects reaction speed.
Smoothing Types Explained
The script lets you experiment with multiple smoothing techniques:
Type Description Use Case
SMA (Simple Moving Average) Arithmetic mean of the last n values. Smooth and steady, but slower. Trend-following studies; filters noise on higher time frames.
EMA (Exponential Moving Average) Weights recent data more. Responds faster to new price action. Momentum or reactive strategies; quick shifts and reversals.
RMA (Relative Moving Average) Used internally by RSI; smooths exponentially but slower than EMA. Momentum confirmation; balanced response.
WMA (Weighted Moving Average) Linear weights emphasizing the most recent data strongly. Intraday scalping; crisp but potentially noisy.
None Disables smoothing; uses the EMA line alone. Raw comparison baseline.
Each smoothing method changes how early or late the strategy reacts:
Faster smoothing (EMA/WMA) = more responsive, good for scalping.
Slower smoothing (SMA/RMA) = more stable, good for trend following.
Modes of Study
🔹 Scalper Mode
Use short EMA lengths (e.g., 3–5) and fast smoothing (EMA or WMA).
Focus on 1 min – 15 min charts.
Watch how quick crossovers appear near local tops/bottoms.
Fog and rung compression reveal volatility contraction before bursts.
Goal: study short-term rhythm and liquidity pulses.
🔹 Momentum Mode
Use moderate EMA (5–9) and RMA smoothing.
Ideal for 1 H–4 H charts.
Observe how the fog color aligns with trend shifts.
EMA 8 / 21 filter can act as macro bias; “Enter” labels will appear only in its direction when enabled.
Goal: study sustained motion between pullbacks and acceleration waves.
🔹 Trend-Follower Mode
Use longer EMA (13–21) with SMA smoothing.
Great for daily/weekly charts.
Focus on periods where fog stays unbroken for long stretches — these illustrate clear trend dominance.
Watch rung spacing: tight clusters often precede consolidations; wide rungs signal expanding volatility.
Goal: visualize slow-motion trend transitions and filter whipsaw conditions.
Components
EMA Line (Red): Fast-reacting short-term direction.
Smoothed Line (Yellow): Reference trend baseline.
Fog Zone: Green when EMA > Smoothed (up-momentum), red when below.
DNA Rungs: Thin connectors showing volatility structure.
EMA 8 / 21 Filter (optional):
When enabled, the strategy will only allow Enter events if EMA 8 > EMA 21.
Use this to study higher-trend gating effects.
Educational Applications
Momentum Visualization: Observe how the fast EMA “breathes” around the smoothed baseline.
Trend Transitions: Compare different smoothing types to see how early or late reversals are detected.
Noise Filtering: Experiment with fog opacity and smoothing lengths to understand trade-off between responsiveness and stability.
Risk Concept Simulation: Includes a simple fixed stop-loss parameter (default 13%) for educational demonstrations of position management in the Strategy Tester.
How to Use
Add to Chart → “Strategy.”
Works on any timeframe and instrument.
Adjust Parameters:
Length: base EMA speed.
Smoothing Type: choose SMA, EMA, RMA, or WMA.
Smoothing Length: controls delay and smoothness.
EMA 8 / 21 Filter: toggles trend gating.
Fog & Rungs: visual study options only.
Study Behavior:
Use Strategy Tester → List of Trades for entry/exit context.
Observe how different smoothing types affect early vs. late “Enter” points.
Compare trend periods vs. ranging periods to evaluate efficiency.
Combine with External Tools:
Overlay RSI, MACD, or Volume for deeper correlation analysis.
Use replay mode to visualize crossovers in live sequence.
Interpreting the Labels
Enter: Marks where fast EMA crosses above the smoothed line (or when filter flips positive).
Exit: Marks where fast EMA crosses back below.
These are purely analytical markers — they do not represent trade advice.
Educational Value
The Rasta framework helps learners explore:
Reaction time differences between moving-average algorithms.
Impact of smoothing on signal clarity.
Interaction of local and global trends.
Visualization of volatility contraction (tight DNA rungs) and expansion (wide fog zones).
It’s a sandbox for studying price structure, not a promise of profit.
Disclaimer
This script is provided for educational and research purposes only.
It does not constitute financial advice, trading signals, or performance guarantees. Past market behavior does not predict future outcomes.
Users are encouraged to experiment responsibly, record observations, and develop their own understanding of price behavior.
Author: Michael Culpepper (mikeyc747)
License: Educational / Open for study and modification with credit.
Philosophy:
“Learning the rhythm of the market is more valuable than chasing its profits.” — Rasta

SMC Adaptive Breakout v1XSMC Adaptive Breakout v1X — Adaptive Smart Money Breakout Strategy
SMC Adaptive Breakout v1X is a Smart-Money–inspired breakout strategy that adapts to changing volatility and market structure in real time. It identifies recent pivot structure, verifies volatility expansion, uses ATR-scaled stops, and manages exits with fixed profit targets plus price-based trailing.
Why this strategy is unique / original
This strategy combines three concept layers into a single, cohesive system: (1) structure detection using adaptive pivots, (2) a normalized volatility filter (range percentile over a long lookback) to permit only expansion-phase breakouts, and (3) context-aware trade management using ATR-scaled stops and percentage-based profit/ trailing rules. The combination reduces false breakouts during low-volatility periods while preserving entries when institutional-style expansion occurs.
Core logic (high level)
1. Structure detection: recent pivot highs and lows (configurable lookback) form the active Support and Resistance reference levels used to define breakouts.
2. Volatility confirmation: raw bar range is normalized into a percentile within a long volatility lookback window; breakouts are only considered when normalized volatility exceeds the user filter threshold.
3. Order-block / gap detection: the script detects large price gaps relative to ATR(200) and flags them as bullish/bearish gaps (order-block style footprints) to add confluence to entries.
4. Entry criteria: a long entry is signalled when price closes above the most recent resistance and the volatility filter is satisfied (or a bullish gap condition is met). Shorts mirror this logic below support. Debug/force flags allow manual/backtest forcing of trades.
5. Risk & exits: stops are ATR-based (ATR length configurable, multiplier configurable) giving context-aware stop distances. Each entry sets a profit target as a percent of entry and attaches a trailing exit (points and offset defined as percent of price) to protect profits. Exits are placed with one strategy.exit per entry so they are executed by the strategy engine.
6. Non-premature confirmation: entries are determined using closed-bar conditions (no intrabar triggers), consistent with strategy backtesting expectations.
Key inputs (and what they control)
1. Levels Period (length) — pivot lookback used to compute support/resistance structure; larger values = larger, fewer zones.
2. Volatility Filter (filter 0–100) — normalized volatility threshold (percentile) required to allow breakout signals. Increase to reduce signals during quiet markets.
3. Volatility lookback (volatility_len) — window length used to normalize the raw range into a percentile.
4. ATR length (atr_len) & ATR Stop Multiplier (atr_multiplier) — ATR parameters used for stop distance; ATR gives volatility-adaptive stop sizing.
5. Profit target (%) — target as percent of entry price.
6. Trailing points (%) & offset (%) — trailing stop size and activation offset, expressed as percent of price (converted internally to price points).
7. Visual & debug toggles — show/hide levels, entry markers, and enable debug/force entry flags for manual/backtest validation.
Practical Usage & Recommended Settings
Timeframes – Works efficiently across multiple time horizons.
• 5–15 minutes → Scalping setups.
• 15 minutes–1 hour → Intraday opportunities.
• 4 hours–1 day → Swing trading confirmation.
Adjust length and Volatility Filter parameters to match your timeframe and instrument behavior.
Default Sensitivity –
The default length = 20 offers balanced structure detection.
• Lower values → faster, more frequent signals.
• Higher values → smoother structure and fewer breakouts.
Volatility Tuning –
Modify the Volatility Filter (0–100) according to market conditions.
• Increase the filter during low-volume or choppy sessions to reduce false signals.
• Decrease it during trending or high-volatility markets for greater responsiveness.
Stop / Target Sizing –
ATR-based stop-losses automatically adapt to market volatility.
• Recommended starting point: ATR Multiplier = 1.5 and Profit Target = 1.5%.
• Fine-tune both based on each asset’s typical volatility profile.
Backtesting –
Use TradingView’s built-in Strategy Tester to analyze results over different symbols and timeframes.
The strategy executes only on bar close, ensuring accurate, non-repainting backtest results.
What the strategy plots / visual cues
•Forward-extended pivot lines for support/resistance (configurable color/transparency).
•Order-block / gap markers when large ATR-scaled gaps are detected.
•Entry labels (“LONG” / “SHORT”) at position changes if enabled.
•Strategy entries/exits are placed through strategy.entry and strategy.exit so performance reports are available in the Tester.
Risk management & notes
•This script is a discretionary tool — it automates entries and exits for backtesting and strategy simulation, but users should still confirm trades with broader market context and higher-timeframe bias.
•Always run thorough backtests (multi-symbol, multi-timeframe) and forward test on a paper account before any live deployment.
•Adjust position sizing externally; the strategy code sets orders and exits but does not enforce a specific money-management sizing rule. Use the strategy tester’s default position size controls or integrate a sizing method in your own workflow.
Technical details & behavior
•Pine Script v6 strategy.
•Uses closed-bar confirmation for signals (no repainting on close).
•Order-block / gap detection uses ATR(200) as a volatility reference to identify large structural gaps.
•Trail calculations convert percent-based inputs to absolute price units each bar to maintain consistent behavior across price levels.
Limitations & disclaimers
•Past performance is not indicative of future results. This strategy does not guarantee profits and will produce losing trades.
•Results depend on parameter choices, instrument volatility, market regime, and execution slippage. Always test on the exact symbol and timeframe you intend to trade.
Invite-only / Access note (for Publish window)
This strategy is invite-only. Please use the TradingView Request Access button on this page to request access.

Futures Fighter MO: Multi-Confluence Day Trading System ADX/SMI👋 Strategy Overview: The Multi-Confluence Mashup
The Futures Fighter MO is a comprehensive, multi-layered day trading strategy designed for experienced traders focusing on high-liquidity futures contracts (e.g., NQ, ES, R2K).
This strategy is a sophisticated mashup that uses the 1-minute chart for surgical entries while enforcing strict environmental filtering through higher-timeframe data. We aim to capture high-conviction moves only when multiple, uncorrelated signals align.
🧠 How the Logic Works (Concepts & Confluence)
Our logic is built on four pillars, which must align for a trade to be executed:
Primary Trend Filter
Indicators :
ADX/DMI (15-Minute Lookback)
Role :
Price action is filtered to ensure the ADX (17/14) is above 25, confirming a strong, prevailing market trend (Bullish or Bearish). Trades are strictly rejected during "Flat" (sideways) market regimes.
Entry Signal Types
The system uses multiple entry types:
- 🟢 Trend Long/Short: A breakout/rejection near the 200-Period EMA is confirmed by the primary ADX trend.
- 🔴 Engulfing Rejection: A strong signal when a Bullish/Bearish Engulfing or Doji prints near the long-term 500-Period EMA (emaGOD) while the Stochastic Momentum Index (SMI on 30M) is in an extreme overbought/oversold state (below $-40$ or above $40$).
Volatility & Volume Confirmation
Indicators: Average True Range (ATR) and 20-Period SMA of Volume
Role: Every entry requires a volume spike (Current Volume $> 1.5 \times$ SMA Volume) to confirm that the move is supported by significant liquidity. Volatility is tracked via ATR to define bar range and stop boundaries.
Structural Guardrails
Indicators: Daily Pivot Points (PP, S1-S3, R1-R3)
Role: Trades are disabled if the current bar's price range intersects with a Daily Pivot Point. This is a critical filter to avoid high-chop consolidation zones near key structural levels.
📊 Strategy Results & Required Disclosures
I strive to publish backtesting results that are transparent and realistic for the retail futures trader.
- Initial Capital: $50,000 - A realistic base for Mini/Micro futures contracts.
- Order Size: 1 Contract (Pyramiding up to 3) - Conservative risk relative to the account size.
- Commission: $0.11 USD per order - Represents realistic costs for low-cost brokers.
- Slippage: 2 Ticks - Accounts for expected market friction.
⚠️ Risk Management & Deviations
Stop-Loss: The strategy uses a dynamic stop-loss system where positions are closed upon a reversal (e.g., breaking the 50-Period EMA or failure to hold a Pivot Point), rather than a fixed tick-based stop. This is suited for experienced traders using a low relative risk (single Micro-contract entry) on a larger account. Users must confirm that the first entry's maximum potential loss remains below $10\%$ of their capital for compliance.
Trade Sample Size: Due to data limitations of the TradingView Essential plan (showing $\approx 50$ trades over 2 weeks), the sample size is under the ideal $100+$ target. Justification: This system is designed to generate signals across a portfolio of correlated futures markets (NQ, ES, R2K, Gold, Crude), meaning the real sample size for a user tracking the portfolio is significantly higher.
Drawdown Control: This strategy is designed for manual management. It requires the user to turn the script/alerts OFF after a significant drawdown and only reactivate it once a recovery trend is established externally.
The strategy uses a combination of dynamic trailing stops, structural support/resistance zones, and a fixed profit target to manage open positions.
🛑 Strategy Exit Logic
1. General Stop-Loss (Dynamic Trailing Stop)
These conditions act as the primary dynamic stop, closing the position if the market reverses past a key Moving Average (MA):
- Long Positions Closed When: The current bar's close crosses under the 50-Period EMA (emaLong).
- Short Positions Closed When: The current bar's close crosses above the 50-Period EMA (emaLong).
2. Profit Target (Fixed Percentage)
The script includes a general exit based on a user-defined profit percentage:
Take Profit Trigger: The position is closed when the currentProfitPercent meets or exceeds the input Profit Target (%) (default is 1.0% of the entry price).
3. Structural Exits (Daily Pivot Points)
These exits are high-priority, "close all" orders that trigger when the price fails to hold or reclaims a recent Daily Pivot Point, suggesting a failure of the current move.
- VR Close All - Long ($\sym{size} > 0$) - Price crosses under a Daily Resistance Level (R1, R2, or R3) minus 1 ATR within the last 10 bars. This indicates the current momentum failed to hold Resistance as support.
- VS Close All - Short ($\sym{size} < 0$) - Price crosses above a Daily Support Level (S1, S2, or S3) plus 1 ATR within the last 10 bars. This indicates the current momentum failed to hold Support as resistance.
4. Trend Failure Exit (Trend-Following Signals Only)
This exit protects against holding a position when the primary high-timeframe trend used for the entry has failed:
- Long Positions Closed When: The primary trend is no longer "bullish" for more than 2 consecutive bars (i.e., it turned "bearish" or "flat").
- Short Positions Closed When: The primary trend is no longer "bearish" for more than 2 consecutive bars (i.e., it turned "bullish" or "flat").
5. End of Day (EOD) Session Control
The final hard exits based on time:
- End of Session (EoS): At 11:30 AM, new trades are disabled (TradingDay := false). Open positions are kept.
- End of Day (EoD): At 1:30 PM, all remaining open positions are closed (strategy.close_all).
🤝 Development & Disclaimer
This script and description were created with assistance from Gemini and GitHub Copilot. My focus is on helping fellow real estate investors and day traders develop mechanically sound systems.
Disclaimer: This is for educational purposes only and does not constitute financial advice. Always abide by the Realtor Code and manage your own risk.

Basic DCA Strategy by Wongsakon KhaisaengThe Core Principle and Philosophy Behind the Basic DCA Strategy
1. Introduction
The Basic DCA Strategy (Dollar-Cost Averaging) represents one of the most fundamental and enduring investment methodologies in the realm of systematic accumulation. The philosophy underpinning DCA is rooted not in speculation or prediction, but in disciplined participation. It assumes that the consistent act of investing a fixed amount of capital over time—regardless of short-term price volatility—can yield superior long-term outcomes through the natural smoothing effect of cost averaging.
This strategy, expressed through the Pine Script code above, formalizes the DCA concept into a fully systematic trading framework, enabling quantitative backtesting and objective evaluation of long-term accumulation efficiency.
2. Mechanism of Operation
At its technical core, the strategy executes a fixed-value buy order at every predefined interval within a specific accumulation period.
Each DCA event invests a constant “Investment Amount (USD)” irrespective of price fluctuations. When prices decline, this constant investment buys a larger quantity of the asset; when prices rise, it purchases fewer units. Over time, this behavior lowers the average cost basis of the accumulated position, effectively neutralizing short-term timing risks.
Mathematically, this is represented as:
Units Purchased = Investment Amount / Closing Price
Cost Basis = Total Invested USD / Total Units Acquired
Portfolio Value = Total Units Acquired × Current Price
The algorithm tracks cumulative investment, acquired units, and commissions dynamically, continuously recalculating key portfolio metrics such as total profit/loss (PnL), CAGR (Compound Annual Growth Rate), and maximum drawdown (peak-to-trough equity decline).
Furthermore, the script juxtaposes DCA results with a Buy & Hold benchmark, where the entire initial capital is invested at once. This comparison highlights the behavioral resilience and volatility resistance of the DCA method relative to market-timing strategies.
3. The Essence of DCA Philosophy
At its philosophical core, DCA is not a trading system, but a behavioral framework for rational capital deployment under uncertainty. It embodies the principle that time in the market often outweighs timing the market.
The DCA approach rejects the illusion of precision forecasting and embraces probabilistic humility—the recognition that even the most skilled investors cannot consistently predict short-term market fluctuations. Instead, it focuses on controlling what is controllable: the frequency, consistency, and size of investment actions.
This mindset reflects a broader principle of risk dispersion through temporal diversification. Rather than concentrating entry risk into a single price point (as in lump-sum investing), DCA spreads exposure across multiple time intervals, thereby converting volatility into opportunity.
In essence, volatility—often perceived as risk—is reframed as a mechanism for mean reversion advantage. The strategy thrives precisely because markets oscillate; each fluctuation provides a chance to accumulate at varied price levels, improving the weighted-average entry over time.
4. Long-Term Rationality Over Short-Term Emotion
DCA’s endurance stems from its ability to neutralize emotional biases inherent in human decision-making. Investors tend to overreact to market euphoria or panic—buying high out of greed and selling low out of fear. By automating purchases through predefined intervals, the DCA model enforces mechanical discipline, detaching decision-making from sentiment.
This transforms investing from an emotional endeavor into a systematic, algorithmic routine governed by rules rather than reactions. In doing so, DCA serves not only as a financial model but also as a psychological safeguard—aligning investor behavior with long-term compounding logic rather than short-term speculation.
5. Comparative Insight: DCA vs. Buy & Hold
While both DCA and Buy & Hold share a long-term investment horizon, they diverge in their treatment of entry timing. The Buy & Hold model assumes full deployment of capital at the beginning, maximizing exposure to growth but also to volatility. Conversely, DCA smooths the entry curve, trading off short-term returns for long-term stability and improved average entry price.
In environments characterized by volatility and cyclical corrections, DCA tends to outperform in terms of risk-adjusted returns, lower drawdowns, and improved investor adherence—since it reduces the psychological pain of entering at local peaks.
6. Conclusion
The Basic DCA Strategy exemplifies the synthesis of mathematical rigor and behavioral discipline. Its algorithmic construction in Pine Script transforms a classical investment philosophy into a quantifiable, testable, and transparent framework.
By automating fixed-amount purchases across time, the system operationalizes the central axiom of DCA: consistency over conviction. It is not concerned with predicting future prices but with ensuring persistent participation—trusting that the market’s upward bias and the power of compounding will reward patience more than precision.
Ultimately, DCA embodies the timeless principle that successful investing is less about forecasting markets, and more about designing behavior that can endure them.

Master Arb Recipes – 3 Commas signal Bot integration Master Arb Recipes – 3 Commas signal Bot integration
Purpose
A systematic arbitrage/accumulation framework with pre-tuned “recipes” for BTC/ETH/XRP/SUI/SOL plus a fully manual mode. It automates signal generation for external execution bots (via alert() JSON), while showing on-chart panels for goals, active parameters, DCA position, and P&L/ROI/CAGR. Backtests simulate market orders with optional slippage and TradingView commissions.
Key ideas
Entries: Intrabar trigger when price drops by the recipe’s Entry drop % from the previous close.
Exits: Profit-taking when price rises by the recipe’s Exit rise % (optionally requiring price above average cost).
DCA accounting: Tracks running quantity, average cost, realized (cash) P&L, and unrealized (coin) P&L.
Capital planning: “ReqCap” column estimates capital = Entry $ × Allowed entries (UI only; does not affect orders).
Alerts (live only): Sends minimal Custom Signal JSON for enter_long / exit_long to your execution bot.
What’s included on chart
Top-Right: Strategy Goals Table
Describes the objective for each preset. Auto-filters by the chart’s base (optional).
Bottom-Left: Active Recipe Panel (with 3C UI column)
Shows the active preset (or custom) with: timeframe, Sell-Above-Cost state, Entry/Exit %, Exit-as-%-of-Entry, min bars between entries, once-per-bar gate, and 3Commas UI guidance for optional filters and per-order dollars.
Top-Left: DCA Panel
Current base quantity, average cost, and realized P&L.
Bottom-Right: P&L + ROI/CAGR Panel
Cash P&L (realized), Coin P&L (unrealized), Total P&L, ROI since first fill, and annualized CAGR. Displays denominators for both StartCap (strategy.initial_capital) and ReqCap (planning).
Presets
BTC: STH1_D, LTH1_6H, LTH2_D, LTH3_W, LTH4_6H
ETH: STH1_D, STH2_D, LTH1_D
XRP: STH1_D, STH2_6H, LTH1_6H, LTH2_1H
SUI: STH1_D, STH2_D, STH3_D
SOL: STH1_D, LTH1_D
Each preset sets Entry drop %, Exit rise %, default Entry $, Exit-as-%-of-Entry, Sell-Above-Cost flag, and a reference timeframe (display only). Custom mode lets you define these manually.
Inputs you’ll use
3Commas Custom Signal: secret, bot_uuid, max_lag_sec.
Start Window: Exact date/time + timezone to begin trading/signals.
Entry/Exit Parameters: Entry drop %, Exit rise %, Sell Above Avg Cost toggle, Exit as % of Entry.
Capital Planning: Allowed entries (for ReqCap), Entry $ override (panel only).
Execution/Sim: Simulated slippage %, once-per-bar gate, minimum bars between entries, TradingView commission.
Panels: Toggles + positions for each table.
Alert / Bot integration
Alerts fire only in realtime (barstate.isrealtime) on order submission.
Create one alert on this script using “Any alert() function call”.
Payload (Custom Signal style) includes:
secret, bot_uuid, max_lag, timestamp, trigger_price, tv_exchange, tv_instrument, action where action ∈ {enter_long, exit_long}.
Sizing: This script does not include per-order sizing in the JSON; size in your bot UI. The on-chart Entry $ / Exit $ values are for planning/backtest display.
3Commas optional filter mapping (shown in the panel’s “3C UI” column):
Entry filters:
Same order: set to –EntryDrop% (ON)
From average entry: set to –EntryDrop% (ON)
Exit filters:
If Sell Above Cost = ON → From average entry +ExitRise% (ON); Same order OFF
If Sell Above Cost = OFF → Same order +ExitRise% (ON); From average entry OFF
Per-order volume: Use your bot’s UI. Panel shows the dollars you planned (Entry $ and Exit $).
Backtest notes & limitations
Uses calc_on_every_tick=true and intrabar checks against the previous close for entry drops; historical behavior won’t perfectly match exchange microstructure.
process_orders_on_close=false; fills are simulated at bar prices with your slippage setting and TV commission.
Alerts and webhook timing depend on TradingView + broker/exchange latencies; use max_lag_sec accordingly.
Required Capital (ReqCap) is for planning only and does not reserve funds or constrain orders.
Recommended markets/timeframes
Crypto spot or futures charts that trade 24/7. Preset labels (D/6H/1H/W) are reference rhythms for volatility; the script runs on any timeframe but results will vary.
Change log (04092025)
Added 3C UI guidance column in Active Recipe panel (dynamic % per recipe).
Restored Goals (top-right) and P&L/ROI/CAGR (bottom-right with StartCap & ReqCap).
Minor UI clarifications; trading logic unchanged.
Disclaimer
This script is for research and education. It is not financial advice and makes no performance promises. Backtests are hypothetical and subject to substantial limitations. Markets involve risk; you can lose capital. Test on paper first and deploy at your own discretion. Licensed under the Mozilla Public License 2.0.

FVG Ultra Assertive - Individual Filters (mtbr)FVG Ultra Assertive - Individual Filters (mtbr)
What this script offers:
This strategy detects and highlights FVGs (Fair Value Gaps) on the chart, providing traders with a visual and systematic approach to identify potential price inefficiencies. The script plots bullish and bearish FVG zones using customizable boxes and labels, allowing users to easily spot high-probability trading areas. In addition, it opens and closes simulated trades based on the detected FVGs, enabling full backtesting and strategy performance evaluation. It integrates multiple independent filters to validate the strength of each FVG signal before entering a trade.
How it works:
The script identifies:
Bullish FVGs when the current low is higher than the high of two bars ago.
Bearish FVGs when the current high is lower than the low of two bars ago.
Once an FVG is detected, it applies three optional independent filters:
GAP/ATR Filter:
Measures the FVG size relative to the Average True Range (ATR). Only gaps exceeding a user-defined multiple of ATR are considered valid.
Support/Resistance (S/R) Filter:
Uses pivot points to check if the FVG overlaps with recent high/low pivot levels within a tolerance percentage. This ensures the gap aligns with meaningful market levels.
Stochastic Filter:
Applies a stochastic oscillator to confirm momentum. Bullish FVGs are validated when stochastic values are oversold, and bearish FVGs when overbought.
After passing the selected filters, the strategy opens trades:
LONG FVG for bullish signals (buy)
SHORT FVG for bearish signals (sell)
The strategy automatically closes positions when an opposite signal appears, generating a backtest report with trades, profits, and statistics. The final bullish or bearish FVG signals are plotted as colored boxes on the chart with labels “BULL FVG” or “BEAR FVG” for immediate visual reference.
How to configure it for use:
Use GAP/ATR Filter: Enable or disable the ATR-based filter and adjust the ATR period (ATR Length) and minimum gap multiplier (Minimum Gap x ATR).
Use S/R Filter: Enable or disable the pivot-based S/R filter. Configure the pivot lookback periods (Pivot Left and Pivot Right) and the tolerance percentage (Gap Tolerance %).
Use Stochastic Filter: Enable or disable stochastic confirmation. Adjust the K and D lengths (Stoch K Length and Stoch D Length) and the overbought/oversold thresholds (Stoch Overbought and Stoch Oversold).
Colors: Customize the colors for bullish and bearish FVGs (FVG Bull and FVG Bear) to match your chart preferences.
Usage Tips:
Apply this strategy to any timeframe; shorter timeframes generate more frequent FVGs, while higher timeframes highlight stronger gaps.
Combine FVG signals with other technical analysis tools for better trade confirmation.
Use the box and label visualization to quickly scan charts for trade opportunities without cluttering the chart.
The strategy’s trades (LONG and SHORT) provide backtesting results and performance statistics for each signal.

Signalgo Strategy ISignalgo Strategy I: Technical Overview
Signalgo Strategy I is a systematically engineered TradingView strategy script designed to automate, test, and manage trend-following trades using multi-timeframe price/volume logic, volatility-based targets, and multi-layered exit management. This summary covers its operational structure, user inputs, entry and exit methodology, unique technical features, and practical application.
Core Logic and Workflow
Multi-Timeframe Data Synthesis
User-Defined Timeframe: The user chooses a timeframe (e.g., 1H, 4H, 1D, etc.), on which all strategy signals are based.
Cross-Timeframe Inputs: The strategy imports closing price, volume, and Average True Range (ATR) for the selected interval, independently from the chart’s native timeframe, enabling robust multi-timeframe analysis.
Price Change & Volume Ratio: It calculates the percent change of price per bar and computes a volume ratio by comparing current volume to its 20-bar moving average—enabling detection of true “event” moves vs. normal market noise.
Hype Filtering
Anti-Hype Mechanism: An entry is automatically filtered out if abnormal high volume occurs without corresponding price movement, commonly observed during manipulation or announcement periods. This helps isolate genuine market-driven momentum.
User Inputs
Select Timeframe: Choose which interval drives signal generation.
Backtest Start Date: Specify from which date historical signals are included in the strategy (for precise backtests).
Take-Profit/Stop-Loss Configuration: Internally, risk levels are set as multiples of ATR and allow for three discrete profit targets.
Entry Logic
Trade Signal Criteria:
Price change magnitude in the current bar must exceed a fixed sensitivity threshold.
Volume for the bar must be significantly elevated compared to average, indicating meaningful participation.
Anti-hype check must not be triggered.
Bullish/Bearish Determination: If all conditions are met and price change direction is positive, a long signal triggers. If negative, a short signal triggers.
Signal Debouncing: Ensures a signal triggers only when a new condition emerges, avoiding duplicate entries on flat or choppy bars.
State Management: The script tracks whether an active long or short is open to avoid overlapping entries and to facilitate clean reversals.
Exit Strategy
Take-Profits: Three distinct profit targets (TP1, TP2, TP3) are calculated as fixed multiples of the ATR-based stop loss, adapting dynamically to volatility.
Reversals: If a buy signal appears while a short is open (or vice versa), the existing trade is closed and reversed in a single step.
Time-Based Exit: If, 49 bars after entry, the trade is in-profit but hasn’t reached TP1, it exits to avoid stagnation risk.
Adverse Move Exit: The position is force-closed if it suffers a 10% reversal from entry, acting as a catastrophic stop.
Visual Feedback: Each TP/SL/exit is plotted as a clear, color-coded line on the chart; no hidden logic is used.
Alerts: Built-in TradingView alert conditions allow automated notification for both entries and strategic exits.
Distinguishing Features vs. Traditional MA Strategies
Event-Based, Not Just Slope-Based: While classic moving average strategies enter trades on MA crossovers or slope changes, Signalgo Strategy I demands high-magnitude price and volume confirmation on the chosen timeframe.
Volume Filtering: Very few MA strategies independently filter for meaningful volume spikes.
Real Market Event Focus: The anti-hype filter differentiates organic market trends from manipulated “high-volume, no-move” sessions.
Three-Layer Exit Logic: Instead of a single trailing stop or fixed RR, this script manages three profit targets, time-based closures, and hard adverse thresholds.
Multi-Timeframe, Not Chart-Dependent: The “main” analytical interval can be set independently from the current chart, allowing for in-depth cross-timeframe backtests and system runs.
Reversal Handling: Automatic handling of signal reversals closes and flips positions precisely, reducing slippage and manual error.
Persistent State Tracking: Maintains variables tracking entry price, trade status, and target/stop levels independently of chart context.
Trading Application
Strategy Sandbox: Designed for robust backtesting, allowing users to simulate performance across historical data for any major asset or interval.
Active Risk Management: Trades are consistently managed for both fixed interval “stall” and significant loss, not just via trailing stops or fixed-day closes.
Alert Driven: Can power algorithmic trading bots or notify discretionary traders the moment a qualifying market event occurs.

The Barking Rat PercentilesPercentile Reversion with Multi-Layered Smoothing
The Barking Rat Percentiles is a multi-tiered reversion strategy based on fixed percentage movements away from the mean, designed to capture price extremes through a structured, practical approach. It combines statistically derived percentile bands, RSI momentum filtering, and ATR-driven exits to identify potential turning points while managing opportunity with precision. The aim is to isolate high-quality reversal opportunities at progressively deeper extremes while avoiding noise and low-conviction setups.
At its core, the strategy measures the current market position relative to long-term percentile thresholds. When price moves significantly beyond these smoothed levels and momentum shows signs of exhaustion, staged entries are triggered. Exits are managed using independent ATR-based take profit and stop loss logic to adapt to varying volatility conditions.
🧠 Core Logic: Tiered Extremes & Structured Management
This strategy is intentionally methodical, layering multiple thresholds and validation checks before highlighting potential setups. By combining percentile-based extremes with momentum confirmation and adaptive trade management, it offers a disciplined and repeatable framework for mean reversion trading.
1. Percentile Thresholds as the Primary Framework
The script calculates the highest high and lowest low over a long lookback period of more than 1000 candles to define the overall price range. It then derives upper and lower percentile thresholds to determine extreme price levels. These thresholds are smoothed using a simple moving average to filter out short-term noise, ensuring that only statistically significant deviations from the mean are considered for potential trades.
2. Multi-Tier Entry Levels
Based on the percentile distance away from the mean, the script plots and references five discrete trigger levels beyond the primary thresholds for both long and short positions. Each tier represents progressively deeper extremes, typically 1–3% beyond the smoothed threshold, balancing the benefits of early entries with the safety of more confirmed extremes. Custom logic ensures only one signal is generated per threshold level, avoiding duplicate entries in the same zone.
3. RSI Momentum Filter
A 14-period RSI filter is applied to prevent entering trades against strong momentum. Long trades are only triggered when RSI falls below 30 (oversold), and short trades only when RSI rises above 70 (overbought). This helps align entries with potential exhaustion points, reducing the risk of entering prematurely into a strong ongoing trend.
4. ATR-Based Trade Management
For each trade sequence, the strategy will exit on the first exit condition met: either the take profit (TP) or the stop loss (SL). Because the TP uses a smaller ATR multiplier, it’s generally closer to the entry price, so most trades will hit the TP before reaching the SL. The SL is intentionally set with a larger ATR multiplier to give the trade room to develop, acting as a protective fallback rather than a frequent exit.
So in practice, you’ll usually see the TP executed for a trade, and the SL only triggers in cases where price moves further against the position than expected.
5. Position Reset Logic
Once price returns to the smoothed threshold region, all entry tiers in that direction are reset. This allows the system to prepare for new opportunities if the market revisits extreme levels, without triggering duplicate trades at the same threshold.
Why These Parameters Were Chosen
Multi-tier thresholds ensure that only meaningful extremes are acted upon, while the long-range SMA provides historical context and filters out noise. The staged entry logic per level balances the desire for early participation with the discipline of risk management. ATR-based TP and SL levels adapt to changing volatility, while the RSI filter improves timing by aligning trades with potential exhaustion points. Together, these elements create a balanced, structured, and repeatable approach to mean reversion trading.
📈 Chart Visuals: Clear & Intuitive
Green “▲” below a candle: Potential long entry
Red “▼” above a candle: Potential short entry
Blue “✔️”: Exit when ATR take profit is hit
Orange “✘”: Exit when ATR stop loss is hit
Tier threshold lines (smoothed upper/lower bounds)
🔔Alerts: Stay Notified Without Watching
The strategy supports real-time alerts on candle close, ensuring that signals are only triggered once fully confirmed.
You must manually set up alerts within your TradingView account. Once configured, you’ll be able to set up one alert per instrument. This one alert covers all relevant signals and exits — ideal for hands-free monitoring.
⚙️Strategy report properties
Position size: 25% equity per trade
Initial capital: 10,000.00 USDT
Pyramiding: 10 entries per direction
Slippage: 2 ticks
Commission: 0.055% per side
Backtest timeframe: 1-minute
Backtest instrument: SOLUSDT
Backtesting range: Jul 28, 2025 — Aug 14, 2025
Note on Sample Size:
You’ll notice the report displays fewer than the ideal 100 trades in the strategy report above. This is intentional. The goal of the script is to isolate high-quality, short-term reversal opportunities while filtering out low-conviction setups. This means that the Barking Rat Percentiles strategy is ultra-selective, filtering out over 90% of market noise by enforcing multiple validation layers. The brief timeframe shown in the strategy report here illustrates its filtering logic over a short window — not its full capabilities. As a result, even on lower timeframes like the 1-minute chart, signals are deliberately sparse — each one must pass all criteria before triggering.
For a larger dataset:
Once the strategy is applied to your chart, users are encouraged to expand the lookback range or apply the strategy to other volatile pairs to view a full sample.
💡Why 25% Equity Per Trade?
While it's always best to size positions based on personal risk tolerance, we defaulted to 25% equity per trade in the backtesting data — and here’s why:
Backtests using this sizing show manageable drawdowns even under volatile periods
The strategy generates a sizeable number of trades, reducing reliance on a single outcome
Combined with conservative filters, the 25% setting offers a balance between aggression and control
Users are strongly encouraged to customize this to suit their risk profile.
🔍 What Makes This Strategy Unique?
Multi-Tier Percentile Triggers – Instead of relying on a single overbought/oversold zone, this strategy uses five distinct entry tiers per direction, allowing for staged, precision entries at progressively deeper extremes.
Long-Term Percentile Smoothing – By calculating extremes over a 1000+ candle range and smoothing them with a moving average, the strategy focuses only on statistically significant deviations.
Custom One-Signal-Per-Tier Logic – Prevents duplicate trades at the same threshold level, reducing overtrading and noise.
Dual ATR Exit System – Independent TP and SL levels adapt to volatility. TP uses a smaller ATR multiplier for realistic, achievable exits and generally executes first, while the SL has a larger ATR multiplier to provide protective breathing room if the trade moves further against the position.
Momentum-Aware Filtering – A 14-period RSI filter ensures trades are only taken when momentum is likely exhausted, avoiding entries into strong trends.
Automatic Position Reset – Once price normalizes, tiers reset, allowing for fresh entries without interference from previous trades.

Strategi FVG 09:31 (Pro)FVG 09:31 Strategy (Pro)
In short, this is an automated trading strategy (bot) for TradingView designed to execute buy or sell orders based on a Fair Value Gap (FVG) pattern. The strategy is highly specific, as it only triggers on the 1-minute timeframe and looks for an FVG that forms precisely at 09:32 AM New York time.
Main Purpose of the Strategy
The primary goal of this script is to identify and capitalize on short-term price imbalances, known as Fair Value Gaps (FVGs). It operates during a specific, high-volatility window right after the U.S. stock market opens, often referred to by traders as the "Silver Bullet" session. By automating the detection and execution, it aims to trade these fleeting opportunities with precision.
How the Strategy Works
The strategy follows a clear, step-by-step logical flow on your chart.
1. Time & Timeframe Restriction
1-Minute Timeframe: The strategy is hard-coded to work only on the 1-minute (1m) chart. A warning label will appear on your chart if you apply it to any other timeframe.
Specific Time Window: The core logic activates only between 09:32 and 09:33 AM New York time. It searches for an FVG pattern formed by the three candles from 09:29, 09:30, and 09:31, with the pattern confirmation happening on the close of the 09:31 candle.
2. Fair Value Gap (FVG) Detection
An FVG is a three-candle pattern that signals a price imbalance.
Bullish FVG (Potential Buy): Occurs when the low of the first candle is higher than the high of the third candle. The space between these two prices is the FVG zone.
Bearish FVG (Potential Sell): Occurs when the high of the first candle is lower than the low of the third candle. The space between these two prices is the FVG zone.
If this pattern is detected at the target time, the strategy draws a colored box on the chart to visualize the FVG zone (aqua for bullish, fuchsia for bearish).
3. Entry Logic
The strategy provides two user-selectable methods for entering a trade:
Retracement (Immediate Entry): The strategy will open a position with a market order as soon as the price retraces back into the identified FVG zone.
For a Bullish FVG, a Long (buy) position is opened when the price drops to touch the upper boundary of the FVG.
For a Bearish FVG, a Short (sell) position is opened when the price rises to touch the lower boundary of the FVG.
Limit Order (Pending Entry): The strategy places a pending limit order at the edge of the FVG zone.
For a Bullish FVG, a Buy Limit order is placed at the upper boundary of the FVG.
For a Bearish FVG, a Sell Limit order is placed at the lower boundary of the FVG.
Order Expiration: If the limit order is not filled within a specified number of candles (default is 15), it is automatically canceled to avoid chasing a stale setup.
4. Exit Logic
Once a position is active, the strategy automatically manages the exit by setting a Take Profit (TP) and Stop Loss (SL) level. You can choose between two types:
Ticks (Fixed Points): You define a fixed profit target and loss limit in ticks (the smallest price movement). For example, a 200-tick TP and a 100-tick SL.
Last Swing (Dynamic Levels): The TP and SL are set dynamically based on the most recent swing high or swing low.
For a Long position: Take Profit is set at the last swing high; Stop Loss is at the last swing low.
For a Short position: Take Profit is set at the last swing low; Stop Loss is at the last swing high.
5. Daily Management
At the start of each new trading day, the script performs a reset. All variables, including any FVG data from the previous day, are cleared. This ensures the strategy only acts on fresh signals from the current day and cancels any pending orders from the day before.
Explanation of Settings (Inputs)
Here is what each user-configurable setting does:
Entry Type: Choose your preferred entry method: Retracement or Limit Order.
Order Expiration (Candles): Applies only to the Limit Order type. Sets how many candles an unfilled order will remain active before being canceled.
Stop Loss Type: Choose Ticks for a fixed-distance stop loss or Last Swing for a dynamic level.
Take Profit Type: Choose Ticks for a fixed-distance profit target or Last Swing for a dynamic level.
Pivot Lookback (SL/TP Swing): Defines how many candles the script looks back to identify the most recent swing high/low for the Last Swing SL/TP type.
Contract Size: The quantity or lot size for each trade.
Take Profit (in Ticks): The profit target distance if using the Ticks type.
Stop Loss (in Ticks): The maximum loss distance if using the Ticks type.

Timeshifter Triple Timeframe Strategy w/ SessionsOverview
The "Enhanced Timeshifter Triple Timeframe Strategy with Session Filtering" is a sophisticated trading strategy designed for the TradingView platform. It integrates multiple technical indicators across three different timeframes and allows traders to customize their trading Sessions. This strategy is ideal for traders who wish to leverage multi-timeframe analysis and session-based trading to enhance their trading decisions.
Features
Multi-Timeframe Analysis and direction:
Higher Timeframe: Set to a daily timeframe by default, providing a broader view of market trends.
Trading Timeframe: Automatically set to the current chart timeframe, ensuring alignment with the trader's primary analysis period.
Lower Timeframe: Set to a 15-minute timeframe by default, offering a granular view for precise entry and exit points.
Indicator Selection:
RMI (Relative Momentum Index): Combines RSI and MFI to gauge market momentum.
TWAP (Time Weighted Average Price): Provides an average price over a specified period, useful for identifying trends.
TEMA (Triple Exponential Moving Average): Reduces lag and smooths price data for trend identification.
DEMA (Double Exponential Moving Average): Similar to TEMA, it reduces lag and provides a smoother trend line.
MA (Moving Average): A simple moving average for basic trend analysis.
MFI (Money Flow Index): Measures the flow of money into and out of a security, useful for identifying overbought or oversold conditions.
VWMA (Volume Weighted Moving Average): Incorporates volume data into the moving average calculation.
PSAR (Parabolic SAR): Identifies potential reversals in price movement.
Session Filtering:
London Session: Trade during the London market hours (0800-1700 GMT+1).
New York Session: Trade during the New York market hours (0800-1700 GMT-5).
Tokyo Session: Trade during the Tokyo market hours (0900-1800 GMT+9).
Users can select one or multiple sessions to align trading with specific market hours.
Trade Direction:
Long: Only long trades are permitted.
Short: Only short trades are permitted.
Both: Both long and short trades are permitted, providing flexibility based on market conditions.
ADX Confirmation:
ADX (Average Directional Index): An optional filter to confirm the strength of a trend before entering a trade.
How to Use the Script
Setup:
Add the script to your TradingView chart.
Customize the input parameters according to your trading preferences and strategy requirements.
Indicator Selection:
Choose the primary indicator you wish to use for generating trading signals from the dropdown menu.
Enable or disable the ADX confirmation based on your preference for trend strength analysis.
Session Filtering:
Select the trading sessions you wish to trade in. You can choose one or multiple Sessions based on your trading strategy and market focus.
Trade Direction:
Set your preferred trade direction (Long, Short, or Both) to align with your market outlook and risk tolerance. You can use this feature to gauge the market and understand the possible directions.
Tips for Profitable and Safe Trading:
Recommended Timeframes Combination:
LT: 1m , CT: 5m, HT: 1H
LT: 1-5m , CT: 15m, HT: 4H
LT: 5-15m , CT: 4H, HT: 1W
Backtesting:
Always backtest the strategy on historical data to understand its performance under various market conditions.
Adjust the parameters based on backtesting results to optimize the strategy for your specific trading style.
Risk Management:
Use appropriate risk management techniques, such as setting stop-loss and take-profit levels, to protect your capital.
Avoid over-leveraging and ensure that you are trading within your risk tolerance.
Market Analysis:
Combine the script with other forms of market analysis, such as fundamental analysis or market sentiment, to make well-rounded trading decisions.
Stay informed about major economic events and news that could impact market volatility and trading sessions.
Continuous Monitoring:
Regularly monitor the strategy's performance and make adjustments as necessary.
Keep an eye on the results and settings for real-time statistics and ensure that the strategy aligns with current market conditions.
Education and Practice:
Continuously educate yourself on trading strategies and market dynamics.
Practice using the strategy in a demo account before applying it to live trading to gain confidence and understanding.

VWAP Breakout Strategy + EMAs + Clean Cycle/TP/SL PlotsHere’s a quick user-guide to get you up and running with your “VWAP Breakout Strategy + EMAs + Clean Cycle/TP/SL Plots” script in TradingView:
⸻
1. Installing the Script
1. Open TradingView, go to Pine Editor (bottom panel).
2. Paste in your full Pine-v6 code and hit Add to chart.
3. Save it (“Save as…”): give it a memorable name (e.g. “VWAP Breakout+EMAs”).
⸻
2. Configuring Your Inputs
Once it’s on the chart, click the ⚙️ Settings icon to tune:
Setting Default What it does
ATR Length 14 Period for average true range (volatility measure)
ATR Multiplier for Stop 1.5 How many ATRs away your stop-loss sits
TP1 / TP2 Multipliers (ATR) 1.0 / 2.0 Distance of TP1 and TP2 in ATR multiples
Show VWAP / EMAs On Toggles the blue VWAP line & EMAs (100/34/5)
Full Cycle Range Points 200 Height of the shaded “cycle zone”
Pivot Lookback 5 How many bars back to detect a pivot low
Round Number Step 500 Spacing of your dotted horizontal lines
Show TP/SL Labels On Toggles all the “ENTRY”, “TP1”, “TP2”, “STOP” tags
Feel free to adjust ATR multipliers and cycle-zone size based on the instrument’s typical range.
⸻
3. Reading the Signals
• Long Entry:
• Trigger: price crosses above VWAP
• You’ll see a green “Buy” tag at the low of the signal bar, plus an “ENTRY (Long)” label at the close.
• Stop is plotted as a red dashed line below (ATR × 1.5), and TP1/TP2 as teal and purple lines above.
• Short Entry:
• Trigger: price crosses below VWAP
• A red “Sell” tag appears at the high, with “ENTRY (Short)” at the close.
• Stop is the green line above; TP1/TP2 are dashed teal/purple lines below.
⸻
4. Full Cycle Zone
Whenever a new pivot low is detected (using your Pivot Lookback), the script deletes the old box and draws a shaded yellow rectangle from that low up by “Full Cycle Range Points.”
• Use this to visualize the “maximum expected swing” from your pivot.
• You can quickly see whether price is still traveling within a normal cycle or has overstretched.
⸻
5. Round-Number Levels
With Show Round Number Levels enabled, you’ll always get horizontal dotted lines at the nearest multiples of your “Round Number Step” (e.g. every 500 points).
• These often act as psychological support/resistance.
• Handy to see confluence with VWAP or cycle-zone edges.
⸻
6. Tips & Best-Practices
• Timeframes: Apply on any intraday chart (5 min, 15 min, H1…), but match your ATR length & cycle-points to the timeframe’s typical range.
• Backtest first: Use the Strategy Tester tab to review performance, tweak ATR multipliers or cycle size, then optimize.
• Combine with context: Don’t trade VWAP breakouts blindly—look for confluence (e.g. support/resistance zones, higher-timeframe trend).
• Label clutter: If too many labels build up, you can toggle Show TP/SL Labels off and rely just on the lines.
⸻
That’s it! Once you’ve added it to your chart and dialed in the inputs, your entries, exits, cycle ranges, and key levels will all be plotted automatically. Feel free to experiment with the ATR multipliers and cycle-zone size until it fits your instrument’s personality. Happy trading!

Price Flip StrategyPrice Flip Strategy with User-Defined Ticker Max/Max
This strategy leverages an inverted price calculation based on user-defined maximum and minimum price levels over customizable lookback periods. It generates buy and sell signals by comparing the previous bar's original price to the inverted price, within a specified date range. The script plots key metrics, including ticker max/min, original and inverted prices, moving averages, and HLCC4 averages, with customizable visibility toggles and labels for easy analysis.
Key Features:
Customizable Inputs: Set lookback periods for ticker max/min, moving average length, and date range for signal generation.
Inverted Price Logic: Calculates an inverted price using ticker max/min to identify trading opportunities.
Flexible Visualization: Toggle visibility for plots (e.g., ticker max/min, prices, moving averages, HLCC4 averages) and last-bar labels with user-defined colors and sizes.
Trading Signals: Generates buy signals when the previous original price exceeds the inverted price, and sell signals when it falls below, with alerts for real-time notifications.
Labeling: Displays values on the last bar for all plotted metrics, aiding in quick reference.
How to Use:
Add to Chart: Apply the script to a TradingView chart via the Pine Editor.
Configure Settings:
Date Range: Set the start and end dates to define the active trading period.
Ticker Levels: Adjust the lookback periods for calculating ticker max and min (e.g., 100 bars for max, 100 for min).
Moving Averages: Set the length for exponential moving averages (default: 20 bars).
Plots and Labels: Enable/disable specific plots (e.g., Inverted Price, Original HLCC4) and customize label colors/sizes for clarity.
Interpret Signals:
Buy Signal: Triggered when the previous close price is above the inverted price; marked with an upward label.
Sell Signal: Triggered when the previous close price is below the inverted price; marked with a downward label.
Set Alerts: Use the built-in alert conditions to receive notifications for buy/sell signals.
Analyze Plots: Review plotted lines (e.g., ticker max/min, HLCC4 averages) and last-bar labels to assess price behavior.
Tips:
Use in trending markets by enabling ticker max for uptrends or ticker min for downtrends, as indicated in tooltips.
Adjust the label offset to prevent overlapping text on the last bar.
Test the strategy on a demo account to optimize lookback periods and moving average settings for your asset.
Disclaimer: This script is for educational purposes and should be tested thoroughly before use in live trading. Past performance is not indicative of future results.

Supertrend Hombrok BotSupertrend Hombrok Bot – Automated Trading Strategy for Dynamic Market Conditions
This trading strategy script has been developed to operate automatically based on detailed market conditions. It combines the popular Supertrend indicator, RSI (Relative Strength Index), Volume, and ATR (Average True Range) to determine the best entry and exit points while maintaining proper risk management.
Key Features:
Supertrend as the Base: Uses the Supertrend indicator to identify the market's trend direction, generating buy signals when the market is in an uptrend and sell signals when in a downtrend.
RSI Filter: The RSI is used to determine overbought and oversold conditions, helping to avoid entries in extreme market conditions. Entries are avoided when RSI > 70 (overbought) and RSI < 30 (oversold), reducing the risk of false movements.
Volume Filter: The strategy checks if the trading volume is above the average multiplied by a user-defined factor. This ensures that only significant movements, with higher liquidity, are considered.
Candle Body Size: The strategy filters only candles with a body large enough relative to the ATR (Average True Range), ensuring that the price movements on the chart have sufficient strength.
Risk Management: The bot is configured to operate with an adjustable Risk/Reward Ratio (R:R). This means that for each trade, both Take Profit (TP) and Stop Loss (SL) are adjusted based on the market's volatility as measured by the ATR.
Automatic Entries and Exits: The script automatically executes entries based on the specified conditions and exits with predefined Stop Loss and Take Profit levels, ensuring risk is controlled for each trade.
How It Works:
Buy Condition: Triggered when the market is in an uptrend (Supertrend), the volume is above the adjusted average, the candle body is strong enough, and the RSI is below the overbought level.
Sell Condition: Triggered when the market is in a downtrend (Supertrend), the volume is above the adjusted average, the candle body is strong enough, and the RSI is above the oversold level.
Alerts:
Buy and Sell Alerts are configured with detailed information, including Stop Loss and Take Profit values, allowing the user to receive notifications when trading conditions are met.
Capital Management:
The capital per trade can be adjusted based on account size and risk profile.
Important Note:
Always test before trading with real capital: While the strategy has been designed based on solid technical analysis methods, always perform tests in real-time market conditions with demo accounts before applying the bot in live trading.
Disclaimer: This script is a tool to assist in the trading process and does not guarantee profit. Past performance is not indicative of future results, and the trader is always responsible for their investment decisions.
