[GTH] RevenueVisually similar to the GTH Earnings indicator, this indicator plots
Reported Revenue (black line)
Difference to Estimated Revenue (colored bars)
Percentage change to the previous Reported Revenue (tags)
Note 1: Although in Tradingview the 'E' tags on the time line display Revenues alongside with Earnings , there is a difference in timing. Revenues are reported quarterly; Earnings reporting dates differ with each stock. Hence, the tags in this indicator are not necessarily aligned with the Earnings reporting dates.
Note 2: It should be obvious that this indicator can only report data provided by Tradingview. Even more obviousy, it can not display revenues of anything else but stocks.
If you find a malfunction, please provide examples. "Does not work" is not helpful.
Recherche dans les scripts pour "tradingview界面调整"

BINANCE_Minimum_qty_for_tradingWe can not buy just 0.001ETH in Binance on 2022.8.8
Why? Binance have trading role about the minimum qty of coins.
Until now, we can not find the info in TradingView.
I hope Our TradingView give us this updating info easily oneday.
I am not a good English speaker.
Sorry about my short explanation.
reference: www.binance.com
3LS | 3 Line Strike Strategy [Kintsugi Trading]What is the 3LS | 3 Line Strike Strategy?
Incorporating the 3 Line Strike candlestick pattern into our strategy was inspired by Arty at The Moving Average and the amazing traders at TheTrdFloor .
The Three Line Strike is a trend continuation candlestick pattern consisting of four candles. Depending on their heights and collocation, a bullish or a bearish trend continuation can be predicted.
In a symphony of trend analysis, price action, and volume we can find and place high-probability trades with the 3LS Strategy.
How to use it!
----- First, start by choosing a Stop-Loss Strategy, Stop PIP Size, and Risk/Reward Ratio -----
- Stop-Loss Strategy
Fixed PIP Size – This uses the top/bottom of the indicator candle and places a TP based on the chosen Risk:Reward ratio.
ATR Trail (No set Target Profit, only uses ATR Stop)
ATR Trail-Stop (Has set Target Profit, however, stop is based on ATR inputs)
**If you choose an ATR Stop-Loss Strategy - input the desired ATR period and Multiple you would like the stop to be calculated at**
**ATR Stop-Loss Strategies have a unique alert setup for Auto-Trading. See Auto-Trading Section**
- Risk/Reward Ratio = If you have a .5 risk/reward, it means you are risking $100 to make $50.
- Additional Stop PIP Size = Number of PIPs over the default stop location of the top or bottom of the indicator candle.
----- Next, we set the Session Filter -----
Set the Timezone and Trade Session you desire. If no specific session is desired, simply set the Trade Session to 00:00 - 00:00.
----- Next, we set the Moving Average Cloud Fill -----
Enter the Fast and Slow Moving Average Length used to calculate trend direction:
MA Period Fast
MA Period Slow
These inputs will determine whether the strategy looks for Long or Short positions.
----- Next, we set the VSA – Volume Spread Analysis Settings -----
Check the box to show the indicator at the bottom of the chart if desired.
This is just a different visual output of the VSA | Volume Spread Analysis indicator available for free under the community indicators tab. You can add that indicator to your chart and see the same output in candle format.
In combination with the Moving Average Cloud, the Volume Spread Analysis will help us determine when to take a trade and in what direction.
The strategy is essentially looking for small reversals going against the overall trend and placing a trade once that reversal ends and the price moves back in the direction of the overall trend.
The 3LS Strategy utilizes confirmation between trend, volume, and price action to place high probability trades.
The VSA is completely customizable by:
Moving Average Length
MA-1 Multiplier
MA-2 Multiplier
MA-3 Multiplier
Check out the VSA | Volume Spread Analysis indicator in the community scripts section under the indicators tab to use this awesome resource on other strategies.
----- Next, we have the option to view the automated KT Bull/Bear Signals -----
Check the boxes to show the buy-sell signal on the chart if desired.
----- Next, we set the risk we want to use if Auto Trading the strategy -----
I always suggest using no more than 1-3% of your total account balance per trade. Remember, if you have multiple strategies triggering per day with each using 1%, the total percent at risk will be much larger.
For Example – if you have 10 strategies each risking 1% your total risk is 10% of your account, not 1%! Be mindful to only use 1-3% of your total account balance across all strategies, not just each individual one.
----- Finally, we backtest our ideas -----
After using the 'Strategy Tester' tab on TradingView to thoroughly backtest your predictions you are ready to take it to the next level - Automated Trading!
This was my whole reason for creating the script. If you work a full-time job, live in a time zone that is hard to trade, or just don't have the patience, this will be a game-changer for you as it was for me.
Auto-Trading
When it comes to auto-trading this strategy I have included two options in the script that utilize the alert messages generated by TradingView.
*Note: Please trade on a demo account until you feel comfortable enough to use real money, and then please stick to 1%-2% of your total account value in risk per trade.*
AutoView
PineConnector
**ATR Auto-Trading Alert Setup**
How to create alerts on 3 Line Strike Strategy
For Trailing Stops:
1) Adjust autoview/pineconnector settings
2) Click "add alert"
3) Select "Condition" = Strategy Name
4) Select "Order Fills Only" from the drop-down
3) Remove template message text from "message" box and place the exact text. '{{strategy.order.alert_message}}'
4) Click "create"
For Fixed Pip Stop:
1) Adjust autoview/pineconnector settings
2) Click "add alert"
3) Select "Condition" = Strategy Name
4) Select "alert() function calls only"
5) I like to title my Alert Name the same thing I named it as an Indicator Template to keep track
Good luck with your trading!

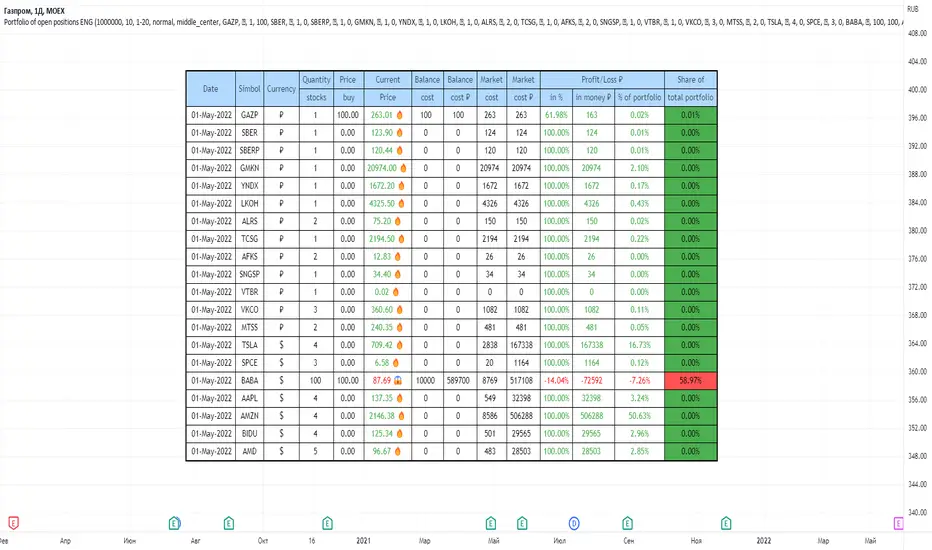
Portfolio of open positions ENGHello, I became interested in investing and trading, and there was a huge problem where and how to manage my portfolio,
I tried websites, got a spreadsheet in microsoft excel, and eventually it became possible to manage a portfolio in TradingView.
You enter data about purchases and follow the dynamics of your shares anytime, anywhere.
Added automatic transfer to one currency if the shares are traded in different currencies
The last column is how many percentages each share occupies of the total portfolio
Thanks to the TradingView team for the unique opportunity!
.b BTC-Exchange volumeBINANCE:BTCUSDT
It's tool to check exchange trading status.
You can see "BTC-exchange's realtime trading volume, previous closed volume" at once.
You can switch to see 'Previous close volume' on script's panel.
Timeframe recommended ; 15m, 1H, 4H, D, W, whatever.
Each exchange may have a different volume display unit, so I converted it into roughly BTC units. (using hl2 price)
This indicator aims to recognize the difference in the trading volume of the exchange at once.
It's not for the purpose of check the exact trading volume.
All data come from tradingview.
The comparison target exchanges refer to the ranking of CoinMarketCap.
if you have any questions freely contact to me by message on tradingview, or telegram @sr_bt
but please understand that responses may be quite late.

crypto futures hourly scalping with ma & rsi - ogcheckershi to all lovable traders,
hereby i want to share a combination of trade ideas for scalping
i've chosen hourly timeframe
indicators used: moving averages and rsi
moving averages:
ema 3, ema 5, ema 7
sma 3, sma 5, sma 7
daily_ema_3, daily_ema_5
daily_ema_5, daily_sma_5
rsi:
rsi 7, rsi 14, rsi 26
daily_rsi_7, daily_rsi_14, daily_rsi_26
as per the analysis over moving average behavioral patterns & rsi movements, useful points are given below which will be helpful while choosing good entry points & exit points,
strategical points for LONG:
* when ema3 crosses above sma3 - green candles start to form
* it's followed by ema5 > sma5 and ema7 > sma7
* when ema3 crosses down sma3 - it's considered as an indication of exit
* if rsi supports then can wait for ema5 crossing down sma5
* as similar, when daily_ema_3 crosses above daily_sma_3, its an higher timeframe bullish indication, so the lower timeframe entries inside this higher timeframe is a sure shot confident entry
* for LONG always take entries when rsi_14 < 30 or 25 else check rsi_7 < 25 or below
* as along the above, bullish CANDLE patterns like bullish engulfing , morning star is been used for entry at lower levels
* so here i've used OPEN as rsi_source in majority
* exit points also indicated at high_rsi and moving average crossunders or reverse crossovers
* for SHORTING, the above said ideas can be used in viceversa
* inputs in the indicator were tailored for users needs so that you will enjoy the magics of customization
if i am wrong in anyways regarding the above indicator strategy, please forgive me and help me improve in this aspect by commenting.
after few more studies and analysis and mainly QUERIES & COMMENTS, i'm planning to backtest these strategies here in tradingview.
also if these strategies are coded in python, we can link it to Binance Futures Algo or Bot Trading.
thankyou for this opportunity,
thanks to tradingview and pinecoders
thanks to Pranab (for 365MA)
thanks to Gandalf (for inspiring)
Special Thanks & Love to Chartbank for Everything

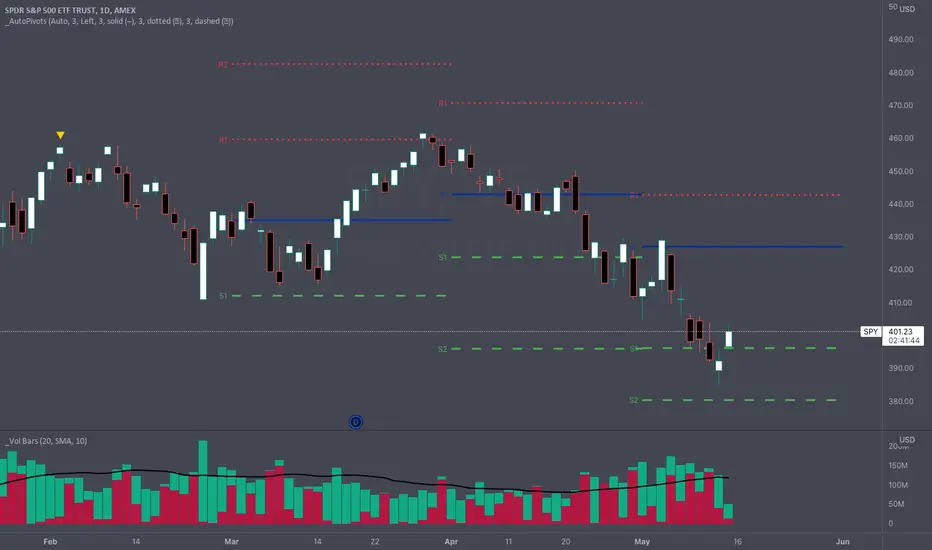
_Auto Pivot PointsOne of the main drawbacks to displaying Pivot Points on a chart is that many times the more extreme pivots (R/S3, R/S4, R/S5) aren't anywhere close to the price action during a timeframe. These extreme pivot points clutter up your chart and make it hard to use the "auto" zoom feature of TradingView.
The " _Auto Pivot Points " indicator solves these problems by automatically only displaying the pivot points if the price has crossed the pivot during the timeframe or it is the next closest pivot . For example, on monthly pivots if the price has only crossed the R1 Pivot then this indicator will display the R2 Pivot and any pivots below but it won't display the R3, R4, R5 pivots . The R3, R4, & R5 pivots are not very useful to the trader because the price hasn't even crossed the R2 Pivot . But as soon as the price crosses the R2 Pivot then this indicator will display the R3 Pivot because it is the next closest. And the same logic applies to the S Pivots .
If you need to see all the Pivots then there is a convenient toggle to display all the pivots by turning off the intelligent auto pivots . But as soon as you don't need to display all the pivots the toggle will turn on the automatic pivots .
This indicator has many style and logic options. This script allows you to control:
Number of past timeframes to display
Displaying Pivot labels
Label position (left/right)
Line color
Line width
Note: TradingView has a limit of 40 security calls per script. Due to this limitation this indicator can only display pivots a max of 7 time periods back.
Note 2: This indicator uses the Traditional pivot calculations.
+ Klinger OscillatorThis is a version of Stephen J. Klinger's, Klinger Oscillator (sometimes called Klinger Volume Oscillator). I've changed virtually nothing about the indicator itself, but added some lookback inputs for the EMAs the oscillator is derived from (traditionally 34 and 55), and added a few other things, as is my wont.
But what is the Klinger Oscillator? Essentially, the calculation looks at the high, low, and close of the current period, and compares that to the previous period's. If it is greater, it adds volume, and if it is less, it subtracts volume. It then takes an EMA of two different lookback periods of that calculation and subtracts one from the other. That's your oscillator. There is then made a signal line of the oscillator that a trader can use, in combination with the zero line, for taking trades. Investopedia has a good article on it, so if you're looking for more specifics, check there.
What I've done is add a selection of different moving averages that you may choose for the signal line. Usually it's a 13 period EMA, and that comes default, but here you could use an ALMA or HMA, or modular filter, etc. Find something that works for your style/algorithm.
Of course there are all the usual additions of mine with the various ways of coloring the indicator and candles, adjustable Donchian Bands, and alerts. A new addition that I've just added to all my indicators (oscillators, anyway) are divergences. This is more or less just a copy and paste of the divergence indicator available in TradingView. In this case you can set it to plot divergences off either the Klinger or the signal line. Depending on which one you choose you may have to adjust pivot lookbacks, and lookback range. I've kept the settings default from the RSI TradingView version.

QFL base scannerThis script is a simple implementation of a QFL (Quickfingers Luc) base scanner.
This QFL base scanner uses a different approach to some other QFL base scanners that are on TradingView. Other TradingView scripts look for a candlestick pattern of two lower lows followed by two higher lows combined with an increase in volume. This can generate some unexpected results where some minor dips can meet the pattern and are marked as a base, but some major dips do not and are ignored.
This QFL base scanner instead looks for the lowest low in a given period and marks it as a base. The longer the period of the lowest low, the more significant the bases will be. Buys are marked when the price has bounced x% above the base and then fallen y% below the base. This approach seems to give more predictable (and tradable) results.
If looking at the past script results, you may think that the script is perfectly timing entry points at the bottom of market dips. This is NOT the case. The script is actually showing buy signals when the price falls y% below the PREVIOUS base. The current base is only retrospectively marked some periods later once the reversal is confirmed. New bases are not tradeable using this script, but a percentage fall from the previous base is.
Enjoy.

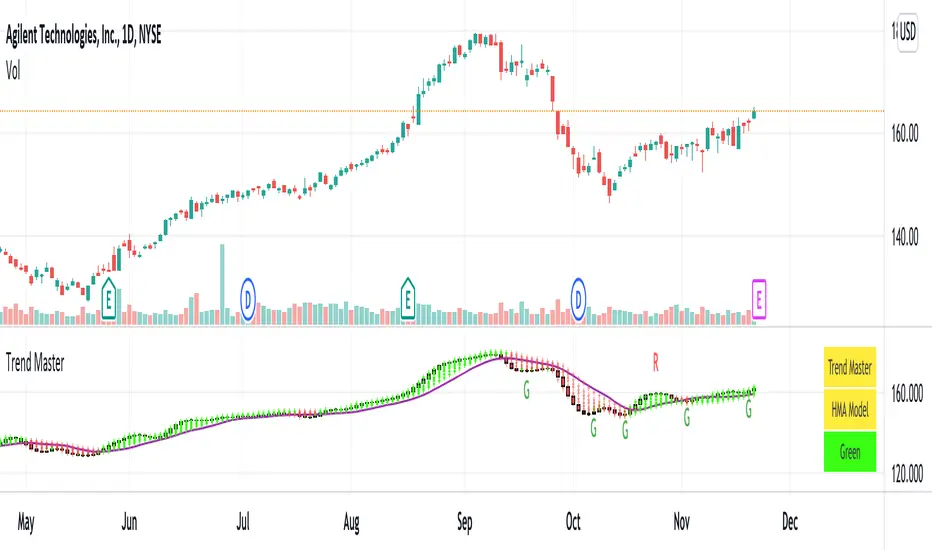
Trend MasterNotes:
Tradingview has strict house rules of not allowing Heikin Ashi charts (and others beside normal price chart) to be used together with the indicator for trend analysis.
However, there may be users already using previous version of Trend Master but unfortunately has been hidden by Tradingview.
In view of this I decided to re-post the updated version, with the use of normal price chart only. Hope this help.
1. Trend Master, an indicator for trend analysis with the use of normal price chart.
2. Trend Master candle is in the form of solid candle without upper and lower tails.
The candle is in green color during an uptrend and red color during a downtrend.
When candle changes from red color to green color, it may signify the potential change from a down trend to an uptrend, vice versa.
3. Users can select the trend analysis model as they see fit, namely EMA , SMA , WMA and HMA .
4. Moving average lines of Trend Master are also included. Default is SMA13, the rest are SMA5, SMA21.
5. Users can turn on Rainbows if needed, it may help to detect the small changes of trend, if any.
6. A table of Indicator Name, Trend Model and Trend status is included. User can turn on to see the details.
Comments are welcome to further improve the accuracy of indicator that will benefit public users. Hope this help.
Disclaimer : attached chart is for the purpose of illustrating the indicator, no recommendation on buy/sell
Kimchi Premium Indicator with Selectable SymbolsThis indicator is the Korea Premium, also known as “Kimchi Premium” indicator, which shows how expensive and cheap the bitcoin price of the bitcoin exchange in Korea as compared to the bitcoin price traded in dollars or tether. Previously, the Kimchi premium indicator in TradingView does not have the recently added Upbit BTCKRW market, and it is not possible to select markets. In addition to the recently added Upbit BTCKRW market, this indicator is convenient because you can select all markets offered by TradingView. Therefore, not only bitcoin but also altcoin kimchi premium can be plotted.
▶ Usefulness and Originality
- Users can choose from various BTCKRW and BTCUSD markets.
- Users can plot altcoin Kimchi Premium in addition to Bitcoin.
_____________________________________________________________
이 지표는 달러 혹은 테더로 거래되고 있는 비트코인 가격 대비 한국에 있는 비트코인 거래소의 비트코인 원화 가격이 얼마나 비싸고 싼 지를 나타내는 코리아 프리미엄, 일명 "김치 프리미엄" 지표입니다. 이전에 트레이딩뷰에 있는 김치 프리미엄 지표는 최근에 추가된 업비트 BTCKRW 시장이 없을 뿐만 아니라 마켓을 선택할 수가 없습니다. 이 지표는 최근에 추가된 업비트 BTCKRW 마켓과 더불어 트레이딩뷰에서 제공하는 모든 마켓을 선택할 수 있어 편리합니다. 따라서 비트코인 뿐 만 아니라 알트코인의 김치 프리미엄도 plot할 수가 있습니다.
▶ 유용성과 독창성
- 사용자가 다양한 BTCKRW 및 BTCUSD 마켓을 선택할 수 있음
- 사용자가 비트코인 외에 알트코인 김치프리미엄도 plot 할 수 있음

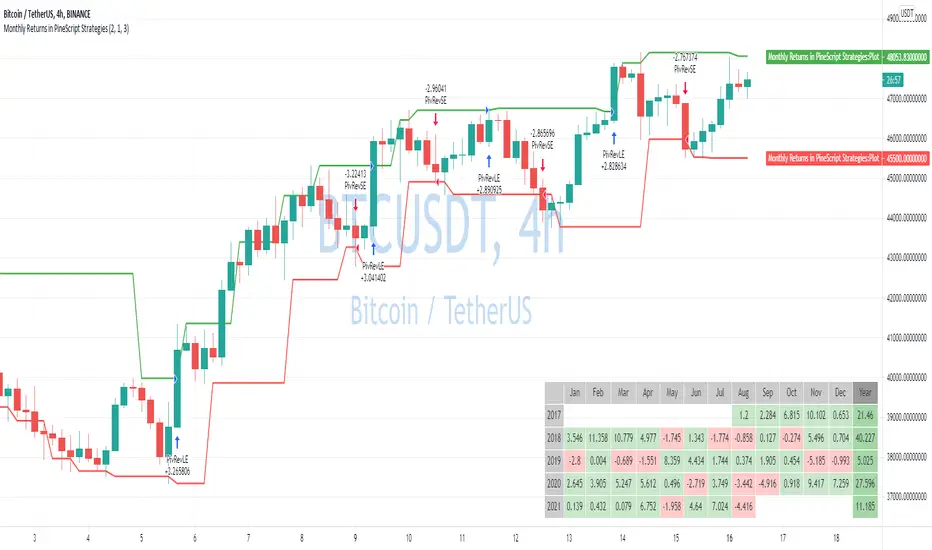
Monthly Returns in PineScript StrategiesI'm not 100% satisfied with the strategy performance output I receive from TradingView. Quite often I want to see something that is not available by default. I usually export raw trades/metrics from TradingView and then do additional analysis manually.
But with tables, you can build additional metrics and tools for your strategies quite easily.
This script will just show a table with monthly/yearly performance of your script. Quite a lot of traders/investors used to look at returns like that. Also, it might help you to identify periods of time when your strategy performed good/bad than expected and try to analyze that better.
The script is very simple and I believe you can easily apply it to your own strategies.
Disclaimer
Please remember that past performance may not be indicative of future results.
Due to various factors, including changing market conditions, the strategy may no longer perform as well as in historical backtesting.
This post and the script don’t provide any financial advice.
HYE Trend Hunter [Strategy]*** Stratejinin Türkçe ve İngilizce açıklaması aşağıya eklenmiştir.
HYE Trend Hunter
In this strategy, two of the most basic data (price and volume) necessary for detecting trends as early as possible and entering the trade on time are used. In this context, the approaches of some classical and new generation indicators using price and volume have been taken into account.
The strategy is prepared to generate buy signals only. The following steps were followed to generate the buy and exit signals.
1-) First of all, the two most basic data of the strategy, “slow leading line” and “fast leading line” need to be calculated. For this, we use the formula of the “senkou span A” line of the indicator known as the Ichimoku Cloud. We also need to calculate lines known as tenkan sen and kijun sen in ichimoku because they are used in the calculation of this formula.
The high and low values of the candles are taken into account when calculating the Tenkansen, Kijunsen and Senkou Span A lines in the Ichimoku cloud. In this strategy, the highest and lowest values of the periodic VWAP are taken into account when calculating the "slow leading line" and "fast leading line". (The periodic vwap formula was coded and made available by @neolao on tradingviev). Also, in the ichimoku cloud, while the Senkou Span A line is plotted 26 periods into the future, we consider the values of the fast and slow leading lines in the last candle in this strategy.
ORIGINAL ICHIMOKU SPAN A FORMULA
Tenkansen = (Highest high of the last 9 candles + Lowest low of the last 9 candles) / 2
Kijunsen = (Highest high of the last 26 candles + Lowest low of the last 26 candles) / 2
Senkou Span A = Tenkansen + Kijunsen / 2
HYE TREND HUNTER SPAN A FORMULA*
Tenkansen = (Highest VWAP of the last 9 candles + Lowest VWAP of the last 9 candles) / 2
Kijunsen = (Highest VWAP of the last 26 candles + Lowest VWAP of the last 26 candles) / 2
Senkou Span A = Tenkansen + Kijunsen / 2
* We use the original ichimoku values 9 and 26 for the slow line, and 5 and 13 for the fast line. These settings can be changed from the strategy settings.
2-) At this stage, we have 2 lines that we obtained by using the formula of the ichimoku cloud, one of the most classical trend indicators, and by including the volume-weighted average price.
a-) Fast Leading Line (5-13)
b-) Slow Leading Line (9-26)
For the calculation we will do soon, we get a new value by taking the average of these two lines. Using this value, which is the average of the fast and slow leading lines, we plot the Bollinger Bands indicator, which is known as one of the most classic volatility indicators of technical analysis. Thus, we are trying to understand whether there is a volatility change in the market, which may mean the presence of a trend start. We will use this data in the calculation of buy-sell signals.
In the classical Bollinger Bands calculation, the standard deviation is calculated by applying a multiplier at the rate determined by the user (2 is used in the original settings) to the moving average calculated with the “closing price”, and this value is added or subtracted from the moving average and upper band and lower band lines are drawn.
In the HYE Trend Hunter Strategy, instead of the moving average calculated with the closing price in the Bollinger Band calculation, we consider the average of the fast and slow leading lines calculated in the 1st step and draw the Bollinger upper and lower bands accordingly. We use the values of 2 and 20 as the standard deviation and period, as in the original settings. These settings can also be changed from the strategy settings.
3-) At this stage, we have fast and slow leading lines trying to understand the trend direction using VWAP, and Bollinger lower and upper bands calculated by the average of these lines.
In this step, we will use another tool that will help us understand whether the invested market (forex, crypto, stocks) is gaining momentum in volume. The Time Segmented Volume indicator was created by the Worden Brothers Inc. and coded by @liw0 and @vitelot on tradingview. The TSV indicator segments the price and volume of an investment instrument according to certain time periods and makes calculations on comparing these price and volume data to reveal the buying and selling periods.
To trade in the buy direction on the HYE Trend Hunter Strategy, we look for the TSV indicator to be above 0 and above its exponential moving average value. TSV period and exponential moving average period settings (13 and 7) can also be changed in the strategy settings.
BUY SIGNAL
1-) Fast Leading Line value should be higher than the Fast Leading Line value in the previous candle.
2-) Slow Leading Line value should be higher than the Slow Leading Line value in the previous candle.
3-) Candle Closing value must be higher than the Upper Bollinger Band.
4-) TSV value must be greater than 0.
5-) TSV value must be greater than TSVEMA value.
EXIT SIGNAL
1-) Fast Leading Line value should be lower than the Fast Leading Line value in the previous candle.
2-) Slow Leading Line value should be lower than the Slow Leading Line value in the previous candle.
TIPS AND WARNINGS
1-) The standard settings of the strategy work better in higher timeframes (4-hour, daily, etc.). For lower timeframes, you should change the strategy settings and find the best value for yourself.
2-) All lines (fast and slow leading lines and Bollinger bands) except TSV are displayed on the strategy. For a simpler view, you can hide these lines in the strategy settings.
3-) You can see the color changes of the fast and slow leading lines as well as you can specify a single color for these lines in the strategy settings.
4-) It is an strategy for educational and experimental purposes. It cannot be considered as investment advice. You should be careful and make your own risk assessment when opening real market trades using this strategy.
_______________________________________________
HYE Trend Avcısı
Bu stratejide, trendlerin olabildiğince erken tespit edilebilmesi ve zamanında işleme girilebilmesi için gerekli olan en temel iki veriden (fiyat ve hacim) yararlanılmaktadır. Bu kapsamda, fiyat ve hacim kullanan bazı klasik ve yeni nesil indikatörlerin yaklaşımları dikkate alınmıştır.
Strateji yalnızca alış yönlü sinyaller üretecek şekilde hazırlanmıştır. Alış ve çıkış sinyallerinin üretilmesi için aşağıdaki adımlar izlenmiştir.
1-) Öncelikle, stratejinin en temel iki verisi olan “yavaş öncü çizgi” ve “hızlı öncü çizgi” hesaplamasının yapılması gerekiyor. Bunun için de Ichimoku Bulutu olarak bilinen indikatörün “senkou span A” çizgisinin formülünü kullanıyoruz. Bu formülün hesaplamasında kullanılmaları nedeniyle ichimoku’da tenkan sen ve kijun sen olarak bilinen çizgileri de hesaplamamız gerekiyor.
Ichimoku bulutunda Tenkansen, Kijunsen ve Senkou Span A çizgileri hesaplanırken mumların yüksek ve düşük değerleri dikkate alınıyor. Bu stratejide ise “yavaş öncü çizgi” ve “hızlı öncü çizgi” hesaplanırken periyodik VWAP’ın en yüksek ve en düşük değerleri dikkate alınıyor. (Periyodik vwap formülü, tradingviev’de @neolao tarafından kodlanmış ve kullanıma açılmış). Ayrıca, ichimoku bulutunda Senkou Span A çizgisi geleceğe yönelik çizilirken (26 mum ileriye dönük) biz bu stratejide öncü çizgilerin son mumdaki değerlerini dikkate alıyoruz.
ORJİNAL ICHIMOKU SPAN A FORMÜLÜ
Tenkansen = (Son 9 mumun en yüksek değeri + Son 9 mumun en düşük değeri) / 2
Kijunsen = (Son 26 mumun en yüksek değeri + Son 26 mumun en düşük değeri) / 2
Senkou Span A = Tenkansen + Kijunsen / 2
HYE TREND HUNTER SPAN A FORMÜLÜ*
Tenkansen = (Son 9 mumun en yüksek VWAP değeri + Son 9 mumun en düşük VWAP değeri) / 2
Kijunsen = (Son 26 mumun en yüksek VWAP değeri + Son 26 mumun en düşük VWAP değeri) / 2
Senkou Span A = Tenkansen + Kijunsen / 2
* Yavaş çizgi için orijinal ichimoku değerleri olan 9 ve 26’yı kullanırken, hızlı çizgi için 5 ve 13’ü kullanıyoruz. Bu ayarlar, strateji ayarlarından değiştirilebiliyor.
2-) Bu aşamada, elimizde en klasik trend indikatörlerinden birisi olan ichimoku bulutunun formülünden faydalanarak, işin içinde hacim ağırlıklı ortalama fiyatı da sokmak suretiyle elde ettiğimiz 2 çizgimiz var.
a-) Hızlı Öncü Çizgi (5-13)
b-) Yavaş Öncü Çizgi (9-26)
Birazdan yapacağımız hesaplama için bu iki çizginin de ortalamasını alarak yeni bir değer elde ediyoruz. Hızlı ve yavaş öncü çizgilerin ortalaması olan bu değeri kullanarak, teknik analizin en klasik volatilite indikatörlerinden birisi olarak bilinen Bollinger Bantları indikatörünü çizdiriyoruz. Böylelikle piyasada bir trend başlangıcının varlığı anlamına gelebilecek volatilite değişikliği var mı yok mu anlamaya çalışıyoruz. Bu veriyi al-sat sinyallerinin hesaplamasında kullanacağız.
Klasik Bollinger Bantları hesaplamasında, “kapanış fiyatıyla” hesaplanan hareketli ortalamaya, kullanıcı olarak belirlenen oranda (orijinal ayarlarında 2 kullanılır) bir çarpan uygulanarak standart sapma hesaplanıyor ve bu değer hareketli ortalamaya eklenip çıkartılarak üst bant ve alt bant çizgileri çiziliyor.
HYE Trend Avcısı stratejisinde, Bollinger Bandı hesaplamasında kapanış fiyatıyla hesaplanan hareketli ortalama yerine, 1. adımda hesapladığımız hızlı ve yavaş öncü çizgilerin ortalamasını dikkate alıyoruz ve buna göre bollinger üst ve alt bantlarını çizdiriyoruz. Standart sapma ve periyot olarak yine orijinal ayarlarında olduğu gibi 2 ve 20 değerlerini kullanıyoruz. Bu ayarlar da strateji ayarlarından değiştirilebiliyor.
3-) Bu aşamada, elimizde VWAP kullanarak trend yönünü anlamaya çalışan hızlı ve yavaş öncü çizgilerimiz ile bu çizgilerin ortalaması ile hesaplanan bollinger alt ve üst bantlarımız var.
Bu adımda, yatırım yapılan piyasanın (forex, kripto, hisse senedi) hacimsel olarak ivme kazanıp kazanmadığını anlamamıza yarayacak bir araç daha kullanacağız. Time Segmented Volume indikatörü, Worden Kardeşler şirketi tarafından oluşturulmuş ve tradingview’de @liw0 ve @vitelot tarafından kodlanarak kullanıma açılmış. TSV indikatörü, bir yatırım aracının fiyatını ve hacmini belirli zaman aralıklarına göre bölümlere ayırarak, bu fiyat ve hacim verilerini, alış ve satış dönemlerini ortaya çıkarmak için karşılaştırmak üzerine hesaplamalar yapar.
HYE Trend Avcısı stratejisinde alış yönünde işlem yapmak için, TSV indikatörünün 0’ın üzerinde olmasını ve kendi üstel hareketli ortalama değerinin üzerinde olmasını arıyoruz. TSV periyodu ve üstel hareketli ortalama periyodu ayarları da (13 ve 7) strateji ayarlarından değiştirilebiliyor.
ALIŞ SİNYALİ
1-) Hızlı Öncü Çizgi değeri bir önceki mumdaki Hızlı Öncü Çizgi değerinden yüksek olmalı.
2-) Yavaş Öncü Çizgi değeri bir önceki mumdaki Yavaş Öncü Çizgi değerinden yüksek olmalı.
3-) Kapanış Değeri, Üst Bollinger Bandı değerinden yüksek olmalı.
4-) TSV değeri 0’dan büyük olmalı.
5-) TSV değeri TSVEMA değerinden büyük olmalı.
ÇIKIŞ SİNYALİ
1-) Hızlı Öncü Çizgi değeri bir önceki mumdaki Hızlı Öncü Çizgi değerinden düşük olmalı.
2-) Yavaş Öncü Çizgi değeri bir önceki mumdaki Yavaş Öncü Çizgi değerinden düşük olmalı.
İPUÇLARI VE UYARILAR
1-) Stratejinin standart ayarları, yüksek zaman dilimlerinde (4 saatlik, günlük vs.) daha iyi çalışıyor. Düşük zaman dilimleri için strateji ayarlarını değiştirmeli ve kendiniz için en iyi değeri bulmalısınız.
2-) Stratejide tüm çizgiler (hızlı ve yavaş öncü çizgiler ile bollinger bantları) -TSV dışında- açık olarak gelmektedir. Daha sade bir görüntü için bu çizgilerin görünürlüğünü strateji ayarlarından gizleyebilirsiniz.
3-) Hızlı ve yavaş öncü çizgilerin renk değişimlerini görebileceğiniz gibi bu çizgiler için tek bir renk olarak da strateji ayarlarında belirleme yapabilirsiniz.
4-) Eğitim ve deneysel amaçlı bir stratejidir. Yatırım tavsiyesi olarak değerlendirilemez. Bu stratejiyi kullanarak gerçek piyasa işlem açarken dikkatli olmalı ve kendi risk değerlendirmenizi yapmalısınız.

HYE Trend Hunter [Indicator]*** İndikatörün Türkçe ve İngilizce açıklaması aşağıya eklenmiştir.
HYE Trend Hunter
In this indicator, two of the most basic data (price and volume) necessary for detecting trends as early as possible and entering the trade on time are used. In this context, the approaches of some classical and new generation indicators using price and volume have been taken into account.
The indicator is prepared to generate buy signals only. The following steps were followed to generate the buy and exit signals.
1-) First of all, the two most basic data of the indicator, “slow leading line” and “fast leading line” need to be calculated. For this, we use the formula of the “senkou span A” line of the indicator known as the Ichimoku Cloud. We also need to calculate lines known as tenkan sen and kijun sen in ichimoku because they are used in the calculation of this formula.
The high and low values of the candles are taken into account when calculating the Tenkansen, Kijunsen and Senkou Span A lines in the Ichimoku cloud. In this indicator, the highest and lowest values of the periodic VWAP are taken into account when calculating the "slow leading line" and "fast leading line". (The periodic vwap formula was coded and made available by @neolao on tradingviev). Also, in the ichimoku cloud, while the Senkou Span A line is plotted 26 periods into the future, we consider the values of the fast and slow leading lines in the last candle in this indicator.
ORIGINAL ICHIMOKU SPAN A FORMULA
Tenkansen = (Highest high of the last 9 candles + Lowest low of the last 9 candles) / 2
Kijunsen = (Highest high of the last 26 candles + Lowest low of the last 26 candles) / 2
Senkou Span A = Tenkansen + Kijunsen / 2
HYE TREND HUNTER SPAN A FORMULA*
Tenkansen = (Highest VWAP of the last 9 candles + Lowest VWAP of the last 9 candles) / 2
Kijunsen = (Highest VWAP of the last 26 candles + Lowest VWAP of the last 26 candles) / 2
Senkou Span A = Tenkansen + Kijunsen / 2
* We use the original ichimoku values 9 and 26 for the slow line, and 5 and 13 for the fast line. These settings can be changed from the indicator settings.
2-) At this stage, we have 2 lines that we obtained by using the formula of the ichimoku cloud, one of the most classical trend indicators, and by including the volume-weighted average price.
a-) Fast Leading Line (5-13)
b-) Slow Leading Line (9-26)
For the calculation we will do soon, we get a new value by taking the average of these two lines. Using this value, which is the average of the fast and slow leading lines, we plot the Bollinger Bands indicator, which is known as one of the most classic volatility indicators of technical analysis. Thus, we are trying to understand whether there is a volatility change in the market, which may mean the presence of a trend start. We will use this data in the calculation of buy-sell signals.
In the classical Bollinger Bands calculation, the standard deviation is calculated by applying a multiplier at the rate determined by the user (2 is used in the original settings) to the moving average calculated with the “closing price”, and this value is added or subtracted from the moving average and upper band and lower band lines are drawn.
In the HYE Trend Hunter indicator, instead of the moving average calculated with the closing price in the Bollinger Band calculation, we consider the average of the fast and slow leading lines calculated in the 1st step and draw the Bollinger upper and lower bands accordingly. We use the values of 2 and 20 as the standard deviation and period, as in the original settings. These settings can also be changed from the indicator settings.
3-) At this stage, we have fast and slow leading lines trying to understand the trend direction using VWAP, and Bollinger lower and upper bands calculated by the average of these lines.
In this step, we will use another tool that will help us understand whether the invested market (forex, crypto, stocks) is gaining momentum in volume. The Time Segmented Volume indicator was created by the Worden Brothers Inc. and coded by @liw0 and @vitelot on tradingview. The TSV indicator segments the price and volume of an investment instrument according to certain time periods and makes calculations on comparing these price and volume data to reveal the buying and selling periods.
To trade in the buy direction on the HYE Trend Hunter indicator, we look for the TSV indicator to be above 0 and above its exponential moving average value. TSV period and exponential moving average period settings (13 and 7) can also be changed in the indicator settings.
BUY SIGNAL
1-) Fast Leading Line value should be higher than the Fast Leading Line value in the previous candle.
2-) Slow Leading Line value should be higher than the Slow Leading Line value in the previous candle.
3-) Candle Closing value must be higher than the Upper Bollinger Band.
4-) TSV value must be greater than 0.
5-) TSV value must be greater than TSVEMA value.
EXIT SIGNAL
1-) Fast Leading Line value should be lower than the Fast Leading Line value in the previous candle.
2-) Slow Leading Line value should be lower than the Slow Leading Line value in the previous candle.
TIPS AND WARNINGS
1-) The standard settings of the indicator work better in higher timeframes (4-hour, daily, etc.). For lower timeframes, you should change the indicator settings and find the best value for yourself.
2-) All lines (fast and slow leading lines and Bollinger bands) except TSV are displayed on the indicator. For a simpler view, you can hide these lines in the indicator settings.
3-) You can see the color changes of the fast and slow leading lines as well as you can specify a single color for these lines in the Indicator settings.
4-) Alarms have been added for Buy and Exit. When setting up the alarm, you should set it to be triggered at "every bar close". Otherwise it may repaint. There is no repaint after the candle closes.
5-) It is an indicator for educational and experimental purposes. It cannot be considered as investment advice. You should be careful and make your own risk assessment when opening real market trades using this indicator.
_______________________________________________
HYE Trend Avcısı
Bu indikatörde, trendlerin olabildiğince erken tespit edilebilmesi ve zamanında işleme girilebilmesi için gerekli olan en temel iki veriden (fiyat ve hacim) yararlanılmaktadır. Bu kapsamda, fiyat ve hacim kullanan bazı klasik ve yeni nesil indikatörlerin yaklaşımları dikkate alınmıştır.
İndikatör yalnızca alış yönlü sinyaller üretecek şekilde hazırlanmıştır. Alış ve çıkış sinyallerinin üretilmesi için aşağıdaki adımlar izlenmiştir.
1-) Öncelikle, indikatörün en temel iki verisi olan “yavaş öncü çizgi” ve “hızlı öncü çizgi” hesaplamasının yapılması gerekiyor. Bunun için de Ichimoku Bulutu olarak bilinen indikatörün “senkou span A” çizgisinin formülünü kullanıyoruz. Bu formülün hesaplamasında kullanılmaları nedeniyle ichimoku’da tenkan sen ve kijun sen olarak bilinen çizgileri de hesaplamamız gerekiyor.
Ichimoku bulutunda Tenkansen, Kijunsen ve Senkou Span A çizgileri hesaplanırken mumların yüksek ve düşük değerleri dikkate alınıyor. Bu indikatörde ise “yavaş öncü çizgi” ve “hızlı öncü çizgi” hesaplanırken periyodik VWAP’ın en yüksek ve en düşük değerleri dikkate alınıyor. (Periyodik vwap formülü, tradingviev’de @neolao tarafından kodlanmış ve kullanıma açılmış). Ayrıca, ichimoku bulutunda Senkou Span A çizgisi geleceğe yönelik çizilirken (26 mum ileriye dönük) biz bu indikatörde öncü çizgilerin son mumdaki değerlerini dikkate alıyoruz.
ORJİNAL ICHIMOKU SPAN A FORMÜLÜ
Tenkansen = (Son 9 mumun en yüksek değeri + Son 9 mumun en düşük değeri) / 2
Kijunsen = (Son 26 mumun en yüksek değeri + Son 26 mumun en düşük değeri) / 2
Senkou Span A = Tenkansen + Kijunsen / 2
HYE TREND HUNTER SPAN A FORMÜLÜ*
Tenkansen = (Son 9 mumun en yüksek VWAP değeri + Son 9 mumun en düşük VWAP değeri) / 2
Kijunsen = (Son 26 mumun en yüksek VWAP değeri + Son 26 mumun en düşük VWAP değeri) / 2
Senkou Span A = Tenkansen + Kijunsen / 2
* Yavaş çizgi için orijinal ichimoku değerleri olan 9 ve 26’yı kullanırken, hızlı çizgi için 5 ve 13’ü kullanıyoruz. Bu ayarlar, indikatör ayarlarından değiştirilebiliyor.
2-) Bu aşamada, elimizde en klasik trend indikatörlerinden birisi olan ichimoku bulutunun formülünden faydalanarak, işin içinde hacim ağırlıklı ortalama fiyatı da sokmak suretiyle elde ettiğimiz 2 çizgimiz var.
a-) Hızlı Öncü Çizgi (5-13)
b-) Yavaş Öncü Çizgi (9-26)
Birazdan yapacağımız hesaplama için bu iki çizginin de ortalamasını alarak yeni bir değer elde ediyoruz. Hızlı ve yavaş öncü çizgilerin ortalaması olan bu değeri kullanarak, teknik analizin en klasik volatilite indikatörlerinden birisi olarak bilinen Bollinger Bantları indikatörünü çizdiriyoruz. Böylelikle piyasada bir trend başlangıcının varlığı anlamına gelebilecek volatilite değişikliği var mı yok mu anlamaya çalışıyoruz. Bu veriyi al-sat sinyallerinin hesaplamasında kullanacağız.
Klasik Bollinger Bantları hesaplamasında, “kapanış fiyatıyla” hesaplanan hareketli ortalamaya, kullanıcı olarak belirlenen oranda (orijinal ayarlarında 2 kullanılır) bir çarpan uygulanarak standart sapma hesaplanıyor ve bu değer hareketli ortalamaya eklenip çıkartılarak üst bant ve alt bant çizgileri çiziliyor.
HYE Trend Avcısı indikatöründe, Bollinger Bandı hesaplamasında kapanış fiyatıyla hesaplanan hareketli ortalama yerine, 1. adımda hesapladığımız hızlı ve yavaş öncü çizgilerin ortalamasını dikkate alıyoruz ve buna göre bollinger üst ve alt bantlarını çizdiriyoruz. Standart sapma ve periyot olarak yine orijinal ayarlarında olduğu gibi 2 ve 20 değerlerini kullanıyoruz. Bu ayarlar da indikatör ayarlarından değiştirilebiliyor.
3-) Bu aşamada, elimizde VWAP kullanarak trend yönünü anlamaya çalışan hızlı ve yavaş öncü çizgilerimiz ile bu çizgilerin ortalaması ile hesaplanan bollinger alt ve üst bantlarımız var.
Bu adımda, yatırım yapılan piyasanın (forex, kripto, hisse senedi) hacimsel olarak ivme kazanıp kazanmadığını anlamamıza yarayacak bir araç daha kullanacağız. Time Segmented Volume indikatörü, Worden Kardeşler şirketi tarafından oluşturulmuş ve tradingview’de @liw0 ve @vitelot tarafından kodlanarak kullanıma açılmış. TSV indikatörü, bir yatırım aracının fiyatını ve hacmini belirli zaman aralıklarına göre bölümlere ayırarak, bu fiyat ve hacim verilerini, alış ve satış dönemlerini ortaya çıkarmak için karşılaştırmak üzerine hesaplamalar yapar.
HYE Trend Avcısı indikatöründe alış yönünde işlem yapmak için, TSV indikatörünün 0’ın üzerinde olmasını ve kendi üstel hareketli ortalama değerinin üzerinde olmasını arıyoruz. TSV periyodu ve üstel hareketli ortalama periyodu ayarları da (13 ve 7) indikatör ayarlarından değiştirilebiliyor.
ALIŞ SİNYALİ
1-) Hızlı Öncü Çizgi değeri bir önceki mumdaki Hızlı Öncü Çizgi değerinden yüksek olmalı.
2-) Yavaş Öncü Çizgi değeri bir önceki mumdaki Yavaş Öncü Çizgi değerinden yüksek olmalı.
3-) Kapanış Değeri, Üst Bollinger Bandı değerinden yüksek olmalı.
4-) TSV değeri 0’dan büyük olmalı.
5-) TSV değeri TSVEMA değerinden büyük olmalı.
ÇIKIŞ SİNYALİ
1-) Hızlı Öncü Çizgi değeri bir önceki mumdaki Hızlı Öncü Çizgi değerinden düşük olmalı.
2-) Yavaş Öncü Çizgi değeri bir önceki mumdaki Yavaş Öncü Çizgi değerinden düşük olmalı.
İPUÇLARI VE UYARILAR
1-) İndikatörün standart ayarları, yüksek zaman dilimlerinde (4 saatlik, günlük vs.) daha iyi çalışıyor. Düşük zaman dilimleri için indikatör ayarlarını değiştirmeli ve kendiniz için en iyi değeri bulmalısınız.
2-) İndikatörde tüm çizgiler (hızlı ve yavaş öncü çizgiler ile bollinger bantları) -TSV dışında- açık olarak gelmektedir. Daha sade bir görüntü için bu çizgilerin görünürlüğünü indikatör ayarlarından gizleyebilirsiniz.
3-) Hızlı ve yavaş öncü çizgilerin renk değişimlerini görebileceğiniz gibi bu çizgiler için tek bir renk olarak da İndikatör ayarlarında belirleme yapabilirsiniz.
4-) Alış ve Çıkış için alarmlar eklenmiştir. Alarm kurulumu yaparken “Her çubuk kapanışında” tetiklenecek şekilde ayarlama yapmalısınız. Aksi takdirde repaint yapabilir. Mum kapanışından sonra repaint söz konusu değildir.
5-) Eğitim ve deneysel amaçlı bir indikatördür. Yatırım tavsiyesi olarak değerlendirilemez. Bu indikatörü kullanarak gerçek piyasa işlem açarken dikkatli olmalı ve kendi risk değerlendirmenizi yapmalısınız.

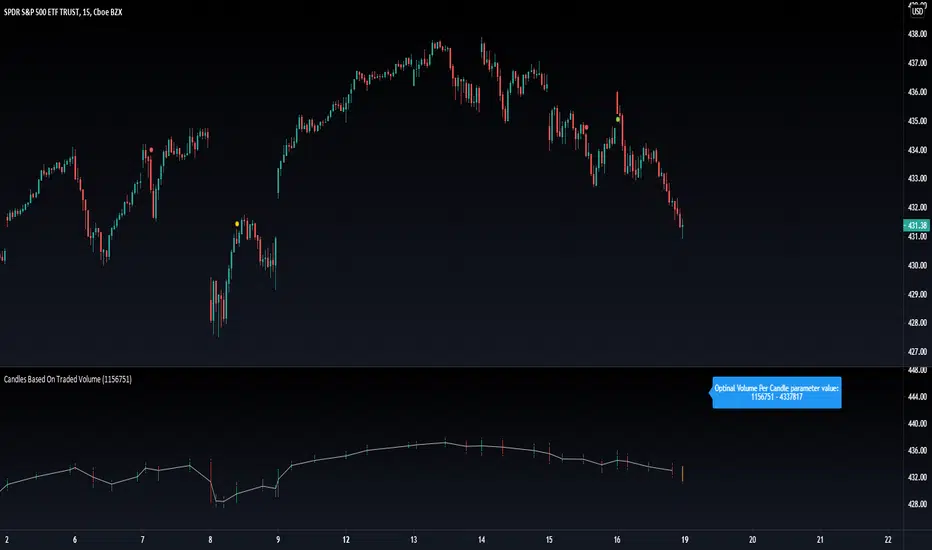
Candles Based On Traded VolumeCBTV - Candlesticks Based on Traded Volume
This is the first robust implementation of volume based candlesticks (bars) on TradingView. This type of bar was describe in the book "Advances in Financial Machine Learning," written by Lopez de Prado, a well-known quant who has managed billions of dollars over the course of his career.
Volume Candlesticks (Bars) are bars that are indexed by total volume, with each set of N shares exchanged forming a separate bar.
This means that on CBTV chart a candle forms not after a specific time interval defined by the time frame of the chart, but when a determined volume was traded.
This approach to price sampling is much better than the time based one, because it does not oversample periods where nothing happens. Traditional candlestick charts show a lot of low volume bars without meaningful price changes in them.
The efficient price sampling results in better results when using volume based bars in machine learning forecasting models. They are also useful for technical analysis. Candlestick patterns on CBTV chart are more pronounced and have more predictive power.
Volume based bars can be constructed only for instruments where volume data is available. These are stocks, futures and crypto currencies.
When you run CBTV it appears in a separate window below the traditional time based chart.
CBTV will be used in pair with a helper indicator which is called Optimal Volume per Candle (OVPC).
When applied to a chart OVPC shows the optimal range for volume per candle to construct volume based candlesticks from this timeframe data. It appears in the blue box above the most recent candle of a standard time based chart.
When you set a Volume Per Candle parameter in CBTV make sure it is within the range that shows OVPC. In this case volume based chart will be easy to read and all the calculations will be performed with the high level of precision.
The most recent unfinished candle is marked with the different set of colors than historical candles. Unfinished candle is colored in orange if it is a falling candle, blue it it is a rising one.
If you leave the CBTV chart opened for a long time you can have multiple blue or orange candles on it. In this case press the “hide” icon with the eye sign twice (it’s on the left side of the indicator panel next to its input parameters). This will refresh the CBTV and remove the artifacts.
While everything comes Real-time you will see the orange or blue bars form but never update. All you need to do is REFRESH THE CHART. Hoping soon to update this with a version you wont have to refresh the chart.
Please drop a like and comment what you guys think and once again thank you Tradingview for such a great platform :)
[blackcat] L1 Tim Tillson IE/2Level: 1
Background
Before this script, I cannot find a IE/2 moving average script in tradingview. Although it is not so complex, it is meaningful to be the 1st Tim Tilson IE/2 script in tradingview community. IE/2 moving average was disclosed in "Smoothin Techniques For More Accurate Signals", Tim Tilson, S&C Magazine, Traders Tips, 01/1998.
Function
IE/2 is one of pre-studies created while T3 famous average was developing. It is calculated as (ILRS(n)+EPMA(n))/2. ILRS, is an integral of linear regression slope. In this moving average, the slope of a linear regression line is simply integrated as it is fitted in a moving window of length n across the data. The derivative of ILRS is the linear regression slope.EPMA is an end point moving average - it is the endpoint of the linear regression line of length n as it is fitted across the data. EPMA hugs the data more closely than a simple or exponential moving average of the same length.
The most popular method of interpreting a moving average is to compare the relationship between a moving average of the security's price with the security's price itself (or between several moving averages).
Inputs
Price --> price data to use
Period --> number of bars to use in calculation
Key Signal
Price --> Price Input.
IE/2 --> IE/2 Ouput.
Remarks
This is a Level 1 free and open source indicator.
Feedbacks are appreciated.

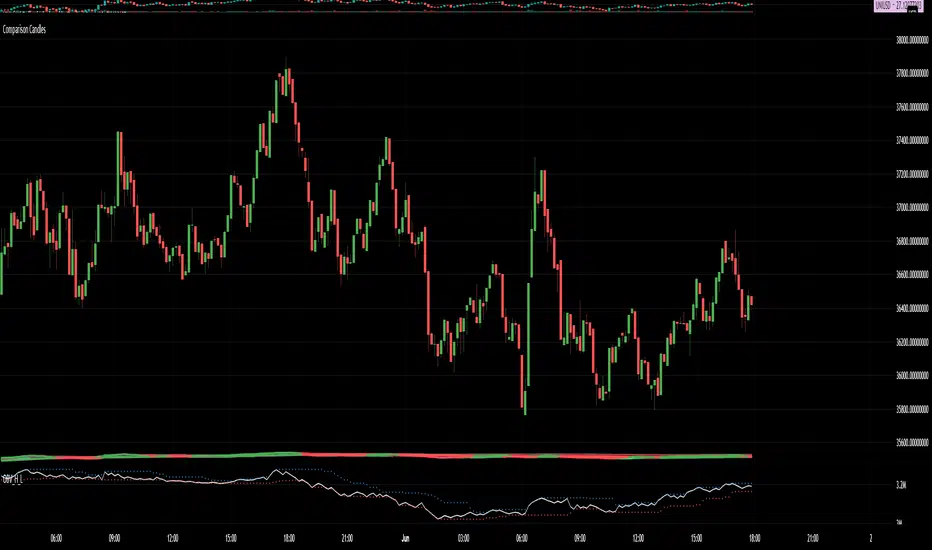
Comparison CandlesPretty simple. Pick a security and it plots candlesticks to compare it to the current chart.
So if looking at CAKEBTC and comparing to UNIBTC, you get CAKEUNI.
Beats the hell out of plotting multiple plots and trying to compare them. No longer is your scale based on where your zoom starts.
Also allows you to draw oscillators from the plots.
Shown is my Uber RSI plotted on the comparison candles close on CAKEUNI (binance both).
No longer struggle to chart against messed up uniswap charts because your exchange of choice isn't listed on tradingview.
No longer struggle to chart ethereum pairs that don't exist on any of the exchanges supported officially by Tradingview charting.
"You just win."
Strategy - DMI Indicator with DPO Indicator as a GuardThe Directional Movement Index Indicator is one of my favorite indicators in tradingview's built-in library. It is free to use for all
For more information on what the DMI is, please visit: www.tradingview.com
The only problem I've come across with the DMI is that when it hits a 'trade range zone' it triggers false new trends (this is the case with almost every indicator I've ever tested).
This script modifies the DMI by removing the need for the ADX logic. It only focuses on the +DI and the -DI.
In order to remove the 'noise' generated during a trade range zone I have added another powerful indicator called the Detrended Price Oscillator.
The DPO is also a 'built-in' indicator on tradingview. www.tradingview.com
The DPO is used in conjunction with the DMI to stop trade ranges from wrecking your profits.
This strategy logic simply checks for the DMI indicator to cross itself. If the +DI crosses over the -DI this is a bullish cross and visa versa, if the -DI crosses over the +DI then it could mean bearish sentiment is building.
But then strategy logic uses the DPO to check if the DPO is above 0 or below 0 value
If the +DI crosses over the -DI and the DPO is above 0 value, then it's a Long entry point.
However, if the +DI crosses over the -DI and the DPO is below 0 value, then the Long signal is void.
And visa versa, if the -DI crosses over the +DI and the DPO is below 0 value, then it's a Short entry point (unless the DPO is greater than 0)
With this DPO 'guard' in place, it helps us keep the total trades executed to a minimum.
This is vital to push through trade ranges that can wreck your profit potential.
I wish I could create a better plotting mechanism for this indicator so you can better see the visuals. But combining the DMI to scale with the DPO is not possible.
The best solution is to simply add another DMI indicator to your chart so you can compare the DMI to this script that is dominated by the DPO (yellow line).
Enjoy! Likes are much appreciated!

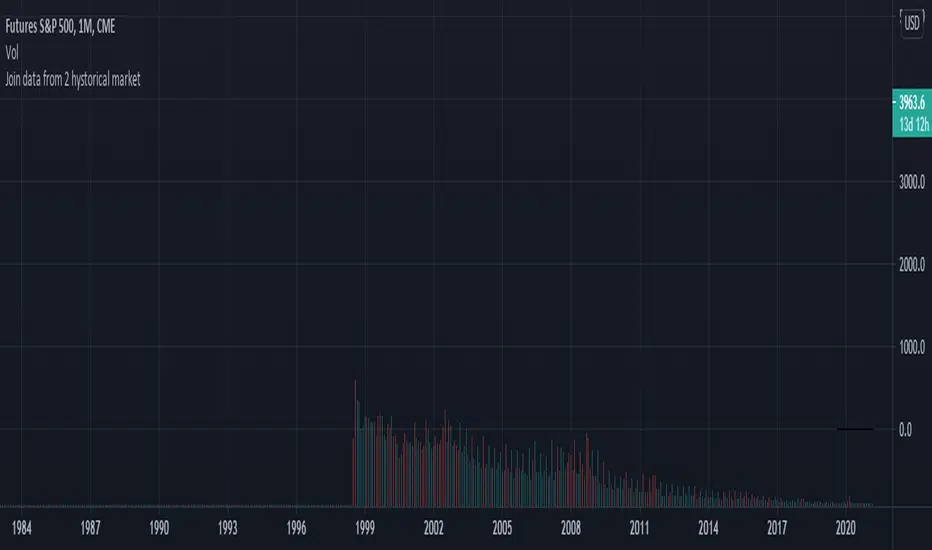
Join data and union of 2 hystorical markets
How to create a union from two contiguous Tradingview tickers (series)
Francesco Marzolo March 18, 2021
Go to the older ticker of the two, for example CME: SP1! and open it on Tradingview.
On the graph thus created, add this script.
In the indicator settings select the same ticker as the chart in Symbol1
while in Symbol2 the ticker from which to retrieve the most recent data, for example: SPX500
The operation this script does is examine each bar of the two tickers, where there is a value for the second it holds this one, where it does not exist in second ticker it keeps the value of the first one. This new series is called Merge. So now in the chart there will be 4 series:
- that of the original chart without script
- the same series loaded via script (Symbol1)
- series 2 of "new" data (Symbol2)
- the Merge series that "prefers" the Symbol2 data if present, otherwise it shows Symbol1
So now you have to change the visibility of the 4 series to see the differences:
- turn off the visibility of the chart indicator
- turn off the Symbol1 series in the script properties (old data only)
- switch off the Symbol2 series as well (only new data)
- switch on the Merge series (new data if existing, old if not present in the new ticker)
Let it snow... [QuantNomad]It's almost the end of 2020. If you don't have any snow outside but still you want some Christmas mood - feel free to use my indicator.
TradingView added a possibility to use up to 500 labels, so I decided to create something fun and completely useless.
Snowflakes suppose to fall nicely, but labels are not regularly updated by TradingView. If you know how to make it better - let me know )
For the best experience use Dark Theme and play the "Let it snow" song )
Merry Christmas & Happy New Year!

Bar Balance [LucF]Bar Balance extracts the number of up, down and neutral intrabars contained in each chart bar, revealing information on the strength of price movement. It can display stacked columns representing raw up/down/neutral intrabar counts, or an up/down balance line which can be calculated and visualized in many different ways.
WARNING: This is an analysis tool that works on historical bars only. It does not show any realtime information, and thus cannot be used to issue alerts or for automated trading. When realtime bars elapse, the indicator will require a browser refresh, a change to its Inputs or to the chart's timeframe/symbol to recalculate and display information on those elapsed bars. Once a trader understands this, the indicator can be used advantageously to make discretionary trading decisions.
Traders used to work with my Delta Volume Columns Pro will feel right at home in this indicator's Inputs . It has lots of options, allowing it to be used in many different ways. If you value the bar balance information this indicator mines, I hope you will find the time required to master the use of Bar Balance well worth the investment.
█ OVERVIEW
The indicator has two modes: Columns and Line .
Columns
• In Columns mode you can display stacked Up/Down/Neutral columns.
• The "Up" section represents the count of intrabars where `close > open`, "Down" where `close < open` and "Neutral" where `close = open`.
• The Up section always appears above the centerline, the Down section below. The Neutral section overlaps the centerline, split halfway above and below it.
The Up and Down sections start where the Neutral section ends, when there is one.
• The Up and Down sections can be colored independently using 7 different methods.
• The signal line plotted in Line mode can also be displayed in Columns mode.
Line
• Displays a single balance line using a zero centerline.
• A variable number of independent methods can be used to calculate the line (6), determine its color (5), and color the fill (5).
You can thus evaluate the state of 3 different components with this single line.
• A "Divergence Levels" feature will use the line to automatically draw expanding levels on divergence events.
Features available in both modes
• The color of all components can be selected from 15 base colors, with 16 gradient levels used for each base color in the indicator's gradients.
• A zero line can show a 6-state aggregate value of the three main volume balance modes.
• The background can be colored using any of 5 different methods.
• Chart bars can be colored using 5 different methods.
• Divergence and large neutral count ratio events can be shown in either Columns or Line mode, calculated in one of 4 different methods.
• Markers on 6 different conditions can be displayed.
█ CONCEPTS
Intrabar inspection
Intrabar inspection means the indicator looks at lower timeframe bars ( intrabars ) making up a given chart bar to gather its information. If your chart is on a 1-hour timeframe and the intrabar resolution determined by the indicator is 5 minutes, then 12 intrabars will be analyzed for each chart bar and the count of up/down/neutral intrabars among those will be tallied.
Bar Balances and calculation methods
The indicator uses a variety of methods to evaluate bar balance and to derive other calculations from them:
1. Balance on Bar : Uses the relative importance of instant Up and Down counts on the bar.
2. Balance Averages : Uses the difference between the EMAs of Up and Down counts.
3. Balance Momentum : Starts by calculating, separately for both Up and Down counts, the difference between the same EMAs used in Balance Averages and an SMA of double the period used for the EMAs. These differences are then aggregated and finally, a bounded momentum of that aggregate is calculated using RSI.
4. Markers Bias : It sums the bull/bear occurrences of the four previous markers over a user-defined period (the default is 14).
5. Combined Balances : This is the aggregate of the instant bull/bear bias of the three main bar balances.
6. Dual Up/Down Averages : This is a display mode showing the EMA calculated for each of the Up and Down counts.
Interpretation of neutral intrabars
What do neutral intrabars mean? When price does not change during a bar, it can be because there is simply no interest in the market, or because of a perfect balance between buyers and sellers. The latter being more improbable, Bar Balance assumes that neutral bars reveal a lack of interest, which entails uncertainty. That is the reason why the option is provided to interpret ratios of neutral intrabars greater than 50% as divergences. It is also the rationale behind the option to dampen signal lines on the inverse ratio of neutral intrabars, so that zero intrabars do not affect the signal, and progressively larger proportions of neutral intrabars will reduce the signal's amplitude, as the balance calcs using the up/down counts lose significance. The impact of the dampening will vary with markets. Weaker markets such as cryptos will often contain greater numbers of neutral intrabars, so dampening the Line in that sector will have a greater impact than in more liquid markets.
█ FEATURES
1 — Columns
• While the size of the Up/Down columns always represents their respective importance on the bar, their coloring mode is independent. The default setup uses a standard coloring mode where the Up/Down columns over/under the zero line are always in the bull/bear color with a higher intensity for the winning side. Six other coloring modes allow you to pack more information in the columns. When choosing to color the top columns using a bull/bear gradient on Balance Averages, for example, you will end up with bull/bear colored tops. In order for the color of the bottom columns to continue to show the instant bar balance, you can then choose the "Up/Down Ratio on Bar — Dual Solid Colors" coloring mode to make those bars the color of the winning side for that bar.
• Line mode shows only the line, but Columns mode allows displaying the line along with it. If the scale of the line is different than that of the scale of the columns, the line will often appear flat. Traders may find even a flat line useful as its bull/bear colors will be easily distinguishable.
2 — Line
• The default setup for Line mode uses a calculation on "Balance Momentum", with a fill on the longer-term "Balance Averages" and a line color based on the "Markers Bias". With the background set on "Line vs Divergence Levels" and the zero line on the hard-coded "Combined Bar Balances", you have access to five distinct sources of information at a glance, to which you can add divergences, divergences levels and chart bar coloring. This provides powerful potential in displaying bar balance information.
• When no columns are displayed, Line mode can show the full scale of whichever line you choose to calculate because the columns' scale no longer interferes with the line's scale.
• Note that when "Balance on Bar" is selected, the Neutral count is also displayed as a ratio of the balance line. This is the only instance where the Neutral count is displayed in Line mode.
• The "Dual Up/Down Averages" is an exception as it displays two lines: one average for the Up counts and another for the Down counts. This mode will be most useful when Columns are also displayed, as it provides a reference for the top and bottom columns.
3 — Zero Line
The zero line can be colored using two methods, both based on the Combined Balances, i.e., the aggregate of the instant bull/bear bias of the three main bar balances.
• In "Six-state Dual Color Gradient" mode, a dot appears on every bar. Its color reflects the bull/bear state of the Combined Balances, and the dot's brightness reflects the tally of balance biases.
• In "Dual Solid Colors (All Bull/All Bear Only)" a dot only appears when all three balances are either bullish or bearish. The resulting pattern is identical to that of Marker 1.
4 — Divergences
• Divergences are displayed as a small circle at the top of the scale. Four different types of divergence events can be detected. Divergences occur whenever the bull/bear bias of the method used diverges with the bar's price direction.
• An option allows you to include in divergence events instances where the count of neutral intrabars exceeds 50% of the total intrabar count.
• The divergence levels are dynamic levels that automatically build from the line's values on divergence events. On consecutive divergences, the levels will expand, creating a channel. This implementation of the divergence levels corresponds to my view that divergences indicate anomalies, hesitations, points of uncertainty if you will. It excludes any association of a pre-determined bullish/bearish bias to divergences. Accordingly, the levels merely take note of divergence events and mark those points in time with levels. Traders then have a reference point from which they can evaluate further movement. The bull/bear/neutral colors used to plot the levels are also congruent with this view in that they are determined by price's position relative to the levels, which is how I think divergences can be put to the most effective use.
5 — Background
• The background can show a bull/bear gradient on four different calculations. You can adjust its brightness to make its visual importance proportional to how you use it in your analysis.
6 — Chart bars
• Chart bars can be colored using five different methods.
• You have the option of emptying the body of bars where volume does not increase, as does my TLD indicator, the idea behind this being that movement on bars where volume does not increase is less relevant.
7 — Intrabar Resolution
You can choose between three modes. Two of them are automatic and one is manual:
a) Fast, Longer history, Auto-Steps (~12 intrabars) : Optimized for speed and deeper history. Uses an average minimum of 12 intrabars.
b) More Precise, Shorter History Auto-Steps (~24 intrabars) : Uses finer intrabar resolution. It is slower and provides less history. Uses an average minimum of 24 intrabars.
c) Fixed : Uses the fixed resolution of your choice.
Auto-Steps calculations vary for 24/7 and conventional markets in order to achieve the proper target of minimum intrabars.
You can choose to view the intrabar resolution currently used to calculate delta volume. It is the default.
The proper selection of the intrabar resolution is important. It must achieve maximal granularity to produce precise results while not unduly slowing down calculations, or worse, causing runtime errors.
8 — Markers
Six markers are available:
1. Combined Balances Agreement : All three Bar Balances are either bullish or bearish.
2. Up or Down % Agrees With Bar : An up marker will appear when the percentage of up intrabars in an up chart bar is greater than the specified percentage. Conditions mirror to down bars.
3. Divergence confirmations By Price : One of the four types of balance calculations can be used to detect divergences with price. Confirmations occur when the bar following the divergence confirms the balance bias. Note that the divergence events used here do not include neutral intrabar events.
4. Balance Transitions : Bull/bear transitions of the selected balance.
5. Markers Bias Transitions : Bull/bear transitions of the Markers Bias.
6. Divergence Confirmations By Line : Marks points where the line first breaches a divergence level.
Markers appear when the condition is detected, without delay. Since nothing is plotted in realtime, markers do not appear on the realtime bar.
9 — Settings
• Two modes can be selected to dampen the line on the ratio of neutral intrabars.
• A distinct weight can be attributed to the count of the latter half of intrabars, on the assumption that later intrabars may be more important in determining the outcome of chart bars.
• Allows control over the periods of the different moving averages used in calculations.
• The default periods used for the various calculations define the following hierarchy from slow to fast:
Balance Averages: 50,
Balance Momentum: 20,
Dual Up/Down Averages: 20,
Marker Bias: 10.
█ LIMITATIONS
• This script uses a special characteristic of the `security()` function allowing the inspection of intrabars—which is not officially supported by TradingView.
• The method used does not work on the realtime bar—only on historical bars.
• The indicator only works on some chart resolutions: 3, 5, 10, 15 and 30 minutes, 1, 2, 4, 6, and 12 hours, 1 day, 1 week and 1 month. The script’s code can be modified to run on other resolutions, but chart resolutions must be divisible by the lower resolution used for intrabars and the stepping mechanism could require adaptation.
• When using the "Line vs Divergence Levels — Dual Color Gradient" color mode to fill the line, background or chart bars, keep in mind that a line calculation mode must be defined for it to work, as it determines gradients on the movement of the line relative to divergence levels. If the line is hidden, it will not work.
• When the difference between the chart’s resolution and the intrabar resolution is too great, runtime errors will occur. The Auto-Steps selection mechanisms should avoid this.
• Alerts do not work reliably when `security()` is used at intrabar resolutions. Accordingly, no alerts are configured in the indicator.
• The color model used in the indicator provides for fancy visuals that come at a price; when you change values in Inputs , it can take 20 seconds for the changes to materialize. Luckily, once your color setup is complete, the color model does not have a large performance impact, as in normal operation the `security()` calls will become the most important factor in determining response time. Also, once in a while a runtime error will occur when you change inputs. Just making another change will usually bring the indicator back up.
█ RAMBLINGS
Is this thing useful?
I'll let you decide. Bar Balance acts somewhat like an X-Ray on bars. The intrabars it analyzes are no secret; one can simply change the chart's resolution to see the same intrabars the indicator uses. What the indicator brings to traders is the precise count of up/down/neutral intrabars and, more importantly, the calculations it derives from them to present the information in a way that can make it easier to use in trading decisions.
How reliable is Bar Balance information?
By the same token that an up bar does not guarantee that more up bars will follow, future price movements cannot be inferred from the mere count of up/down/neutral intrabars. Price movement during any chart bar for which, let's say, 12 intrabars are analyzed, could be due to only one of those intrabars. One can thus easily see how only relying on bar balance information could be very misleading. The rationale behind Bar Balance is that when the information mined for multiple chart bars is aggregated, it can provide insight into the history behind chart bars, and thus some bias as to the strength of movements. An up chart bar where 11/12 intrabars are also up is assumed to be stronger than the same up bar where only 2/12 intrabars are up. This logic is not bulletproof, and sometimes Bar Balance will stray. Also, keep in mind that balance lines do not represent price momentum as RSI would. Bar Balance calculations have no idea where price is. Their perspective, like that of any historian, is very limited, constrained that it is to the narrow universe of up/down/neutral intrabar counts. You will thus see instances where price is moving up while Balance Momentum, for example, is moving down. When Bar Balance performs as intended, this indicates that the rally is weakening, which does necessarily imply that price will reverse. Occasionally, price will merrily continue to advance on weakening strength.
Divergences
Most of the divergence detection methods used here rely on a difference between the bias of a calculation involving a multi-bar average and a given bar's price direction. When using "Bar Balance on Bar" however, only the bar's balance and price movement are used. This is the default mode.
As usual, divergences are points of interest because they reveal imbalances, which may or may not become turning points. I do not share the overwhelming enthusiasm traders have for the purported ability of bullish/bearish divergences to indicate imminent reversals.
Superfluity
In "The Bed of Procrustes", Nassim Nicholas Taleb writes: To bankrupt a fool, give him information . Bar Balance can display lots of information. While learning to use a new indicator inevitably requires an adaptation period where we put it through its paces and try out all its options, once you have become used to Bar Balance and decide to adopt it, rigorously eliminate the components you don't use and configure the remaining ones so their visual prominence reflects their relative importance in your analysis. I tried to provide flexible options for traders to control this indicator's visuals for that exact reason—not for window dressing.
█ NOTES
For traders
• To avoid misleading traders who don't read script descriptions, the indicator shows nothing in the realtime bar.
• The Data Window shows key values for the indicator.
• All gradients used in this indicator determine their brightness intensities using advances/declines in the signal—not their relative position in a fixed scale.
• Note that because of the way gradients are optimized internally, changing their brightness will sometimes require bringing down the value a few steps before you see an impact.
• Because this indicator does not use volume, it will work on all markets.
For coders
• For those interested in gradients, this script uses an advanced version of the Advance/Decline gradient function from the PineCoders Color Gradient (16 colors) Framework . It allows more precise control over the range, steps and min/max values of the gradients.
• I use the PineCoders Coding Conventions for Pine to write my scripts.
• I used functions modified from the PineCoders MTF Selection Framework for the selection of timeframes.
█ THANKS TO:
— alexgrover who helped me think through the dampening method used to attenuate signal lines on high ratios of neutral intrabars.
— A guy called Kuan who commented on a Backtest Rookies presentation of their Volume Profile indicator . The technique I use to inspect intrabars is derived from Kuan's code.
— theheirophant , my partner in the exploration of the sometimes weird abysses of `security()`’s behavior at intrabar resolutions.
— midtownsk8rguy , my brilliant companion in mining the depths of Pine graphics. He is also the co-author of the PineCoders Color Gradient Frameworks .

HIGHER HIGH LOWER LOW STRATEGYThis is my favorite for Tradingview.
Please use other indicators to find good entry and good exit. This is why this publication has so many indicators. A good indicator will find good results even on line chart. Feel free to try on "Heiken Ashi" but understand that "line" chart is much more realistic
Due to tradingview's crappy auto resize, the best way to view this script is to click on the share button and "Make it Mine".
Then you can see why my other indicators are "PRESENT"
Cheers!!!
BEST Ultimate Engulfing ScreenerHello traders
Continuing deeper and stronger with the screeners serie. I keep getting requests private messages and requests saying that screeners aren't possible with TradingView.
My answer is always... "Reallyyy ??" (I never find a better answer than that...)
I'll publish a few screeners just for everyone to understand what can be done with Pinescript. We don't have to wait for TradingView to allow screener based on custom indicator - we can build our own ^^
I - What is an engulfing pattern
Let's start with a screener to check for a very famous candlestick pattern called engulfing
Engulfing candles tend to signal a reversal of the current trend in the market. This specific pattern involves two candles with the latter candle ‘engulfing’ the entire body of the candle before it.
The engulfing candle can be bullish or bearish depending on where it forms in relation to the existing trend
Source and more info here
These engulfing candles indicate a strong shift in direction, and when combined with observation of the price-trending direction that precedes it, this shift creates the opportunity for a trading strategy.
II - How did I set the screener
I added an optional filter being Price vs SMA. The idea is to select only the engulfing whenever the price also breaks an SMA - this usually translates a stronger move - but could sometimes give the signal too late (#meh #trading #ain't #easy)
The visual signals are as follow:
- square: whenever the engine detects an engulfing and an SMA breakout
- triangle: the engine only detects an engulfing
- dash: none of the above
Then the colors are:
- orange when bullish
- yellow when bearish
- aqua/dash when none of the above
Cool Hacks
"But sir... what can we do with only 5 instruments for a screener?" I agree not much but...
even if I allow only 5 instruments per indicator - nothing prevents you from adding multiple times the same indicator and changing the selected instruments for each. I also show why the SPX500 gave a yellow triangle (bearish engulfing) and how to match it with the screener.
=> imgur.com
Wishing you all the BEST trading
Dave