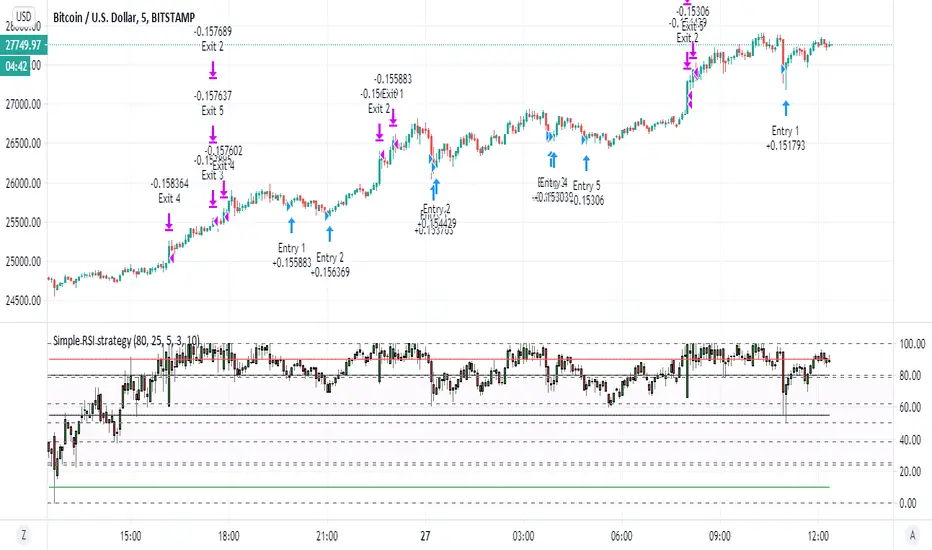
Simple RSI strategyso this script just take it as teaching how to make easy strategy
many time we try complex one and we fail
thanks to coinrule for his very smart method of pyramid
i just here in this very simple rsi strategy want to show how even lame strategy like RSI can be very profitable:)
1. we exit by take profit
2. we make sure that for exit by take profit the stop loss will be far lets say 10% or more
3. this shit only work good in up trending markets:)
why regular rsi strategy not working? because the exit is shity ... it depend on false top that based on RSI above 70 or 80 in general.
in bullish state this will exit us faster then we desire and will cost us loss . in bearish state rsi will not go so high and we exit too late so the stop loss is our our only saver
here by exiting by% we get much better results
so what happen if the trend is bearish? you can can try to do the same just reverse order to create more shorts (sometime it work sometime is not)
end conclusion in bullish trending market even shifty strategy is good
the only reason this one work is actually because of the script of coinrule so i want to thank him on this
happy new year to all TV members
Recherche dans les scripts pour "trend"
DoubleTrendCloud(DTC) StrategyHello, everyone.
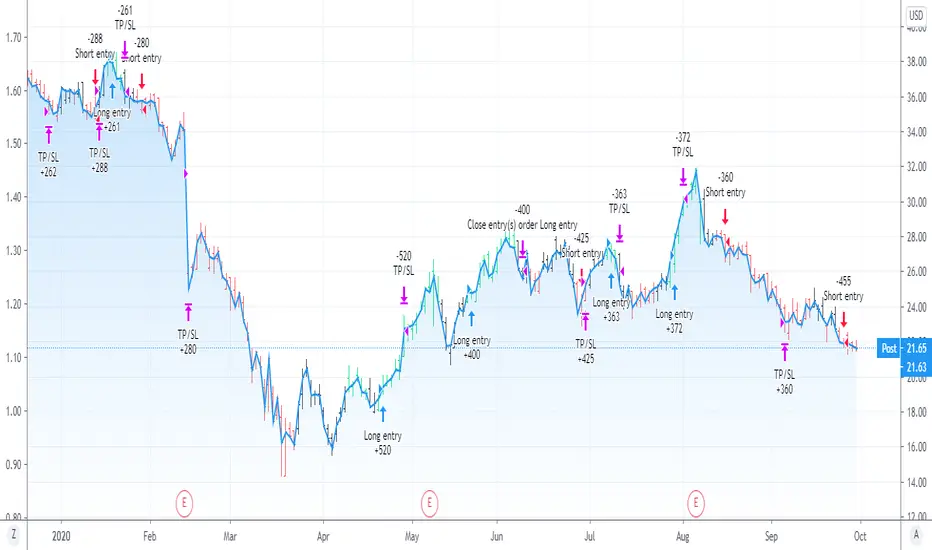
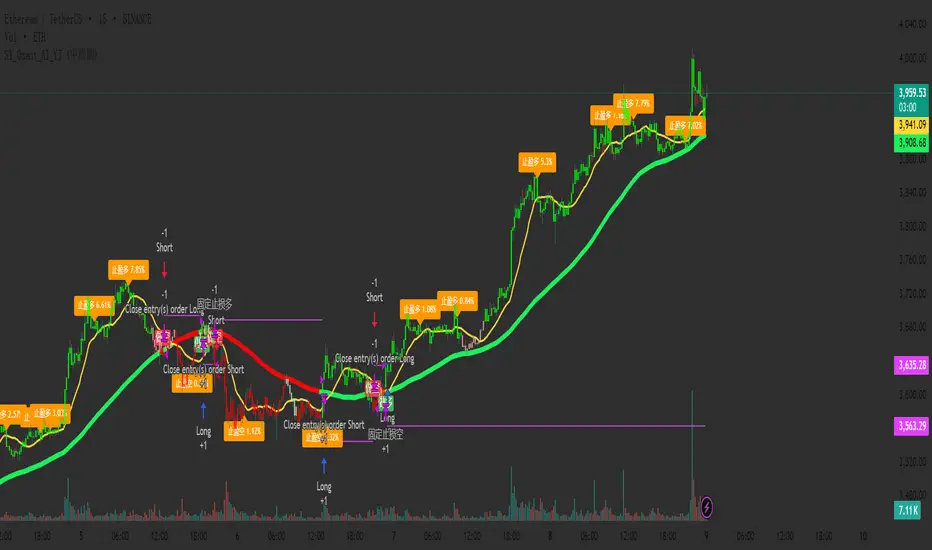
We try to publish a strategy for Bitcoin named 'DoubleTrendCloud(DTC) Strategy'.
It is largely based on the 'Supertrend strategy' and 'Supertrend Cloud Strategy' published by 'jhanson107'.
What we did here is just some modification for the current Bitcoin trend. It is based on a 4 hour time period.
In short, it utilizes two pairs of trend lines: short period trend and long period trend.
When the long period trend was broken upward, we do not have short position, but only long position according to the short period trend.
On the other hand, the long period trend was broken downward, we do not have long position, but only short position according to the short period trend.
The messages for the position:
long : open your long position
short : open your short position
Close entry(s) order long : close your long position
Close entry(s) order short : close your short position
As a result, this DTC Strategy guarantees higher profit and lower risk than the original supertrend strategy.
(Total profit and the maximum risk from Jan. 1. 2018 ->
(a) Supertrend (Multiplier= 2/period= 7): Total profit: 843%, the maximum risk: 39.38%
(b) Supertrend (Multiplier= 7/period= 4): Total profit: 370%, the maximum risk: 37.18%
(c) DoubleTrendCloud: Total profit: 1487%, the maximum risk: 24.25%)

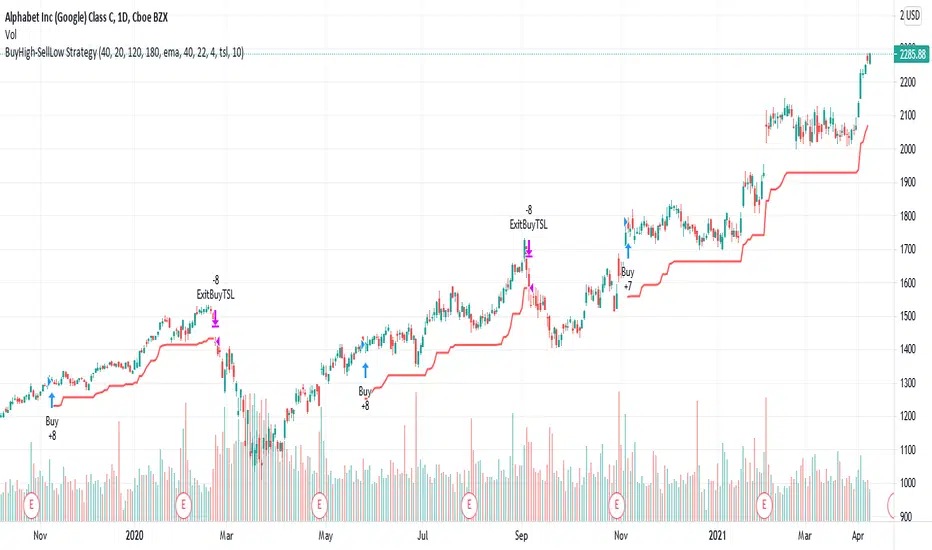
BuyHigh-SellLow StrategyYeah. You read it right. It's not a mistake. It is buy high and sell low strategy.
Main entry condition is to buy when price hits 40 day Donchian channel top. This is combined with my other regular filters which are aligned moving average and new high/low filter and yearly high/low filter.
Exit condition can be based on two things:
Donchian channel : Set appropriate DonchianExitLength. Lower line of donchian channel acts as trailing stop.
ATR Based trailing stop : Select appropriate ATR multiplier and length.
What a surprise!! You can buy high, sell low and still make money.
AlignedMA and Cumulative HighLow Strategy V2Based on earlier strategy published - AlignedMA and Cumulative HighLow Strategy. Adjustments are done in entry and exit criteria to make it work for shares.
Modified to preserve existing entry criteria + additional MA shift condition. Exit criteria is set based on supertrend and trailing stops.
Most of the parameters are already optimized. You only need to alter SupertrendMult for individual shares based on individual share volatility. Usually works within 2-4.
There might be bit of repainting. I am unable to understand if there is any. Any suggestions on further improvements welcome :)
Note to moderators : I have used 1000 as initial capital with 100% on each trade. As strategy does not compound - I believe this is reasonable. I have kept this setting as this makes it easier to compare with buy and hold return.

Power X Strategy Back-testThis script back-test the Power X Strategy developed by Markus Heitkoetter and Rockwell Trading. For more detail about the strategy, please refer to "The PowerX Strategy: How to Trade Stocks and Options in Only 15 Minutes a Day" written by Markus Heitkoetter. Note that this script is not publish, develop or maintain by Rockwell Trading, and may have different results. Rockwell Trading has a powerful software called Power X Optimizer, which scan, back-test and optimize the best stock for the strategy.
The Power X Strategy uses RSI , Slow Stochastic and MACD indicators under the hood. When RSI and slow Stochastic are both greater than 50 and MACD crosses up the signal line, it marks as up-trend. If RSI and slow stochastic are both less than 50 and MACD crosses down the signal line, it marks as down-trend. Other are mark as no trend.
This back-test makes a long entry with an up-trend momentum and short entry with down-trend momentum. Trade is exited when profit target or stop lose is reach. Profit target and stop lose is calculated based on 7 days Average Daily Range (ADR).
If the either of the momentum is lost, trade is exited the next day. It also skips the entire month of March 2020, since the market crash and is not in a normal market condition for the strategy.
Zulu Kilo 4HR Strategy - LIVE BETA TESTING***MANDATORY READING SO YOU DONT LOSE MONEY ON A POSITION***
I will be posting a video soon on my TV channel to explain exactly what you're about to read below so you can visually understand the process.
PLEASE NOTE THE FOLLOWING IMPORTANT CONDITIONS:
-The script DOES repaint since it looks for specific EMA conditions to meet position thresholds so there are some implications that MUST be observed BEFORE entering into a position.
-This script MUST be used in conjunction with at minimum 3 other indicators before entering the position it calls for you to enter, OR exiting a currently held position. Details on the bottom.
-The 3 recommended indicators that MUST be used in conjunction to verify position entry are: MACD, RSI and STOCH indicators.
-Do NOT change any of the settings in the script as it will not indicate the correct divergence/convergence for when to look for opening a position.
The three indicators I recommend in conjunction are all FREE indicators available openly on Tradingview Indicators:
(PLEASE NOTE THAT THE BELOW INDICATORS ARE NOT MINE, I GIVE ALL CREDIT TO THEIR ORIGINAL PUBLISHERS. THEY ARE *NOT* PART OF THIS SCRIPT.)
1) "Smooth Chande Trend Score w/ Signal line by CryptoRythms" (This is a volume weighed MACD indicator that shows convergence and divergence)
2) "STOCH_VX3" (This is a really smart and useful Stochastic indicator)
3) "CM_RSI Plus EMA" (This is an RSI trend indicator with an EMA reference line for added clarity of trend direction)
How to correctly use the Zulu Kilo indicator:
1) The time frame it is encoded for is the 4 hour time frame and that is what MUST be used to correctly identify a potential position entry/exit.
2) Getting into an initial position (when NOT currently in any position):
TWO OPTIONS:
A) ENTER INTO AN EXISTING SIGNAL
-IF indicator is showing an existing SHORT entry, the 3 other indicators must ALL be aligned crossing DOWN or trending downwards.
-IF indicator is showing a LONG entry, the 3 other indicators must ALL be aligned crossing UP or trending upwards.
B) ENTER INTO NEXT SIGNAL GENERATED
-Wait for indicator to generate a Short/Long position on a candle, DO NOT enter into that position until ALL 3 bottom indicators converge to pointing up (for a Long entry), or pointing down (for a Short entry).
-VERY IMPORTANT: It is NOT enough for the 3 bottom indicators to cross into a buy/sell until that 4 hr candle has closed with all 3 indicators trending up (for long) or trending down (for Short).
-I REPEAT **DO NOT** get into the indicated long/short position until the 4 hr candle has closed on the bottom three indicators as crossing up or down. There will be numerous times where on current 4hr candle, the 3 bottom indicators will cross into a buy/sell signal. That 4hr candle's price action CAN change until the current 4hr candle closes. IT IS NOT ENOUGH to get into any position indicated by my indicator unless the current 4hr candle where the bottom 3 indicators converge/cross up or down CLOSES the candle.
3) Exiting a position (Taking profit and entering new position):
-If you are in an existing position, please note that fake Long/Sell signals will be generated by the script. So when do you take profit from current position and enter the next position?
Scenario:
You are currently in a LONG position. Price goes up, there is price consolidation happening and a SHORT signal is generated. DO NOT immediately take profit and close your existing Long position yet. Unless, ALL 3 bottom indicators converge and cross downwards AFTER the current 4hr candle is confirmed, you will stay in your long position. You will ONLY exit and take profit / Stop Loss from your LONG position and go into a SHORT is when all 3 bottom indicators cross downwards on a 4hr candle close and confirm pointing/crossing down.
The exact inverse if you're in a SHORT position... If a LONG pops up while in a SHORT position, do NOT exit the SHORT immediately. Only exit the short, take profit, and then enter a long if all three indicators close on a 4hr candle where the 3 indicators are crossing up. If that does not happen, the long signal will disappear eventually, and you continue in the short position until another LONG signal pops up, repeat the same process.
***VERY IMPORTANT***
I cannot stress this enough!
I need all of the strategy followers to understand that the ONLY way you would ever enter into a signaled position is when a 4hr candle closes where the bottom 3 indicators are ALL crossing/pointing up (for a LONG) or ALL crossing/pointing down (for a SHORT).

New Age US ORB═════════════════════════════════════════════════════════════
NEW AGE US ORB
Opening Range Breakout Strategy with Neon Glow Effect
═════════════════════════════════════════════════════════════
🔒 INVITE-ONLY ACCESS
This script requires an invitation to use.
To request access, please send me a private message.
═════════════════════════════════════════════════════════════
🎯 OVERVIEW
The New Age US ORB is a clean, professional Opening Range Breakout (ORB) strategy with a futuristic visual style featuring dynamic neon glow effects.
Designed for Crypto (BTC/USD) and Indices (US100, US30, SPX) trading.
Best results on 5-minute or 15-minute chart with Regular Candles.
The strategy captures the first 15 minutes of US market activity (9:30-9:45 NY) and trades breakouts in the direction of the initial move.
💎 WHAT MAKES THIS UNIQUE
Unlike standard ORB indicators, this strategy combines:
• Proprietary 3-layer Neon Glow visualization for enhanced box visibility
• Integrated US Session backgrounds for market context
• Smart Session Filter to avoid low-probability late entries
• Separate Long/Short TP management for asymmetric markets
• Automatic EOD position closure for overnight risk control
• Daily trade limiter to prevent overtrading
• Global Timezone Support - works correctly for traders worldwide
This combination of visual design and risk management features is not available in standard ORB scripts.
Trade Smarter, not Harder.
📦 WHAT IS ORB?
The Opening Range Breakout (ORB) strategy is based on the concept that the first 15 minutes of the US market session often sets the tone for the rest of the day. The High and Low established during this period act as key support/resistance levels.
• Price breaks ABOVE ORB High → Bullish momentum (LONG)
• Price breaks BELOW ORB Low → Bearish momentum (SHORT)
⚡ KEY FEATURES
📦 ORB BOX VISUALIZATION
• Automatically captures High/Low of 9:30-9:45 NY candle
• Dynamic color change:
→ Cyan: Price ABOVE ORB High (Bullish)
→ Red: Price BELOW ORB Low (Bearish)
• Extends throughout the trading session
✨ NEON GLOW EFFECT
• 3-layer glow effect around the ORB box
• Layered borders (8px → 5px → 3px) with gradient transparency
• Creates futuristic, high-visibility appearance
• Toggle on/off in settings
🕐 US SESSION BACKGROUNDS
• US Open (9:30-11:30 NY) - Blue
• Lunch Break (11:30-13:30 NY) - Orange
• Afternoon (13:30-16:00 NY) - Green
• Visual reference only - helps identify optimal trading windows
⏱️ SESSION FILTER
• Configurable trading window (default: until 11:50 NY)
• Prevents late entries when momentum fades
• EOD auto-close in YOUR selected timezone (default: 21:45)
🎚️ RISK MANAGEMENT
• ORB Box Stop Loss: SL at opposite ORB level + buffer
• Separate Take Profit settings for Long/Short
• Points or Percentage mode
• Daily trade limit (default: 6 trades max)
📊 INFO DASHBOARD
• Real-time status panel (top right)
• Shows: Timezone, Status, Session, Direction, Trades, SL/TP, EOD, ORB levels
⚙️ SETTINGS
TIMEZONE
└── Your Timezone: Select from 12 global timezones (Default: Europe/Zurich)
Available: UTC, New York, Chicago, Los Angeles, London, Berlin,
Zurich, Paris, Tokyo, Hong Kong, Singapore, Sydney
ORB BOX (9:30-9:45 NY)
├── Show ORB Box: true/false
└── Neon Glow Effect: true/false
US SESSION BACKGROUNDS
├── Show Session Background: true/false
├── US Open Color (9:30-11:30)
├── Lunch Color (11:30-13:30)
└── Afternoon Color (13:30-16:00)
SESSION FILTER
├── Enable Session Filter: true/false
├── Session End Hour (NY): 0-23
└── Session End Minute (NY): 0-59
DAILY CLOSE (Your Timezone)
├── Enable Daily Close: true/false
├── EOD Hour: 0-23
└── EOD Minute: 0-59
TRADE LIMITS
├── Enable Daily Limit: true/false
└── Max Trades per Day: 1-10
STOP LOSS
├── Enable ORB Box SL: true/false
└── SL Buffer: Points distance from ORB level
TAKE PROFIT - LONG
├── Enable TP Long: true/false
├── Mode: Points / Percent
├── TP Long Points: Distance in points
└── TP Long Percent: Distance in %
TAKE PROFIT - SHORT
├── Enable TP Short: true/false
├── Mode: Points / Percent
├── TP Short Points: Distance in points
└── TP Short Percent: Distance in %
COLORS
├── Bullish: Default #00ffbb (Cyan)
└── Bearish: Default #ff1100 (Red)
📈 HOW TO USE
1. Apply to BTC/USD or US100 on 5min or 15min timeframe
2. Use Regular Candles for realistic results
3. Go to Strategy Properties → Enable ☑️ "Recalculate On Bar Close"
4. Select your Timezone in settings (for correct EOD close time)
5. Wait for ORB box to complete (9:45 NY)
6. Strategy enters automatically on breakout:
→ LONG when price closes above ORB High
→ SHORT when price closes below ORB Low
7. Manage risk with ORB Box SL and TP settings
8. All positions close at EOD time (in your timezone)
🔔 ALERTS
• LONG Entry - Breakout above ORB High
• SHORT Entry - Breakout below ORB Low
• EOD Close - End of day position close
💡 BEST PRACTICES
• Most effective during US Open session (9:30-11:30 NY)
• Avoid Lunch session (11:30-13:30) - lower volatility
• ORB levels act as support/resistance all day
• Wider TP for trending days, tighter for ranging markets
• Use session filter to avoid late, low-probability entries
═════════════════════════════════════════════════════════════
© AL_R4D1 - New Age Style Trading Tools
═════════════════════════════════════════════════════════════


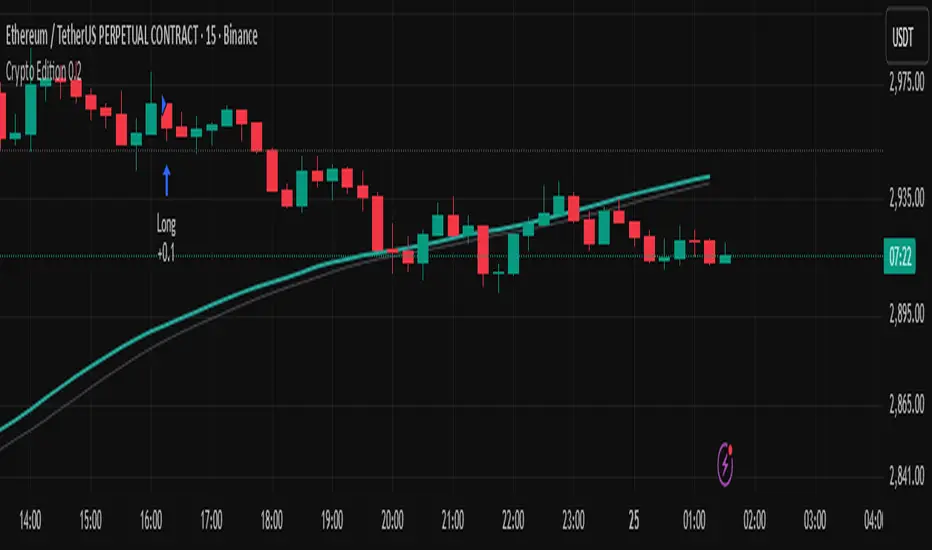
Crypto Edition 0.2This strategy is built on a trend-following approach, designed to capture sustained market momentum rather than predict reversals.its a pullback strategy. The goal is to stay aligned with the prevailing trend, ride strong moves, avoid ranging-market noiseE
Crypto Grid 2025+ Long Only (Asym TP)Crypto Grid 2025+ Long Only (Asymmetric Take-Profit) is a long-only mean-reversion grid strategy designed for intraday cryptocurrency trading.
The core idea is to accumulate long positions as price moves downward within a locally defined price range and to exit positions on upward retracements.
The strategy automatically builds a multi-level grid between the highest and lowest price over a user-defined lookback period (“range length”). Each grid level acts as a potential entry point when price crosses it from above.
Key Features
1. Long-only grid logic
The strategy opens long positions only, progressively increasing exposure as price moves into lower grid levels.
2. Asymmetric take-profit mechanism
Instead of taking profit strictly at the next grid level, the strategy allows targeting multiple levels above the entry point. This increases the average profit per winning trade and shifts the reward-to-risk profile toward larger, less frequent wins.
3. Optional partial take-profit
A portion of each trade can be closed at the nearest grid level, while the remainder is held for a more distant asymmetric target. This balances consistency and profit potential.
4. Volume-based market filter
Entries can be restricted to periods of healthy market activity by requiring volume to exceed a moving-average baseline.
5. Capital-scaled position sizing
Position size is determined by risk percentage, grid spacing, and a dynamic sizing mode (original / conservative / aggressive).
6. Built-in risk controls
global stop below the lower boundary of the range,
global take-profit above the upper boundary,
automatic shutdown after a configurable loss-streak.
Market Philosophy
This strategy belongs to the mean-reversion family: it expects short-term overshoots to revert back toward mid-range liquidity zones.
It is not trend-following.
It performs best in choppy, range-bound, or slow-grinding markets — especially on liquid crypto pairs.
Recommended Use Cases
Short timeframes (1–15 minutes)
High-liquidity crypto pairs
Sideways or rotational price action
Exchanges with low fees (due to higher order count)
Not Intended For
Strong trending markets without pullbacks
Assets with thin order books
Use with leverage without additional risk controls
Summary
Crypto Grid 2025+ Long Only (Asymmetric TP) is a refined grid-based mean-reversion strategy optimized for modern crypto markets. Its asymmetric take-profit framework is specifically engineered to reduce the classical issue of “small wins and large occasional losses” found in traditional grid systems, giving it a more favorable long-term trade distribution.

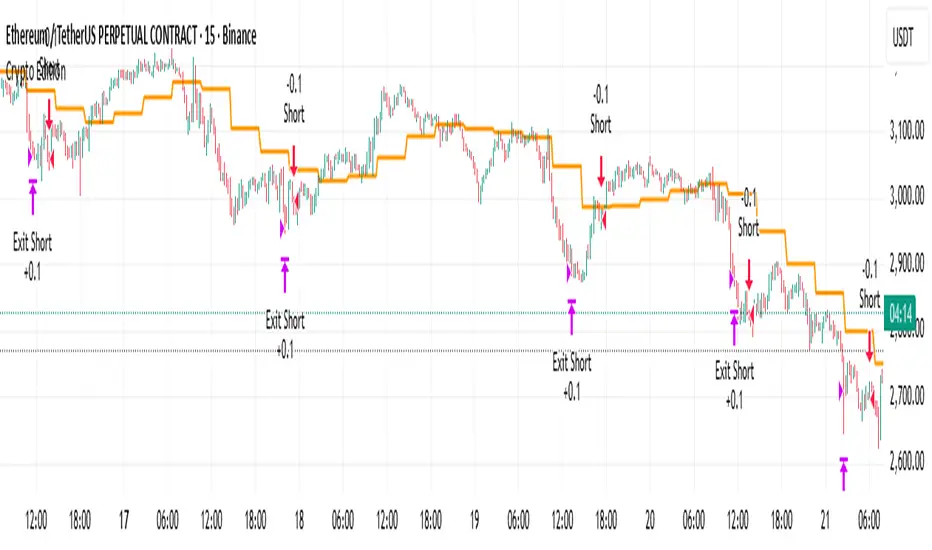
Crypto Edition 0.1a trend following pullback strategy.. the strategy has to be optimized on current market regime.works great on lower timeframe ie 1m to 15m.
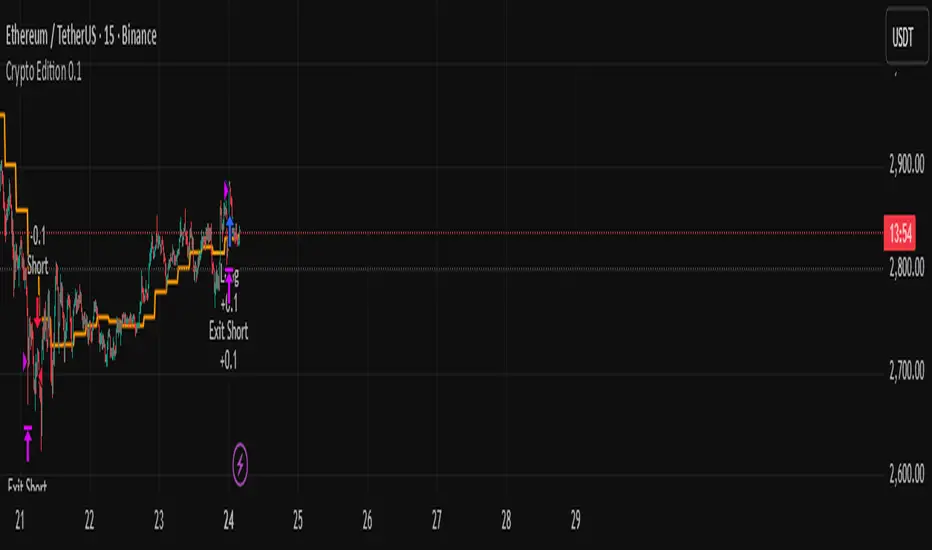
Crypto EditionThis strategy is built on a trend-following approach, designed to capture sustained market momentum rather than predict reversals.its a pullback strategy. The goal is to stay aligned with the prevailing trend, ride strong moves, avoid ranging-market noise
ULTIMATE COAIUSDT AUTOMATED STRATEGY# ULTIMATE COAIUSDT AUTOMATED STRATEGY
## 🚀 OVERVIEW
High-performance automated trading strategy for COAIUSDT.P perpetual contract achieving 5,962% returns in one month with 68.58% win rate across 611 trades.
## 📊 PERFORMANCE METRICS
• Net Profit: +5,962.87%
• Total Trades: 611
• Win Rate: 68.58% (419 wins)
• Profit Factor: 6.41
• Max Drawdown: -6.11%
• Timeframe: 5 minutes
• Backtest Period: Oct 2 - Nov 7, 2025
## 🎯 CORE TRADING LOGIC
Primary Indicator: ALMA (Arnaud Legoux Moving Average)
• Dual ALMA crossovers for precise entry signals
• Optimized parameters: Offset 0.85, Sigma 5, Period 2
• Reduces lag while maintaining signal accuracy
Multi-Timeframe Confirmation:
• HTF Filter: 15-minute timeframe validation
• HTF Multiplier: 8x for trend confirmation
• Eliminates false signals by requiring 5m + 15m alignment
Entry Signals:
• LONG: Fast ALMA crosses above slow ALMA (both timeframes)
• SHORT: Fast ALMA crosses below slow ALMA (both timeframes)
• EXIT: Opposite crossover triggers position close
## 💰 RISK MANAGEMENT
Take Profit: 13.5%
• Dynamically calculated from entry price
• Automatically locked when target reached
Stop Loss: 2.8%
• Tight stop to protect capital
• Optimized through extensive backtesting
Position Sizing:
• Pyramiding: Up to 12 positions
• Trade size: 20% of equity per trade
• Commission: 0.04% included in calculations
## 🤖 AUTOMATION FEATURES
Built-in Alert System:
• Webhook-ready
• Real-time signal transmission
• Pipe-delimited format for easy parsing
Alert Types:
• BUY: BUY|COAIUSDT.P|price=X|tp=Y|sl=Z
• SELL: SELL|COAIUSDT.P|price=X|tp=Y|sl=Z
• CLOSE LONG: CLOSE|COAIUSDT.P|side=LONG
• CLOSE SHORT: CLOSE|COAIUSDT.P|side=SHORT
## 📈 STRATEGY STRENGTHS
1. High Win Rate: 68.58% consistent edge
2. Excellent Profit Factor: 6.41 (profits 6.4x larger than losses)
3. Low Drawdown: Only -6.11% despite massive returns
4. Active Trading: 611 opportunities in 1 month
5. Automation Ready: Built-in webhook alerts
6. Optimized Risk/Reward: 4.8:1 ratio (13.5% TP / 2.8% SL)
## 🎨 VISUAL SIGNALS
• Green triangle + "BUY" label for long entries
• Red triangle + "SELL" label for short entries
• Clear exit markers for position closes
• Minimal chart clutter
## ⚠️ IMPORTANT DISCLAIMERS
• Strategy optimized specifically for COAIUSDT.P on 5-minute timeframe
• Past performance (5,962% returns) does not guarantee future results
• Use proper position sizing - never risk more than you can afford to lose
• Monitor strategy regularly, especially during high-impact news events
• Backtested results may differ from live trading due to slippage and execution
## 🔧 BEST PRACTICES
• Start with paper trading to verify signals
• Use stop-loss protection at all times
• Monitor drawdown levels regularly
• Adjust position size based on account risk tolerance
• Consider market conditions and volatility
The ULTIMATE COAIUSDT AUTOMATED STRATEGY combines sophisticated technical analysis with robust risk management and full automation capabilities - designed to capture consistent profits from COAI's price movements while maintaining strict capital protection.

Two-Sided R1/S1 + Supertrend (Final v6)The core of this TradingView strategy combines classic intraday resistance with a volatility-based trend follower to identify strong breakout and breakdown opportunities while rigorously enforcing day trading rules.
This is an Intraday Mean Reversion / Trend Following strategy for the 5-minute (5m) chart with mandatory End-of-Day (EOD) closures.
In essence: You're only trading in the direction of the confirmed Supertrend when price action has demonstrated enough momentum to move past the important pivot support/resistance levels.

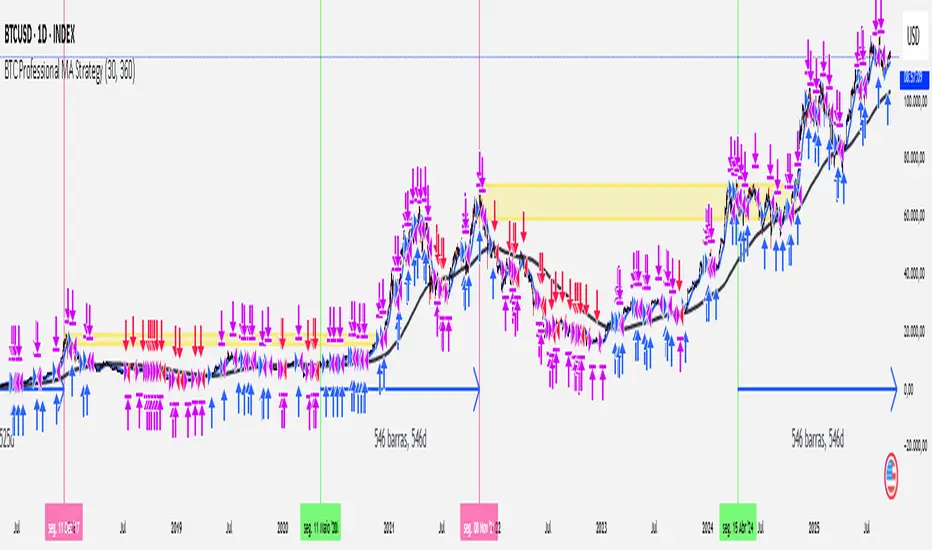
[Outperforms Bitcoin Since 2011] Professional MA StrategyThis Strategy OUTPEFORMS Bitcoin since 2011.
Timeframe: Daily
MA used (Fast and Slow): WMA (Weighted Moving Average)
Fast MA Length: 30 days (Reflects the Monthly Trend - Short Term Perspective)
Slow MA Length: 360 days (Reflects the Annual Trend - Long Term Perspective)
Position Size: 100% of equity
Margin for Long = 10% of equity
Margin for Short = 10% of equity
Open Long = Typical Price Crosses Above its Fast MA and Price is above its Slow MA
Open Short = Typical Price Crosses Below its Fast MA and Price is below its Slow MA
Close Long = Typical Price Crosses Below its Fast MA
Close Short = Typical Price Crosses Below its Fast MA
note: Typical Price = (high + low + close) / 3
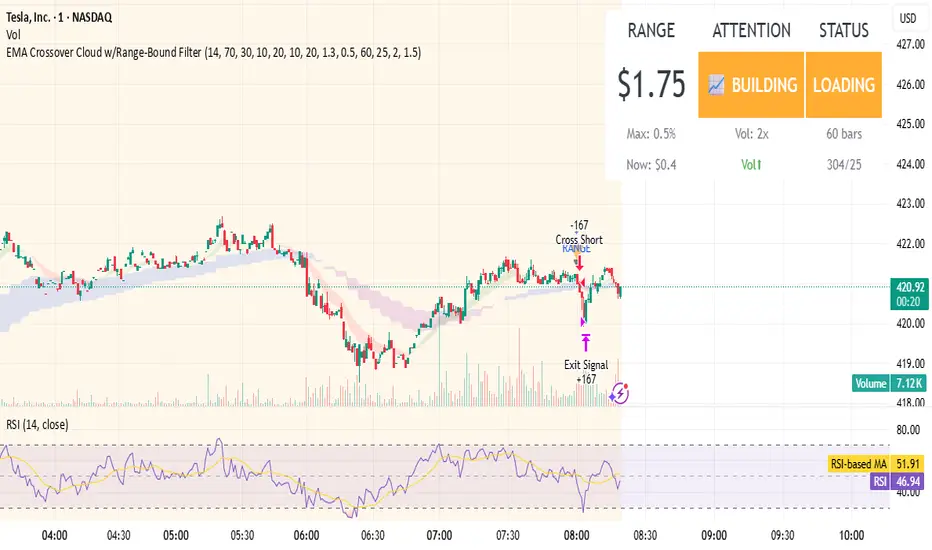
EMA Crossover Cloud w/Range-Bound FilterA focused 1-minute EMA crossover trading strategy designed to identify high-probability momentum trades while filtering out low-volatility consolidation periods that typically result in whipsaw losses. Features intelligent range-bound detection and progressive market attention alerts to help traders manage focus and avoid overtrading during unfavorable conditions.
Key Features:
EMA Crossover Signals: 10/20 EMA crossovers with volume surge confirmation (1.3x 20-bar average)
Range-Bound Filter: Automatically detects when price is consolidating in tight ranges (0.5% threshold) and blocks trading signals during these periods
Progressive Consolidation Stages: Visual alerts progress through Range Bound (red) → Coiling (yellow) → Loading (orange) → Trending (green) to indicate market compression and potential breakout timing
Market Attention Gauge: Helps manage focus between active trading and other activities with states: Active (watch close), Building (check frequently), Quiet (check occasionally), Dead (handle other business)
Smart RSI Exits: Cloud-based and RSI extreme level exits with conservative stop losses
Dual Mode Operation: Separate settings allow full backtesting performance while providing visual stay-out warnings for manual trading
How to Use:
Entry Signals: Trade aqua up-triangles (long) and orange down-triangles (short) when they appear with volume confirmation
Stay-Out Warnings: Ignore gray "RANGE" triangles - these indicate crossovers during range-bound periods that should be avoided
Monitor Top-Right Display:
Range: Current 60-bar dollar range
Attention: Market activity level for focus management
Status: Consolidation stage (trade green/yellow, avoid red, prepare for orange)
Position Sizing: Default 167 shares per signal, optimized for the crossover frequency
Alerts: Enable consolidation stage alerts and market attention alerts for automated notifications
Recommended Settings:
Timeframe: 1-minute charts
Symbol: Optimized for volatile stocks like TSLA
"Apply Filter to Backtest": Keep OFF for realistic backtesting, ON to see filtered results
Risk Management:
The strategy includes built-in overtrading protection by identifying and blocking trades during low-volatility periods. The progressive consolidation alerts help identify when markets are "loading" for significant moves, allowing traders to position appropriately for higher-probability setups.
MS - Crypto RSI-Based Trading StrategyThis is a comprehensive trend-following and momentum-based strategy designed for the cryptocurrency market. It combines multiple leading indicators to filter out market noise and generate high-quality buy and sell signals.
Key Indicators:
Moving Average (MA): To determine the main trend direction.
Relative Strength Index (RSI): To measure momentum and identify overbought/oversold conditions.
Directional Movement Index (DMI): To confirm the strength of the trend.
Volume & ATR: To validate market interest and filter out excessive volatility.
Buy Conditions (All Must Be True):
Price and Trend Alignment: The current price is above the MA50 (with a 5% buffer).
Momentum Confirmation: The RSI is between 50 and 70.
Trend Strength: The +DI is greater than the -DI.
Market Interest: Volume is 1.5 times its moving average.
Low Volatility: The ATR is below its average.
Sell Conditions (Any One Is True):
Trend Reversal: The price drops below the MA50 (with a 5% buffer).
Momentum Loss: The RSI drops below 45.
Trend Weakness: The -DI crosses above the +DI.
Market Fatigue: Volume drops below 50% of its moving average.
High Volatility: The ATR is above its average.
Disclaimer: This is a backtesting tool and not financial advice. Past performance is not an indicator of future results. Always use proper risk management and conduct your own research before trading.

SY_Quant_AI_YJ✅ English Description (Safe Minimal Version)
SY_Quant_AI_YJ— Multi-Factor Trend Analysis Toolkit
This indicator combines trend detection, structure recognition, and visual overlays to assist traders in analyzing market dynamics.
It integrates common techniques in a simplified form for research and chart-based strategy development.
Dual MACD Strategy [Js.k]Strategy Overview
The Dual MACD Strategy leverages two MACD indicators with different parameters to generate buy and sell signals. By combining the trend-following properties of MACD with specific entry/exit criteria, this strategy aims to capture significant price movements while effectively managing risk.
Entry and Exit Conditions
Long Entry: A buy signal is triggered when:
The histogram of MACD1 crosses above zero.
The histogram of MACD2 is positive and rising.
Short Entry: A sell signal is triggered when:
The histogram of MACD1 crosses below zero.
The histogram of MACD2 is negative and declining.
Risk Management
Stop Loss and Take Profit:
Stop Loss is set at 1% below the entry price for long positions and 1% above the entry price for short positions.
Take Profit is set at 1.5% above the entry price for long positions and 1.5% below the entry price for short positions.
Position Sizing: Each trade risks a maximum of 10% of account equity, keeping potential losses manageable and in line with standard trading practices.
Backtesting Results
The strategy is tested on BTCUSDT with a time frame of 1 hour, resulting in 200+ trades.
The initial capital for backtesting is set to $10,000, with a realistic commission of 0.04% and a slippage of 2 ticks.
Conclusion
This strategy is inspired by Dreadblitz's Double MACD Buy and Sell, as well as some YouTube videos. My purpose in redeveloping them into this strategy is to validate the practicality of the Double MACD. After multiple modifications, this is the final version. I believe its profitability is limited and may lead to losses; please do not use this strategy for live trading.

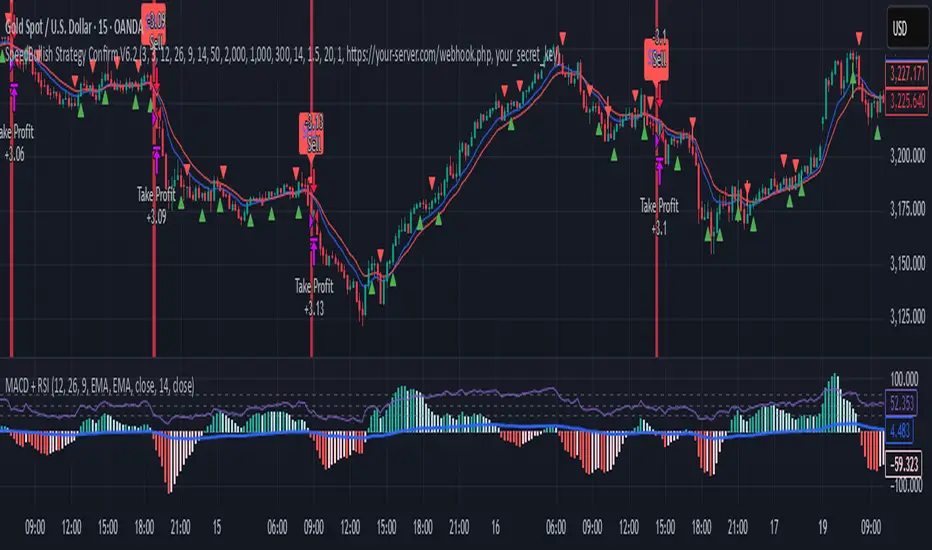
SpeedBullish Strategy Confirm V6.2SpeedBullish Strategy Confirm V6.2
SpeedBullish V6.2 is an advanced price-action + indicator-based strategy designed to confirm trend strength and signal entries with high precision. This version builds on the W/M pattern structure and adds dynamic filtering with EMA, MACD Histogram, RSI, ATR, and Volume.
✅ Signal Conditions
🔹 Buy Signal:
Price above EMA10 or EMA15
MACD Histogram crosses above 0
RSI > 50
(Optional) Higher low via Pivot Low
(Optional) ATR > ATR SMA * Multiplier
(Optional) Volume > SMA * Multiplier
🔻 Sell Signal:
Price below EMA10 or EMA15
MACD Histogram crosses below 0
RSI < 50
(Optional) Lower high via Pivot High
(Optional) Confirmed high volatility and volume
⚙️ Strategy Features
MACD Histogram for momentum shift detection
RSI filtering for momentum confirmation
EMA10/15 for trend direction
ATR-based volatility filter
Volume confirmation filter
Dynamic TP/SL + Trailing Stop
Webhook Integration for MT5 auto-trade
Visual signal markers + background highlight
🔔 Alerts
Alerts are sent in JSON format via alert() with the current symbol, action (buy/sell), and price. Webhook endpoint and secret key are configurable.
📈 How to Use
Attach the strategy to any symbol and timeframe
Customize filters and confirmations to fit your market conditions
Enable webhook alerts for integration with your MT5 Expert Advisor or trading bot
Backtest and optimize before live deployment
Simple Momentum and Trend, Fixed PnL Strategy for SPY 1D [SR]This strategy uses an ATR rule to assess momentum and a TSI rule to assess bullish or bearishness
It has a fixed stop at 50 points, and fixed take profit at 300 pips
It provides a very satisfyingly smooth equity line with a max drawdown below 5% and realized profit over 200%
This is the initial version as I work out optimizations and add plots to the chart based on the strategy's actions.
I would love to get the community's feedback and help as I'm new. Not sure how to limit the date range of the backtest to make it more realistic. I'm also not certain how to plot it best.

Strategy #3 HalfTrend (Originally By everget)This Strategy Based on HalfTrend Indicator(everget)
Entry Condition : Half Trend Signal
Multi Take Profit Targets Feature with Stop Lose : Fixed Target Percentage or using ATR Multipliers
Can Modify Trading Window For Backtesting
