Previous Day Breakout Trend FollowingStop and reverse system for trend following based on simple previous day high and low
Recherche dans les scripts pour "trend"

Trade Trend IndicatorThe Trade Trend Indicator (indicator) has been the brain child of 23 years of trading experience rolled into a simple to understand all market setup alert system based solely on 5 high probability trade set ups with a 6th high risk. The hope is to provide something that is can assist traders in building confidence in their trades with a little assistance from the indicator.
This like any and all indicators is not a be all and end to trading, yes while back tested the indicator has produced fantastic profitable results; past performance is not a guarantee of future but which with human intervention can increase the return result exponentially.
You need to be able to chart simple candle sticks and you need to have an understanding of support and resistance areas to make sense of what you are doing in trading otherwise even this indicator won't help you.
While this may alert buy or sell / long or short entrance these are to be taken as educational points of reference and if you wish to trade you are understanding that you enter and exit at your own risk. Not many indicators will alert you to the possibility of a rogue wave spike / dump or both, this will but everything is perspective of the time frame you are on.
The indicator is designed for the 4hour time frame with trade entry on the 15min and managed on the 30min time frame. Alot can happen within these time frame but as we know not every trader can sit in front of a screen for hours at a time and this let's one trade for swings. Once you have your entry you place your exits and you set your stops. If you wait for the alert to exit you are in a draw down this should never reach that point pay yourself for being right.
The set ups are simple:
1. Trend change from bearish to bullish buys are dip interim support entries.
2. Trend change from bullish to bearish sells are top interim resistance exits.
3. Blue buy is an entry position for a trade.
4. Blue long is an add position for a trade.
5. Red short is just that a short trade idea. (this is advanced and requires a manual cover target),
6. Green buy is a break out over the next candle to print above (highest risk)
All trades are based on a 5% to 10% of capital entry with no more than 40% ever in 1 trade goal is many consistent trade wins while limiting the losses and size.
Certain set ups such as longs over the Moving Averages but below the cloud can lead to strong rally returns as well as short in a bearish trend just above the Moving Averages can give prolonged selling pressure.
Pay attention to the golden dump line as it rises the closer to the candle it gets the higher the risk of the trade lacking continuation.
None of this is to be taken as investment advice but rather Edutainment and infotainment

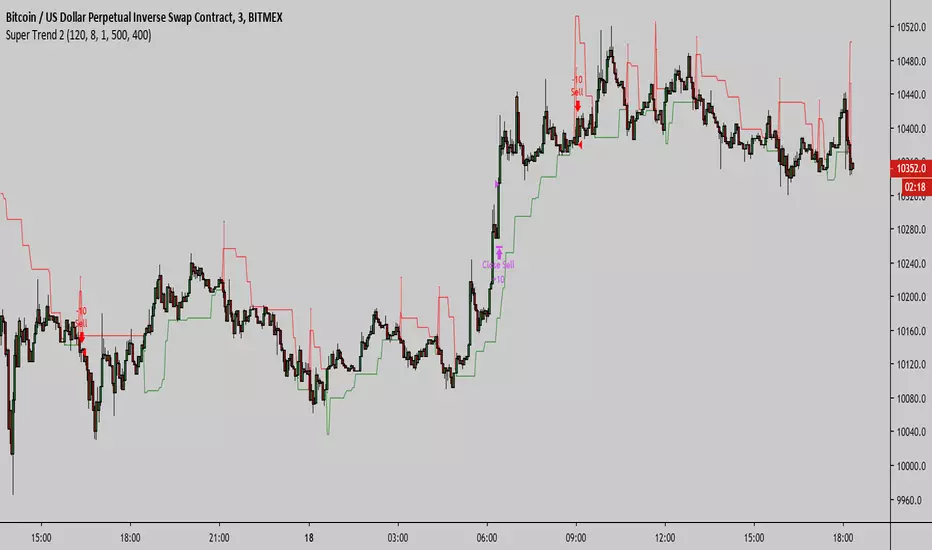
Super Trend 3Super Trend 3 Strategy migrates the version 2 script to a version 3 script to eliminate repainting.

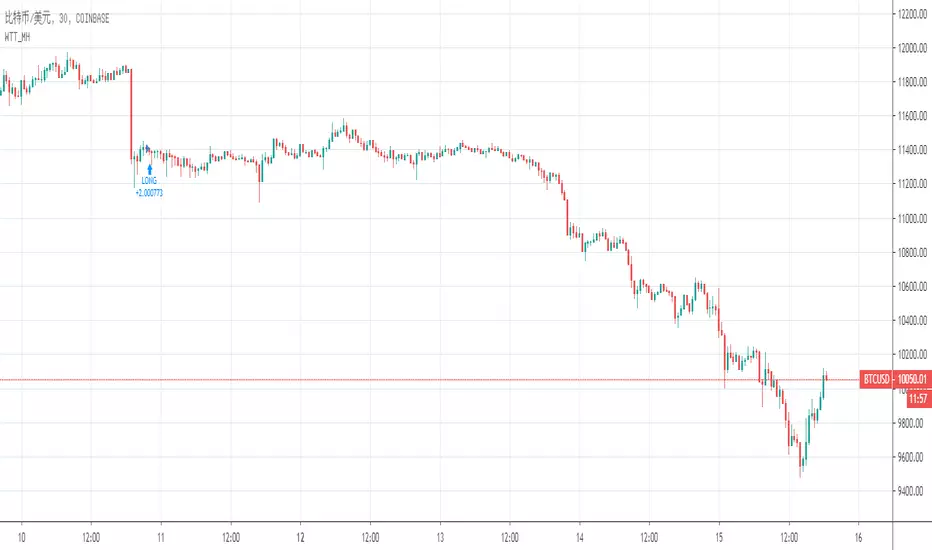
Wyckoff Trend Tracking Market HarvesterWyckoff Trend Tracking Market Harvester该工具旨在服务对市场趋势分析要求精益求精的用户。Wyckoff Trend Tracking团队融合多位国内外顶尖趋势分析专家,致力于趋势分析数十年,将最好的作品呈现给尊贵的您。
Strategy Turtle Time Exit Donchian TrendStrategy "Time Exit Donchian Trend"
Default Settings
Long Entry - EMA25 > EMA350 & Breakout highest20
Short Entry - EMA25 < EMA350 & Breakout lowest20
Exit - 80 days
Performance
* 25 symbols - fx(5) ,stock index(5) ,stock jp(5) ,stock usa(5) ,comodity(5)
* 12 years - 2005 - 2017
win -52.71%
risk reward ratio - 1.24
total trades - 848
ruin risk - 0%
edge / risk - 0.179
edge * trades - 152.12
Functions
Strategy
Pyramiding On/Off
Set Start and End

Strategy Turtle Donchian Trend SystemStrategy "Donchian Trend System"
Default Settings
Long Entry - EMA25 > EMA350 & Breakout highest20
Long Exit - Breakout lowest10 or 2-ATR
Short Entry - EMA25 < EMA350 & Breakout lowest20
Short Exit - Breakout highest10 or 2-ATR
Performance
* 25 symbols - fx(5) ,stock index(5) ,stock jp(5) ,stock usa(5) ,comodity(5)
* 12 years - 2005 - 2017
win -37.84%
risk reward ratio - 2.2
total trades - 2043
ruin risk - 0.01%
edge / risk - 0.21
edge * trades - 429.88
Functions
Strategy
Loss cut On/Off
Pyramiding On/Off
Timed Exit On/Off
Set Start and End

Noro's Trend SMA Strategy v1.3Trade strategy which uses only 2 SMA .
The slow SMA (blue) is used for definition of a trend
The fast SMA (red) is used for an entrance to the transaction
Recomended:
For H1
For crypto/fiat
Fast SMA Period = 5
Slow SMA Period = 20
In the new version 1.3
- priceChannel
In the new version 1.2
- profit became more
- the risk became less
- strategy waits for 2 candles of lonely color

Noro's Trend SMA Strategy v1.2Trade strategy which uses only 2 SMA .
The slow SMA (blue) is used for definition of a trend
The fast SMA (red) is used for an entrance to the transaction
Recomended:
For H1
For crypto/fiat
Fast SMA Period = 5
Slow SMA Period = 30
In the new version 1.2
- profit became more
- the risk became less
- strategy waits for 2 candles of lonely color

Noro's Trend SMA Strategy v1.1Trade strategy which uses only 2 SMA .
The slow SMA (blue) is used for definition of a trend
The fast SMA (red) is used for an entrance to the transaction
For H1
For crypto/fiat
In the new version 1.1
- profit became more
- the risk became less
- strategy considers color of a candle

Noro's Trend SMA StrategyTrade strategy which uses only 2 SMA.
The slow SMA (blue) is used for definition of a trend
The fast SMA (red) is used for an entrance to the transaction
For H1

Consistency Is The Key - Lazy Trend DailyA trend trading strategy with 48% winning rate and 1.327 profit factor.
Simple!
Straightforward!
No 2nd guess!

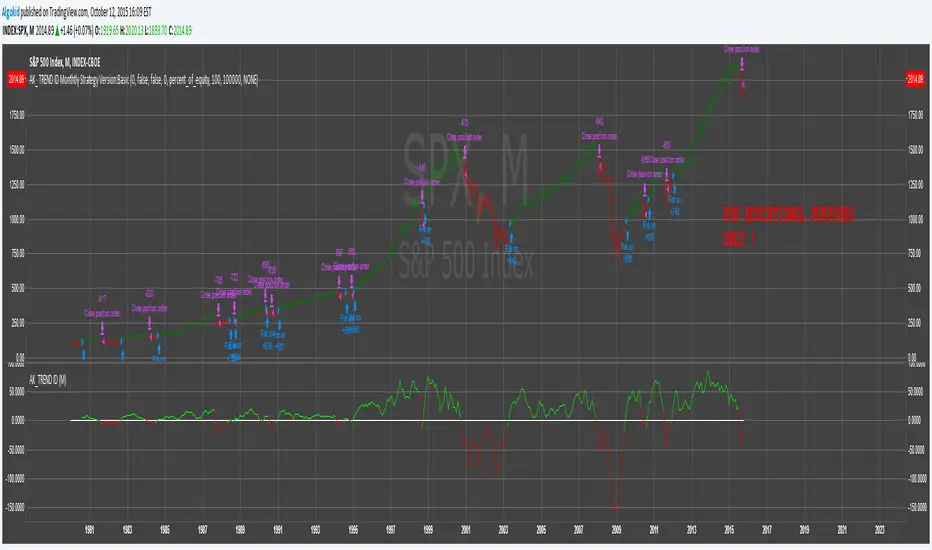
AK_ TREND ID AS A STRATEGY : FOR EDUCATIONAL PURPOSES ONLYJust converted the AK_ TREND ID into a strategy , to show the efficiency of this simple indicator. I used SPX in this example, to display that the indicator has been accurate for a long time.
Trendline Breaks with Multi Fibonacci Supertrend StrategyTMFS Strategy: Advanced Trendline Breakouts with Multi-Fibonacci Supertrend
Elevate your algorithmic trading with institutional-grade signal confluence
Strategy Genesis & Evolution
This advanced trading system represents the culmination of a personal research journey, evolving from my custom " Multi Fibonacci Supertrend with Signals " indicator into a comprehensive trading strategy. Built upon the exceptional trendline detection methodology pioneered by LuxAlgo in their " Trendlines with Breaks " indicator, I've engineered a systematic framework that integrates multiple technical factors into a cohesive trading system.
Core Fibonacci Principles
At the heart of this strategy lies the Fibonacci sequence application to volatility measurement:
// Fibonacci-based factors for multiple Supertrend calculations
factor1 = input.float(0.618, 'Factor 1 (Weak/Fibonacci)', minval = 0.01, step = 0.01)
factor2 = input.float(1.618, 'Factor 2 (Medium/Golden Ratio)', minval = 0.01, step = 0.01)
factor3 = input.float(2.618, 'Factor 3 (Strong/Extended Fib)', minval = 0.01, step = 0.01)
These precise Fibonacci ratios create a dynamic volatility envelope that adapts to changing market conditions while maintaining mathematical harmony with natural price movements.
Dynamic Trendline Detection
The strategy incorporates LuxAlgo's pioneering approach to trendline detection:
// Pivotal swing detection (inspired by LuxAlgo)
pivot_high = ta.pivothigh(swing_length, swing_length)
pivot_low = ta.pivotlow(swing_length, swing_length)
// Dynamic slope calculation using ATR
slope = atr_value / swing_length * atr_multiplier
// Update trendlines based on pivot detection
if bool(pivot_high)
upper_slope := slope
upper_trendline := pivot_high
else
upper_trendline := nz(upper_trendline) - nz(upper_slope)
This adaptive trendline approach automatically identifies key structural market boundaries, adjusting in real-time to evolving chart patterns.
Breakout State Management
The strategy implements sophisticated state tracking for breakout detection:
// Track breakouts with state variables
var int upper_breakout_state = 0
var int lower_breakout_state = 0
// Update breakout state when price crosses trendlines
upper_breakout_state := bool(pivot_high) ? 0 : close > upper_trendline ? 1 : upper_breakout_state
lower_breakout_state := bool(pivot_low) ? 0 : close < lower_trendline ? 1 : lower_breakout_state
// Detect new breakouts (state transitions)
bool new_upper_breakout = upper_breakout_state > upper_breakout_state
bool new_lower_breakout = lower_breakout_state > lower_breakout_state
This state-based approach enables precise identification of the exact moment when price breaks through a significant trendline.
Multi-Factor Signal Confluence
Entry signals require confirmation from multiple technical factors:
// Define entry conditions with multi-factor confluence
long_entry_condition = enable_long_positions and
upper_breakout_state > upper_breakout_state and // New trendline breakout
di_plus > di_minus and // Bullish DMI confirmation
close > smoothed_trend // Price above Supertrend envelope
// Execute trades only with full confirmation
if long_entry_condition
strategy.entry('L', strategy.long, comment = "LONG")
This strict requirement for confluence significantly reduces false signals and improves the quality of trade entries.
Advanced Risk Management
The strategy includes sophisticated risk controls with multiple methodologies:
// Calculate stop loss based on selected method
get_long_stop_loss_price(base_price) =>
switch stop_loss_method
'PERC' => base_price * (1 - long_stop_loss_percent)
'ATR' => base_price - long_stop_loss_atr_multiplier * entry_atr
'RR' => base_price - (get_long_take_profit_price() - base_price) / long_risk_reward_ratio
=> na
// Implement trailing functionality
strategy.exit(
id = 'Long Take Profit / Stop Loss',
from_entry = 'L',
qty_percent = take_profit_quantity_percent,
limit = trailing_take_profit_enabled ? na : long_take_profit_price,
stop = long_stop_loss_price,
trail_price = trailing_take_profit_enabled ? long_take_profit_price : na,
trail_offset = trailing_take_profit_enabled ? long_trailing_tp_step_ticks : na,
comment = "TP/SL Triggered"
)
This flexible approach adapts to varying market conditions while providing comprehensive downside protection.
Performance Characteristics
Rigorous backtesting demonstrates exceptional capital appreciation potential with impressive risk-adjusted metrics:
Remarkable total return profile (1,517%+)
Strong Sortino ratio (3.691) indicating superior downside risk control
Profit factor of 1.924 across all trades (2.153 for long positions)
Win rate exceeding 35% with balanced distribution across varied market conditions
Institutional Considerations
The strategy architecture addresses execution complexities faced by institutional participants with temporal filtering and date-range capabilities:
// Time Filter settings with flexible timezone support
import jason5480/time_filters/5 as time_filter
src_timezone = input.string(defval = 'Exchange', title = 'Source Timezone')
dst_timezone = input.string(defval = 'Exchange', title = 'Destination Timezone')
// Date range filtering for precise execution windows
use_from_date = input.bool(defval = true, title = 'Enable Start Date')
from_date = input.time(defval = timestamp('01 Jan 2022 00:00'), title = 'Start Date')
// Validate trading permission based on temporal constraints
date_filter_approved = time_filter.is_in_date_range(
use_from_date, from_date, use_to_date, to_date, src_timezone, dst_timezone
)
These capabilities enable precise execution timing and market session optimization critical for larger market participants.
Acknowledgments
Special thanks to LuxAlgo for the pioneering work on trendline detection and breakout identification that inspired elements of this strategy. Their innovative approach to technical analysis provided a valuable foundation upon which I could build my Fibonacci-based methodology.
This strategy is shared under the same Attribution-NonCommercial-ShareAlike 4.0 International (CC BY-NC-SA 4.0) license as LuxAlgo's original work.
Past performance is not indicative of future results. Conduct thorough analysis before implementing any algorithmic strategy.

Price-Volume w Trendline - Strategy [presentTrading]█ Introduction and How it is Different
The Price-Volume with Trendline Strategy is an innovative strategy that combines volume profile analysis, price-based Z-scores, and dynamic trendline filtering to identify optimal entry and exit points in the market. What sets this strategy apart is the integration of volume concentration (Point of Control or PoC) with dynamic volatility thresholds. Additionally, this strategy introduces a multi-step take profit (TP) mechanism that adjusts based on predefined levels, allowing traders to exit trades progressively while capitalizing on market momentum.
BTCUSD 6hr LS Performance
█ Strategy, How it Works: Detailed Explanation
The combination of multiple indicators and methodologies serves to create a more robust and reliable trading system. Each element is carefully chosen for its complementary role in providing accurate signals while minimizing false entries and exits. Here’s why the different components were chosen and how they work together:
- PoC and Z-Scores: The volume profile identifies key price areas, while the Z-score measures deviations from the mean. Together, they highlight points where the market is likely to react. For example, when the Z-score indicates an oversold condition near a PoC support level, it increases the probability of a reversal, providing a clear entry signal.
- Trendlines and Z-Scores: Trendlines serve as a secondary filter to ensure that price deviations identified by Z-scores align with broader market trends. This ensures that trades are only entered when the price has both deviated from its average and broken through a significant trendline level, reducing the likelihood of false signals.
- Multi-Step TP and Risk Management: Finally, the multi-step take profit logic works in tandem with the entry signals generated by the PoC, Z-scores, and trendlines. As the price moves in favor of the trade, profits are gradually locked in, ensuring the trader captures gains while still leaving room for further upside.
🔶 Point of Control (PoC) and Volume Profile Analysis
The PoC identifies the price level with the highest volume concentration within a specified lookback period. This price level represents where the most trading activity has occurred, often acting as a strong support or resistance. By breaking down the range into several rows (bins), the strategy identifies how much volume was traded at each price level.
🔶 Z-Score Calculation
The Z-score is a statistical metric that measures how far the current price is from its mean, expressed in terms of standard deviations. This is calculated both for price deviation and PoC-based deviation.
🔶 Trendline Breakout Filtering
The trendline filtering is a crucial aspect that refines entry signals by confirming trend continuation or reversals. It calculates trendlines based on pivot highs and lows using the selected method (e.g., ATR or standard deviation).
🔶 Multi-Step Take Profit
The multi-step take profit mechanism allows the strategy to take partial profits at several predefined levels. For example, when the price reaches 3%, 8%, 14%, or 21% above (or below) the entry price, it exits portions of the position. This is a useful technique for locking in profits as the market moves favorably.
Local
█ Usage
The Price-Volume with Trendline Strategy can be applied to various asset classes, including stocks, cryptocurrencies, and commodities. It is particularly effective in volatile markets where price deviations and volume concentrations signal potential reversals or trend continuations. By adjusting the settings for volatility and the lookback period, this strategy can be tailored to both short-term intraday trades and longer-term swing trades.
█ Default Settings
The default settings in the strategy play a vital role in shaping its performance.
- POC_lookbackLength (144): This defines the number of bars used to calculate the PoC. A longer lookback captures more data, leading to a more stable PoC, but may result in delayed signals. A shorter lookback increases responsiveness but may introduce noise.
- priceDeviationLength (200): This determines the period for calculating the standard deviation of price. A higher length smooths out the volatility, reducing the likelihood of false signals. Shorter lengths make the strategy more sensitive to sudden price movements.
- TL_length (14): Controls the swing detection period for trendline calculation. A shorter length will generate more frequent trendline breakouts, while a longer length captures only significant moves.
- Stop Loss and Take Profit: The strategy offers both fixed and SuperTrend-based stop losses. SuperTrend is adaptive to volatility, while fixed stop losses provide simpler risk control. The multi-step take profit ensures that profits are secured progressively, which can improve performance in trending markets by reducing the risk of full reversals.
Each of these settings can significantly affect the strategy’s risk-reward balance. For instance, increasing the stop loss level or the take profit percentages allows the strategy to stay in trades longer, potentially increasing profit per trade but at the cost of larger drawdowns. Conversely, tighter stops and smaller profit targets result in more frequent trades with lower average profit per trade.

Trend Following Parabolic Buy Sell Strategy [TradeDots]The Trend Following Parabolic Buy-Sell Strategy leverages the Parabolic SAR in combination with moving average crossovers to deliver buy and sell signals within a trend-following framework.
This strategy synthesizes proven methodologies sourced from various trading tutorials available on platforms such as YouTube and blogs, enabling traders to conduct robust backtesting on their selected trading pairs to assess the strategy's effectiveness.
HOW IT WORKS
This strategy employs four key indicators to orchestrate its trading signals:
1. Trend Alignment: It first assesses the relationship between the price and the predominant trendline to determine the directional stance—taking long positions only when the price trends above the moving average, signaling an upward market trajectory.
2. Momentum Confirmation: Subsequent to trend alignment, the strategy looks for moving average crossovers as a confirmation that the price is gaining momentum in the direction of the intended trades.
3. Signal Finalization: Finally, buy or sell signals are validated using the Parabolic SAR indicator. A long order is validated when the closing price is above the Parabolic SAR dots, and similarly, conditions are reversed for short orders.
4. Risk Management: The strategy institutes a fixed stop-loss at the moving average trendline and a take-profit level determinable by a prefixed risk-reward ratio calculated from the moving average trendline. These parameters are customizable by the users within the strategy settings.
APPLICATION
Designed for assets exhibiting pronounced directional momentum, this strategy aims to capitalize on clear trend movements conducive to achieving set take-profit targets.
As a lagging strategy that waits for multiple confirmatory signals, entry into trades might occasionally lag beyond optimal timing.
Furthermore, in periods of consolidation or sideways movement, the strategy may generate several false signals, suggesting the potential need for additional market condition filters to enhance signal accuracy during volatile phases.
DEFAULT SETUP
Commission: 0.01%
Initial Capital: $10,000
Equity per Trade: 70%
Users are advised to adjust and personalize this trading strategy to better match their individual trading preferences and style.
RISK DISCLAIMER
Trading entails substantial risk, and most day traders incur losses. All content, tools, scripts, articles, and education provided by TradeDots serve purely informational and educational purposes. Past performances are not definitive predictors of future results.

Dynamic Trendline Break - Strategy [presentTrading]- Introduction and How It Is Different
The Dynamic Trendline Break Strategy is a unique trading algorithm that leverages the power of trendlines and swing detection to identify potential trading opportunities.
Unlike traditional trendline strategies that rely on static trendlines, this strategy dynamically calculates trendlines based on pivot highs and lows.
This dynamic approach allows the strategy to adapt to changing market conditions (especially 24hr markets like Crypto) and potentially identify trading opportunities that static trendlines might miss.
BTCUSD 6hr chart
Tencent 700.HK 1D chart
- Strategy, How It Works
The strategy works by first identifying pivot highs and lows using a lookback period defined by the user. These pivot points are then used to calculate the slope of the trendlines. The slope calculation method can be chosen from three options: Average True Range (ATR), Standard Deviation (Stdev), or Linear Regression (Linreg), providing flexibility to the trader.
Once the trendlines are calculated, the strategy identifies potential trading opportunities when the price crosses over the upper trendline (for long trades) or crosses under the lower trendline (for short trades). The strategy also allows the user to define the trade direction (Long, Short, or Both) and the stop loss method (Fixed or SuperTrend).
- Trade Direction
The trade direction parameter allows the user to define the direction of the trades that the strategy will take. If set to "Long", the strategy will only take long trades when the price crosses over the upper trendline. If set to "Short", the strategy will only take short trades when the price crosses under the lower trendline. If set to "Both", the strategy will take both long and short trades.
- Usage
To use this strategy, simply input your desired parameters for the swing detection lookback, slope, slope calculation method, trade direction, stop loss method, and stop loss level. Once these parameters are set, the strategy will automatically calculate the trendlines and identify potential trading opportunities based on the defined parameters.
- Default Settings
The default settings for the strategy are as follows:
Swing Detection Lookback: 30
Slope: 0.618
Slope Calculation Method: ATR
Trade Direction: Both
Stop Loss Method: SuperTrend
Stop Loss Level: 15%
SuperTrend Factor: 3
SuperTrend Lookback: 21
These settings can be adjusted to suit your trading style and risk tolerance. Always remember to backtest any changes to the settings before live trading.

Rate Of Change Trend Strategy (ROC)This is very simple trend following or momentum strategy. If the price change over the past number of bars is positive, we buy. If the price change over the past number of bars is negative, we sell. This is surprisingly robust, simple, and effective especially on trendy markets such as cryptos.
Works for many markets such as:
INDEX:BTCUSD
INDEX:ETHUSD
SP:SPX
NASDAQ:NDX
NASDAQ:TSLA

Trend-Following & Breakout — Index Quant Strategy (NASDAQ)📈 Trend-Following & Breakout — Index Quant Strategy (NASDAQ & S&P 500)
Type: Invite-only strategy
Markets: NASDAQ 100 (NAS100 / US100 / NQ), S&P 500 (US500 / SPX), and other major equity indices.
🧠 Concept: Continuous trend model combining EWMAC (trend-following) and Donchian (breakout) signals, scaled by forecast strength and portfolio risk.
⚙️ Execution: Rebalances only on decision-bar closes, using hysteresis and a no-trade band to reduce churn.
📊 Default bias: Long-only — aligned with equity index drift.
🧩 How it works
• EWMAC Trend: Difference between fast and slow EMAs, normalized by an EWMA of absolute returns.
• Donchian Breakout: Distance beyond a 200-bar channel (Strict mode) or relative z-score position within it.
• Forecast combination: Weighted sum of trend and breakout points, clamped to ± capPoints.
• Hysteresis: Prevents quick sign flips near zero forecast.
• Risk scaling: Maps forecast strength to position size using equity × risk budget × ATR-based stop distance.
• Rebalance: Executes only if the required quantity change exceeds the Δqty threshold; can optionally block increases on Sundays (for CFDs).
⚙️ Default parameters
Deployed on NQ / US100 / NAS100 on Daily Timeframe
• Decision timeframe = 360 min (other options from 1 min to 1 week).
• Trend (EWMAC): Fast = 64, Slow = 256, Vol Norm = 32, Weight = 0.8.
• Breakout (Donchian): Length = 200, Mode = Strict, Weight = 0.2.
• Forecast scaling: ptsPerSigma = 1.0, capPoints = 10.
• Risk % per rebalance = 4 % of equity.
• ATR stop: ATR(14) × 1.0.
• No-trade band (Δqty) = 4 units.
• Hysteresis = 2 forecast points.
• Bias = Long-only (Neutral / Long-bias 50 % optional).
• Skip Sunday increases = false (default).
📋 Backtest properties (documented)
• Initial capital = 100 000 USD.
• Commission = 0.20 % per trade.
• Pyramiding = 10.
• Calc on every tick = false.
• Point value = 1 (for NAS100 CFD).
• No financing or slippage modeled.
• If using CFDs, account for overnight funding.
• On futures (NQ / ES), carry is implicit.
📊 Typical behaviour
• Many small scratches, a few large winners.
• Performs best during multi-week / multi-month trends.
• Underperforms in tight or volatile ranges.
• Average hold ≈ 30 – 90 days in historical tests.
💡 Risk and performance guide (illustrative)
Sharpe ≈ 1.25
Sortino ≈ 1.10 – 1.30
Max drawdown ≈ –18 % to –25 %
Annual volatility ≈ 24 – 28 %
CAGR ≈ 50 – 60 % (at 4 % risk)
Edge ratio ≈ 5 (MFE / MAE)
Historical backtests only — past performance does not guarantee future results.
🌍 Intended markets and timeframes
Optimized for NASDAQ 100 and S&P 500; also effective on similar indices (DAX, Dow Jones, FTSE).
Best on Daily or higher timeframes.
Aligns with long-term index drift — suitable for long-bias systematic trend portfolios.
⚠️ Limitations
• Backtests exclude CFD funding costs.
• Trend models will have losing streaks in range-bound markets.
• Designed for experienced traders seeking systematic exposure.
🔑 Requesting access
Send a private TradingView message to with the text:
“Request access to Trend-Following & Breakout — Index Quant Strategy.”
Access is granted only on explicit request.
For further information, see my TradingView Signature.
🆕 Release notes (v1.0)
• Initial release (360 min TF): EWMAC 64/256 + Donchian 200 Strict.
• Risk 4 %, ATR × 1.0, Long-only bias, hysteresis 2 pts, Δqty ≥ 4.
• Developed for NASDAQ 100 and S&P 500 indices.
• Implements continuous risk-scaled positioning and no-trade band logic.
🧾 Originality statement
This strategy is original work built entirely from TradingView built-ins (EMA, ATR, Highest, Lowest).
It does not reuse open-source invite-only code.
Any future reuse of open scripts will be done with explicit permission and credit.

Trendline Breakout Strategy [KedArc Quant] Description
A single, rule-based system that builds two trendlines from confirmed swing pivots and trades their breakouts, with optional retest, trend-regime gates (EMA / HTF EMA), and ATR-based risk. All parts serve one decision flow: structure → breakout → gated entry → managed risk.
What it does (for traders)
Draws Up line (teal) through the last two Higher Lows and Down line (red) through the last two Lower Highs, then extends them forward.
Long when price breaks above red; Short when price breaks below teal.
Optional Retest entry: after a break, wait for a pullback toward the broken line within an ATR-scaled buffer.
Uses ATR stop and R-multiple target so risk is consistent across symbols/timeframes.
Labels HL1/HL2/LH1/LH2 so non-coders can verify which pivots built each line.
Why these components are combined
Pure breakout systems on trendlines suffer from three practical issues:
False breaks in chop → solved by trend-regime gates (EMA / HTF EMA) that only allow trades aligned with the prevailing trend.
Uneven volatility across markets/timeframes → solved by ATR-based stop/target, normalizing distance so R-multiples are comparable.
First break whipsaws near wedge apices → mitigated by the optional retest rule that demands a pullback/hold before entry.
These modules are not separate indicators with their own signals. They are support roles inside one method.
The pivot engine defines structure, the breakout detector defines signal, the regime gates decide if we’re allowed to take that signal, and the ATR module sizes risk.
Together they make the trendline breakout usable, testable, and explainable.
How it works (mechanism; each component explained)
1) Pivot engine (structure, non-repainting)
Swings are confirmed with ta.pivotlow/high(L, R). A pivot only exists after R bars (no look-ahead), so once plotted, the line built from those pivots will not repaint.
2) Trendline builder (geometry)
Teal line updates when two consecutive pivot lows satisfy HL2.price > HL1.price (and HL2 occurs after HL1).
Red line updates when two consecutive pivot highs satisfy LH2.price < LH1.price.
Lines are extended right and their current value is read every bar via line.get_price().
3) Breakout detector (signal)
On every bar, compute:
crossover(close, redLine) ⇒ Long breakout
crossunder(close, tealLine) ⇒ Short breakdown
4) Regime gates (trend filters, not separate signals)
EMA gate: allow longs only if close > EMA(len), shorts only if close < EMA(len).
HTF EMA gate (optional): same rule on a higher timeframe to avoid fighting the larger trend.
These do not create entries; they simply permit or block the breakout signal.
5) Retest module (optional confirmation)
After a breakout, record the line price. A valid retest occurs if price pulls back within an ATR-scaled buffer toward that broken line and then closes back in the breakout direction.
This reduces first-tick fakeouts.
6) Risk module (position exit)
Initial stop = ATR(len) × atrMult from entry.
Target = tpR × (ATR × atrMult) (e.g., 2R).
This keeps results consistent across instruments/timeframes.
Entries & exits
Long entry
Base: close breaks above red and passes EMA/HTF gates.
Retest (if enabled): after the break, price pulls back near the broken red line (within the ATR buffer) and holds; then enter.
Short entry
Mirror logic with teal (break below & gates), optionally with a retest.
Exit
strategy.exit places ATR stop & R-multiple target automatically.
Optional “flip”: close if the opposite base signal triggers.
How to use it (step-by-step)
Timeframe: 1–15m for intraday, 1–4h for swing.
Start defaults: Pivot L/R = 5, EMA len = 200, ATR len = 14, ATR mult = 2, TP = 2R, Retest = ON.
Tune sensitivity:
Faster lines (more trades): set L/R = 3–4.
Fewer counter-trend trades: enable HTF EMA (e.g., 60-min or Daily).
Visual audit: labels HL1/HL2 & LH1/LH2 show which pivots built each line—verify by eye.
Alerts: use Long breakout, Short breakdown, and Retest alerts to automate.
Originality (why it merits publication)
Trades the visualization: many “auto-trendline” tools only draw lines; this one turns them into testable, alertable rules.
Integrated design: each component has a defined role in the same pipeline—no unrelated indicators bolted together.
Transparent & non-repainting: pivot confirmation removes look-ahead; labels let non-coders understand the setup that produced each signal.
Notes & limitations
Lines update only after pivot confirmation; that lag is intentional to avoid repainting.
Breakouts near an apex can whipsaw; prefer Retest and/or HTF gate in choppy regimes.
Backtests are idealized; forward-test and size risk appropriately.
⚠️ Disclaimer
This script is provided for educational purposes only.
Past performance does not guarantee future results.
Trading involves risk, and users should exercise caution and use proper risk management when applying this strategy.

The Most Powerful TQQQ EMA Crossover Trend Trading StrategyTQQQ EMA Crossover Strategy Indicator
Meta Title: TQQQ EMA Crossover Strategy - Enhance Your Trading with Effective Signals
Meta Description: Discover the TQQQ EMA Crossover Strategy, designed to optimize trading decisions with fast and slow EMA crossovers. Learn how to effectively use this powerful indicator for better trading results.
Key Features
The TQQQ EMA Crossover Strategy is a powerful trading tool that utilizes Exponential Moving Averages (EMAs) to identify potential entry and exit points in the market. Key features of this indicator include:
**Fast and Slow EMAs:** The strategy incorporates two EMAs, allowing traders to capture short-term trends while filtering out market noise.
**Entry and Exit Signals:** Automated signals for entering and exiting trades based on EMA crossovers, enhancing decision-making efficiency.
**Customizable Parameters:** Users can adjust the lengths of the EMAs, as well as take profit and stop loss multipliers, tailoring the strategy to their trading style.
**Visual Indicators:** Clear visual plots of the EMAs and exit points on the chart for easy interpretation.
How It Works
The TQQQ EMA Crossover Strategy operates by calculating two EMAs: a fast EMA (default length of 20) and a slow EMA (default length of 50). The core concept is based on the crossover of these two moving averages:
- When the fast EMA crosses above the slow EMA, it generates a *buy signal*, indicating a potential upward trend.
- Conversely, when the fast EMA crosses below the slow EMA, it produces a *sell signal*, suggesting a potential downward trend.
This method allows traders to capitalize on momentum shifts in the market, providing timely signals for trade execution.
Trading Ideas and Insights
Traders can leverage the TQQQ EMA Crossover Strategy in various market conditions. Here are some insights:
**Scalping Opportunities:** The strategy is particularly effective for scalping in volatile markets, allowing traders to make quick profits on small price movements.
**Swing Trading:** Longer-term traders can use this strategy to identify significant trend reversals and capitalize on larger price swings.
**Risk Management:** By incorporating customizable stop loss and take profit levels, traders can manage their risk effectively while maximizing potential returns.
How Multiple Indicators Work Together
While this strategy primarily relies on EMAs, it can be enhanced by integrating additional indicators such as:
- **Relative Strength Index (RSI):** To confirm overbought or oversold conditions before entering trades.
- **Volume Indicators:** To validate breakout signals, ensuring that price movements are supported by sufficient trading volume.
Combining these indicators provides a more comprehensive view of market dynamics, increasing the reliability of trade signals generated by the EMA crossover.
Unique Aspects
What sets this indicator apart is its simplicity combined with effectiveness. The reliance on EMAs allows for smoother signals compared to traditional moving averages, reducing false signals often associated with choppy price action. Additionally, the ability to customize parameters ensures that traders can adapt the strategy to fit their unique trading styles and risk tolerance.
How to Use
To effectively utilize the TQQQ EMA Crossover Strategy:
1. **Add the Indicator:** Load the script onto your TradingView chart.
2. **Set Parameters:** Adjust the fast and slow EMA lengths according to your trading preferences.
3. **Monitor Signals:** Watch for crossover points; enter trades based on buy/sell signals generated by the indicator.
4. **Implement Risk Management:** Set your stop loss and take profit levels using the provided multipliers.
Regularly review your trading performance and adjust parameters as necessary to optimize results.
Customization
The TQQQ EMA Crossover Strategy allows for extensive customization:
- **EMA Lengths:** Change the default lengths of both fast and slow EMAs to suit different time frames or market conditions.
- **Take Profit/Stop Loss Multipliers:** Adjust these values to align with your risk management strategy. For instance, increasing the take profit multiplier may yield larger gains but could also increase exposure to market fluctuations.
This flexibility makes it suitable for various trading styles, from aggressive scalpers to conservative swing traders.
Conclusion
The TQQQ EMA Crossover Strategy is an effective tool for traders seeking an edge in their trading endeavors. By utilizing fast and slow EMAs, this indicator provides clear entry and exit signals while allowing for customization to fit individual trading strategies. Whether you are a scalper looking for quick profits or a swing trader aiming for larger moves, this indicator offers valuable insights into market trends.
Incorporate it into your TradingView toolkit today and elevate your trading performance!

[tradinghook] - Renko Trend Reversal Strategy - Renko Trend Reversal Strategy
Short Title: - Renko TRS
Description:
The Renko Trend Reversal Strategy ( - Renko TRS) is a powerful and original trading approach designed to identify trend reversals in financial markets using Renko charts. Renko charts differ from traditional time-based charts, as they focus solely on price movements and ignore time, resulting in a clearer representation of market trends. This strategy leverages Renko charts in conjunction with the Average True Range (ATR) to capture trend reversals with high precision and effectiveness.
Key Concepts:
Renko Charts: Renko charts are unique chart types that only plot price movements beyond a predefined brick size, ignoring time and noise. By doing so, they provide a more straightforward depiction of market trends, eliminating insignificant price fluctuations and making it easier to spot trend reversals.
Average True Range (ATR): The strategy utilizes the ATR indicator, which measures market volatility and provides valuable insights into potential price movements. By setting the brick size of the Renko chart based on the ATR, the strategy adapts to changing market conditions, ensuring optimal performance across various instruments and timeframes.
How it Works:
The Renko Trend Reversal Strategy is designed to identify trend reversal points and generate buy or sell signals based on the following principles:
Renko Brick Generation: The strategy calculates the ATR over a user-defined period (ATR Length) and utilizes this value to determine the size of Renko bricks. Larger ATR values result in bigger bricks, capturing higher market volatility, while smaller ATR values create smaller bricks for calmer market conditions.
Buy and Sell Signals: The strategy generates buy signals when the Renko chart's open price crosses below the close price, indicating a potential bullish trend reversal. Conversely, sell signals are generated when the open price crosses above the close price, suggesting a bearish trend reversal. These signals help traders identify potential entry points to capitalize on market movements.
Stop Loss and Take Profit Management: To manage risk and protect profits, the strategy incorporates dynamic stop-loss and take-profit levels. The stop-loss level is calculated as a percentage of the Renko open price, ensuring a fixed risk amount for each trade. Similarly, the take-profit level is set as a percentage of the Renko open price to secure potential gains.
How to Use:
Inputs: Before using the strategy, traders can customize several parameters to suit their trading preferences. These inputs include the ATR Length, Stop Loss Percentage, Take Profit Percentage, Start Date, and End Date. Adjusting these settings allows users to optimize the strategy for different market conditions and risk tolerances.
Chart Setup: Apply the - Renko TRS script to your desired financial instrument and timeframe on TradingView. The Renko chart will dynamically adjust its brick size based on the ATR Length parameter.
Buy and Sell Signals: The strategy will generate green "Buy" labels below bullish reversal points and red "Sell" labels above bearish reversal points on the Renko chart. These labels indicate potential entry points for long and short trades, respectively.
Risk Management: The strategy automatically calculates stop-loss and take-profit levels based on the user-defined percentages. Traders can ensure proper risk management by using these levels to protect their capital and secure profits.
Backtesting and Optimization: Before implementing the strategy live, traders are encouraged to backtest it on historical data to assess its performance across various market conditions. Adjust the input parameters through optimization to find the most suitable settings for specific instruments and timeframes.
Conclusion:
The - Renko Trend Reversal Strategy is a unique and versatile tool for traders looking to identify trend reversals with greater accuracy. By combining Renko charts and the Average True Range (ATR) indicator, this strategy adapts to market dynamics and provides clear entry and exit signals. Traders can harness the power of Renko charts while effectively managing risk through stop-loss and take-profit levels. Before using the strategy in live trading, backtesting and optimization will help traders fine-tune the parameters for optimal performance. Start exploring trend reversals with the - Renko TRS and take your trading to the next level.
(Note: This description is for illustrative purposes only and does not constitute financial advice. Traders are advised to thoroughly test the strategy and exercise sound risk management practices when trading in real markets.)
