Single Prints - Session Initial BalancesDisclaimer: Expose yourself to the knowledge of different trading methods. If you are unaware of what a Single Print is then do some research and broaden your knowledge.
This indicator has only been tested on BTCUSDT Binance pair. This indicator is meant to be used on the 30 minute timeframe to highlight Single Prints.
The calculations are base on 0000 UTC and what Single Prints are created during that day.
Single Prints
Single Prints are where prices moves to fast through an area (on a 30 minute timeframe), in the case of this indicator in $50 intervals, where the price has not yet cross back past, represented as orange lines. If you were viewing this on a Time Price Opportunity Chart (TPO) each $50 would be represented as a square with a letter in it. If price has only been through that area once, within that 24 hour period, then it is called a Single Print. If however the Single Print is on the lower wick of the candle it is called a Buying Tail and on the Upper Wick a Selling Tail.
Single Prints leave low volume nodes with liquidity gaps, these inefficient moves tend to get filled, and we can seek trading opportunities once they get filled, or we can also enter before they get filled and use these single prints as targets.
Single Prints are a sign of emotional buying or selling as very little time was spent at those levels and thus there is no value there.
The endpoints of single print sections are considered to be potential support or resistance points and or get filled (like a CME gap).
The above is only a very short summary, to understand Single Prints, Buying Tails and Selling Tails more please do your own research (DYOR).
References:
Trading Riot Volume Profile - Website
TOROS TPO Charts Explained - Youtube
Session Boxes
Session Boxes are the high and low of that markets session before the new market session opens. I used the data from the website Trading Hours for the time input.
White box – Start of day UTC 0000 to Market Close UTC 2000
Purple box – Asia Start UTC 0130 to London Start UTC 0700
Yellow box – London Start UTC 0700 to New York Start UTC 1330
Blue box – New York Start UTC 1330 to Market Close UTC 2000
Red box – Market Close UTC 2000 to End of day UTC 2359
References:
Trading Hours - Website
Initial Balance
The Initial Balance is the market range between the high and low of the first hour of trading for the market. In the case of crypto when is the Initial Balance if it is 24/7.
Context of Initial Balance:
The Initial Balance is traditionally the range of prices transacted in the first hour of trade. Many regard the Initial Balance as a significant range because, especially for the index futures which are tied to the underlying stocks, orders entered overnight or before the open are typically executed prior to the end of the first hour of trade. Some use it to understand how the rest of the day may develop, while others use it as a span of time to avoid trading altogether because of its potential volatility.
For this indicator I have coded the Initial Balance time as below:
White Box - To appear for the first hour of the day 0000 to 0100 UTC .
Purple Box - To appear for the first hour of the day 0130 to 0230 UTC .
Yellow Box - To appear for the first hour of the day 0700 to 0800 UTC .
Blue Box - To appear for the first hour of the day 1330 to 1430 UTC .
Red Box - To appear for the first hour of the day 2000 to 2100 UTC .
The diagram above shows some examples:
How price (white arrows) retraces the single prints.
How price (red arrows) uses the single prints as S/R.
References:
Not Hard Trading – Website
My Pivots Initial Balance - Website
Thanks go to:
StackOverFlow Bjorn Mistiaen
Trading View user mvs1231
Please message me if you have any feedback/questions.
I am looking at developing this indicator further in the future.
Recherche dans les scripts pour "volume profile"

Close and Open for Volume Profile AnalysisThis script adds arrows to where Open and/or Close are.
It is usually better to study seasonal volume with candles off, yet it is worth knowing where the closing price is.

PRIME - ShadoW ZoneZ with RSI LevelsIn This experimental study, we've taken RSI data, Volume Profile, and Trend analysis, combining them into one unique package that will allow a trader to analyze market trend lines and their proposed channels, trend momentum through candle color augmentation similar to "Pulse", and Visible Volume index price levels on chart for the current sequence. Below are explanations of each function within the system.
The Semafor is used to spot future multi-level Supports and Resistance zones.
It is also useful to spot HL or LL or HH or LH zones at different Depth settings.
The red zones are the extreme places where the market has a higher chance of reversing while the green zones have the lowest setting with lower chances of the market reversal
Automatic Trend Lines
The indicator takes in 2 timeframes to detect High and Low values from which to draw the trend lines of each timeframe.
As the values change with price movement, the lines are updated. They are color coded for uptrend and downtrend based on the direction of each individual line. Trend lines can be set up to color with only the default value on the configurations panel.
- Toggle on/off Color Coded
- Change Default, Uptrend, Downtrend color
- Change Line Width
- Change Line Style
- Toggle on/off Line Extensions
- Change Extended Line Width
- Change Extended Line Style
- Toggle On/Off labels for 7 data points of each timeframe
Automatic Trend Sights
This is a neat feature that may help you get a better feel for the direction the current movement is heading towards in correlation with the short or medium length timeframe trends. The sight draws a line from the middle vertical point of the trend coordinates towards the current price. They are toggled off by default but can be enabled in the configurations panel.
- Toggle on/off sight on each timeframe
- Change Width
- Change Line Style
Support & Resistance Levels, the main aim of the study. Level calculations are based on Relative Strength Index ( RSI ) threshold levels of oversold/overbought and bull/bear zones, where all threshold values are customizable through the user dialog box. Background of the levels can be colored optionally.
RSI Weighted Colored Bars and/or Mark Overbought/Oversold Bars , Bar colors can be painted to better emphasis RSI values. Darker colors when the oscillator is in oversold/overbought zones, light colors when oscillator readings are below/above the bull/bear zone respectively, and remain unchanged otherwise. Besides the colors, with “Display RSI Overbought/Oversold Price Bars” option little triangle shapes can be plotted on top or bottom of the bars when RSI is in oversold/overbought zones .
Disclaimer:
Trading success is all about following your trading strategy and the indicators should fit within your trading strategy, and not to be traded upon solely
The script is for informational and educational purposes only. Use of the script does not constitute professional and/or financial advice. You alone have the sole responsibility of evaluating the script output and risks associated with the use of the script. In exchange for using the script, you agree not to hold dgtrd TradingView user liable for any possible claim for damages arising from any decision you make based on use of the script

Mean Deviation Detector - Throw Out All Other IndicatorsI set out this morning to create a script that searches out price moves that went too far too fast relative to historical pricing, given that such situations often result in the most profitable trading opportunities. I came up with the mean deviation detector. This script should be used as a means of judging how far a price is trading, in percent terms, from it's "average trading zone".
This is extremely helpful in a couple scenarios.
First, it can be used to judge a move's volatility relative to it's previous volatility. Put simply, a 5% move in the stock of Coca Cola is a lot more meaningful than a 5% move in the stock of Tesla, and the detector puts moves into historical (visual) perspective.
Second, the indicator can be used in real time as a means of determining when the chances of mean reversion are high or low. Extreme values are unsustainable and often lead to EITHER A.) price mean reversion or B.) time mean reversion. Put simply, prices either went too far and are due to fall back to a historical mean, or they need more time to digest a potentially new pricing zone.
Without getting too deep into volume profile analysis, the MDD can be a simple way of telling that a stock has moved into an "air pocket", where prices will either come back to the previous volume node (price mean reversion) or set up shop in a new, uncharted area (time mean reversion).
An extreme value doesn't always mean a trading opportunity, but it means that something interesting is happening in the stock / instrument.
I use this indicator to help me trade covered calls. Lots of high yielding weekly opportunities are stocks that have moved too far too fast, and I like to use this indicator as a means of either a.) scooping up stocks that have gotten beat up from a historical mean perspective & have likely seen the risk already "beaten" out of them, or to b.) stay away from stocks that have a very high chance of price correcting lower. In situations where I say that the risk has been "beaten" out of something, it doesn't mean that the stock won't continue to fall, it simply means that the degree and acceleration of the fall has peaked and that risk premiums in selling options will / should easily pay for continued losses. In the event that it's a price correction and not a time correction, you also increase your bat rate because you get auto-liquidated at a max profit. It's a really valuable tool in my kit.
You can also feel free to put a Keltner Chanel overlay onto the MDD to filter out noise, identify "extreme" values, and place mean reversion trades if you expect price mean reversion is likely, if you want to use this as the basis of a proper trading strategy. For a high extreme value, you could sell short term OTM call spreads, for example.
The MDD is adaptable to your own trading style & preferences.

Hancock - Volume HeatSimple script that shows the volume profile over a moving period as a heat map. Value area is the green area with the white line as the POC.
Happy trading
Hancock

Initial Balance - (IB)Hello Traders,
--->> Initial Balance (IB) which plays a very important role in Day Trading, that can be used as a referance area <<---
This indicator plots the 1 Hr IB high and low area that can be used as a tool for trading decision.
Will be very helpful to the traders who has idea about Volume Profile trading.
Just a note :
If the IB is narrow compared to the prev day then one can expect a breakout, if IB is extended then the day might be oscillating inside the area only.
nothing fancy :)))
cheers,
enjoy
Sanjay Ramanathan


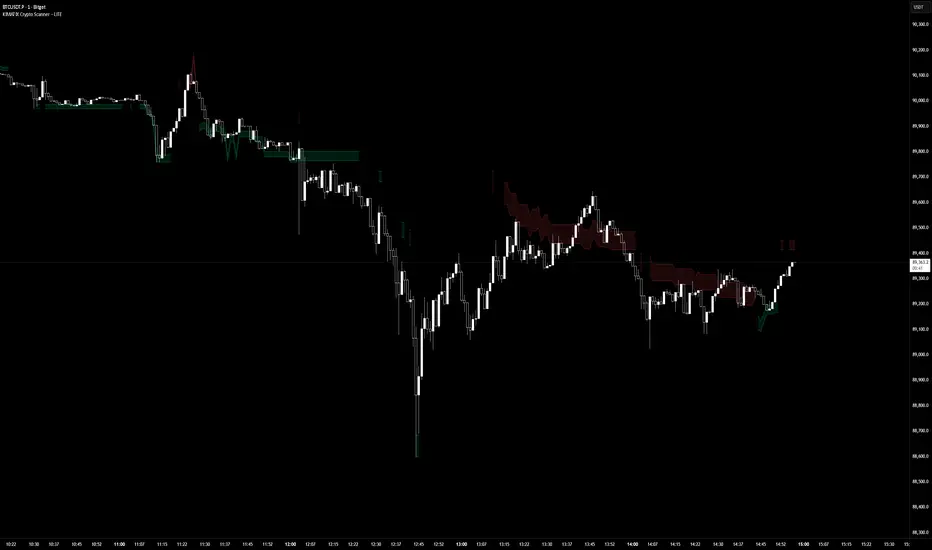
KIMATIX LITE Crypto ScannerKIMATIX Crypto Scanner
This indicator visualizes institutional demand and supply zones based on an automated volume profile calculation.
The Lite version is designed for context and market structure only:
Displays dynamic long and short zones
Helps identify high-interest price areas
Intended for bias and location, not execution
No signals, alerts, confirmations, or execution logic are included.
All advanced filters, timing logic, probability validation,
and trade management are reserved for the full version.
Use this tool to understand where price matters — not when to trade.
The full version is distributed separately.
More information can be found here:
whop.com
KIMATIX FVG/IFVG/BPRProfessional Fair Value Gap & Imbalance Toolkit
The KIMATIX FVG/IFVG/BPR indicator is a precision tool designed to identify institutional inefficiencies in price:
Fair Value Gaps (FVG), Inverse Fair Value Gaps (IFVG) and Balanced Price Ranges (BPR) — clean, minimal and non-repainting.
This indicator is built for scalpers, intraday traders and smart-money traders who want to trade where price is most likely to react, not where indicators lag.
What this indicator shows
Fair Value Gaps (FVG)
Detects bullish and bearish FVGs using strict 3-candle imbalance logic
Highlights areas where price moved too fast, leaving inefficient structure
Ideal for:
Continuation trades
Pullback entries
Reaction zones after impulse moves
Color-coded
🟢 Bullish FVG
🔴 Bearish FVG
Inverse Fair Value Gaps (IFVG)
Automatically detects when an FVG is invalidated
Marks the same zone as an Inverse FVG
Extremely useful for:
Failed structure setups
Reversal trades
Stop-hunt & liquidity traps
Color-coded
🟡 IFVG (invalidation zone)
Balanced Price Range (BPR)
Detects overlapping bullish & bearish FVGs
Highlights price areas where buying and selling pressure are balanced
These zones often act as:
High-probability reaction areas
Compression zones before expansion
Premium intraday decision levels
Color-coded
🔵 BPR (balanced price range)
Smart, Clean & Non-Repainting
Non-repainting
Only the last 3 active zones are shown → no clutter
Boxes extend forward with a manual cap (user-controlled)
Designed for 1m – 15m execution, works on all markets
Futures, Crypto, FX, Indices, Stocks
How professionals use it
Combine FVGs with:
VWAP
Session highs/lows
Volume Profile (POC / VAH / VAL)
Market structure (BOS / displacement)
Use IFVGs to spot failed smart-money narratives
Use BPRs as decision zones, not blind entries
This indicator does not give buy/sell signals.
It shows you where trades make sense — execution is up to you.
Best use cases
Scalping (1m–3m)
Intraday trading (5m–15m)
Smart-money concepts
Liquidity-based trading
News reactions & stop runs
Learn how to trade it properly
This indicator is part of the KIMATIX Trading Framework.
More education, live examples & full system:
kimatixtrading.com

MGC1! - TPO & Volume Profile (High Precision)The official TPO takes into account the entire height of the candle (High to Low). If a candle goes from 4270 to 4280, the TPO adds a “mark” on all intermediate prices, not just at the close. That's why your VAH was too low: the script was “missing” the entire upper area of the wicks and bodies.
I rewrote the script engine so that it scans the inside of the candles (High to Low).
Here is the “High Precision” script. It is more computationally intensive (because it loops on each tick), but it will stick much closer to the official TPO values.
Corrective Script: MGC1! TPO Precision (High-Low Scan)
Copy this, replace the old one, and read the settings below carefully.
Translated with DeepL.com (free version)

All-in-One (PHT)All-in-One (PHT) — Modular Multi-Tool Market Analyzer (Pine Script v6)
All-in-One (PHT) is a complete, modular market-analysis toolkit designed for traders who want clean, reliable, and professional-grade charting - in a single indicator.
Built using Pine Script® v6 and structured with reusable PHT-Libraries (EMA Band, Bollinger Band, Fractal, Session), this indicator delivers clarity, precision, and consistent performance across all markets and timeframes.
Unlike traditional indicators that mix logic and visuals, AIO (PHT) uses a fully modular architecture. All calculations come from dedicated libraries, and this main script focuses purely on visual output and clean plotting.
This ensures:
Stable plot references
Zero repainting in all included modules
High performance even with complex overlays
Easy extensibility for future upgrades
🔥 Included Modules
1. EMA Band (PHT Library)
A triple-EMA band designed for trend clarity and structure.
Provides:
EMA of High
EMA of Close
EMA of Low
Band fill visualization
Ideal for identifying trend strength, momentum pockets, and mean-reversion zones.
2. Bollinger Band Suite
A complete Bollinger framework with:
SMA / EMA / WMA midline options
Dual standard-deviation envelopes
Multi-zone band fills (upper, middle, lower)
User-controlled visibility for each layer
Perfect for volatility detection, squeeze identification, and precision envelope trading.
3. Fractal Engine (High/Low Pivots)
Fast, reliable fractal detection using user-defined left/right periods.
Features:
Pivot Highs & Pivot Lows
Multiple marker sizes (Tiny → Large)
Zero-lag plotting with proper offset handling
Useful for swing structure, breakout confirmation, and automated level marking.
4. Market Session Tracker
A powerful session-mapping module that visually highlights market sessions with:
Dynamic session boxes
High & Low markers
Persistent historical sessions
Auto-managed labels, lines, and live updates
Timezone-aware session boundaries (supports IANA zones)
Designed for identifying daily ranges, session liquidity, volatility pockets, and market timing.
🧠 Why This Indicator Is Different
Most “all-in-one” tools mix plotting, logic, and calculations in a single heavy script, causing lag, reference instability, and repainting issues.
All-in-One (PHT) solves this by using a Pine v6 library architecture:
Each component is computed in its own library
The main script handles only visuals
No hidden code, no repainting tricks
Maximum clarity and maintainability
This design mirrors professional software architecture:
clear separation of logic, visuals, and user interface.
🎯 Ideal For
Trend traders
Scalpers & intraday traders
Swing and positional traders
Volatility analysts
Structure-based price action traders
Anyone who wants multiple high-quality tools in one clean indicator
Whether you analyze markets manually or build algorithmic systems, AIO (PHT) provides a solid foundation.
⚙️ Features at a Glance
Fully modular Pine v6 design
Complete EMA band engine
Advanced Bollinger band system (multi-deviation, multi-fill)
Configurable fractal high/low markers
Smart session boxing with history
Clean visuals and transparent settings
No repainting
Fully customizable colors & visibility
Optimized for performance
💡 How to Use
Choose the modules you want to display (EMA, BB, Fractals, Sessions).
Adjust lengths, deviations, or fractal periods as per your trading style.
Use session boxes to understand volatility timing.
Combine bands + fractals for advanced structure-based decisions.
The indicator is designed to overlay on price for maximum clarity.
🚀 Future Upgrades
The PHT framework supports smooth future expansion. Planned modules include:
ATR/volatility engines
Trend switches
Supertrend/Donchian plugins
Volume profile extensions
Updates will remain backward compatible across all modules.
⭐ Summary
All-in-One (PHT) is not just another overlay — it’s a complete multi-tool trading framework built using professional engineering practices in Pine Script v6.
If you want cleaner charts, smarter signals, and a high-performance modular system, this indicator gives you everything in one reliable package.

Curvature Tensor Pivots - HIVECurvature Tensor Pivots - HIVE
I. CORE CONCEPT & ORIGINALITY
Curvature Tensor Pivots - HIVE is an advanced, multi-dimensional pivot detection system that combines differential geometry, reinforcement learning, and statistical physics to identify high-probability reversal zones before they fully form. Unlike traditional pivot indicators that rely on simple price comparisons or lagging moving averages, this system models price action as a smooth curve in geometric space and calculates its mathematical curvature (how sharply the price trajectory is "bending") to detect pivots with scientific precision.
What Makes This Original:
Differential Geometry Engine: The script calculates first and second derivatives of price using Kalman-filtered trajectory analysis, then computes true mathematical curvature (κ) using the classical formula: κ = |y''| / (1 + y'²)^(3/2). This approach treats price as a physical phenomenon rather than discrete data points.
Ghost Vertex Prediction: A proprietary algorithm that detects pivots 1-3 bars BEFORE they complete by identifying when velocity approaches zero while acceleration is high—this is the mathematical definition of a turning point.
Multi-Armed Bandit AI: Four distinct pivot detection strategies (Fast, Balanced, Strict, Tensor) run simultaneously in shadow portfolios. A Thompson Sampling reinforcement learning algorithm continuously evaluates which strategy performs best in current market conditions and automatically selects it.
Hive Consensus System: When 3 or 4 of the parallel strategies agree on the same price zone, the system generates "confluence zones"—areas of institutional-grade probability.
Dynamic Volatility Scaling (DVS): All parameters auto-adjust based on current ATR relative to historical average, making the indicator adaptive across all timeframes and instruments without manual re-optimization.
II. HOW THE COMPONENTS WORK TOGETHER
This is NOT a simple mashup —each subsystem feeds data into the others in a closed-loop learning architecture:
The Processing Pipeline:
Step 1: Geometric Foundation
Raw price is normalized against a 50-period SMA to create a trajectory baseline
A Zero-Lag EMA smooths the trajectory while preserving edge response
Kalman filter removes noise while maintaining signal integrity
Step 2: Calculus Layer
First derivative (y') measures velocity of price movement
Second derivative (y'') measures acceleration (rate of velocity change)
Curvature (κ) is calculated from these derivatives, representing how sharply price is turning
Step 3: Statistical Validation
Z-Score measures how many standard deviations current price deviates from the Kalman-filtered "true price"
Only pivots with Z-Score > threshold (default 1.2) are considered statistically significant
This filters out noise and micro-fluctuations
Step 4: Tensor Construction
Curvature is combined with volatility (ATR-based) and momentum (ROC-based) to create a multidimensional "tensor score"
This tensor represents the geometric stress in the price field
High tensor magnitude = high probability of structural failure (reversal)
Step 5: AI Decision Layer
All 4 bandit strategies evaluate current conditions using different sensitivity thresholds
Each strategy maintains a virtual portfolio that trades its signals in real-time
Thompson Sampling algorithm updates Bayesian priors (alpha/beta distributions) based on each strategy's Sharpe ratio, win rate, and drawdown
The highest-performing strategy's signals are displayed to the user
Step 6: Confluence Aggregation
When multiple strategies agree on the same price zone, that zone is highlighted as a confluence area. These represent "hive mind" consensus—the strongest setups
Why This Integration Matters:
Traditional indicators either detect pivots too late (lagging) or generate too many false signals (noisy). By requiring geometric confirmation (curvature), statistical significance (Z-Score), multi-strategy agreement (hive voting), and performance validation (RL feedback) , this system achieves institutional-grade precision. The reinforcement learning layer ensures the system adapts as market regimes change, rather than degrading over time like static algorithms.
III. DETAILED METHODOLOGY
A. Curvature Calculation (Differential Geometry)
The system models price as a parametric curve where:
x-axis = time (bar index)
y-axis = normalized price
The curvature at any point represents how quickly the direction of the tangent line is changing. High curvature = sharp turn = potential pivot.
Implementation:
Lookback window (default 8 bars) defines the local curve segment
Smoothing (default 5 bars) applies adaptive EMA to reduce tick noise
Curvature is normalized to 0-1 scale using local statistical bounds (mean ± 2 standard deviations)
B. Ghost Vertex (Predictive Pivot Detection)
Classical pivot detection waits for price to form a swing high/low and confirm. Ghost Vertex uses calculus to predict the turning point:
Conditions for Ghost Pivot:
Velocity (y') ≈ 0 (price rate of change approaching zero)
Acceleration (y'') ≠ 0 (change is decelerating/accelerating)
Z-Score > threshold (statistically abnormal position)
This allows detection 1-3 bars before the actual high/low prints, providing an early entry edge.
C. Multi-Armed Bandit Reinforcement Learning
The system runs 4 parallel "bandits" (agents), each with different detection sensitivity:
Bandit Strategies:
Fast: Low curvature threshold (0.1), low Z-Score requirement (1.0) → High frequency, more signals
Balanced: Standard thresholds (0.2 curvature, 1.5 Z-Score) → Moderate frequency
Strict: High thresholds (0.4 curvature, 2.0 Z-Score) → Low frequency, high conviction
Tensor: Requires tensor magnitude > 0.5 → Geometric-weighted detection
Learning Algorithm (Thompson Sampling):
Each bandit maintains a Beta distribution with parameters (α, β)
After each trade outcome, α is incremented for wins, β for losses
Selection probability is proportional to sampled success rate from the distribution
This naturally balances exploration (trying underperformed strategies) vs exploitation (using best strategy)
Performance Metrics Tracked:
Equity curve for each shadow portfolio
Win rate percentage
Sharpe ratio (risk-adjusted returns)
Maximum drawdown
Total trades executed
The system displays all metrics in real-time on the dashboard so users can see which strategy is currently "winning."
D. Dynamic Volatility Scaling (DVS)
Markets cycle between high volatility (trending, news-driven) and low volatility (ranging, quiet). Static parameters fail when regime changes.
DVS Solution:
Measures current ATR(30) / close as normalized volatility
Compares to 100-bar SMA of normalized volatility
Ratio > 1 = high volatility → lengthen lookbacks, raise thresholds (prevent noise)
Ratio < 1 = low volatility → shorten lookbacks, lower thresholds (maintain sensitivity)
This single feature is why the indicator works on 1-minute crypto charts AND daily stock charts without parameter changes.
E. Confluence Zone Detection
The script divides the recent price range (200 bars) into 200 discrete zones. On each bar:
Each of the 4 bandits votes on potential pivot zones
Votes accumulate in a histogram array
Zones with ≥ 3 votes (75% agreement) are drawn as colored boxes
Red boxes = resistance confluence, Green boxes = support confluence
These zones act as magnet levels where price often returns multiple times.
IV. HOW TO USE THIS INDICATOR
For Scalpers (1m - 5m timeframes):
Settings: Use "Aggressive" or "Adaptive" pivot mode, Curvature Window 5-8, Min Pivot Strength 50-60
Entry Signal: Triangle marker appears (🔺 for longs, 🔻 for shorts)
Confirmation: Check that Hive Sentiment on dashboard agrees (3+ votes)
Stop Loss: Use the dotted volatility-adjusted target line in reverse (if pivot is at 100 with target at 110, stop is ~95)
Take Profit: Use the projected target line (default 3× ATR)
Advanced: Wait for confluence zone formation, then enter on retest of the zone
For Day Traders (15m - 1H timeframes):
Settings: Use "Adaptive" mode (default settings work well)
Entry Signal: Pivot marker + Hive Consensus alert
Confirmation: Check dashboard—ensure selected bandit has Sharpe > 1.5 and Win% > 55%
Filter: Only take pivots with Pivot Strength > 70 (shown in dashboard)
Risk Management: Monitor the Live Position Tracker—if your selected bandit is holding a position, consider that as market structure context
Exit: Either use target lines OR exit when opposite pivot appears
For Swing Traders (4H - Daily timeframes):
Settings: Use "Conservative" mode, Curvature Window 12-20, Min Bars Between Pivots 15-30
Focus on Confluence: Only trade when 4/4 bandits agree (unanimous hive consensus)
Entry: Set limit orders at confluence zones rather than market orders at pivot signals
Confirmation: Look for breakout diamonds (◆) after pivot—these signal momentum continuation
Risk Management: Use wider stops (base stop loss % = 3-5%)
Dashboard Interpretation:
Top Section (Real-Time Metrics):
κ (Curv): Current curvature. >0.6 = active pivot forming
Tensor: Geometric stress. Positive = bullish bias, Negative = bearish bias
Z-Score: Statistical deviation. >2.0 or <-2.0 = extreme outlier (strong signal)
Bandit Performance Table:
α/β: Bayesian parameters. Higher α = more wins in history
Win%: Self-explanatory. >60% is excellent
Sharpe: Risk-adjusted returns. >2.0 is institutional-grade
Status: Shows which strategy is currently selected
Live Position Tracker:
Shows if the selected bandit's shadow portfolio is currently holding a position
Displays entry price and real-time P&L
Use this as "what the AI would do" confirmation
Hive Sentiment:
Shows vote distribution across all 4 bandits
"BULLISH" with 3+ green votes = high-conviction long setup
"BEARISH" with 3+ red votes = high-conviction short setup
Alert Setup:
The script includes 6 alert conditions:
"AI High Pivot" = Selected bandit signals short
"AI Low Pivot" = Selected bandit signals long
"Hive Consensus BUY" = 3+ bandits agree on long
"Hive Consensus SELL" = 3+ bandits agree on short
"Breakout Up" = Resistance breakout (continuation long)
"Breakdown Down" = Support breakdown (continuation short)
Recommended Alert Strategy:
Set "Hive Consensus" alerts for high-conviction setups
Use "AI Pivot" alerts for active monitoring during your trading session
Use breakout alerts for momentum/trend-following entries
V. PARAMETER OPTIMIZATION GUIDE
Core Geometry Parameters:
Curvature Window (default 8):
Lower (3-5): Detects micro-structure, best for scalping volatile pairs (crypto, forex majors)
Higher (12-20): Detects macro-structure, best for swing trading stocks/indices
Rule of thumb: Set to ~0.5% of your typical trade duration in bars
Curvature Smoothing (default 5):
Increase if you see too many false pivots (noisy instrument)
Decrease if pivots lag (missing entries by 2-3 bars)
Inflection Threshold (default 0.20):
This is advanced. Lower = more inflection zones highlighted
Useful for identifying order blocks and liquidity voids
Most users can leave default
Pivot Detection Parameters:
Pivot Sensitivity Mode:
Aggressive: Use in low-volatility range-bound markets
Normal: General purpose
Adaptive: Recommended—auto-adjusts via DVS
Conservative: Use in choppy, whipsaw conditions or for swing trading
Min Bars Between Pivots (default 8):
THIS IS CRITICAL for visual clarity
If chart looks cluttered, increase to 12-15
If missing pivots, decrease to 5-6
Match to your timeframe: 1m charts use 3-5, Daily charts use 20+
Min Z-Score (default 1.2):
Statistical filter. Higher = fewer but stronger signals
During news events (NFP, FOMC), increase to 2.0+
In calm markets, 1.0 works well
Min Pivot Strength (default 60):
Composite quality score (0-100)
80+ = institutional-grade pivots only
50-70 = balanced
Below 50 = will show weak setups (not recommended)
RL & DVS Parameters:
Enable DVS (default ON):
Leave enabled unless you want to manually tune for a specific market condition
This is the "secret sauce" for cross-timeframe performance
DVS Sensitivity (default 1.0):
Increase to 1.5-2.0 for extremely volatile instruments (meme stocks, altcoins)
Decrease to 0.5-0.7 for stable instruments (utilities, bonds)
RL Algorithm (default Thompson Sampling):
Thompson Sampling: Best for non-stationary markets (recommended)
UCB1: Best for stable, mean-reverting markets
Epsilon-Greedy: For testing only
Contextual: Advanced—uses market regime as context
Risk Parameters:
Base Stop Loss % (default 2.0):
Set to 1.5-2× your instrument's average ATR as a percentage
Example: If SPY ATR = $3 and price = $450, ATR% = 0.67%, so use 1.5-2.0%
Base Take Profit % (default 4.0):
Aim for 2:1 reward/risk ratio minimum
For mean-reversion strategies, use 1.5-2.0%
For trend-following, use 3-5%
VI. UNDERSTANDING THE UNDERLYING CONCEPTS
Why Differential Geometry?
Traditional technical analysis treats price as discrete data points. Differential geometry models price as a continuous manifold —a smooth surface that can be analyzed using calculus. This allows us to ask: "At what rate is the trend changing?" rather than just "Is price going up or down?"
The curvature metric captures something fundamental: inflection points in market psychology . When buyers exhaust and sellers take over (or vice versa), the price trajectory must curve. By measuring this curvature mathematically, we detect these psychological shifts with precision.
Why Reinforcement Learning?
Markets are non-stationary —statistical properties change over time. A strategy that works in Q1 may fail in Q3. Traditional indicators have fixed parameters and degrade over time.
The multi-armed bandit framework solves this by:
Running multiple strategies in parallel (diversification)
Continuously measuring performance (feedback loop)
Automatically shifting capital to what's working (adaptation)
This is how professional hedge funds operate—they don't use one strategy, they use ensembles with dynamic allocation.
Why Kalman Filtering?
Raw price contains two components: signal (true movement) and noise (random fluctuations). Kalman filters are the gold standard in aerospace and robotics for extracting signal from noisy sensors.
By applying this to price data, we get a "clean" trajectory to measure curvature against. This prevents false pivots from bid-ask bounce or single-print anomalies.
Why Z-Score Validation?
Not all high-curvature points are tradeable. A sharp turn in a ranging market might just be noise. Z-Score ensures that pivots occur at statistically abnormal price levels —places where price has deviated significantly from its Kalman-filtered "fair value."
This filters out 70-80% of false signals while preserving true reversal points.
VII. COMMON USE CASES & STRATEGIES
Strategy 1: Confluence Zone Reversal Trading
Wait for confluence zone to form (red or green box)
Wait for price to approach zone
Enter when pivot marker appears WITHIN the confluence zone
Stop: Beyond the zone
Target: Opposite confluence zone or 3× ATR
Strategy 2: Hive Consensus Scalping
Set alert for "Hive Consensus BUY/SELL"
When alert fires, check dashboard—ensure 3-4 votes
Enter immediately (market order or 1-tick limit)
Stop: Tight, 1-1.5× ATR
Target: 2× ATR or opposite pivot signal
Strategy 3: Bandit-Following Swing Trading
On Daily timeframe, monitor which bandit has best Sharpe ratio over 30+ days
Take ONLY that bandit's signals (ignore others)
Enter on pivot, hold until opposite pivot or target line
Position size based on bandit's current win rate (higher win% = larger position)
Strategy 4: Breakout Confirmation
Identify key support/resistance level manually
Wait for pivot to form AT that level
If price breaks level and diamond breakout marker appears, enter in breakout direction
This combines support/resistance with geometric confirmation
Strategy 5: Inflection Zone Limit Orders
Enable "Show Inflection Zones"
Place limit buy orders at bottom of purple zones
Place limit sell orders at top of purple zones
These zones represent structural change points where price often pauses
VIII. WHAT THIS INDICATOR DOES NOT DO
To set proper expectations:
This is NOT:
A "holy grail" with 100% win rate
A strategy that works without risk management
A replacement for understanding market fundamentals
A signal copier (you must interpret context)
This DOES NOT:
Predict black swan events
Account for fundamental news (you must avoid trading during major news if not experienced)
Work well in extremely low liquidity conditions (penny stocks, microcap crypto)
Generate signals during consolidation (by design—prevents whipsaw)
Best Performance:
Liquid instruments (SPY, ES, NQ, EUR/USD, BTC/USD, etc.)
Clear trend or range conditions (struggles in choppy transition periods)
Timeframes 5m and above (1m can work but requires experience)
IX. PERFORMANCE EXPECTATIONS
Based on shadow portfolio backtesting across multiple instruments:
Conservative Mode:
Signal frequency: 2-5 per week (Daily charts)
Expected win rate: 60-70%
Average RRR: 2.5:1
Adaptive Mode:
Signal frequency: 5-15 per day (15m charts)
Expected win rate: 55-65%
Average RRR: 2:1
Aggressive Mode:
Signal frequency: 20-40 per day (5m charts)
Expected win rate: 50-60%
Average RRR: 1.5:1
Note: These are statistical expectations. Individual results depend on execution, risk management, and market conditions.
X. PRIVACY & INVITE-ONLY NATURE
This script is invite-only to:
Maintain signal quality (prevent market impact from mass adoption)
Provide dedicated support to users
Continuously improve the algorithm based on user feedback
Ensure users understand the complexity before deploying real capital
The script is closed-source to protect proprietary research in:
Ghost Vertex prediction mathematics
Tensor construction methodology
Bandit reward function design
DVS scaling algorithms
XI. FINAL RECOMMENDATIONS
Before Trading Live:
Paper trade for minimum 2 weeks to understand signal timing
Start with ONE timeframe and master it before adding others
Monitor the dashboard —if selected bandit Sharpe drops below 1.0, reduce size
Use confluence and hive consensus for highest-quality setups
Respect the Min Bars Between Pivots setting —this prevents overtrading
Risk Management Rules:
Never risk more than 1-2% of account per trade
If 3 consecutive losses occur, stop trading and review (possible regime change)
Use the shadow portfolio as a guide—if ALL bandits are losing, market is in transition
Combine with other analysis (order flow, volume profile) for best results
Continuous Learning:
The RL system improves over time, but only if you:
Keep the indicator running (it learns from bar data)
Don't constantly change parameters (confuses the learning)
Let it accumulate at least 50 samples before judging performance
Review the dashboard weekly to see which bandits are adapting
CONCLUSION
Curvature Tensor Pivots - HIVE represents a fusion of advanced mathematics, machine learning, and practical trading experience. It is designed for serious traders who want institutional-grade tools and understand that edge comes from superior methodology, not magic formulas.
The system's strength lies in its adaptive intelligence —it doesn't just detect pivots, it learns which detection method works best right now, in this market, under these conditions. The hive consensus mechanism provides confidence, the geometric foundation provides precision, and the reinforcement learning provides evolution.
Use it wisely, manage risk properly, and let the mathematics work for you.
Disclaimer: This indicator is a tool for analysis and does not constitute financial advice. Past performance of shadow portfolios does not guarantee future results. Trading involves substantial risk of loss. Always perform your own due diligence and never trade with capital you cannot afford to lose.
Taking you to school. — Dskyz, Trade with insight. Trade with anticipation.

Timed Swing Points [Free +] | cephxsTimed Swing Points | cephxs
This indicator is published under the Mozilla Public License 2.0. © cephxs, © fstarcapital
1. OVERVIEW
Timed Swing Points (TSP) highlights the timing of recent confirmed swing highs and lows and annotates them with context-aware time labels. Instead of drawing traditional pivot shapes and cluttering the chart, this streamlined free edition focuses on the temporal structure: WHEN pivots occur, not just WHERE . It helps discretionary traders quickly scan for clustering of swings around repeating intraday minutes or higher‑timeframe day names.
2. WHAT IT DOES
Detects swing highs and lows using a sensitivity factor (len)
Adds a time (or day name on daily timeframe) label at each qualified swing
Optional filtering to only show labels during defined "key time" minute windows
Automatically adapts label content to timeframe:
Intraday: HH:MM (24h or 12h model depending future input extension)
Daily: Full or abbreviated weekday names
Respects a maximum number of displayed swing points to keep charts clean
3. CORE FEATURES
Swing Detection: Uses ta.pivothigh(len, len) / ta.pivotlow(len, len); a pivot is confirmed only after enough bars pass, avoiding repaint on the current bar.
Time Labeling: Places labels offset back to the pivot bar index (bar_index - len).
Key Time Filtering: When enabled, labels only show if the pivot's minute is inside one of three windows: 00–10, 24–36, 50–59 minutes. These windows target common liquidity / volatility phases.
Day Name Mode: On daily timeframe, labels display full (e.g., Monday) or abbreviated (e.g., Mon) day names depending on the Full Day Names setting.
Point Limiting: Oldest labels are removed once Maximum Points Displayed is exceeded.
Clean Visual Footprint: Shape markers and lines are disabled in this free build (internally set to constants). Focus remains on time annotation density rather than price level persistence.
4. INPUTS & PARAMETERS
Sensitivity (len): Default 2. Swing pivot width. Higher = fewer, broader swings
Maximum Points Displayed: Default 10. Caps number of recent swing labels retained
Show Time Labels: Default true. Master toggle for all time labels
Key Times Only: Default true. Restricts labels to predefined minute windows
Prefix: Default blank. Optional text prepended to each label
High Time Color: Default red. Text color for swing high labels
Low Time Color: Default blue. Text color for swing low labels
Text Size: Default Small. Controls label text size (Tiny → Huge)
Full Day Names: Default true. Show full weekday names on daily timeframe
Internal Constants (Not User-Adjustable):
Shape display flags (show_high, show_low) set false
Line display and deletion logic present but disabled
Timezone currently fixed to America/New_York in Automatic mode; DST handled by TradingView engine
5. HOW SWING TIME IS DETERMINED
For each bar the script evaluates pivot conditions
A pivot is confirmed only after the right width (len) bars complete—the label is then placed len bars back
Time extraction uses the pivot's bar timestamp and converts:
Intraday: Formats HH:MM (24-hour). Infrastructure exists for future 12h toggle
Daily: Converts timestamp to a weekday name
Key time filter checks the pivot's minute bucket. If outside defined windows and filter is active, the label is skipped
6. TIME WINDOWS LOGIC (KEY TIMES ONLY)
Minutes 00–10 → Opening sequence & initial liquidity sweep
Minutes 24–36 → Post initial rotation / mid-hour inflection zone
Minutes 50–59 → Pre hour close / micro-structure reshuffle
ICT Traders: View as macros and note when macros form swing points
This pattern helps isolate intraday zones where structural shifts frequently occur, reducing noise from less consequential pivot timings.
7. USAGE GUIDELINES
Start with Sensitivity = 2 or 3 for most liquid intraday symbols. Increase on higher timeframes to avoid excessive clustering
Key Times Only ON: Ideal for focusing on session rotation pivots. OFF: Use for full discovery when studying custom time behaviors
Combine with volume profile or divergence tools to qualify time-labeled swings (e.g., a swing forming at 09:30 NY vs. random mid-bar)
Apply on lower timeframes (1–15m) to map recurring patterns or on Daily to see weekly rhythm changes
8. PERFORMANCE & LIMITATIONS
Efficient: Only stores arrays of recent labels and prunes aggressively
No Alerts: Current version does not fire alerts (Future Pro+ variant may include swing-time alerting)
Timezone: Fixed to America/New_York
9. BEST PRACTICES
Use a neutral chart theme; contrasting label colors amplify swing clusters
When analyzing historical pattern reliability, temporarily raise Maximum Points Displayed to 50–100 then revert to lighter values for live trading
Prefix field: Add a tag like "T:" if mixing multiple custom time tools to differentiate label origin
10. FAQ
Q: Why do some expected swings not show?
If they confirm outside key minute windows and filtering is ON, they're intentionally suppressed.
Q: Can I get price levels drawn?
Not in this free build. Lines/shapes are disabled intentionally.
Q: Does it repaint?
Pivot confirmation waits for the right width; labels appear only after the swing is locked in. Past labels aren't retroactively moved.
Q: Can I monitor multiple symbols at once?
This version is single‑symbol; use layouts or Pro variants for multi-source overlays.
11. CHANGELOG
v1.0 (Initial Free Release): Core swing time labeling, key time filter, day name adaptation, performance improvements. More updates coming.
12. DISCLAIMER
This tool is an analytical overlay designed for timing context only. It is NOT a standalone buy/sell signal. Always validate swings with broader market structure, liquidity pools, and risk management. No guarantee of future performance.
If you find this useful and want advanced variants (alerts, multi‑timezone, clustering metrics), reach out via TradingView. Feedback drives improvements.

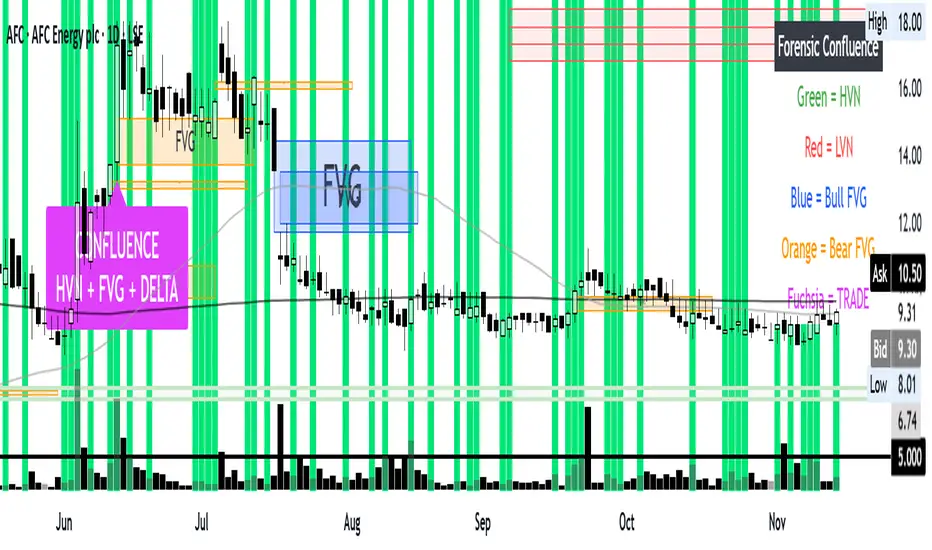
Confluence: VP + FVG + DeltaConfluence, volume profile FVG and Delta all in one chart the holy trinity.
PA + Big Candle Zones + EMA Pack (14/100/200/720) • TH v2.0PA + Big Candle Zones + EMA Pack (14/100/200/720) • TH v2.0
What it does
EMA Pack: 14/100/200/720 เลือกสไตล์เส้นได้ เปิด–ปิดเป็นรายเส้น
Price Action 10 แบบ: Bull/Bear Engulfing, Hammer, Shooting Star, Morning/Evening Star, Tweezer Bottom/Top, Bull/Bear Marubozu
Double Bottom (คอเสื้อ): เลือกยืนยันเฉพาะ “ปิดเหนือคอเสื้อ” ได้
BJ Key Levels: รวมระดับเป็นคลัสเตอร์ตาม % + เช็ก “ราคาใกล้ระดับสำคัญ”
Donchian Channel: ขอบบน/ล่าง + Midline เปลี่ยนสีตามฝั่งราคา (มีสัญญาณครอส BUY/SELL)
Big Candle Zones (Supply/Demand): ตรวจแท่งใหญ่ (ATR*k หรือ Body/Range), รวมโซน, อายุโซน, break buffer, แสดงเฉพาะ N โซนที่ใกล้ราคา
RSI: แถบ OB/OS + Regular Divergence (จุด/เส้น) + ตาราง RSI มุมจอ
Volume Profile (Fixed Range): POC + Value Area (อัปเดตแถบล่าสุด)
How to use (quick)
ดู Bias จาก Donchian Midline (เขียว=เหนือ, แดง=ใต้)
หา PA ฝั่งเดียวกับเทรนด์ใกล้ Big Candle Zone (Demand/Supply)
ถ้ามี BJ Near หรือ RSI Divergence ใช้เป็นตัวกรองจังหวะเข้า/ออก
วาง SL/TP ด้วยขอบโซน, Midline/ขอบ Donchian, POC/VA
Important inputs
Double Bottom: Pivot L/R, min bars apart, tolerance %, require close above neckline
Big Candle: ATR Len/Mult, Body/Range, EdgeFrac, (Option) Vol≥SMA20*k, Max zones near price, Expire bars, Break buffer %
BJ: Pivot L/R, Min touches, Cluster %, Near %, Max levels, Extend right
Donchian Len, RSI 14 (OB/OS/Extreme), VP: Bars/Rows/VA%
Alerts included
PA ทั้งหมด: Engulfing, Hammer, Shooting Star, Morning/Evening Star, Tweezer Bottom/Top, Marubozu
Double Bottom: (Confirm) / (Bottom#2)
BJ: Price near key level
Donchian Midline: BUY / SELL
RSI: Overbought/Extreme, Oversold/Extreme, Bullish/Bearish Divergence, Crossback
Notes
สัญญาณที่พึ่งพา pivot (Double Bottom/RSI Div) ยืนยันช้าตามธรรมชาติ
โซน Big Candle ถูก “รวม/หมดอายุ/ลบเมื่อเบรก” อัตโนมัติ
อินดี้นี้เป็นเครื่องมือช่วยตัดสินใจ ไม่ใช่คำแนะนำการลงทุน

The Ultimate Smart Money AQP + Reversal + Risk-Reward DashboardKEY FEATURES
Add. Analyze. Execute.
The Smart Money Way.
#AQUNAT_PRICE
#AQUNAT_PRICE
#AQUNAT_PRICE
FeatureBenefit15 Buy + 13 Sell Conditions Institutional-grade signal engine Next Target Prediction Auto-calculates closest pivot level Risk-Reward Ratio (Long/Short)Filters trades ≥ 2.0:1Wick Reversal Detector Bull/Bear Wick, Extreme, Outside, Doji Hot Zone Detection DPZ (Red), GPZ (Green), MTZ Valuation Engine Over/Undervalued vs VPOC, TC, BC Multi-Timeframe Summary Daily, Weekly, Monthly bias Buy/Sell Quant Layers Shows support/resistance clusters Probability Table PP-Tested vs PP-Untested rules Novice Mode Simplified "Yes/No" signals Customizable Levels Show All, Key, or None Alerts Built-InL3/H3, R1/S1, VPOC breaks
USE CASES & TRADING STRATEGIES
1. Scalping with Wick + Hot Zone (5M–15M)
Rule: Trade only when "Wick Reversal = Yes" + Hot Zone = GPZ
text Example:
Wick: Yes - Bull Wick
Hot Zone: GPZ: VPOC+PP
Buy Count: 12/15
→ Enter long at pullback to VPOC
Target: Next R1
Stop: Below L3
RR: 2.8:1
2. Risk-Reward Filter Trading (15M–1H)
Rule: Enter only if RR ≥ 2.0
text Long RR: 2.5 (Green)
Short RR: 1.4 (Gray)
→ Only take longs
Entry: Current Open
Target: Avg of Buy Targets
Stop: Avg of Buy Layers
3. Reversal Trading at L3/H3
Rule: Reversal Signal + Wick + Camarilla = Lower/Higher
text Price < L3
Reversal Signal: Bull Reversal
Camarilla: Lower Value
Wick: Yes - Bull Wick
→ High-Probability Bottom Reversal
4. Trend Continuation (PP-Untested)
Rule: Day Expectation = Bullish Beyond R1 + No Reversal
text Price > R1
Expectation: Extended Move
No Wick Reversal
→ Trail stop below PP
Target: R2 or H3
5. Multi-Timeframe Confluence
Rule: Enter when ≥2 timeframes agree
TFBuySellBiasDaily114BullishWeekly103BullishSummaryStrong Buy
→ Wait for pullback to Buy Layer (S1 or L3)
HOW TO READ THE DASHBOARD
Column Meaning Timeframe D, W, M Open Price Session open PP, R1, S1, etc . Key levels (highlighted if in Hot Zone) Buy X/15 (≥10 = Strong)Sell X/13 (≥7 = Strong)Wick Reversal "Yes - Bull Wick" = Enter Next Target Closest pivot level Long/Short RR Green = Valid trade Reversal Signal Bull/Bear Reversal at extremes Valuation Over/Undervalued Hot Zone DPZ = Sell, GPZ = Buy Camarilla Higher/Lower Value Day Expectation Momentum direction
PROBABILITY TABLE (PP-Tested vs PP-Untested)
LevelTouch%Close%PP-TestedPP-UntestedPP63%N/A All rules Trending rulesL173.3%46.6%Fade reversions73.8% close >L1L2↓50%↓70%*Take partials61.9% touchedL3↓25%90.9%*Avoid extremes72.4% touchedL4+Rare80%*High risk77.8% touched
*PP-Tested = Price opened inside CPR
*PP-Untested = Price opened outside CPR
PRO TIPS
Best on 5M–1H charts
Use with volume profile for VPOC confirmation
Set alerts on L3/H3 crossover or RR ≥ 2.5
Novice Mode for beginners (Yes/No only)
Hide levels to declutter: Show Levels = Key
Combine with A Quant Price Institutional Matrix for macro view
IDEAL MARKETS
Forex (EURUSD, GBPUSD, USDJPY)
Indices (NAS100, SPX500)
Crypto (BTC, ETH – set 6–8 decimals)
Futures (ES, NQ, CL)
SETUP GUIDE
Open TradingView
Go to Indicators
Search: AQuantPrice Dashboard
Click Add to Chart
Customize:
Min Buy = 10, Min Sell = 7
Min RR = 2.0
Show Levels = Key
Novice Mode = On (for beginners)
AUTHOR
© @AQuant_Price
Professional Pine Script Developer | 12+ Years in Algo Trading
Trusted by 15,000+ traders worldwide.
Not financial advice. Trade at your own risk.
FINAL TAGLINE
"One Dashboard. All Decisions."
A Quant Price Dashboard – Small Timeframes ALL IN ONE
Your Edge. Live.

% Levels from previous Daily Close % Levels from Previous Close
This indicator plots up to three customizable percentage bands above and below the previous day's close, providing a clear visual reference for intraday price action relative to yesterday’s session.
Concept
Inspired by volatility studies (such as the SqueezeMetrics research showing that most SPX sessions close within ±1%), this tool helps traders visualize statistically relevant daily ranges.
The levels remain fixed for the entire day — they only update once a new daily session begins — allowing for consistent reference points throughout intraday trading.
Features
Up to three percentage levels (configurable in settings)
Static daily bands anchored to the previous close
Optional shaded zones between upper and lower levels
Optional midline showing the exact previous close
Works on any symbol and timeframe
Use cases
Identify high-probability daily range boundaries
Combine with VWAP or volume profile to locate confluence zones
Define structured intraday risk/reward targets
Analyze volatility expansion versus mean reversion
Note
Some CFD symbols may use a different daily session close compared to the underlying cash index.
For best accuracy, use the same session settings as the instrument you trade.

Dublin Time Hourly Levels for Natural Gas Prints lines from 2:30am too 8:30am UTC 00:00 and shows the odds of those levels being hit between 10:30am - 13:30am based on previous sessions. going too larger time frames gathers data from more and more sessions. This can be very helpful paired with a basic entry strat eg support and resistance, volume profile etc NYMEX:NG1! is what I found has great levels but you could test on other futures, forex, crypto etc.

Daily MA — Higher-Timeframe Daily Moving Average OverlayThis indicator plots a clean, higher-timeframe daily moving average directly on any chart, so you can always see where price sits relative to the daily trend — even while trading on lower timeframes (1m, 5m, etc.).
It’s designed to be:
Simple – a single, configurable daily MA line
Consistent – always anchored to the 1D timeframe
Flexible – choose EMA or SMA and customize line width/color
⸻
What This Indicator Does
Pulls the 1-Day (1D) moving average of the current symbol, regardless of your chart timeframe.
Lets you choose between EMA (Exponential Moving Average) or SMA (Simple Moving Average).
Plots that daily MA as a smooth overlay on your current chart.
Keeps the line visually clean and continuous, making it easy to see daily trend and dynamic support/resistance.
This is not a signals/strategy script. It doesn’t generate buy/sell arrows or backtest logic. It’s a context tool for visualizing the daily trend while you execute your own strategy.
⸻
Why a Daily MA Overlay Is Useful
Traders commonly use a daily moving average to:
Anchor intraday trades to the higher-timeframe trend
Longs when price is holding above the Daily MA
Shorts or caution when price is rejecting from the Daily MA
Identify dynamic support/resistance
Price often reacts around well-watched daily MAs (e.g., 50, 100, 200)
Filter setups
Only take long setups when price is above the daily trend line
Avoid counter-trend trades when price is extended far from the Daily MA
Because this script forces the MA to always be computed on 1D, you don’t have to switch back and forth between intraday and daily charts to keep track of the bigger picture.
⸻
Inputs & Settings
MA Length
Default: 200
Any positive integer (min 1)
Common examples: 50, 100, 200 for trend structure
MA Type
EMA – reacts faster to recent price (default)
SMA – smoother, slower, more “classic” feel
Line Width
Default: 2
Range: 1 to 10
Increase if you want the Daily MA to stand out clearly against other indicators
Color
Default: Purple tone
Fully customizable – pick any color that works with your chart theme
⸻
How to Use It in Your Workflow
Intraday traders (scalpers/day-traders):
Apply the indicator to your 1m/5m/15m charts.
Use the Daily MA as a trend filter :
Only look for long scalps when price is above the Daily MA.
Be more cautious with longs or consider shorts when price is below it.
Swing traders :
Use it on 1H/4H charts to see where price sits relative to a longer-term daily trend.
Watch for:
Pullbacks to the Daily MA in an uptrend as potential demand zones.
Rejections at the Daily MA in a downtrend as potential supply zones.
Risk management & context :
Avoid chasing extended moves far from the Daily MA.
Mark confluence with other tools (support/resistance, volume profile, etc.) around the Daily MA.
⸻
Notes & Limitations
The moving average itself is calculated from daily candles , then displayed on your current timeframe.
This is a visual aid only . It does not guarantee future performance or provide financial advice.
Always combine this indicator with your own analysis, risk management, and trading plan.
⸻
Disclaimer :
This script is provided for educational and informational purposes only. It is not financial advice and does not constitute a recommendation to buy or sell any financial instrument. Always do your own research and trade at your own risk.

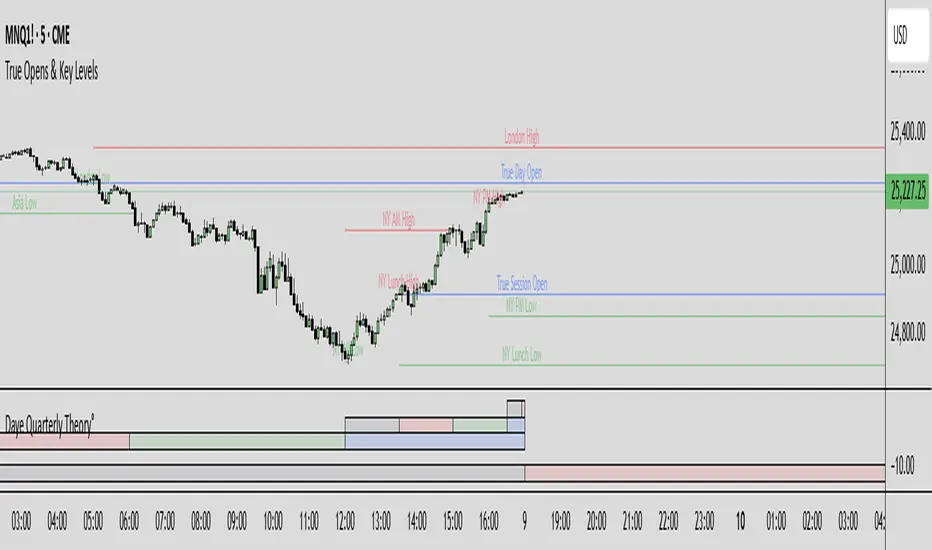
True Opens & Key Levels# True Opens & Key Levels - Standalone Indicator Guide
## Overview
This is a clean, focused indicator that displays only key level rays and true open levels. All impulsive series detection, FVG detection, and Fibonacci projections have been removed for a minimal, uncluttered chart experience.
---
## Features Included
### 📊 Previous Period Levels
- **Previous Day High/Low** - Daily reference points
- **Previous Week High/Low** - Weekly reference points
- **Previous Month High/Low** - Monthly reference points
### 🕐 Session High/Low Levels
- **NY AM Session** (9:30-12:00 ET) - Morning session range
- **NY Lunch Session** (12:00-13:30 ET) - Lunch hour range
- **NY PM Session** (13:30-16:00 ET) - Afternoon session range
- **London Session** (2:00-5:00 ET) - London trading hours
- **Asia Session** (20:00-00:00 ET) - Asian market hours
### 🎯 True Open Levels (NEW)
- **True Day Open** - Updates daily at 00:00 ET
- **True Session Open** - Updates every 6 hours (1:30, 7:30, 13:30, 19:30 ET)
- **True Week Open** - Updates every Monday at 18:00 ET
---
## Settings
### Key Level Rays Group
**Master Toggle:**
- Enable Key Level Rays (master on/off switch)
**Previous Period Levels:**
- Show Previous Day H/L
- Show Previous Week H/L
- Show Previous Month H/L
**Session Levels:**
- Show NY AM H/L (9:30-12:00 ET)
- Show NY Lunch H/L (12:00-13:30 ET)
- Show NY PM H/L (13:30-16:00 ET)
- Show London H/L (2:00-5:00 ET)
- Show Asia H/L (20:00-00:00 ET)
**True Open Levels:**
- Show True Day Open (00:00)
- Show True Session Open (6h intervals)
- Show True Week Open (Mon 18:00)
**Visual Settings:**
- High Level Color (default: red with 50% transparency)
- Low Level Color (default: green with 50% transparency)
- Open Level Color (default: blue with 50% transparency)
- Ray Line Width (1-5 pixels)
- Ray Label Size (tiny/small/normal/large)
---
## How It Works
### Level Behavior
**Session High/Low Levels:**
1. During session: Tracks the highest high and lowest low
2. After session ends: Draws horizontal rays extending right
3. When price hits level: Ray stops extending (hit marker)
4. Label updates position to stay at chart's right edge
**Previous Period Levels:**
1. At period change: Draws rays from previous period's H/L
2. Extends right until price hits the level
3. When hit: Ray stops extending
4. Label positions at midpoint of ray
**True Open Levels:**
1. At trigger time: Draws ray from opening price
2. Extends right until next trigger
3. Previous level is deleted when new one appears
4. Label stays at right edge of chart
---
## Color Scheme
### Three Color Categories:
1. **Red** - All HIGH levels (session highs, previous highs)
2. **Green** - All LOW levels (session lows, previous lows)
3. **Blue** - All OPEN levels (True Day/Session/Week Opens)
This makes it instantly clear what type of level you're looking at.
---
## Best Practices
### For Intraday Trading (1m-1H):
```
Enable:
✓ True Day Open
✓ True Session Open
✓ NY AM/PM H/L
✓ Previous Day H/L
Disable:
✗ Previous Week/Month H/L
✗ London/Asia sessions (unless trading them)
✗ True Week Open
```
### For Swing Trading (1H-4H):
```
Enable:
✓ True Week Open
✓ True Day Open
✓ Previous Week H/L
✓ Previous Day H/L
Disable:
✗ All session H/L
✗ True Session Open
✗ Previous Month H/L
```
### For Clean Charts:
```
Enable:
✓ True Day Open
✓ True Week Open
✓ Previous Day H/L only
Disable:
✗ Everything else
Result: Just 4 levels on chart - super clean!
```
---
## Level Update Schedule
| Level | Update Frequency | Time(s) |
|---------------------|------------------|-----------------------------|
| True Day Open | Daily | 00:00 ET |
| True Session Open | Every 6 hours | 1:30, 7:30, 13:30, 19:30 ET |
| True Week Open | Weekly | Monday 18:00 ET |
| Previous Day H/L | Daily | At day change |
| Previous Week H/L | Weekly | At week change |
| Previous Month H/L | Monthly | At month change |
| NY AM H/L | Daily | After 12:00 ET |
| NY Lunch H/L | Daily | After 13:30 ET |
| NY PM H/L | Daily | After 16:00 ET |
| London H/L | Daily | After 5:00 ET |
| Asia H/L | Daily | After 00:00 ET |
---
## File Size & Performance
- **File Size:** ~22 KB (less than half the size of full indicator)
- **Total Lines:** ~700 lines
- **Max Lines/Labels:** 500 (configurable in declaration)
- **Performance:** Lightweight, minimal CPU usage
- **Memory:** Efficient variable management
---
## Installation
1. Open TradingView
2. Open Pine Editor (Alt+E or bottom toolbar)
3. Click "Create new indicator"
4. Delete default code
5. Copy and paste contents of `TRUE_OPENS_KEY_LEVELS.pine`
6. Click "Save" and name it "True Opens & Key Levels"
7. Click "Add to Chart"
---
## Usage Tips
### 1. Start Minimal
Begin with just 2-3 levels enabled:
- True Day Open
- Previous Day High
- Previous Day Low
Add more as needed.
### 2. Color Customization
Adjust transparency for cleaner look:
- High Level: Red 60-70% transparency
- Low Level: Green 60-70% transparency
- Open Level: Blue 60-70% transparency
### 3. Multi-Timeframe Approach
Lower timeframes (1m-15m): Use True Session Open + NY session H/L
Mid timeframes (15m-1H): Use True Day Open + Previous Day H/L
Higher timeframes (1H-4H): Use True Week Open + Previous Week H/L
### 4. Line Width
For cleaner charts, use Line Width = 1
For emphasis, use Line Width = 2-3
### 5. Label Size
Smaller screens: Use "small" or "tiny"
Larger screens: Use "normal"
Presentations: Use "large"
---
## Advantages of Standalone Version
✅ **Cleaner Charts** - No detection lines or arrows
✅ **Faster Loading** - Less code to process
✅ **Easier Setup** - Fewer settings to configure
✅ **Pure Levels** - Focus only on key price levels
✅ **Less Distraction** - No moving parts during trading
✅ **Perfect for Combining** - Use with other indicators without clutter
---
## Combining with Other Indicators
This lightweight indicator works great alongside:
- RSI / Stochastic (oscillators)
- Moving Averages (trend)
- Volume Profile (structure)
- VWAP (intraday reference)
- Your own custom indicators
The minimal chart footprint leaves room for additional tools.
---
## Time Zones
All times are in **Eastern Time (ET)**. TradingView automatically converts to your local timezone, so you don't need to manually adjust anything.
**Example Conversions:**
- 00:00 ET = 05:00 UTC
- 18:00 ET = 23:00 UTC
- 13:30 ET = 18:30 UTC
---
## Support & Updates
This is a standalone version of the True Opens & Key Levels from the full GOTE Indicator. It contains only the level detection code with all series detection removed.
**Version:** 1.0
**Pine Script Version:** 6
**Last Updated:** November 8, 2025
---
## Quick Reference Card
```
╔══════════════════════════════════════════════════════════╗
║ TRUE OPENS & KEY LEVELS - QUICK REFERENCE ║
╠══════════════════════════════════════════════════════════╣
║ ║
║ 📊 PREVIOUS PERIODS ║
║ • Previous Day/Week/Month High/Low ║
║ • Updates at period change ║
║ ║
║ 🕐 SESSION LEVELS ║
║ • NY AM/Lunch/PM, London, Asia H/L ║
║ • Updates after each session ║
║ ║
║ 🎯 TRUE OPENS ║
║ • True Day: Daily 00:00 ET ║
║ • True Session: 1:30/7:30/13:30/19:30 ET ║
║ • True Week: Monday 18:00 ET ║
║ ║
║ 🎨 COLORS ║
║ • Red = Highs • Green = Lows • Blue = Opens ║
║ ║
╚══════════════════════════════════════════════════════════╝
```
---
**Ready to trade with clean, focused key levels!** 🎯
Value TrailingValue Trailing is a variation of my "Dynamic Trailing" indicator, which had additional features including a band-system that tracks the highs and lows of the past X candles. Value Trailing, on the other hand, uses a default lookback window of 14, and a normal range of 68%, simulating a Fixed Range Volume Profile distribution of the past 14 candles, with bands at the upper and lower 68% range.
This lets the user clearly see the key levels, ignoring potential noise from varying and inconsistent highs and lows, while still allowing the user to trade this alongside basic strategies and concepts such as supply/demand and sideways trends.
This indicator comes with 2 customizable sets of "bands", as well as boxes that identify the range of the last candle that touched one side of the bands.

Seasonality Forecast 4H A seasonality indicator shows recurring patterns in data that occur at the same time each year, such as retail sales peaking during the holidays or demand for ice cream rising in the summer. These indicators are used in fields like business, economics, and finance to identify predictable, time-based fluctuations, allowing for better forecasting and strategic planning, like adjusting inventory or staffing levels. In trading, a seasonality indicator can show historical patterns, like an asset's tendency to rise or fall in a specific month, to provide additional context for decision-making.
Seasonality reasoning basically seasonality works most stably on the daily frame with the input parameter being trading day 254 or calendar day 365, ..
Use seasonal effects such as sell in May, buy Christmas season, or exploit factors such as sell on Friday, ... to track the price movement.
The lower the time frame, the more parameters need to be calculated and the more complicated. I have tried to code the version with 1 hour, 15 minutes and 4 hours time frames
On the statistical language R and Python, Pine script
Tradingview uses the exclusive and unique Pine language. There is a parameter limit, just need to change the number of forecast days or calculate shorter or only calculate the basic end time value, we seasonality still works
but the overall results are easily noisy and related to controlling the number of orders per week/month and risk management.
The 4-hour frame version works well because we exploit the seasonal factor according to the 4-hour trading session as a trading session
Every 4 hours we have an input value that corresponds to the Asian, European, and American trading sessions
4 hours - half a morning Asian session.4 hours - half an afternoon Asian session, 4 hours - half a morning European session, 4 hours - half an afternoon European session, similar to the US and repeat the cycle.
Input Parameter Declaration
Tradingview does not exist declaration form day_of_year = dayofyear(time) Pine Script v5:
Instead of using dayofyear, we manually calculate the number of days in a year from the time components.
// Extract year, month, day, hour
year_now = year(time)
month_now = month(time)
day_now = dayofmonth(time)
hour_now = hour(time)
// Precomputed cumulative days per month (non-leap year)
days_before_month = array.from(0, 31, 59, 90, 120, 151, 181, 212, 243, 273, 304, 334)
// Calculate day-of-year
day_of_year = array.get(days_before_month, month_now - 1) + day_now
Input parameter customization window
Lookback period years default is 10, max - the number of historical bars we have, should only be 5 years, 10 years, 15 years, 20 years, 30 years.
Future project bar default is 180 bars - 1 month. We can adjust arbitrarily 6*24*254 - day/month/year
smoothingLength Smooth the data (1 = no smoothing)
offsetBars Move the forecast line left/right to check the past
How to use
Combine seasonality with Supply Demand, Footprint volume profile to find long-term trends or potential reversal points
day_of_year := day_of_year + ((is_leap and month_now > 2) ? 1 : 0)
// Compute bin index
binIndex = (day_of_year * sessionsPerDay) + math.floor(hour_now / 4)
binIndex := binIndex % binsPerYear // Keep within array bounds
The above is the manual code to replace day of year

Project Pegasus RevenantDescription
Project Pegasus Revenant is a reversal and liquidity-trap detection system combining a configurable fractal reversal engine with the SweepTrigger liquidity finder. It highlights potential structural turning points and stop-hunt scenarios directly on the chart.
What’s unique
Fractal Reversal Engine: Adjustable strictness (1 = loose, 5 = strict) to fit different market conditions.
Signal Filtering: Minimum bar spacing to avoid clustering of false or repeated signals.
SweepTrigger Add-on: Detects liquidity sweeps with wick-based rejection logic, auto-doji detection, and range-strength confirmation.
Dual Signal Output: Circle markers for pure fractal reversals, triangles for sweep-based liquidity traps.
Adaptive Filters: Customizable thresholds for body size, candle range, and sweep strength.
How it works (technical)
Fractals: A reversal fractal is confirmed when the high/low at position n is surrounded by lower/higher highs/lows across a configurable frontier.
Signal confirmation: Once price trades back through the fractal level within a limited number of bars, a potential reversal is triggered.
Bar filter: Signals require a minimum distance in bars to prevent noise.
SweepTrigger logic:
Wick comparison (upper vs lower) determines rejection direction.
Doji and low-body candles are auto-filtered.
Range check ensures the current candle exceeds a configurable multiple of the average range.
Visuals:
Green/Red circles = fractal reversals.
Cyan/Purple triangles = liquidity sweep triggers.
How to use
Watch fractal signals to anticipate structural reversal points.
Combine SweepTrigger signals with liquidity highs/lows for identifying stop hunts and fakeouts.
Use as standalone reversal tool or as confirmation within a broader system (e.g., order blocks, volume profile, or market structure).
Key settings
Reversal Mode: 1–5 (controls strictness of fractals).
SweepTrigger: On/off toggle, lookback window, body-size filter, range strength multiplier.
Visuals: Shapes, sizes, and color-coded signals for clear separation between fractal and sweep triggers.
Notes & limitations
Works on all timeframes.
Signals are reactive (based on confirmed bars), not predictive — no lookahead logic.
Too strict settings may reduce signal frequency; too loose may increase noise.
Disclaimer
For educational and informational purposes only. Not financial advice.
